Table of Contents
- Introduction
- Editor’s Choice
- Air Compressor Market Statistics
- Industrial Air Compressors Market Statistics
- Compressed Air Statistics
- Air Compressor Types Statistics
- Applicant of Air Compressor – Air Conditioners Statistics
- Revenue Generation Through Air Compressors, Gas Compressors, and Blowers Statistics
- General Selection Criteria for Air Compressor Statistics
- Key Compressed Air Compressor Performance Metrics Statistics
- Power Consumption and Savings
- Efficiency and Energy Consumption of Air Compressor Statistics
- Energy Effectiveness, Savings, and Environmental Impact
- Cost-effectiveness of Air Compressor Statistics
- Regulations for Air Compressor Statistics
- Recent Developments
- Conclusion
- FAQs
Introduction
Air Compressor Statistics: Air compressors play a crucial role across industries by converting power into stored energy through pressurized air.
They function by pulling in surrounding air and compressing it using mechanisms such as reciprocating pistons, rotary screws, or centrifugal force.
This compressed air serves various purposes, including powering pneumatic tools, inflating tires, and running machinery.
Important components include the compressor pump, an air tank for storage, and a motor or engine to drive the compressor.
Regular maintenance ensures efficiency and safety, including changing filters, monitoring oil levels (for compressors that use oil lubrication), and inspecting for leaks.
Given the high pressures involved, observing safety protocols through proper training and equipment use is essential to minimize risks effectively.
Editor’s Choice
- In 2023, the global air compressor market revenue was recorded at USD 35.3 billion.
- This growth is projected to continue, reaching USD 53.4 billion in 2032 and USD 55.9 billion in 2033. With stationary compressors contributing USD 31.2 billion and USD 32.6 billion. The portable compressors contributed USD 22.2 billion and USD 23.3 billion, respectively.
- The presence of several key players characterizes the global air compressor market, each holding a significant share of the market. Leading the market is Bauer Group, with an 18% share.
- The Global Air Compressor Market is geographically diverse. The Asia-Pacific (APAC) region leads the market with a substantial 36.1% share.
- Compressed air and atmospheric air share similar compositions, with around 78% nitrogen, 20-21% oxygen, and approximately. 1-2% consisting of water vapor, carbon dioxide, and other trace gases.
- Compressed air systems are significant consumers of energy, accounting for roughly 10% of total industrial electricity usage. This amounts to approximately 8.8 terawatt-hours (TWh) per year and emits around 3,100 kilotons (kt) of CO2 annually.
- Installing a new compressor system and piping resulted in significant benefits. Including energy savings of 292,283 kWh per year, equating to cost savings of $21,980 annually.
Air Compressor Market Statistics
Global Air Compressor Market Size Statistics
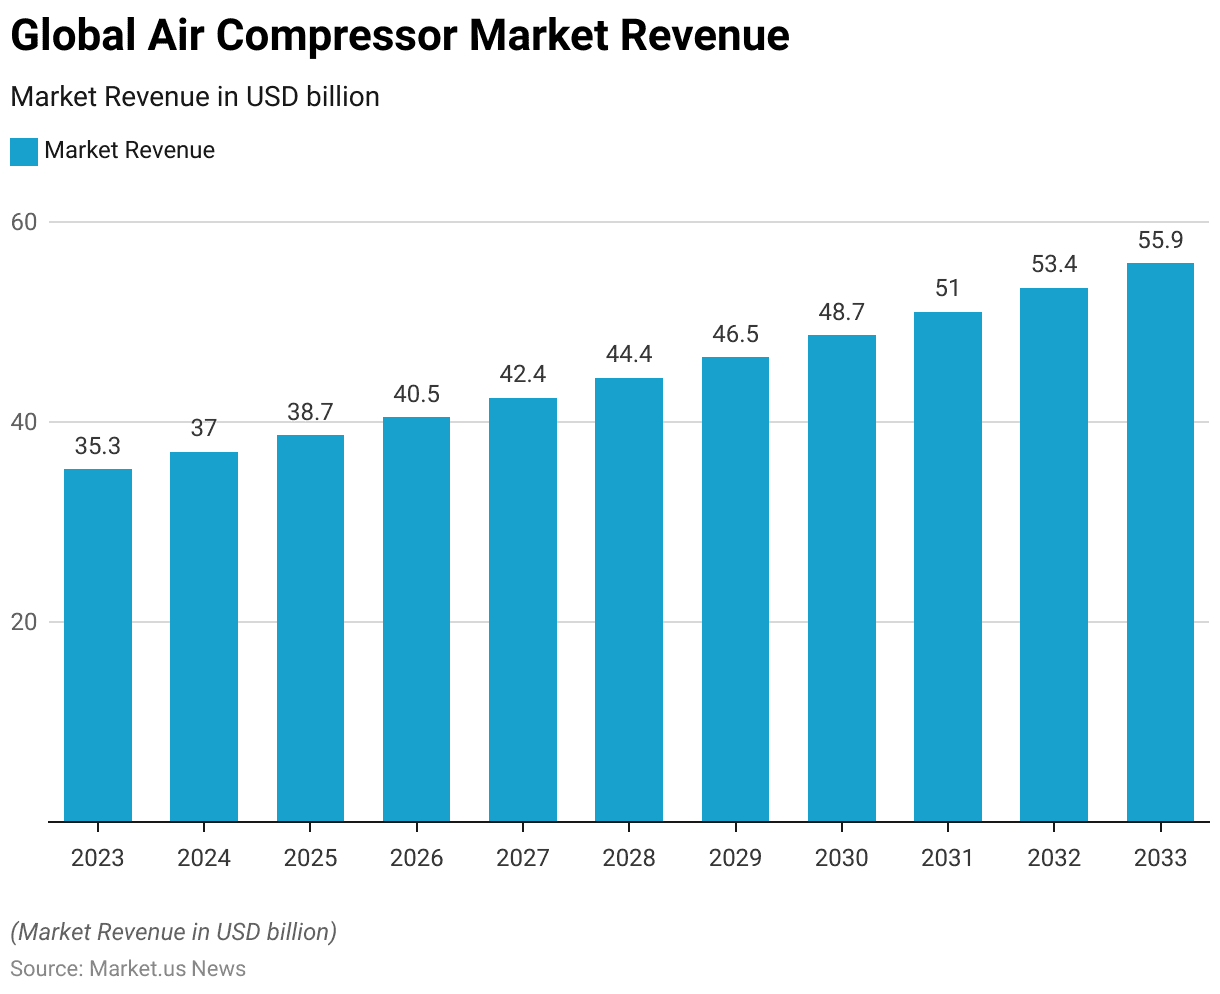
- The global air compressor market has demonstrated a steady upward trajectory in recent years at a CAGR of 4.7%.
- In 2023, the market revenue was recorded at USD 35.3 billion.
- This growth is expected to continue, reaching USD 37.0 billion in 2024 and further rising to USD 38.7 billion in 2025.
- By 2026, the market is anticipated to generate USD 40.5 billion. With a subsequent increase to USD 42.4 billion in 2027.
- The upward trend persists into 2028 and 2029. With market revenues projected at USD 44.4 billion and USD 46.5 billion, respectively.
- The growth is forecasted to accelerate, reaching USD 48.7 billion by 2030 and continuing to USD 51.0 billion in 2031.
- By 2032, the market is expected to achieve USD 53.4 billion. Culminating in an estimated revenue of USD 55.9 billion by 2033.
(Source: market.us)
Global Air Compressor Market Size – By Compressor Type Statistics
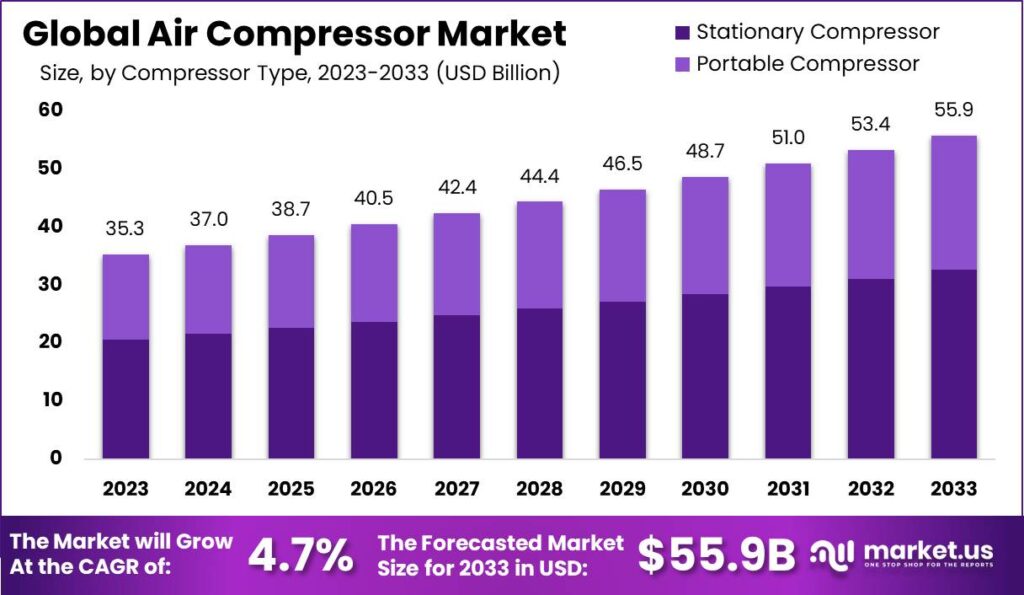
- The global air compressor market is segmented into stationary and portable compressors, each contributing significantly to the total market revenue.
- In 2023, the market’s total revenue was USD 35.3 billion. With stationary compressors accounting for USD 20.6 billion and portable compressors contributing USD 14.7 billion.
- The market is projected to grow, with total revenues reaching USD 37.0 billion in 2024. Where stationary compressors will generate USD 21.6 billion and portable compressors USD 15.4 billion.
- By 2025, the overall market revenue is expected to rise to USD 38.7 billion. With stationary and portable compressors contributing USD 22.6 billion and USD 16.1 billion, respectively.
- This growth trend continues through 2026 and 2027, with total revenues projected at USD 40.5 billion and USD 42.4 billion. Stationary compressors contributed USD 23.7 billion and USD 24.8 billion, respectively. While portable compressors contributed USD 16.8 billion and USD 17.6 billion.
- The market is anticipated to maintain its upward trajectory. With total revenues reaching USD 44.4 billion in 2028, USD 46.5 billion in 2029, and USD 48.7 billion in 2030.
- During these years, stationary compressors will contribute USD 25.9 billion, USD 27.2 billion, and USD 28.4 billion, respectively. The portable compressors will contribute USD 18.5 billion, USD 19.3 billion, and USD 20.3 billion.
- By 2031, the market’s total revenue is expected to reach USD 51.0 billion. With stationary compressors generating USD 29.8 billion and portable compressors USD 21.2 billion.
- This growth is projected to continue, reaching USD 53.4 billion in 2032 and USD 55.9 billion in 2033. With stationary compressors contributing USD 31.2 billion and USD 32.6 billion and portable compressors contributing USD 22.2 billion and USD 23.3 billion, respectively.
(Source: market.us)

Competitive Landscape of the Global Air Compressor Market Statistics
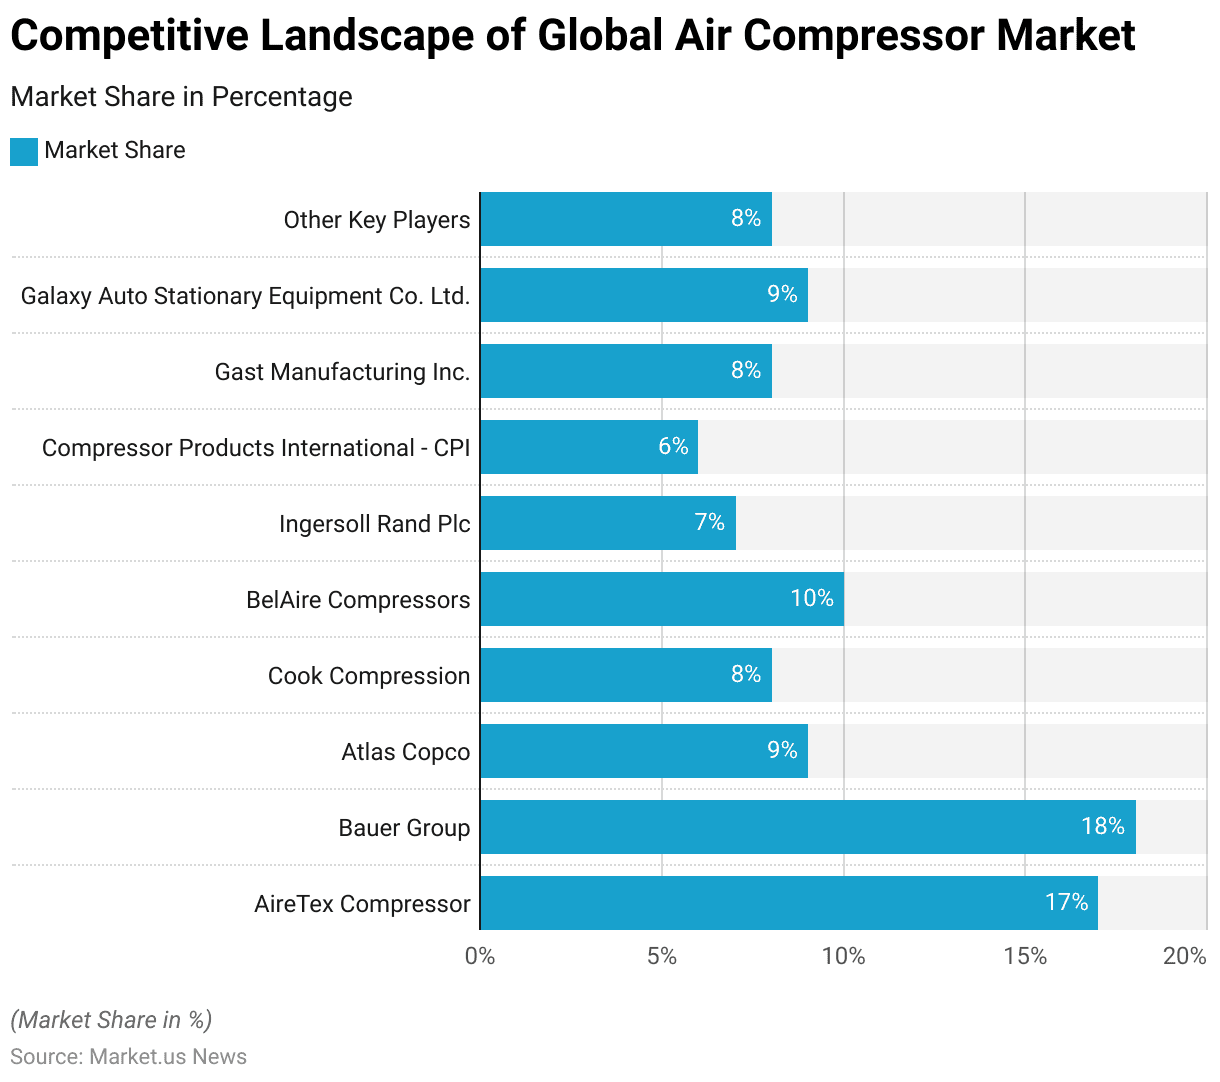
- The presence of several key players characterizes the global air compressor market, each holding a significant share of the market.
- Leading the market is Bauer Group, with an 18% share. Closely followed by AireTex Compressor, which holds 17% of the market.
- Atlas Copco and Galaxy Auto Stationary Equipment Co. Ltd. each capture 9% of the market share.
- BelAire Compressors holds a 10% share, while Cook Compression and Gast Manufacturing Inc. each account for 8% of the market.
- Ingersoll Rand Plc contributes 7% to the market, and Compressor Products International (CPI) holds a 6% share.
- Additionally, other key players collectively represent 8% of the market.
(Source: market.us)
Regional Analysis of the Global Air Compressor Market Statistics
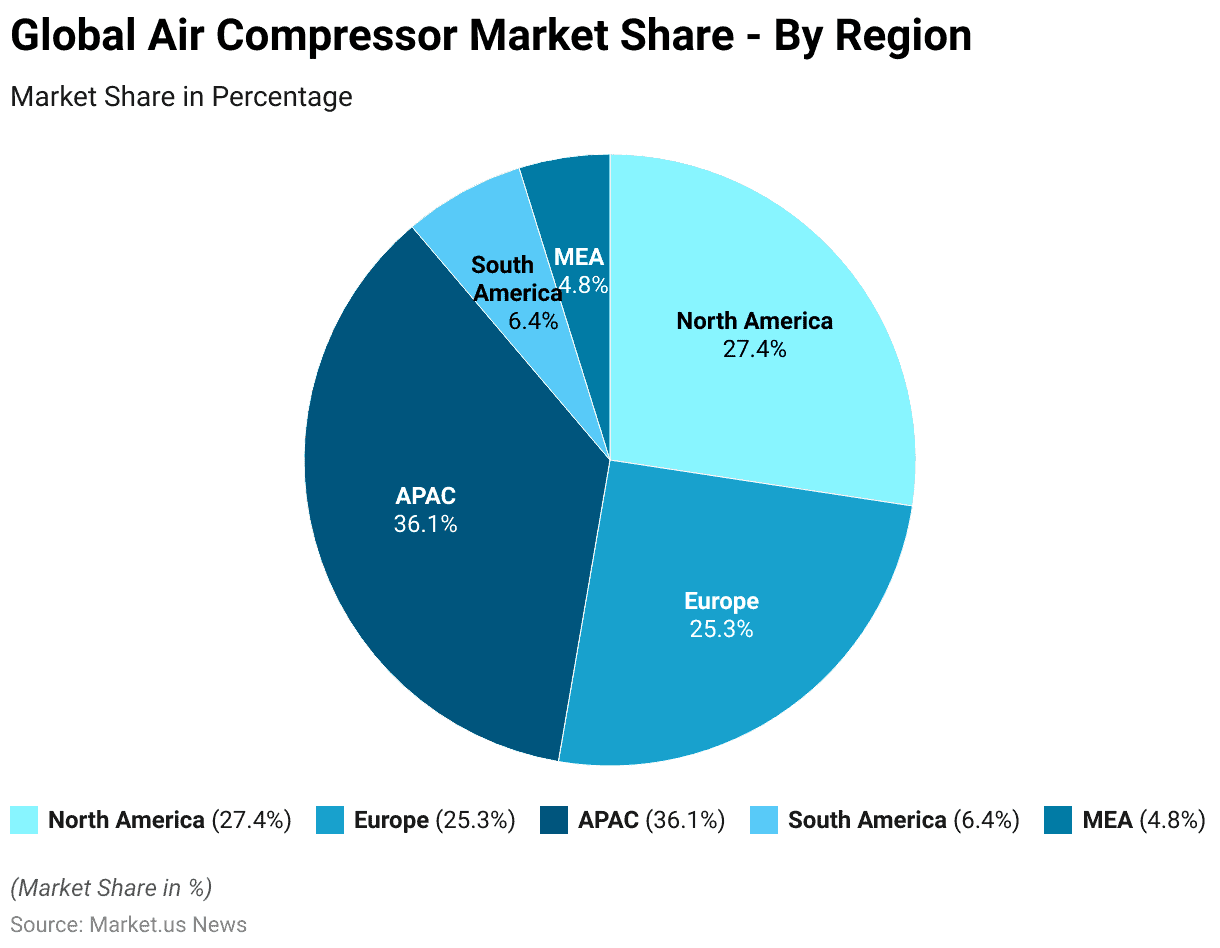
- The Global Air Compressor Market is geographically diverse. The Asia-Pacific (APAC) region leads the market with a substantial 36.1% share.
- North America follows with a 27.4% market share, reflecting its strong industrial base and technological advancements.
- Europe holds a significant portion of the market as well, accounting for 25.3%.
- South America and the Middle East & Africa (MEA) regions contribute smaller shares, with 6.4% and 4.8%, respectively. Indicating emerging opportunities and potential for growth in these areas.
(Source: market.us)
Industrial Air Compressors Market Statistics
Global Industrial Air Compressors Market Size Statistics
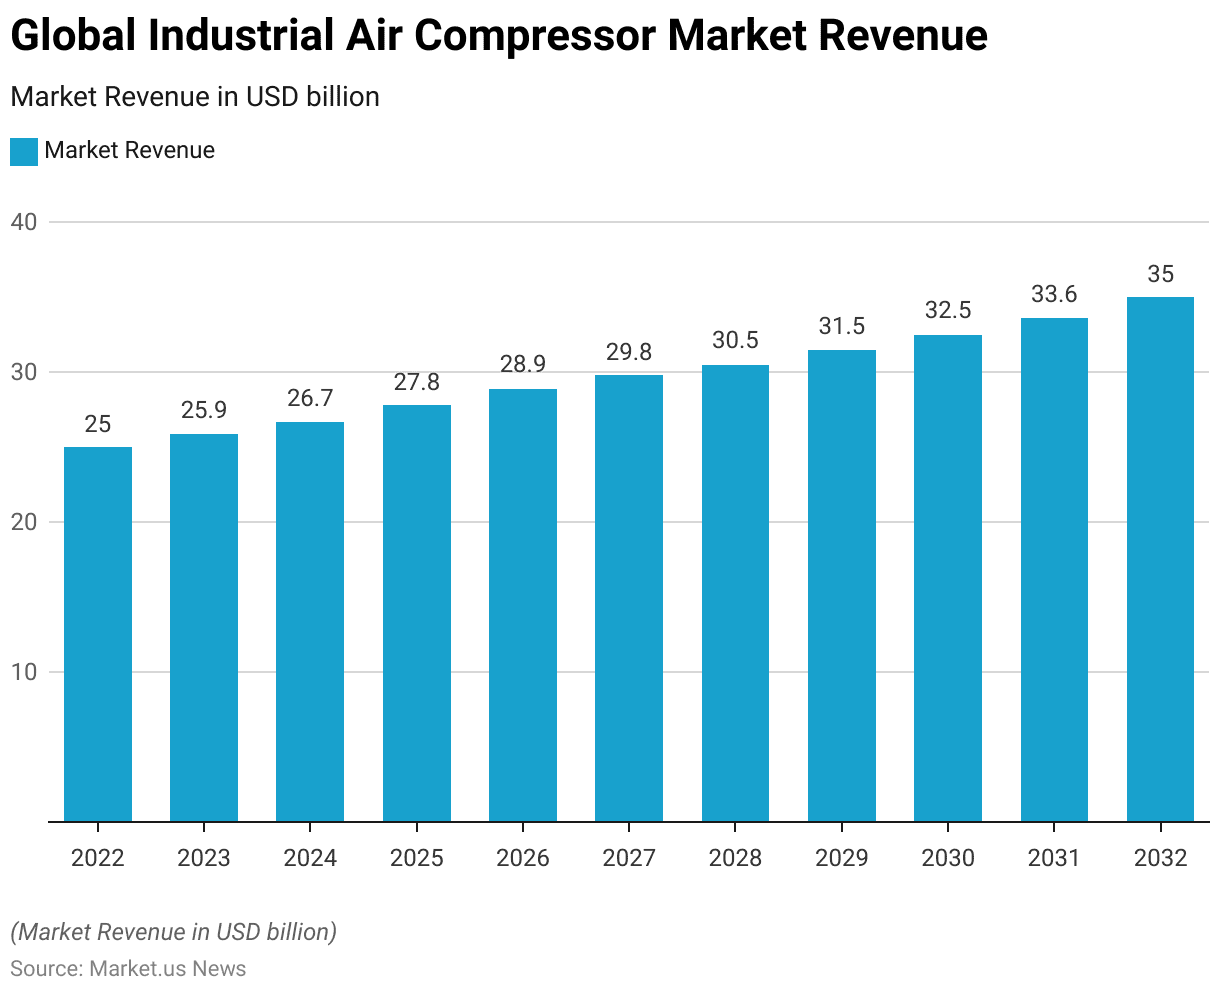
- The Global Industrial Air Compressor Market has shown a steady growth trajectory from 2022 to 2032 at a CAGR of 3.5%.
- In 2022, the market revenue stood at USD 25.0 billion and increased to USD 25.9 billion in 2023.
- This upward trend continued, with the market expected to reach USD 26.7 billion in 2024 and USD 27.8 billion in 2025.
- By 2026, the revenue is projected to rise to USD 28.9 billion, further increasing to USD 29.8 billion in 2027.
- The market is anticipated to continue its growth, reaching USD 30.5 billion in 2028, USD 31.5 billion in 2029, and USD 32.5 billion in 2030.
- The positive trend is expected to persist, with revenues projected at USD 33.6 billion in 2031 and culminating in an estimated USD 35.0 billion by 2032.
(Source: marketresearch.biz)
Compressed Air Statistics
- Compressed air and atmospheric air share similar compositions, with around 78% nitrogen, and 20-21% oxygen. Approximately 1-2% consists of water vapor, carbon dioxide, and other trace gases.
- Compressed air serves a wide range of applications, operating at pressures spanning from 14 PSI up to 6004 PSI (1 to 414 bar) and accommodating flow rates starting from 3.5 CFM (equivalent to 0.1m3) and beyond.
- A standard compressed gas cylinder, typically standing about 4 feet tall and weighing between 75 to 80 pounds when filled. It can reach pressures as high as 2,200 pounds per square inch (psi).
(Source: VMAC, SafetyNow ILT)
Air Compressor Types Statistics
- Air compressors come in various types, each tailored to specific industrial needs based on pressure requirements and efficiency considerations.
- Piston compressors are available in both single-stage and two-stage configurations. Operate in pressure ranges from 4 to 500 bar with power consumption ranging from 0.1 to 30 kW, offering approximately 60% isothermal efficiency. They are suitable for applications where continuous operation is not essential.
- Screw compressors, including oil-free variants, cover pressure ranges of 4 to 18 bar with power consumption from 5 to 500 kW and efficiency ranging around 50% to 60%.
- Turbo compressors, operating at higher pressures of 3 to 8 bar and power consumption from 30 to 1000 kW, achieve higher efficiency at around 80%.
- Scroll compressors, with pressure ranges from 4 to 8 bar and power consumption of 1 to 5 kW, exhibit approximately 50% efficiency, ideal for applications requiring low noise and vibration.
- Axial fans are utilized for lower pressure applications ranging from 0.3 to 1.5 bar, with power consumption varying widely from 10 to 1000 kW and efficiency around 70%.
- Lastly, rotary pistons (Roots) and fans operate in very low pressure ranges from 0.1 to 1 bar. With power consumption from 0.1 to 1000 kW and efficiency ranging from 60% to 80%, depending on the type and application requirements.
- Each compressor type offers distinct advantages in terms of performance, energy efficiency, and suitability for specific industrial applications.
(Source: SAARC Energy)
Applicant of Air Compressor – Air Conditioners Statistics
Demand for Air Conditioners Worldwide
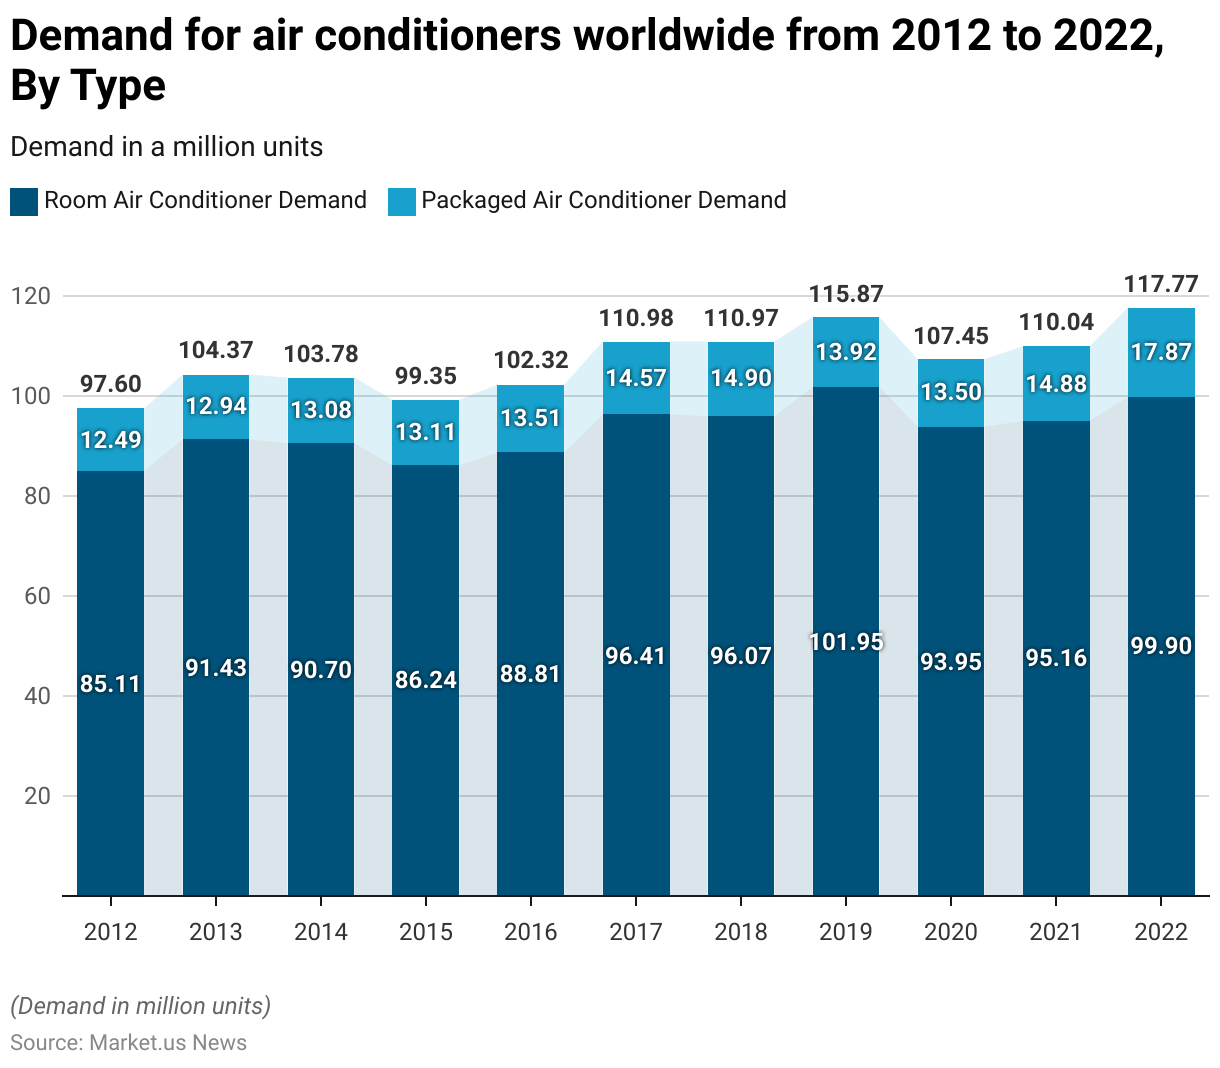
- The demand for air conditioners worldwide has experienced notable fluctuations from 2012 to 2022.
- In 2012, the demand for room air conditioners stood at 85.11 million units. While packaged air conditioners were at 12.49 million units.
- By 2013, the demand for room air conditioners increased to 91.43 million units and packaged units to 12.94 million.
- In 2014, the demand for room air conditioners slightly declined to 90.7 million units. While packaged units saw a marginal rise to 13.08 million.
- The following year, room air conditioner demand further decreased to 86.24 million units, and packaged air conditioners grew to 13.11 million units.
- In 2016, the market saw an uptick, with room air conditioners at 88.81 million units and packaged units at 13.51 million.
- By 2017, demand surged to 96.41 million units for room air conditioners and 14.57 million for packaged air conditioners.
- The upward trend continued in 2018, with 96.07 million units for room air conditioners and 14.9 million for packaged units.
- The year 2019 marked a peak for room air conditioners at 101.95 million units. Although packaged units slightly decreased to 13.92 million.
- However, both types saw a decline in 2020, with room air conditioners dropping to 93.95 million units and packaged air conditioners to 13.5 million units.
- Recovery began in 2021, with room air conditioners at 95.16 million units and packaged units at 14.88 million.
- By 2022, demand for room air conditioners reached 99.9 million units, and packaged air conditioners significantly increased to 17.87 million units.
(Source: Statista)
Demand for Air Conditioners – By Region
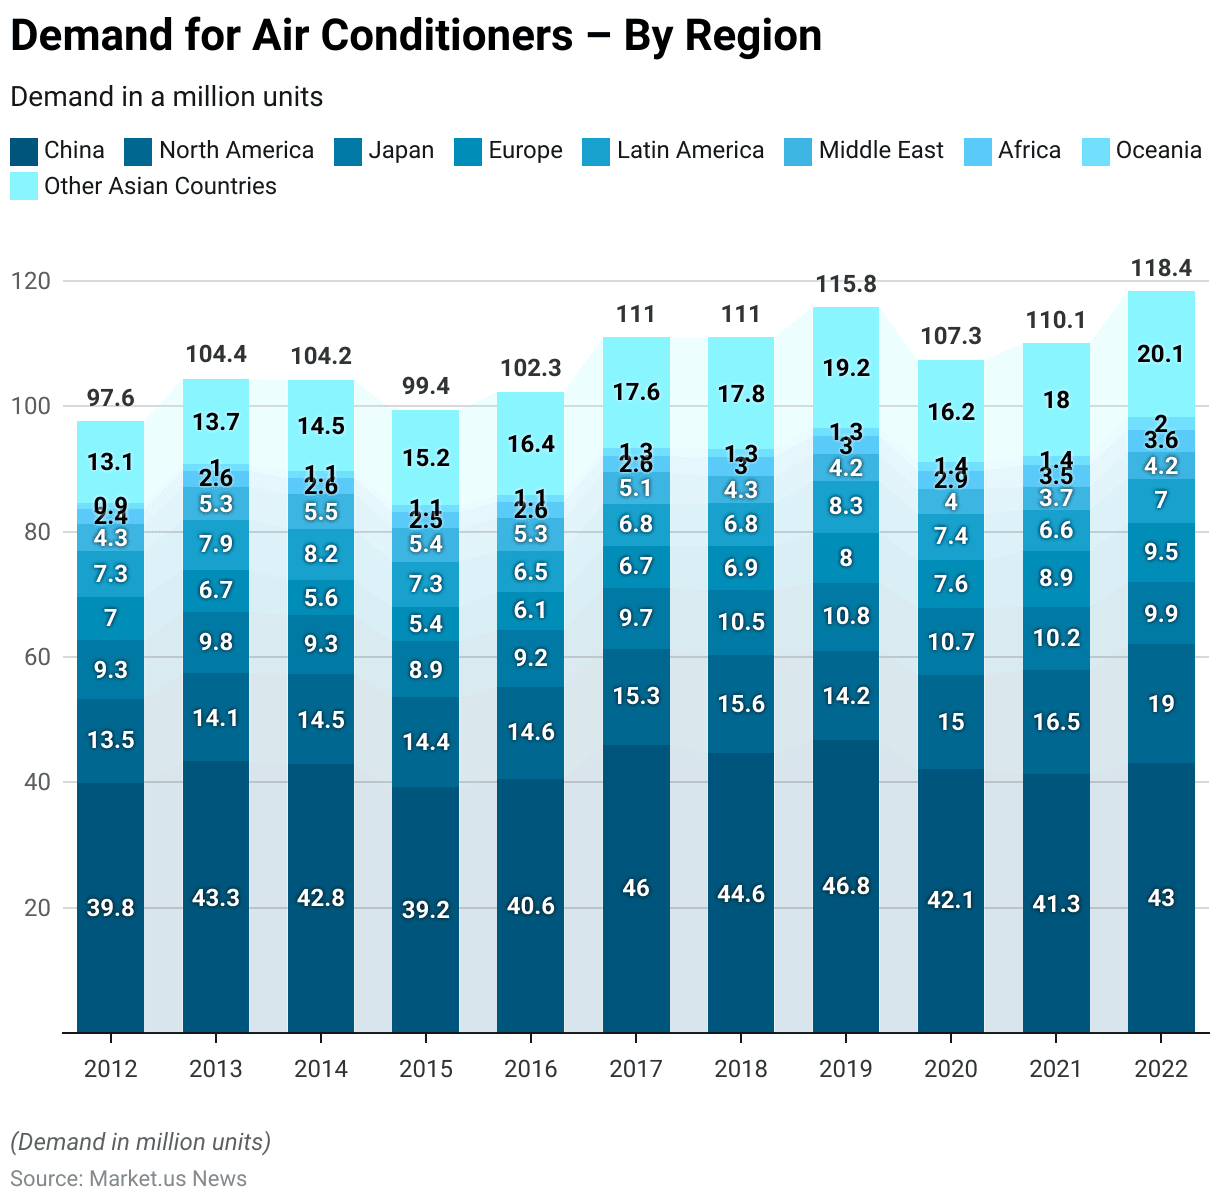
- The global demand for air conditioners has varied across different regions from 2012 to 2022.
- In 2012, China led the market with 39.84 million units, followed by North America with 13.51 million units and Japan with 9.27 million units.
- Europe and Latin America also showed significant demand, with 6.96 million and 7.33 million units, respectively, while the Middle East, Africa, Oceania, and other Asian countries contributed smaller shares.
- By 2013, China’s demand increased to 43.31 million units and North America’s to 14.06 million units, while other regions experienced moderate growth.
- In 2014, China saw a slight decrease to 42.84 million units, but demand in other Asian countries rose to 14.54 million units.
- The year 2015 marked a decline in China’s demand to 39.22 million units, but other Asian countries continued to grow, reaching 15.15 million units.
- In 2016, China’s demand slightly rebounded to 40.59 million units, and other Asian countries saw a significant increase to 16.41 million units.
- By 2017, China’s demand surged to 45.95 million units and North America’s to 15.32 million units, with other regions following suit. The trend continued in 2018, with China at 44.63 million units and other Asian countries at 17.84 million units.
- In 2019, China’s demand peaked at 46.8 million units, while Europe saw an increase to 8 million units. The year 2020 experienced a dip in China’s demand to 42.1 million units, but North America and other Asian countries remained resilient. By 2021, North America’s demand rose to 16.52 million units, and other Asian countries continued to grow.
- In 2022, China’s demand reached 43 million units, North America’s surged to 19.03 million units, and other Asian countries peaked at 20.1 million units, reflecting a robust global market with varied regional growth dynamics.
(Source: Statista)
Revenue Generation Through Air Compressors, Gas Compressors, and Blowers Statistics
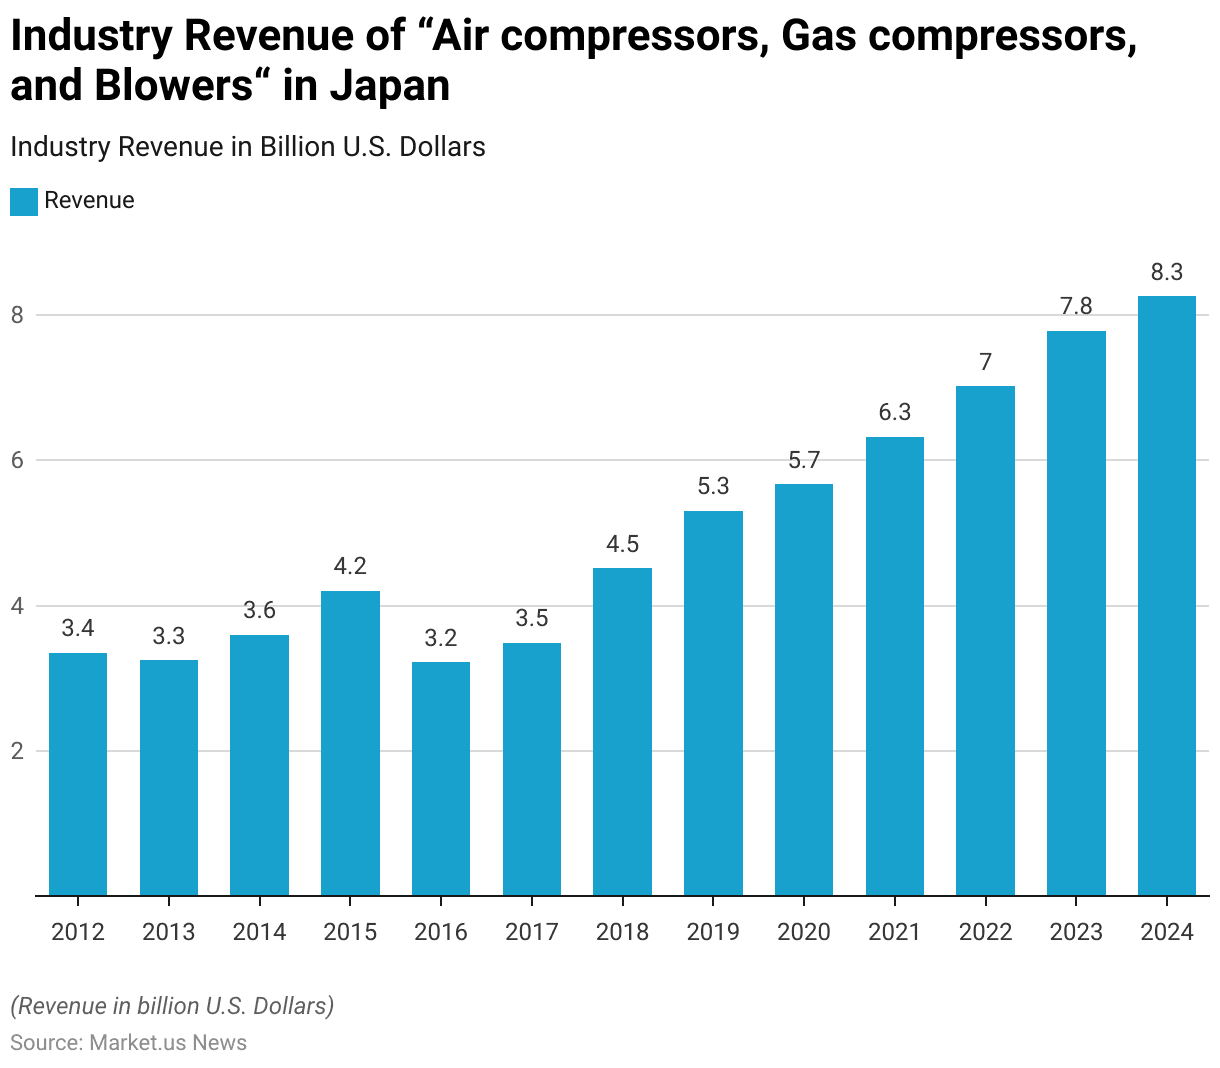
- The industry revenue for “Air Compressors, Gas Compressors, and Blowers” in Japan has experienced significant growth from 2012 to 2024.
- In 2012, the industry generated USD 3.35 billion, which saw a slight decrease to USD 3.25 billion in 2013.
- However, the revenue increased to USD 3.6 billion in 2014 and further to USD 4.2 billion in 2015.
- A decline followed in 2016, with the revenue dropping to USD 3.22 billion.
- The industry began to recover in 2017, with revenues rising to USD 3.49 billion, and saw a substantial increase to USD 4.52 billion in 2018.
- The upward trend continued in 2019, with revenues reaching USD 5.3 billion, followed by USD 5.67 billion in 2020.
- The industry revenue saw a significant surge in 2021, reaching USD 6.32 billion, and continued to grow to USD 7.02 billion in 2022.
- The positive trend is projected to persist, with revenues expected to reach USD 7.78 billion in 2023 and further increase to USD 8.25 billion in 2024.
(Source: Statista)
General Selection Criteria for Air Compressor Statistics
- The selection of air compressors is based on specific criteria, including the type of compressor, capacity, and pressure range.
- Roots blower compressors, particularly single-stage models, have capacities ranging from 100 to 30,000 cubic meters per hour (m³/h) and operate at pressures between 0.1 and 1 bar.
- Reciprocating compressors, available in single or two-stage configurations, offer capacities from 100 to 12,000 m³/h with pressure capabilities from 0.8 to 12 bar.
- For higher pressure requirements, multi-stage reciprocating compressors can handle the same capacity range but operate at pressures from 12 to 700 bar.
- Screw compressors are another option, with single-stage models providing capacities from 100 to 2,400 m³/h and pressures from 0.8 to 13 bar, while two-stage screw compressors offer capacities from 100 to 2,200 m³/h and can reach pressures up to 24 bar.
- Centrifugal compressors are suitable for very high-capacity needs, ranging from 600 to 300,000 m³/h, and can operate at pressures from 0.1 to 450 bar.
- This diverse range of options allows for precise selection based on the specific requirements of capacity and pressure for various applications.
(Source: Bureau of Energy Efficiency – Government of India)
Key Compressed Air Compressor Performance Metrics Statistics
Horsepower
- Horsepower measures the efficiency of a motor in an air compressor relative to specific CFM and PSI requirements. It indicates the operational capacity of the machine and is crucial when making a purchase decision.
- In the realm of air compressors, a common rule of thumb applies. Each horsepower generally translates to generating approximately 4 to 5 cubic feet per minute (cfm) of compressed air at 100 pounds per square inch (psi) pressure.
- For example, a one-horsepower compressor typically delivers around 4 to 5 cfm at 100 psi, while a ten-horsepower model can produce about 40 to 50 cfm under the same conditions.
- However, this guideline becomes less accurate when higher pressures, such as 125 psi, are required, necessitating more horsepower to maintain equivalent output levels.
- Additionally, an intriguing relationship exists: roughly 1 gallon of water is produced for every horsepower generated by a compressor.
- For instance, a 45-horsepower compressor operating at approximately seven cubic meters per minute generates around 23 gallons of water daily, assuming conditions are around 20 degrees Celsius with 50% relative humidity.
- It’s important to note that not all of this water condenses into liquid form. In systems without an air dryer, approximately 1/4 condenses within the aftercooler. 2/4 within the piping system over time as it cools down. While the remaining 1/4 persists as water vapor in the compressed air.
(Source: Air Compressor Guide)
Pressure (PSI)
- When considering purchasing an air compressor, the key specifications to focus on are pressure and capacity. Pressure is commonly measured in units such as bar or PSI (pounds per square inch).
- Many compressors available from hardware stores and dealers typically offer pressure ratings ranging between 125 to 175 psi (8.5 – 12 bar).
- However, the crucial factor that distinguishes compressors is their capacity. The required pressure is determined by the specific tools or equipment you intend to use—for example, a nailer might need 100 psi, while other machinery operates optimally at 125 psi.
- Conversely, the necessary capacity of your air compressor depends on the total air consumption of all your tools and machinery, which can vary based on how many are in use simultaneously.
- Generally, compressed air equipment performs best around 90 – 100 psi (6 – 7 bar). Therefore, many users find that a compressor with a maximum pressure of 7 bar meets their needs adequately.
- However, for applications requiring higher pressures like 15 or 30 bar, specialized compressors are essential to meet these specific requirements.
(Source: Air Compressor Guide)
Duty Cycle
- The duty cycle of an air compressor refers to its operational capability within a specific period.
- A compressor with a 100% duty cycle can operate continuously without needing breaks for cooling. In contrast, standard compressors typically have duty cycles ranging from 50% to 100%.
- This means that after running for a certain percentage of time, usually between 50% and 100%, it’s advisable to turn off the compressor to allow the motor to cool down before using it again. This precaution prevents overheating, ensuring the compressor’s longevity and consistent performance.
- Duty cycles are usually expressed as percentages, indicating the proportion of time the compressor is actively running versus the time it spends idle or off. For instance, a compressor with a 60/40 duty cycle operates for 60% of the time and is off or idle for 40% of the time.
- Understanding the duty cycle is crucial as it indicates how continuously a compressor can be used without risking overheating or excessive wear.
(Source: NiGen International L.L.C, Air Compressor Guide)
Power Consumption and Savings
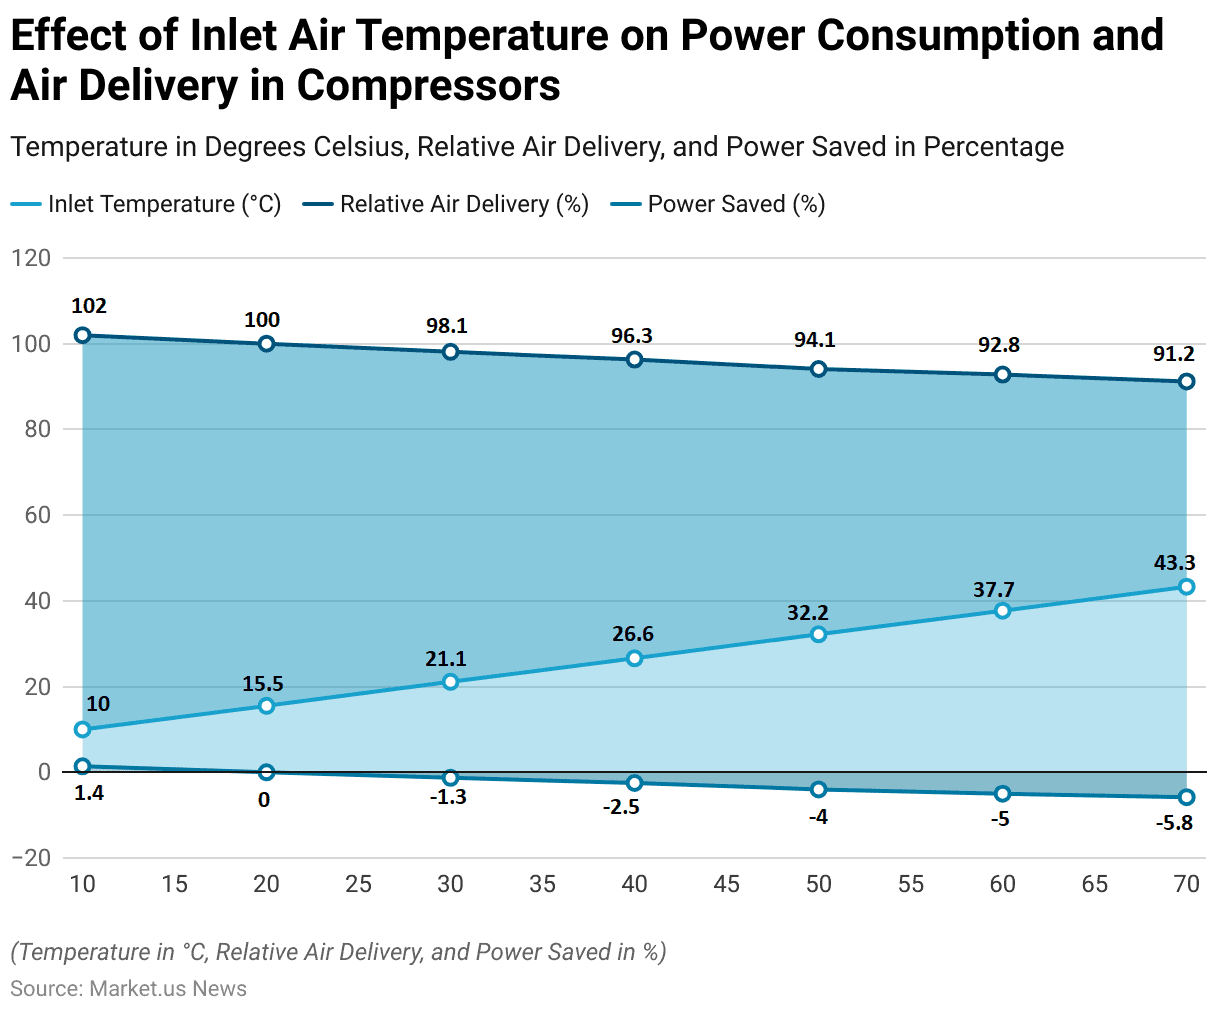
- The effect of inlet air temperature on power consumption and air delivery in compressors is significant.
- At an inlet temperature of 10.0°C, the relative air delivery is 102%, with a power saving of 1.4%.
- As the inlet temperature increases to 15.5°C, the relative air delivery normalizes to 100%, with no power saved.
- Further increases in temperature result in decreased efficiency: at 21.1°C, relative air delivery drops to 98.1%, with a corresponding power loss of 1.3%.
- When the temperature reaches 26.6°C, air delivery decreases to 96.3%, and power consumption increases by 2.5%.
- At 32.2°C, the relative air delivery is 94.1%, with a power loss of 4%.
- Higher temperatures exacerbate this trend, with air delivery falling to 92.8% at 37.7°C and 91.2% at 43.3°C, while power losses increase to 5% and 5.8%, respectively.
- These data underscore the importance of managing inlet air temperatures to optimize compressor efficiency.
(Source: Bureau of Energy Efficiency – Government of India)
Efficiency and Energy Consumption of Air Compressor Statistics
- Compressed air systems are significant consumers of energy, accounting for roughly 10% of total industrial electricity usage, amounting to approximately 8.8 terawatt-hours (TWh) per year and emitting around 3,100 kilotons (kt) of CO2 annually.
- About 15% of these systems utilize multiple compressors, contributing to an energy consumption of about 1.3 TWh and 470 kt of CO2 emissions each year.
- These systems operate continuously for 8,000 hours annually.
- Electricity costs 11.14 pence per kilowatt-hour (kWh), with associated carbon emissions of approximately 0.35156 kilograms of CO2 per kWh. Gas is priced at 2.59 pence per kWh, with negligible carbon emissions.
- For instance, a 90-kilowatt (kW) compressor operating at full load, delivering 14.25 cubic meters per minute (m³/min) for 8,000 hours annually, installing an Energy Technology List (ETL) listed master controller could yield significant annual savings, reducing energy consumption by about 108 megawatt-hours (MWh) and cutting CO2 emissions by approximately 38 metric tonnes annually.
(Source: Department for Business, Energy & Industrial Strategy, Government of U.K)
Energy Effectiveness, Savings, and Environmental Impact
- Compressed air, often seen as an on-site energy source, requires electricity for its generation and can be one of the costliest energy forms in industrial settings.
- The actual generation costs are often unclear, with only 10% to 20% of the energy used reaching its intended use, while the rest dissipates as heat. Overall system efficiency can be as low as 10%-15%.
- Studies by the U.S. Department of Energy indicate that more than half of industrial compressed air systems could achieve significant energy savings through simple, cost-effective upgrades.
- For instance, a chemical company identified and repaired 160 leaks, resulting in savings exceeding $57,000.
- Lowering the system supply pressure gradually helps assess if it exceeds optimal levels. For every two psi decrease in compressor discharge pressure, energy consumption drops by 1%.
- A 10% reduction in pressure can result in a significant 5% energy savings.
- Air compressors convert most of their electrical energy into heat. 50 to 90% of this heat is recoverable for heating air or water using a well-designed heat recovery unit.
- Typically, a 100hp compressor generating 350cfm at full load 75% of the year can save around $4,100 annually in natural gas costs if half of the recovered heat is used to heat process water priced at $0.50 per therm.
- Cooler, denser air reduces the energy required by compressors to achieve necessary pressures. For instance, tempering 90°F intake air with cooler outside air to 70°F can lower operating costs by nearly 3.8% due to the 20°F temperature decrease.
(Source: Department of Environmental Sciences – Government of New Hampshire)
Cost-effectiveness of Air Compressor Statistics
- The realized annual savings for the compressed air system in Dayton, Tennessee, were examined through several recommendations.
- Installing a new compressor system and piping resulted in significant benefits. Including energy savings of 292,283 kWh per year, equating to cost savings of $21,980 annually.
- The project incurred a cost of $27,800 and had a simple payback period of 15 months.
- By eliminating nitrogen as a backup, an annual cost saving of $8,200 was achieved with no associated project cost, rendering an immediate payback.
- Lastly, implementing an annual leak detection and repair program led to energy savings of 120,832 kWh per year, translating to cost savings of $9,100.
- The project cost for this recommendation was $2,500, resulting in a rapid payback period of just three months.
- These measures collectively contributed to substantial energy and cost savings, enhancing the efficiency and sustainability of the compressed air system.
(Source: University of Northern Iowa)
Regulations for Air Compressor Statistics
- Regulations for air compressors vary significantly by country, reflecting each region’s focus on energy efficiency, environmental impact, and safety standards.
- In the United States, the Environmental Protection Agency (EPA) enforces the American Innovation & Manufacturing (AIM) Act, which regulates the use of hydrofluorocarbons (HFCs) in air compressors. Mandating a phasedown of HFC production and consumption to reduce environmental impact.
- The Department of Energy (DOE) has also introduced new efficiency standards for HVAC systems, which impact air compressor operations starting January 1, 2023.
- In California, the California Air Resources Board (CARB) implements stringent regulations. Including a 750 global warming potential (GWP) limit on refrigerants used in air conditioning applications. Which will be applied progressively through 2026.
- In Hong Kong, recent amendments to the Noise Control Ordinance have tightened standards for air compressors. Requiring noise emission labels and specific test conditions to reduce noise pollution.
- Europe, driven by strict environmental regulations and climate change concerns, emphasizes energy-efficient solutions. With the European Union’s directives pushing for higher efficiency standards in industrial equipment, including air compressors.
- These regulations collectively aim to enhance energy efficiency, reduce greenhouse gas emissions, and ensure safe operation. Thereby supporting the global transition to more sustainable industrial practices.
(Sources: Copeland, Dimsum Daily, Noise Control (Air Compressors) Regulations – Government of Hong Kong, Lennox)
Recent Developments
Acquisitions:
- Atlas Copco’s Acquisition of Shandong Bozhong Vacuum Technology: In April 2023, Atlas Copco acquired Shandong Bozhong Vacuum Technology. A specialist in compressed air systems, to expand its product offerings and market presence in Asia.
- ELGi Equipments’ Expansion in North America: ELGi Equipments USA rebranded its portable air compressor line, previously known as Rotair, to ELGi in December 2022. This strategic move aims to strengthen its position and credibility in the North American market.
New Product Launches:
- Sullair’s E1035H Air Compressor: In March 2023, Sullair unveiled the E1035H, a next-generation air compressor designed to align with Hitachi’s long-term environmental goals. This product emphasizes durability, reliability, and environmental performance.
- FS Elliot’s P400HPR Centrifugal Air Compressor: In August 2023, FS Elliot introduced the P400HPR, ensuring energy efficiency and reliability for high-pressure applications.
Funding:
- Investments in Energy-Efficient Technologies: Companies like Ingersoll Rand and Atlas Copco are investing heavily in the development of eco-friendly and low-maintenance systems. These investments focus on enhancing energy efficiency and reducing operational costs, which are critical for attracting end-users.
Market Growth:
- Global Market Expansion: The growth is driven by increasing industrial applications and the adoption of energy-efficient technologies.
- Regional Insights: Asia Pacific leads the market, accounting for the highest revenue share in 2023. Primarily due to rapid industrialization and infrastructure development in countries like China and India. North America and Europe are also significant markets, with a strong emphasis on energy efficiency and technological advancements.
Innovation and Trends:
- Eco-Friendly and Low-Maintenance Systems: Companies are developing next-generation air compressors that focus on reducing environmental impact and maintenance costs. These innovations include integrating IIoT (Industrial Internet of Things) for real-time monitoring and improved performance.
- Advancements in Rotary/Screw Compressors: Rotary/screw compressors continue to dominate the market due to their low noise output, high energy efficiency, and ease of maintenance. These compressors are increasingly being adopted across various industrial applications.
Conclusion
Air Compressor Statistics – In conclusion, the air compressor market continues to show robust growth driven by increasing industrialization and demand across various sectors such as manufacturing, automotive, construction, and healthcare.
The market is characterized by technological advancements in energy efficiency, reliability, and IoT integration. Enhancing operational efficiency and reducing maintenance costs for end-users.
Emerging economies are witnessing significant investments in infrastructure, further boosting demand. However, challenges such as fluctuating raw material prices and environmental regulations necessitate ongoing innovation and adaptation.
Overall, the air compressor market is poised for steady growth, supported by expanding industrial activities globally.
FAQs
An air compressor is a mechanical device that converts power into compressed air. Which is stored in tanks for various industrial and commercial applications.
Common types include reciprocating (piston) compressors, rotary screw compressors, rotary vane compressors, and centrifugal compressors. Each is suited for different applications based on capacity and pressure requirements.
Air compressors are used in manufacturing, automotive, construction, healthcare (medical air compressors), and aerospace for powering pneumatic tools, equipment operation, spray painting, and air conditioning systems.
Factors include required air pressure (PSI), air flow rate (CFM), power source (electric, diesel, gasoline), compressor type, portability, and maintenance requirements.
Advancements in technology, such as variable speed drives (VSD) and energy-efficient motors, help reduce energy consumption and operational costs by adjusting output to match demand.


