Table of Contents
- Introduction
- Editor’s Choice
- Air Compressor Market Overview
- Global Industrial Air Compressors Market Overview
- Air Compressor Types
- Applicant of Air Compressor – Air Conditioners
- Revenue Generation Through Air Compressors, Gas Compressors and Blowers
- Key Compressed Air Performance Metrics
- Power Consumption and Savings
- Efficiency and Energy Consumption of Air Compressors
- Cost-effectiveness of Air Compressors
- Regulations for Air Compressors
Introduction
According to Air Compressor Statistics, Air compressors play a crucial role across industries by converting power into stored energy through pressurized air.
They function by pulling in surrounding air and compressing it using mechanisms such as reciprocating pistons, rotary screws, or centrifugal force.
This compressed air serves various purposes, including powering pneumatic tools, inflating tires, and running machinery.
Important components include the compressor pump, an air tank for storage, and a motor or engine to drive the compressor.
Regular maintenance ensures efficiency and safety, including changing filters. Monitoring oil levels (for compressors that use oil lubrication), and inspecting for leaks.
Given the high pressures involved, observing safety protocols through proper training and equipment use is essential to minimize risks effectively.
Editor’s Choice
- In 2023 the global air compressor market revenue was recorded at USD 35.3 billion.
- This growth is projected to continue, reaching USD 53.4 billion in 2032 and USD 55.9 billion in 2033. With stationary compressors contributing USD 31.2 billion and USD 32.6 billion and portable compressors contributing USD 22.2 billion and USD 23.3 billion, respectively.
- The presence of several key players characterizes the global air compressor market, each holding a significant share of the market. Leading the market is Bauer Group, with an 18% share.
- The Global Air Compressor Market is geographically diverse. The Asia-Pacific (APAC) region leads the market with a substantial 36.1% share.
- Compressed air and atmospheric air share similar compositions, with around 78% nitrogen, and 20-21% oxygen. Approximately 1-2% consists of water vapor, carbon dioxide, and other trace gases.
- Compressed air systems are significant consumers of energy, accounting for roughly 10% of total industrial electricity usage. This amounts to approximately 8.8 terawatt-hours (TWh) per year and emits around 3,100 kilotons (kt) of CO2 annually.
- Installing a new compressor system and piping resulted in significant benefits. Including energy savings of 292,283 kWh per year, equating to cost savings of $21,980 annually.
Air Compressor Market Overview
Global Air Compressor Market Size
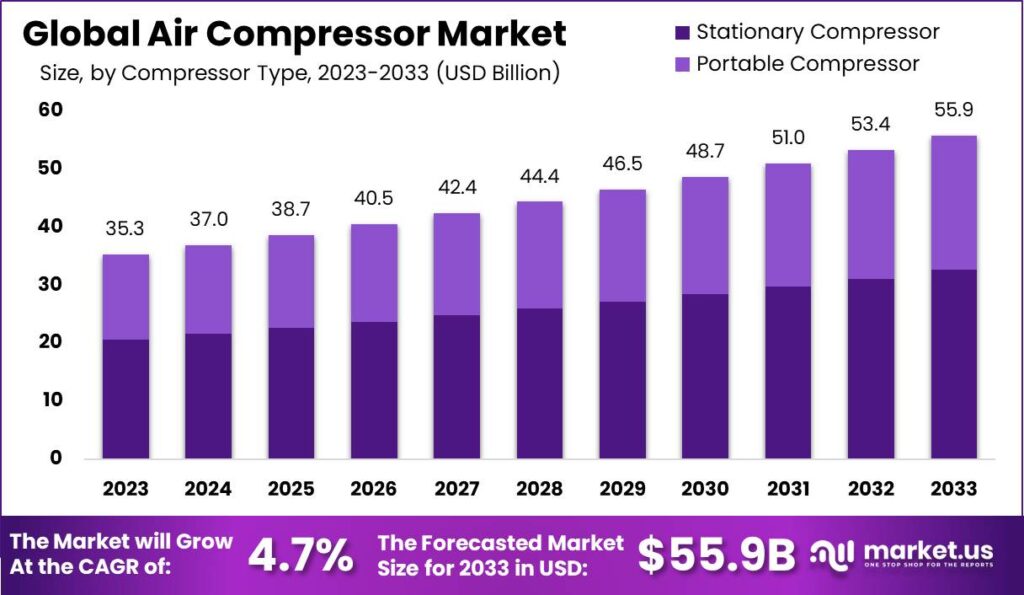
- The global air compressor market has demonstrated a steady upward trajectory in recent years at a CAGR of 4.7%.
- In 2023, the market revenue was recorded at USD 35.3 billion.
- By 2032, the market is expected to achieve USD 53.4 billion. Culminating in an estimated revenue of USD 55.9 billion by 2033.
Global Air Compressor Market Size – By Compressor Type
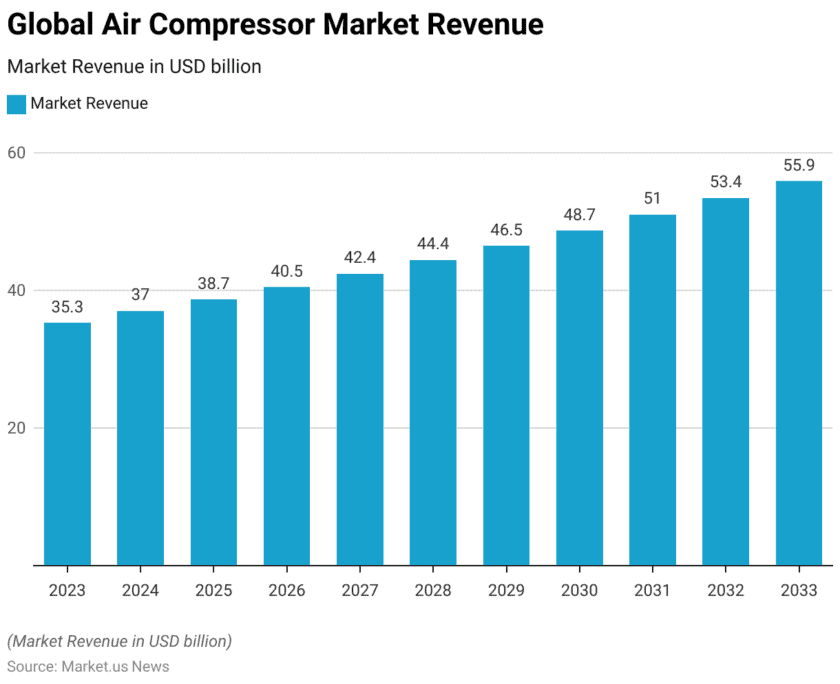
- The global air compressor market is segmented into stationary and portable compressors, each contributing significantly to the total market revenue.
- In 2023, the market’s total revenue was USD 35.3 billion. With stationary compressors accounting for USD 20.6 billion and portable compressors contributing USD 14.7 billion.
- This growth is projected to continue, reaching USD 53.4 billion in 2032 and USD 55.9 billion in 2033. With stationary compressors contributing USD 31.2 billion and USD 32.6 billion and portable compressors contributing USD 22.2 billion and USD 23.3 billion, respectively.

Competitive Landscape of the Global Air Compressor Market
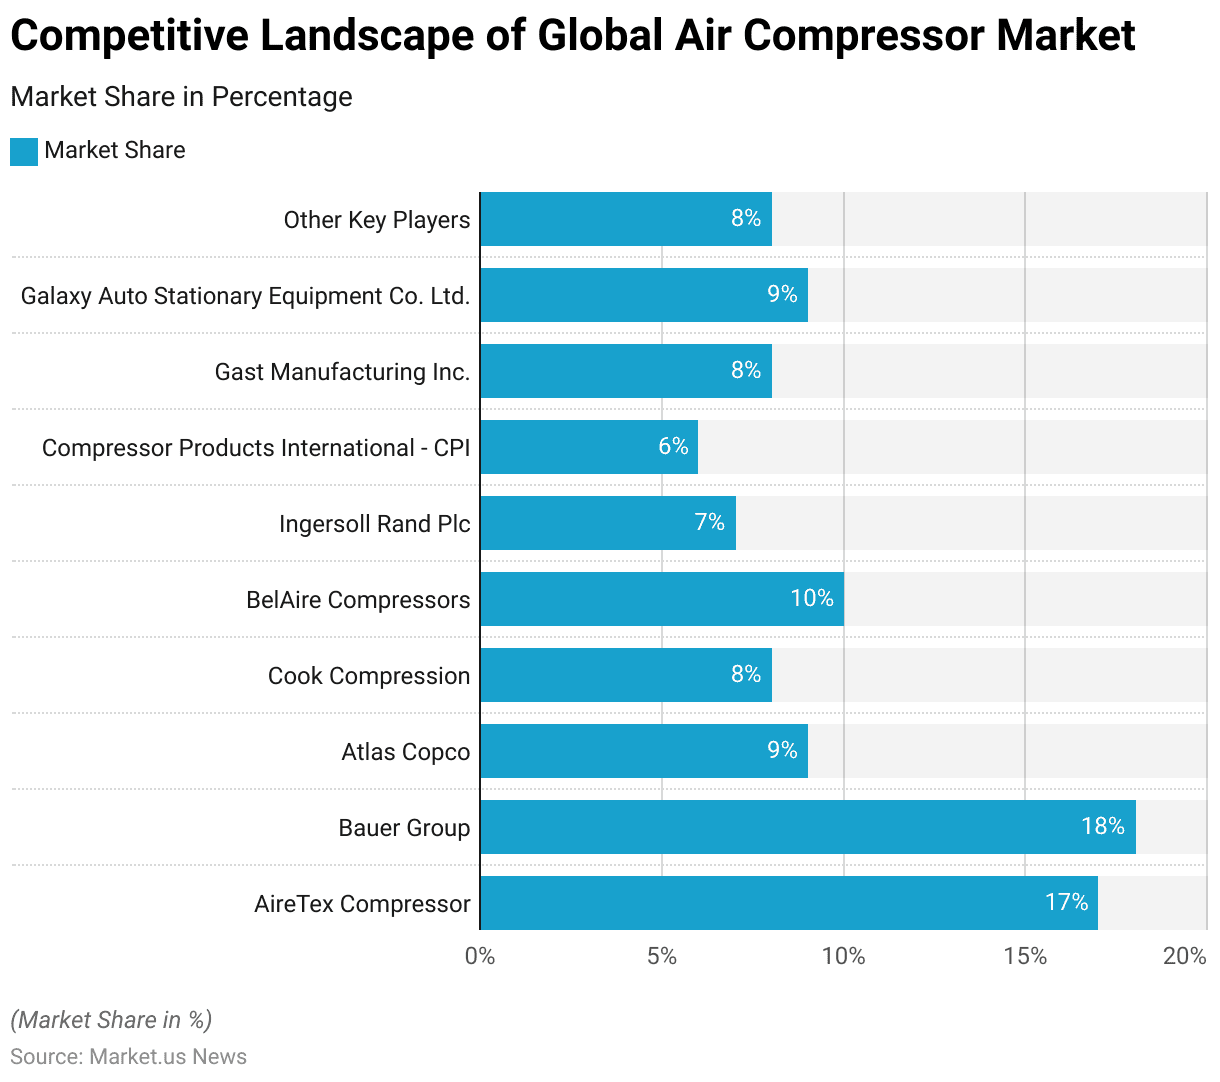
- The presence of several key players characterizes the global air compressor market, each holding a significant share of the market.
- Leading the market is Bauer Group, with an 18% share. Closely followed by AireTex Compressor, which holds 17% of the market.
- Atlas Copco and Galaxy Auto Stationary Equipment Co. Ltd. each capture 9% of the market share.
- BelAire Compressors holds a 10% share, while Cook Compression and Gast Manufacturing Inc. each account for 8% of the market.
- Ingersoll Rand Plc contributes 7% to the market, and Compressor Products International (CPI) holds a 6% share.
- Additionally, other key players collectively represent 8% of the market.
Regional Analysis of the Global Air Compressor Market
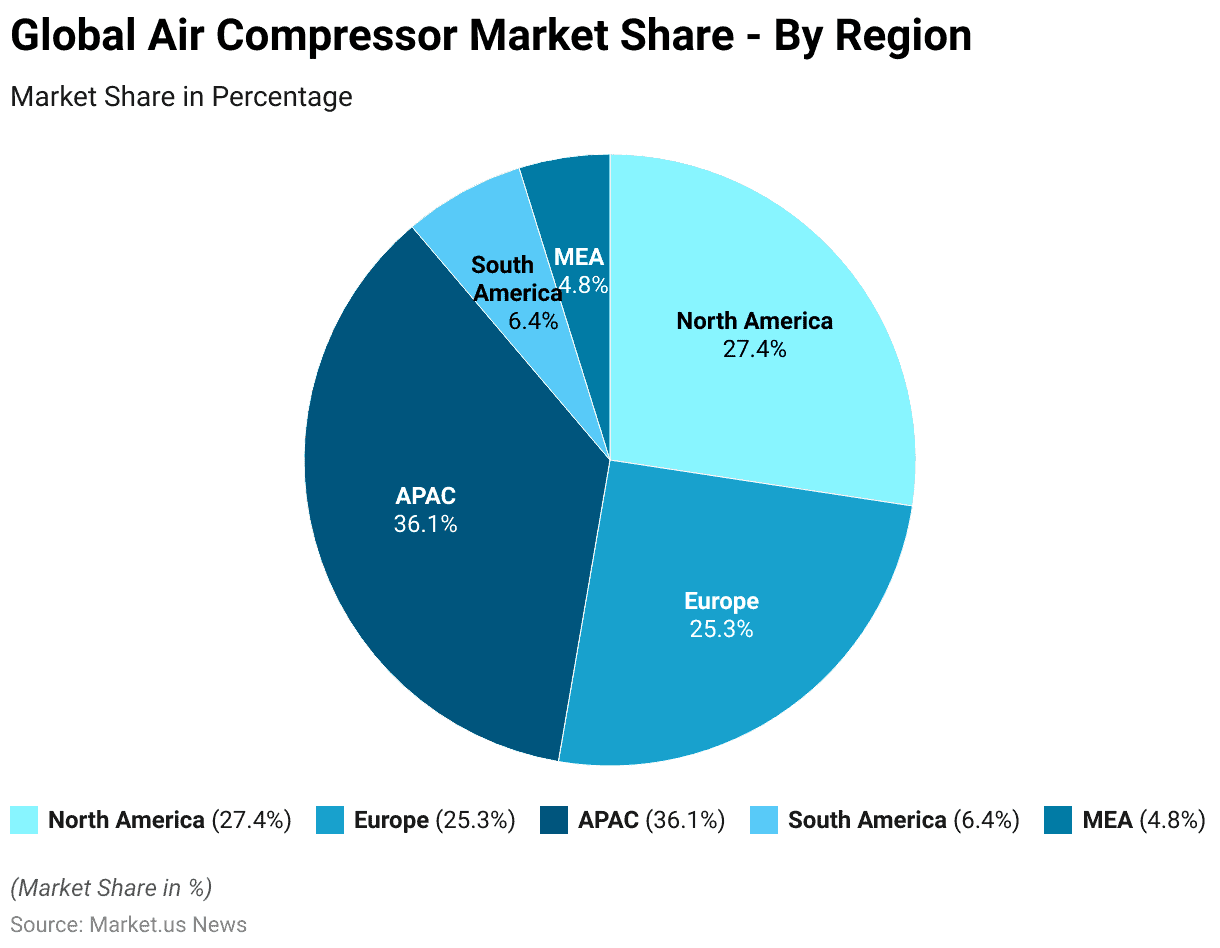
- The Global Air Compressor Market is geographically diverse. The Asia-Pacific (APAC) region leads the market with a substantial 36.1% share.
- North America follows with a 27.4% market share, reflecting its strong industrial base and technological advancements.
- Europe holds a significant portion of the market as well, accounting for 25.3%.
- South America and the Middle East & Africa (MEA) regions contribute smaller shares. With 6.4% and 4.8%, respectively, indicating emerging opportunities and potential for growth in these areas.
Global Industrial Air Compressors Market Overview
Global Industrial Air Compressors Market Size
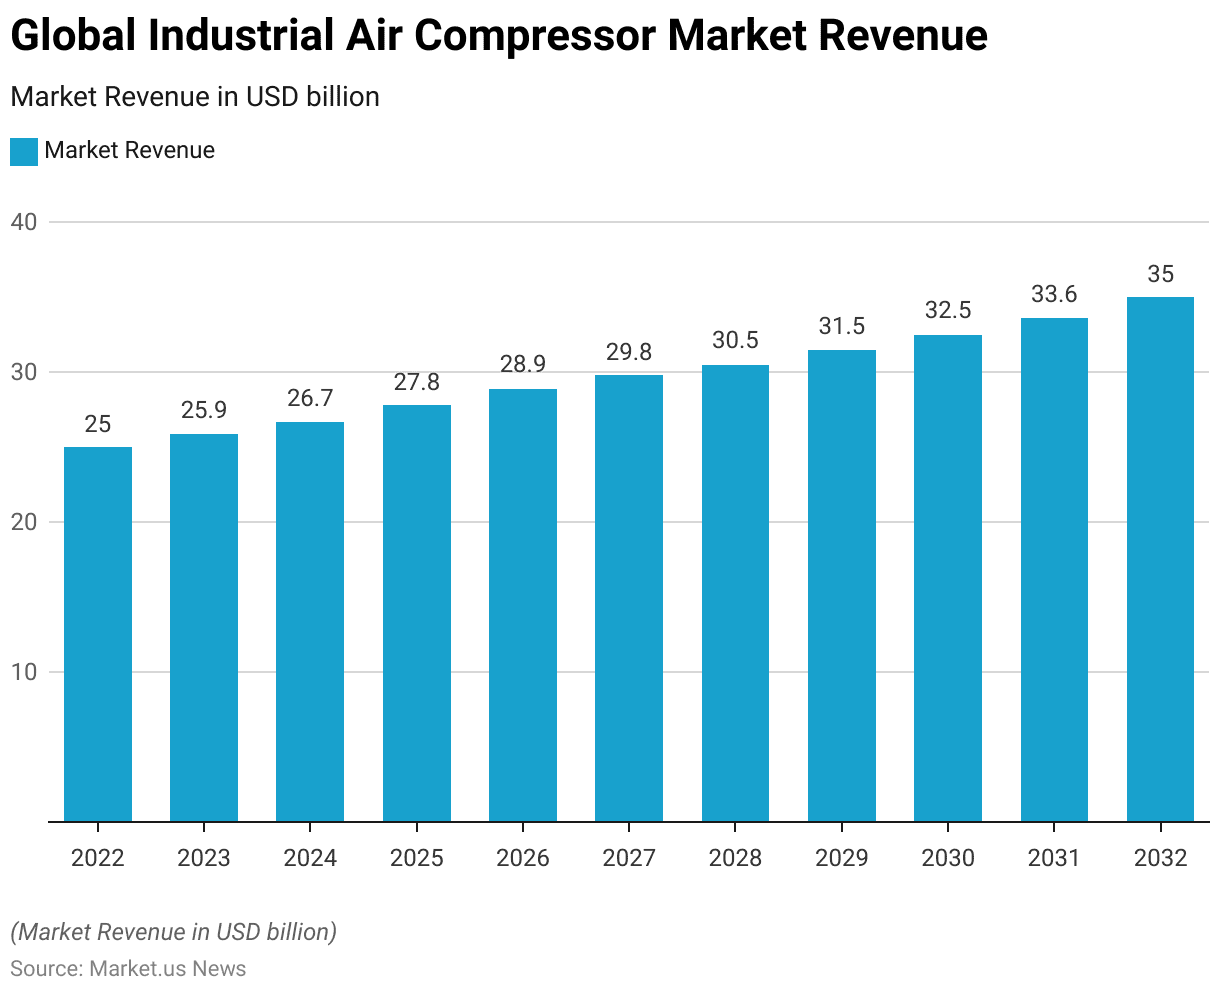
- The Global Industrial Air Compressor Market has shown a steady growth trajectory from 2022 to 2032 at a CAGR of 3.5%.
- In 2022, the market revenue stood at USD 25.0 billion and increased to USD 25.9 billion in 2023.
- The positive trend is expected to persist, with revenues projected at USD 33.6 billion in 2031 and culminating in an estimated USD 35.0 billion by 2032.
Air Compressor Types
- Air compressors come in various types, each tailored to specific industrial needs based on pressure requirements and efficiency considerations.
- Piston compressors are available in both single-stage and two-stage configurations. Operate in pressure ranges from 4 to 500 bar with power consumption ranging from 0.1 to 30 kW. Offering approximately 60% isothermal efficiency. They are suitable for applications where continuous operation is not essential.
- Screw compressors, including oil-free variants, cover pressure ranges of 4 to 18 bar with power consumption from 5 to 500 kW and efficiency ranging around 50% to 60%.
- Turbo compressors, operating at higher pressures of 3 to 8 bar and power consumption from 30 to 1000 kW, achieve higher efficiency at around 80%.
- Scroll compressors, with pressure ranges from 4 to 8 bar and power consumption of 1 to 5 kW. Exhibit approximately 50% efficiency, ideal for applications requiring low noise and vibration.
- Centrifugal compressors are suitable for very high-capacity needs. Ranging from 600 to 300,000 m³/h, and can operate at pressures from 0.1 to 450 bar.
- Axial fans are utilized for lower-pressure applications ranging from 0.3 to 1.5 bar. With power consumption varying widely from 10 to 1000 kW and efficiency around 70%.
- Lastly, rotary pistons (Roots) and fans operate in very low pressure ranges from 0.1 to 1 bar. With power consumption from 0.1 to 1000 kW and efficiency ranging from 60% to 80%. Depending on the type and application requirements.
Applicant of Air Compressor – Air Conditioners
Demand for Air Conditioners Worldwide
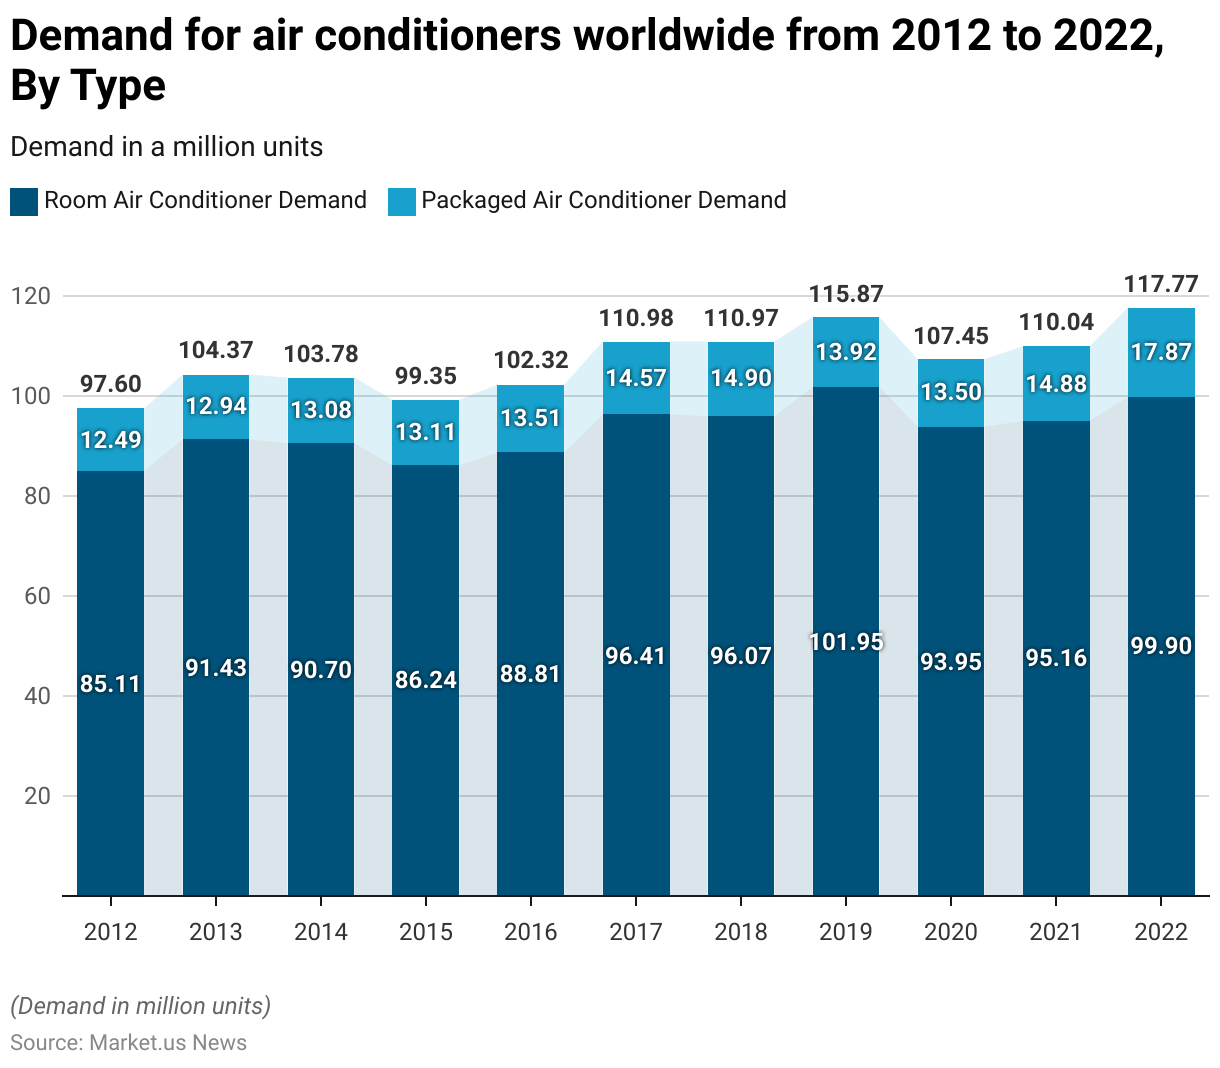
- The demand for air conditioners worldwide has experienced notable fluctuations from 2012 to 2022.
- In 2012, the demand for room air conditioners stood at 85.11 million units. While packaged air conditioners were at 12.49 million units.
- By 2022, demand for room air conditioners reached 99.9 million units, and packaged air conditioners significantly increased to 17.87 million units.
Revenue Generation Through Air Compressors, Gas Compressors and Blowers
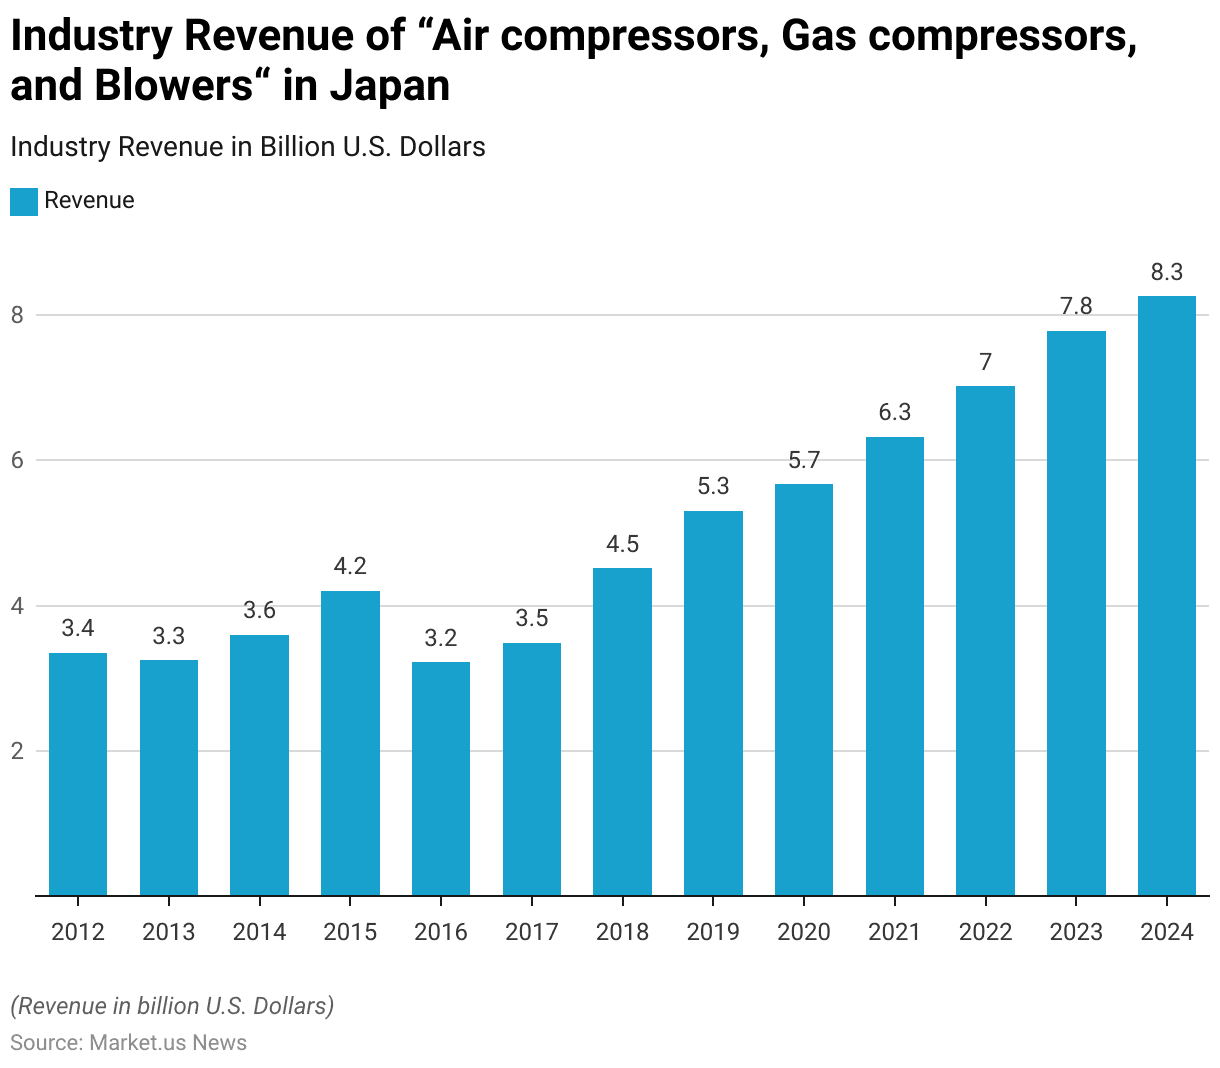
- The industry revenue for “Air Compressors, Gas Compressors, and Blowers” in Japan has experienced significant growth from 2012 to 2024.
- In 2012, the industry generated USD 3.35 billion, which saw a slight decrease to USD 3.25 billion in 2013.
- The industry began to recover in 2017, with revenues rising to USD 3.49 billion, and saw a substantial increase to USD 4.52 billion in 2018.
- The positive trend is projected to persist, with revenues expected to reach USD 7.78 billion in 2023 and further increase to USD 8.25 billion in 2024.
Key Compressed Air Performance Metrics
Horsepower
- Horsepower measures the efficiency of a motor in an air compressor relative to specific CFM and PSI requirements. It indicates the operational capacity of the machine and is crucial when making a purchase decision.
- In the realm of air compressors, a common rule of thumb applies. Each horsepower generally translates to generating approximately 4 to 5 cubic feet per minute (cfm) of compressed air at 100 pounds per square inch (psi) pressure.
- For example, a one-horsepower compressor typically delivers around 4 to 5 cfm at 100 psi. While a ten-horsepower model can produce about 40 to 50 cfm under the same conditions.
- However, this guideline becomes less accurate when at higher pressures. Such as 125 psi, is required, necessitating more horsepower to maintain equivalent output levels.
Pressure (PSI)
- When considering purchasing an air compressor, the key specifications to focus on are pressure and capacity. Pressure is commonly measured in units such as bar or PSI (pounds per square inch).
- Many compressors available from hardware stores and dealers typically offer pressure ratings ranging between 125 to 175 psi (8.5 – 12 bar).
- However, the crucial factor that distinguishes compressors is their capacity. The required pressure is determined by the specific tools or equipment you intend to use—for example. A nailer might need 100 psi, while other machinery operates optimally at 125 psi.
Duty Cycle
- The duty cycle of an air compressor refers to its operational capability within a specific period.
- A compressor with a 100% duty cycle can operate continuously without needing breaks for cooling. In contrast, standard compressors typically have duty cycles ranging from 50% to 100%.
- This means that after running for a certain percentage of time, usually between 50% and 100%. It’s advisable to turn off the compressor to allow the motor to cool down before using it again. This precaution prevents overheating, ensuring the compressor’s longevity and consistent performance.
Power Consumption and Savings
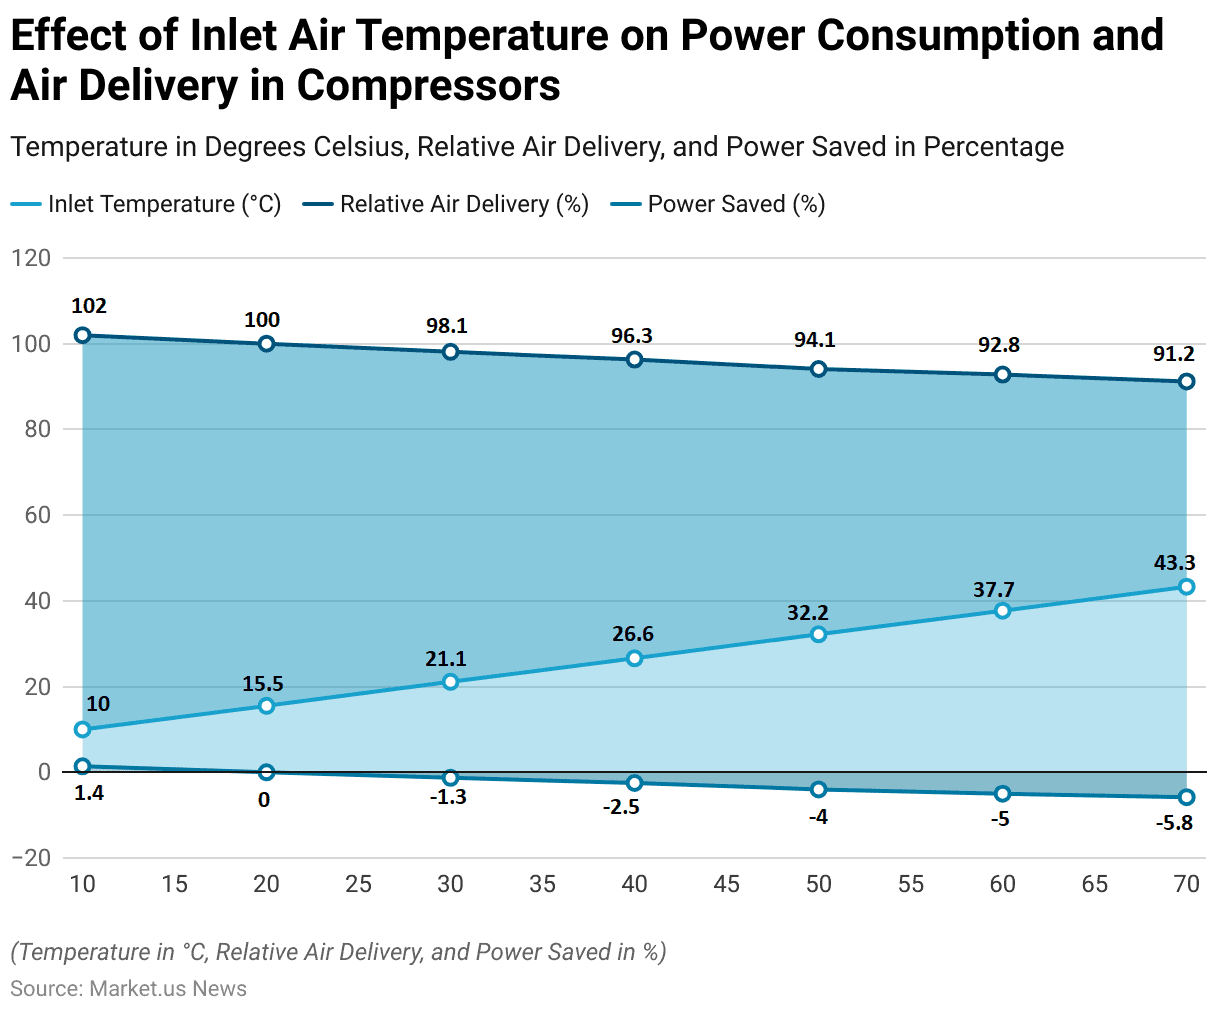
- The effect of inlet air temperature on power consumption and air delivery in compressors is significant.
- At an inlet temperature of 10.0°C, the relative air delivery is 102%, with a power saving of 1.4%.
- As the inlet temperature increases to 15.5°C, the relative air delivery normalizes to 100%, with no power saved.
- Further increases in temperature result in decreased efficiency: at 21.1°C. Relative air delivery drops to 98.1%, with a corresponding power loss of 1.3%.
- When the temperature reaches 26.6°C, air delivery decreases to 96.3%, and power consumption increases by 2.5%.
- At 32.2°C, the relative air delivery is 94.1%, with a power loss of 4%.
- Higher temperatures exacerbate this trend, with air delivery falling to 92.8% at 37.7°C and 91.2% at 43.3°C, while power losses increase to 5% and 5.8%, respectively.
Efficiency and Energy Consumption of Air Compressors
- Compressed air systems are significant consumers of energy, accounting for roughly 10% of total industrial electricity usage. This amounts to approximately 8.8 terawatt-hours (TWh) per year and emits around 3,100 kilotons (kt) of CO2 annually.
- About 15% of these systems utilize multiple compressors. Contributing to an energy consumption of about 1.3 TWh and 470 kt of CO2 emissions each year.
- These systems operate continuously for 8,000 hours annually.
- Electricity costs 11.14 pence per kilowatt-hour (kWh), with associated carbon emissions of approximately 0.35156 kilograms of CO2 per kWh. Gas is priced at 2.59 pence per kWh, with negligible carbon emissions.
Cost-effectiveness of Air Compressors
- The realized annual savings for the compressed air system in Dayton, Tennessee, were examined through several recommendations.
- Installing a new compressor system and piping resulted in significant benefits. Including energy savings of 292,283 kWh per year, equating to cost savings of $21,980 annually.
- The project incurred a cost of $27,800 and had a simple payback period of 15 months.
- By eliminating nitrogen as a backup, an annual cost saving of $8,200 was achieved with no associated project cost, rendering an immediate payback.
- Lastly, implementing an annual leak detection and repair program led to energy savings of 120,832 kWh per year, translating to cost savings of $9,100.
- The project cost for this recommendation was $2,500, resulting in a rapid payback period of just three months.
Regulations for Air Compressors
- Regulations for air compressors vary significantly by country, reflecting each region’s focus on energy efficiency, environmental impact, and safety standards.
- In the United States, the Environmental Protection Agency (EPA) enforces the American Innovation & Manufacturing (AIM) Act. Which regulates the use of hydrofluorocarbons (HFCs) in air compressors, mandating a phasedown of HFC production and consumption to reduce environmental impact.
- The Department of Energy (DOE) has also introduced new efficiency standards for HVAC systems, which impact air compressor operations starting January 1, 2023.
- In California, the California Air Resources Board (CARB) implements stringent regulations. Including a 750 global warming potential (GWP) limit on refrigerants used in air conditioning applications. Which will be applied progressively through 2026.
- In Hong Kong, recent amendments to the Noise Control Ordinance have tightened standards for air compressors. Requiring noise emission labels and specific test conditions to reduce noise pollution.
Discuss your needs with our analyst
Please share your requirements with more details so our analyst can check if they can solve your problem(s)


