Table of Contents
- Introduction
- Editor’s Choice
- Biofuels Market Statistics
- Global Biofuels Production Market Statistics
- Biofuel Production Statistics
- Sources of Biofuels Production Statistics
- Cost of Producing Biofuels Statistics
- Biofuel Consumption Statistics
- Biofuel Demand Statistics
- Biofuels Energy Production Statistics
- Potential Benefits of Biofuels
- Potential Side-effects of Biofuels Statistics
- Regulations, Laws, And Policies for Biofuels
- Recent Developments
- Conclusion
- FAQs
Introduction
Biofuels Statistics: Biofuels are renewable energy sources derived from organic materials like plants and plant-derived materials.
They include ethanol, biodiesel, biogas, and bioethers, and each is produced through various processes such as fermentation, transesterification, or anaerobic digestion.
Biofuels offer benefits such as reduced greenhouse gas emissions, increased energy security, and potential economic development. However, challenges like competition with food crops and concerns about land use change exist.
Advanced biofuels, derived from non-food biomass sources, offer promise for even greater environmental benefits and reduced competition with food production.
Editor’s Choice
- The global biofuels market is expected to reach a remarkable revenue of USD 276 billion by 2032.
- Biofuels Digest leads with an 18% market share, making it the dominant player in the industry.
- The global biofuel market is distributed across several regions. With North America leading the way with a substantial market share of 41.8%.
- In 2022, the United States led global biofuel production. Which produced 1,626.6 petajoules of biofuels, making it the top producer worldwide.
- Global biofuel consumption is projected to reach 213.7 billion liters by 2030.
- Regarding biofuel energy production, the United States leads globally with an impressive output of 451.83 terawatt-hours (TWh) per year.
- Ethanol from corn and cereals can reduce CO2 emissions by 15%-25% compared to gasoline.
- For 2023-2025, the U.S. Environmental Protection Agency (EPA) has established targets for various biofuels, including cellulosic biofuel and biomass-based diesel.
Biofuels Market Statistics
Global Biofuels Market Size Statistics
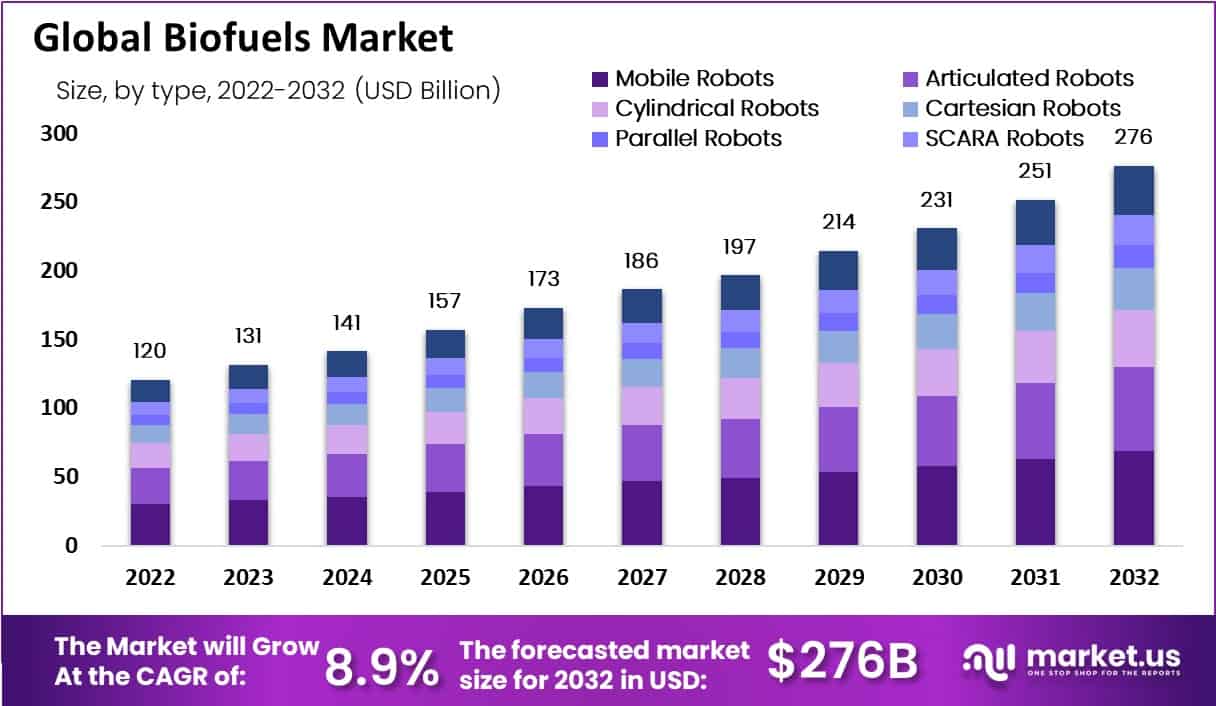
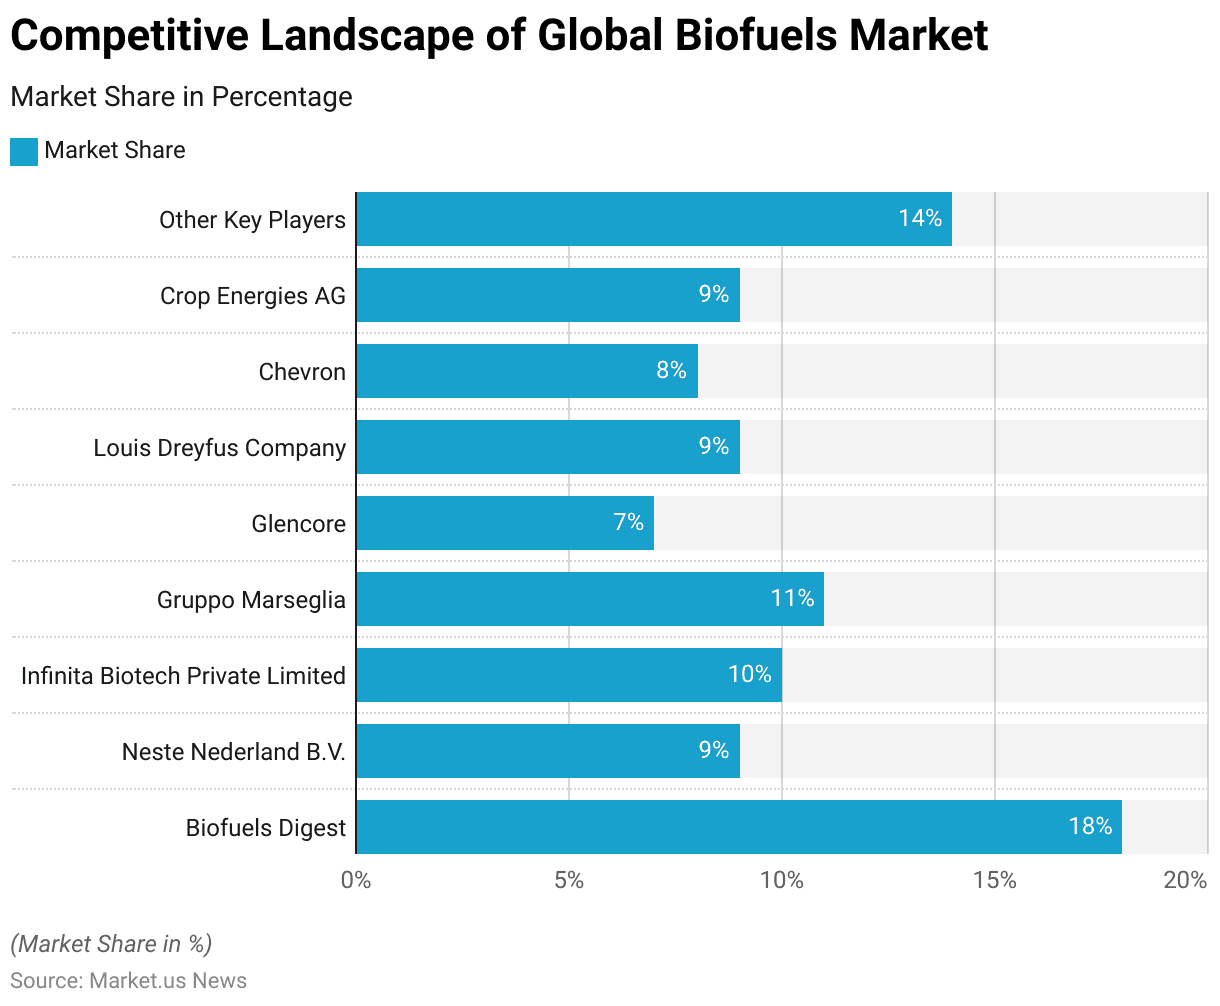
- The global biofuels market has shown consistent growth from 2022 to 2032 at a CAGR of 8.90%, with significant increases in revenue each year.
- In 2022, the market revenue was recorded at USD 120 billion.
- This figure rose to USD 131 billion in 2023 and further to USD 141 billion in 2024.
- The upward trend continued, with revenues reaching USD 157 billion in 2025 and USD 173 billion in 2026.
- By 2027, the market had expanded to USD 186 billion, and in 2028, it climbed to USD 197 billion.
- The growth trajectory maintained its momentum, with 2029 witnessing a revenue of USD 214 billion.
- The market achieved a substantial leap to USD 231 billion in 2030. Followed by an impressive increase to USD 251 billion in 2031.
- By 2032, the global biofuels market reached a remarkable revenue of USD 276 billion. Underscoring the sector’s robust expansion over the decade.
(Source: market.us)
Competitive Landscape of Global Biofuels Market Statistics
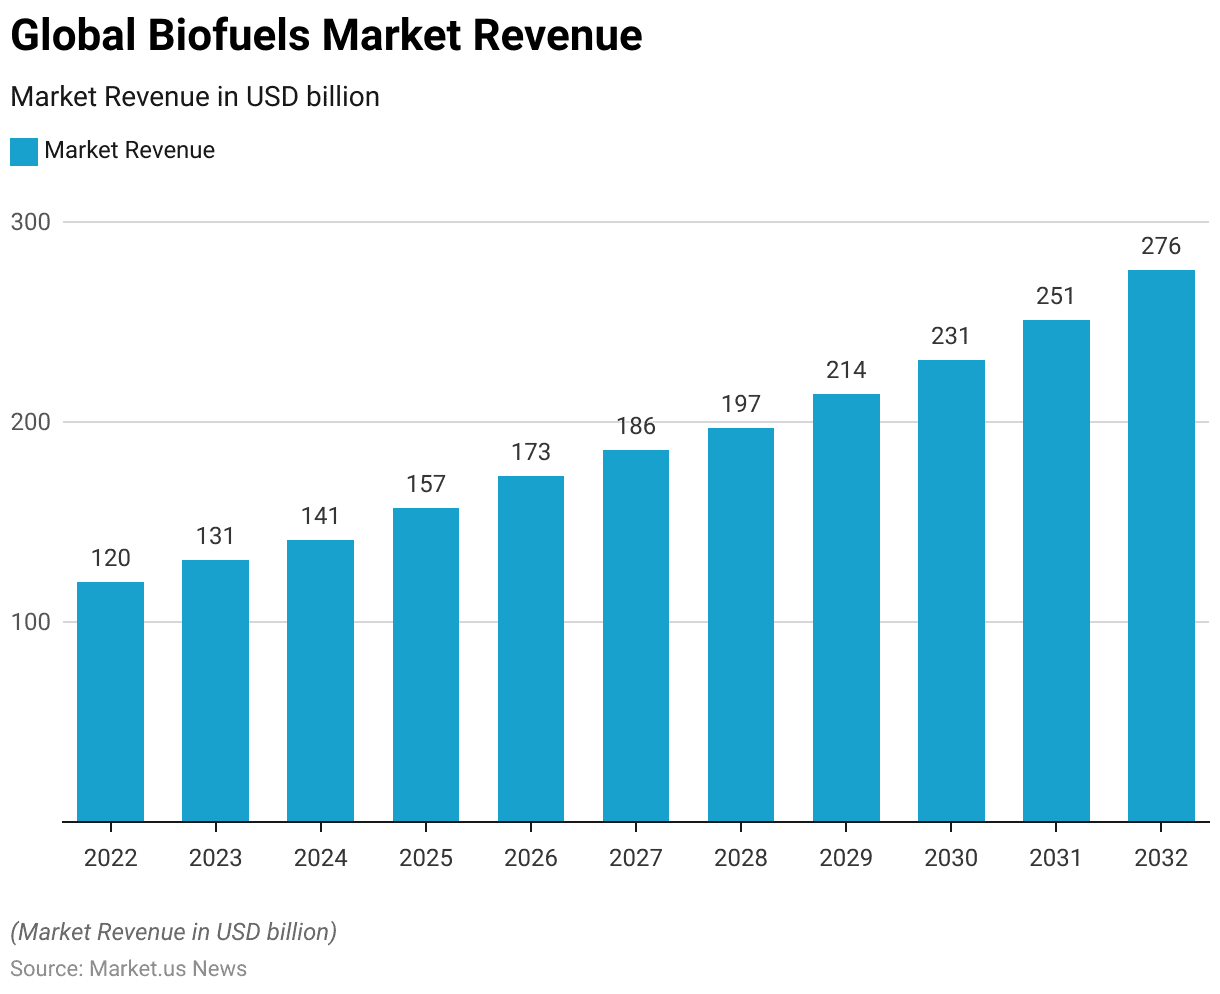
- The presence of several key players characterizes the global biofuels market, each holding a significant share of the market.
- Biofuels Digest leads with an 18% market share, making it the dominant player in the industry.
- Infinita Biotech Private Limited and Gruppo Marseglia follow with market shares of 10% and 11%, respectively.
- Neste Nederland B.V., Louis Dreyfus Company, and Crop Energies AG each hold a 9% share, indicating their strong presence in the market.
- Chevron captures 8% of the market, while Glencore holds a 7% share.
- The remaining 14% of the market is comprised of various other key players. Collectively contributing to the diversity and competitiveness of the biofuels sector.
(Source: market.us)
Regional Analysis of Global Biofuels Market Statistics
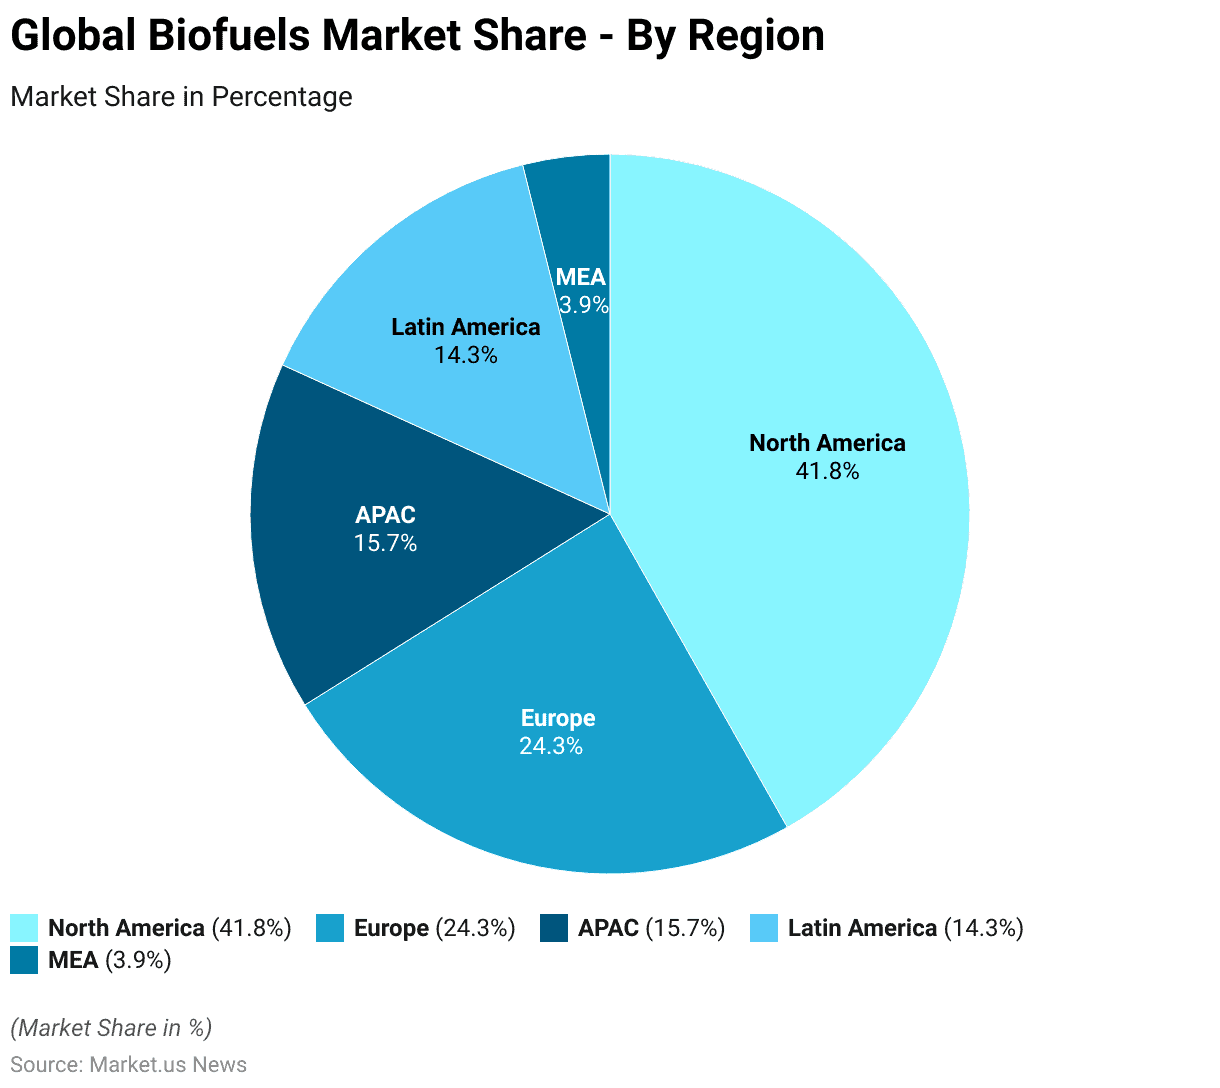
- The global biofuel market is distributed across several regions. With North America leading the way with a substantial market share of 41.8%.
- Europe follows, capturing 24.3% of the market, reflecting its strong focus on renewable energy initiatives.
- The Asia-Pacific (APAC) region holds a 15.7% share, driven by growing energy demands and increasing biofuel production capacities.
- Latin America contributes 14.3% to the market, showcasing its significant biofuel production capabilities.
- The Middle East and Africa (MEA) region, although smaller. Accounts for 3.9% of the global market share. Indicating emerging opportunities and gradual growth in biofuel adoption.
(Source: market.us)
Global Biofuels Production Market Statistics
Global Biofuels Production Market Size Statistics
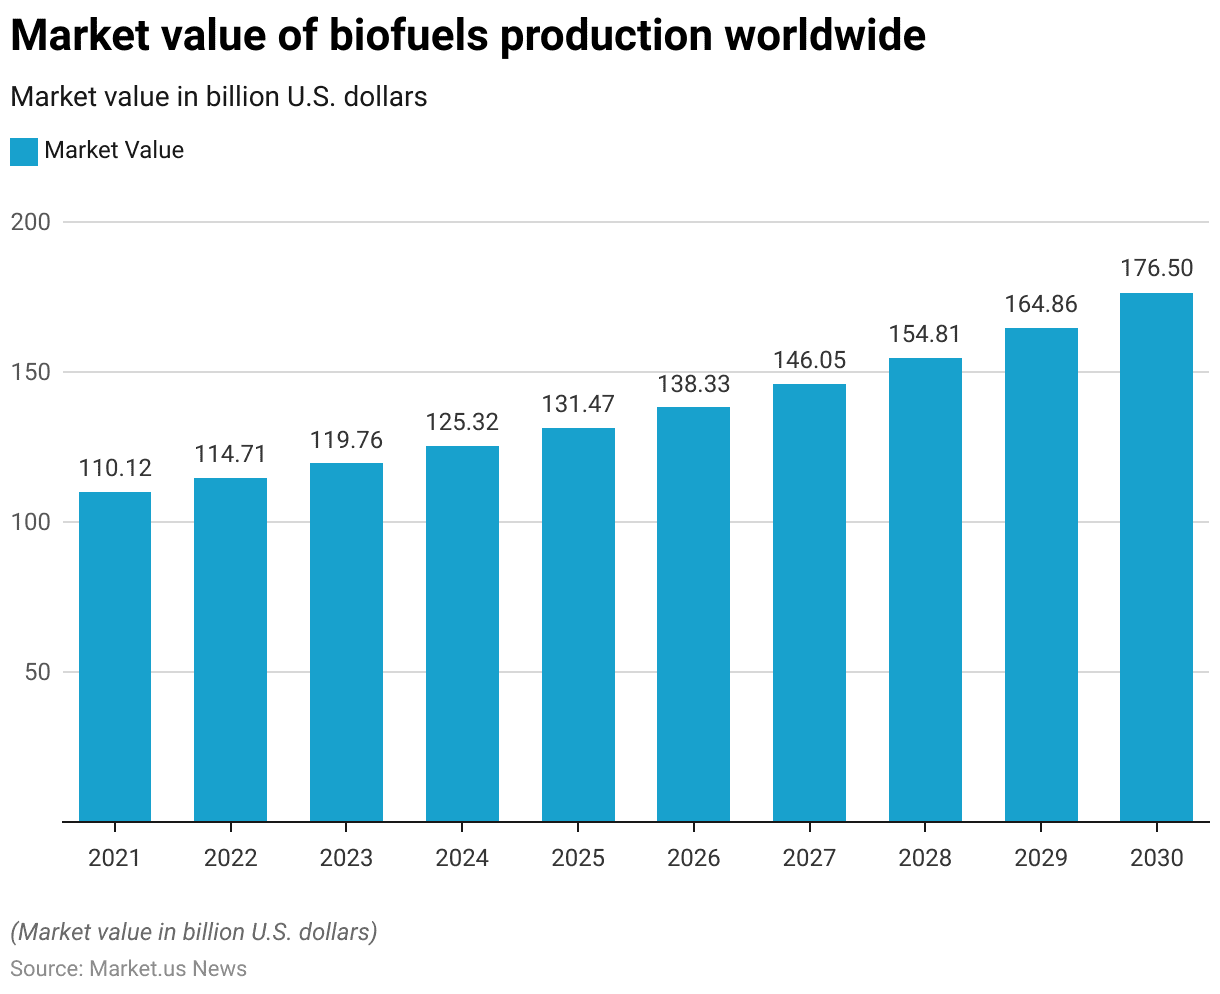
- The market value of biofuel production worldwide has demonstrated a consistent upward trajectory from 2021 to 2030.
- In 2021, the market was valued at USD 110.12 billion.
- This figure increased to USD 114.71 billion in 2022 and further to USD 119.76 billion in 2023.
- The growth continued, with the market value reaching USD 125.32 billion in 2024 and USD 131.47 billion in 2025.
- By 2026, the market had expanded to USD 138.33 billion, and in 2027, it rose to USD 146.05 billion.
- The trend persisted, with the market value climbing to USD 154.81 billion in 2028 and USD 164.86 billion in 2029.
- By 2030, the market value is projected to reach USD 176.5 billion. Reflecting a robust and sustained growth pattern over the decade.
(Source: Statista)
Global Biofuels Production Market Value- By Fuel Type Statistics
2021-2023
- The global production biofuels market, segmented by fuel type, has experienced notable growth from 2021 to 2030.
- In 2021, the market value for ethanol was USD 73.91 billion, followed by biodiesel at USD 23.26 billion. Renewable diesel at USD 6.07 billion, biojet fuel at USD 4.2 billion, and other biofuels at USD 2.69 billion.
- The following year, 2022, saw these values increase to USD 76.54 billion for ethanol, USD 24.34 billion for biodiesel, USD 6.48 billion for renewable diesel, USD 4.45 billion for biojet fuel, and USD 2.9 billion for other biofuels.
- This upward trend continued, with ethanol reaching USD 79.43 billion in 2023 and biodiesel USD 25.54 billion.
- Renewable diesel and biojet fuel grew to USD 6.95 billion and USD 4.73 billion respectively. While other biofuels rose to USD 3.12 billion.
2024-2026
- By 2024, ethanol’s market value increased to USD 82.62 billion, biodiesel to USD 26.85 billion, renewable diesel to USD 7.46 billion, biojet fuel to USD 5.03 billion, and other biofuels to USD 3.36 billion.
- In 2025, the values further escalated to USD 86.16 billion for ethanol, USD 28.31 billion for biodiesel, USD 8.03 billion for renewable diesel, USD 5.37 billion for biojet fuel, and USD 3.61 billion for other biofuels.
- The market sustained its growth trajectory, with ethanol reaching USD 90.12 billion and biodiesel USD 29.93 billion in 2026, while renewable diesel, biojet fuel, and other biofuels climbed to USD 8.66 billion, USD 5.75 billion, and USD 3.87 billion, respectively.
2027-2030
- By 2027, ethanol’s market value was USD 94.58 billion, biodiesel USD 31.75 billion, renewable diesel USD 9.39 billion, biojet fuel USD 6.18 billion, and other biofuels USD 4.16 billion.
- In 2028, these values increased to USD 99.66 billion for ethanol, USD 33.82 billion for biodiesel, USD 10.21 billion for renewable diesel, USD 6.67 billion for biojet fuel, and USD 4.47 billion for other biofuels.
- The growth continued, with ethanol reaching USD 105.49 billion in 2029, biodiesel USD 36.18 billion, renewable diesel USD 11.15 billion, biojet fuel USD 7.23 billion, and other biofuels USD 4.81 billion.
- By 2030, the market values peaked at USD 112.27 billion for ethanol, USD 38.92 billion for biodiesel, USD 12.25 billion for renewable diesel, USD 7.87 billion for biojet fuel, and USD 5.18 billion for other biofuels.
(Source: Statista)

Global Biofuels Production Market Value – By Form Statistics
2021-2023
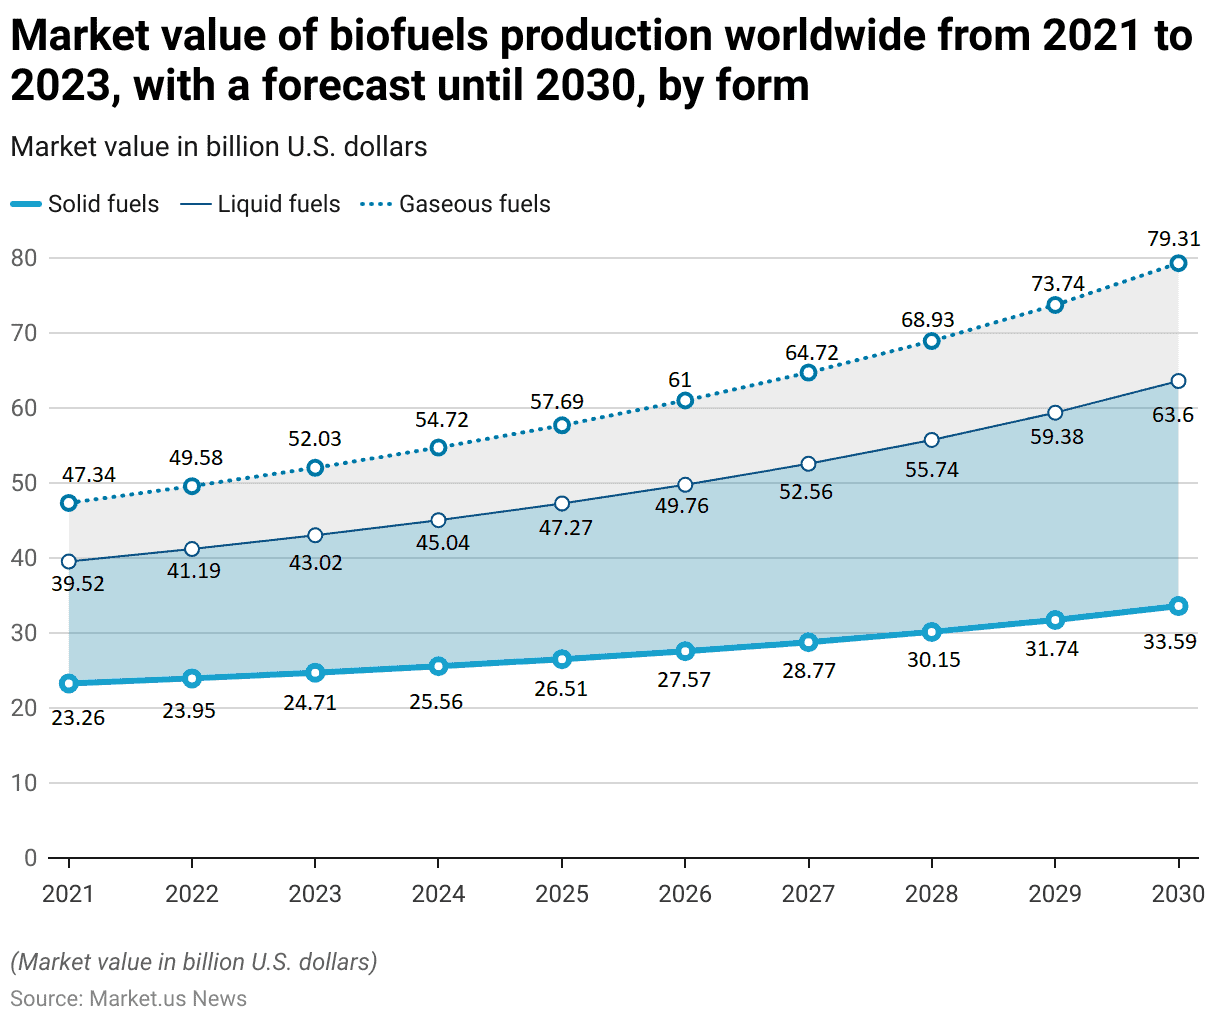
- From 2021 to 2023, the global biofuel production market has shown steady growth across different forms of biofuels. With solid, liquid, and gaseous fuels all experiencing increases in market value.
- In 2021, the market values were USD 23.26 billion for solid fuels, USD 39.52 billion for liquid fuels, and USD 47.34 billion for gaseous fuels.
- By 2022, these values had risen to USD 23.95 billion, USD 41.19 billion, and USD 49.58 billion, respectively.
- The upward trend continued in 2023, with market values reaching USD 24.71 billion for solid fuels, USD 43.02 billion for liquid fuels, and USD 52.03 billion for gaseous fuels.
2024-2026
- The forecast for the coming years indicates continued growth. By 2024, solid fuels are expected to reach USD 25.56 billion, liquid fuels USD 45.04 billion, and gaseous fuels USD 54.72 billion.
- In 2025, the values are projected to be USD 26.51 billion for solid fuels, USD 47.27 billion for liquid fuels, and USD 57.69 billion for gaseous fuels.
- This growth trajectory is anticipated to persist, with market values in 2026 reaching USD 27.57 billion for solid fuels, USD 49.76 billion for liquid fuels, and USD 61 billion for gaseous fuels.
2027-2030
- By 2027, the market is forecasted to expand to USD 28.77 billion for solid fuels, USD 52.56 billion for liquid fuels, and USD 64.72 billion for gaseous fuels.
- In 2028, these figures are expected to rise further to USD 30.15 billion for solid fuels, USD 55.74 billion for liquid fuels, and USD 68.93 billion for gaseous fuels.
- The market values in 2029 are projected to be USD 31.74 billion for solid fuels, USD 59.38 billion for liquid fuels, and USD 73.74 billion for gaseous fuels.
- By 2030, the market is expected to achieve values of USD 33.59 billion for solid fuels. USD 63.6 billion for liquid fuels, and USD 79.31 billion for gaseous fuels, highlighting the robust and sustained growth of the global biofuels market.
(Source: Statista)
Global Biofuels Production Market Value – By Region Statistics
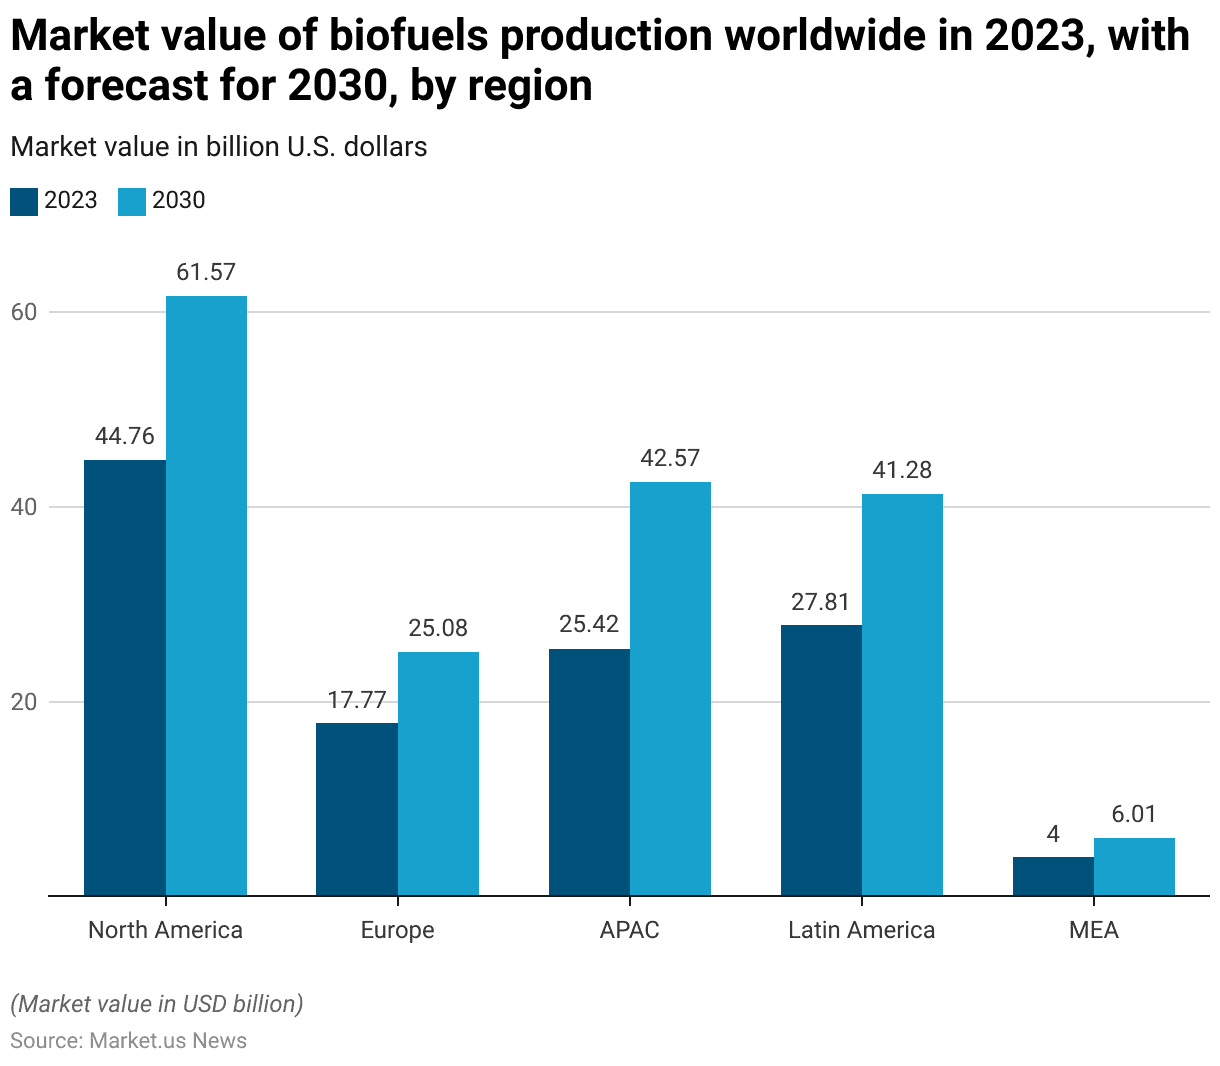
- In 2023, the global biofuels production market exhibited significant regional variations in market value, with North America leading at USD 44.76 billion. This region is projected to grow to USD 61.57 billion by 2030.
- Europe, with a market value of USD 17.77 billion in 2023. It is expected to increase to USD 25.08 billion by the end of the decade.
- The Asia-Pacific (APAC) region, a major player in the biofuels market, had a market value of USD 25.42 billion in 2023, which is forecasted to reach USD 42.57 billion by 2030.
- Latin America also demonstrated substantial market activity, with a value of USD 27.81 billion in 2023, projected to grow to USD 41.28 billion by 2030.
- The Middle East and Africa (MEA) region, although smaller in comparison, had a market value of USD 4 billion in 2023 and is anticipated to increase to USD 6.01 billion by 2030.
- This data underscores the robust growth and regional diversification within the global biofuels production market over the forecast period.
(Source: Statista)
Biofuel Production Statistics
Global Biofuel Production Statistics
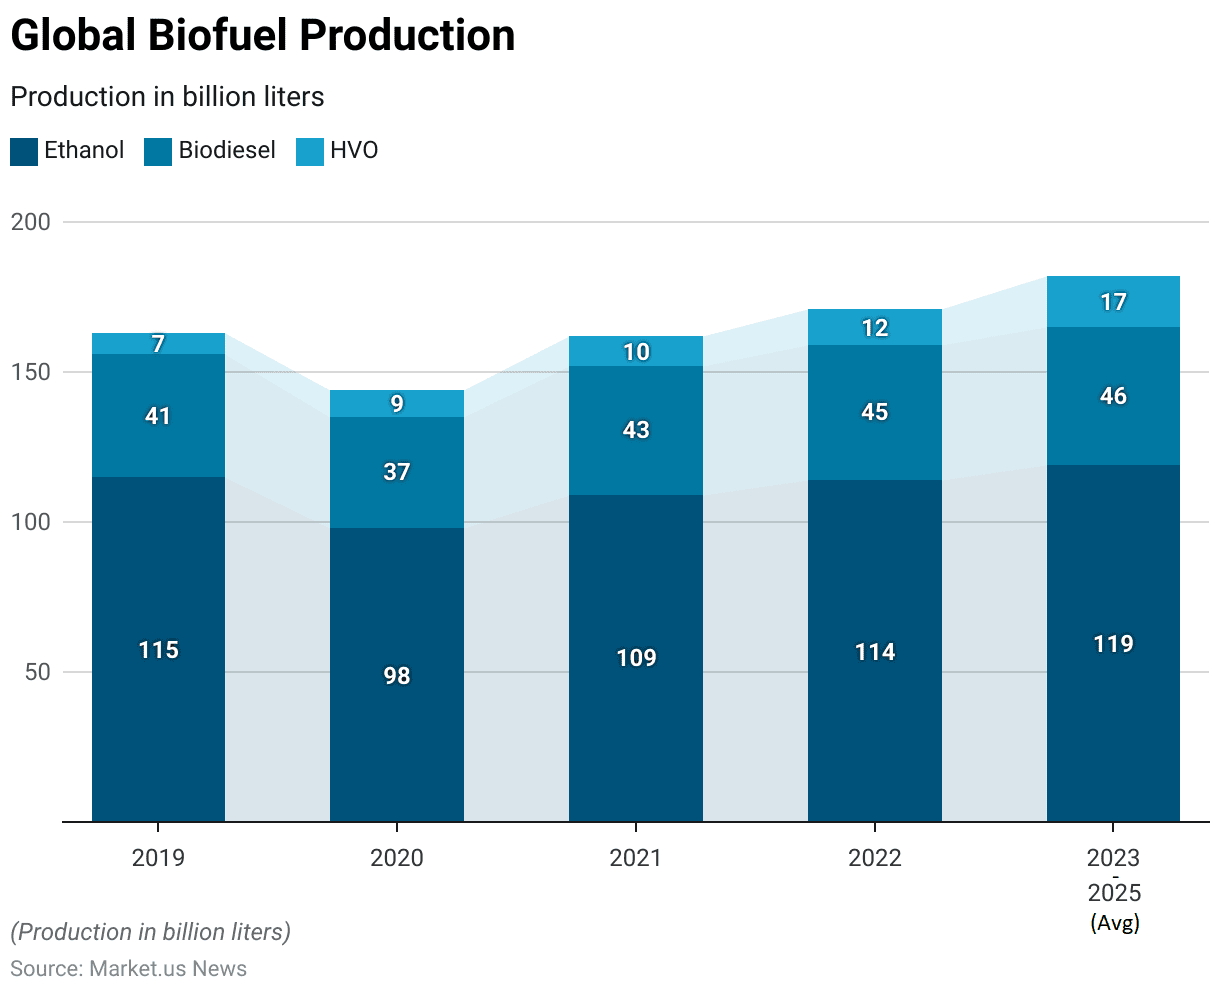
- Global biofuel production has shown varying trends across different types of biofuels from 2019 to the average projected values for 2023-2025.
- In 2019, ethanol production was at 115 billion liters, while biodiesel and hydrotreated vegetable oil (HVO) were at 41 billion liters and 7 billion liters, respectively.
- The following year, 2020, saw a decline in ethanol production to 98 billion liters and biodiesel to 37 billion liters, whereas HVO production increased to 9 billion liters.
- In 2021, ethanol production rebounded to 109 billion liters, with biodiesel rising to 43 billion liters and HVO reaching 10 billion liters.
- This upward trend continued into 2022, with ethanol production at 114 billion liters, biodiesel at 45 billion liters, and HVO at 12 billion liters.
- The average projected production for 2023-2025 indicates further growth, with ethanol expected to reach 119 billion liters, biodiesel 46 billion liters, and HVO significantly increasing to 17 billion liters.
- These figures highlight the dynamic nature of biofuel production, with substantial growth in HVO output over the years.
(Source: International Energy Agency (IEA))
Leading Countries Based On Biofuels Production Statistics
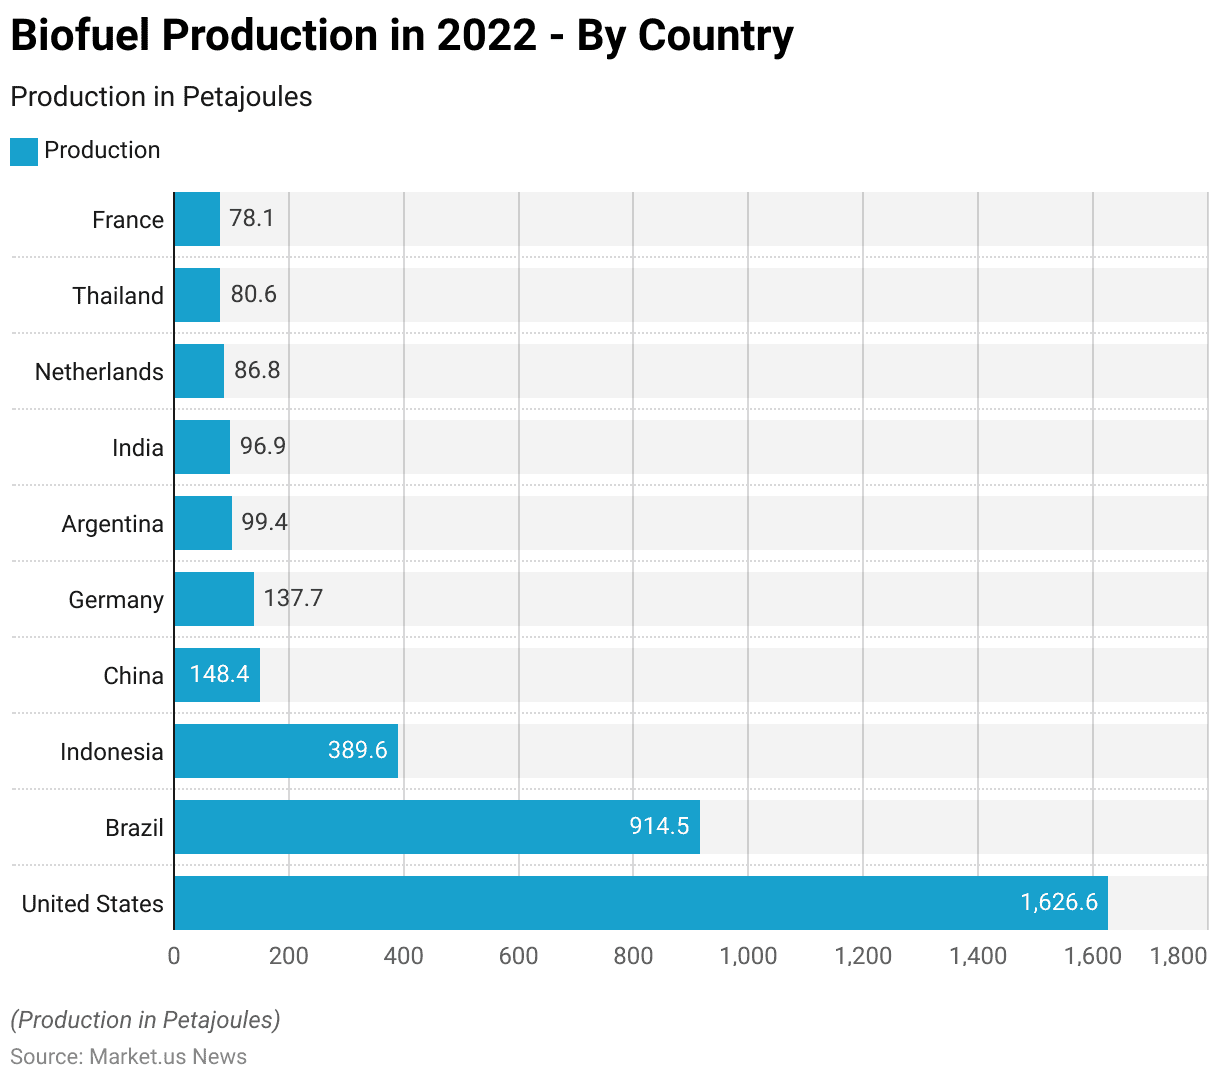
- In 2022, the United States led global biofuel production, which produced 1,626.6 petajoules of biofuels, making it the top producer worldwide.
- Brazil followed with a significant contribution of 914.5 petajoules.
- Indonesia ranked third, producing 389.6 petajoules, while China and Germany produced 148.4 petajoules and 137.7 petajoules, respectively.
- Argentina contributed 99.4 petajoules to the global biofuel output, with India close behind at 96.9 petajoules.
- The Netherlands produced 86.8 petajoules, followed by Thailand with 80.6 petajoules, and France rounded out the list with 78.1 petajoules.
- This distribution underscores the diverse geographic spread of biofuel production, with significant outputs from both developed and developing nations.
(Source: Statista)
Sources of Biofuels Production Statistics
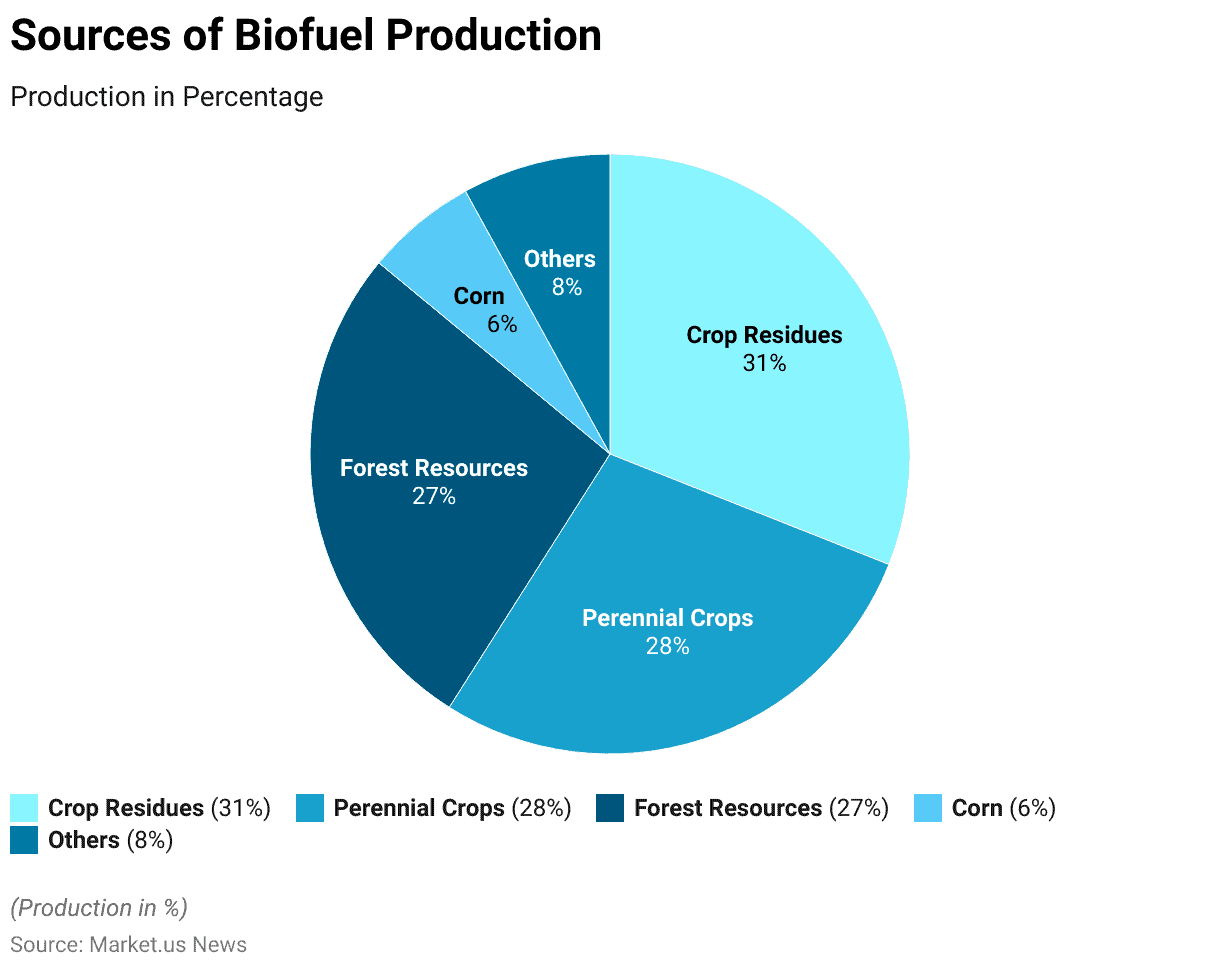
- Biofuel production is derived from various sources, each contributing differently to the overall output.
- Crop residues account for the largest share, representing 31% of biofuel production.
- Perennial crops follow closely, contributing 28% to the total production.
- Forest resources are another significant source, accounting for 27% of biofuel production.
- Corn, while a notable source, contributes 6% to the overall biofuel output.
- The remaining 8% comes from various other sources.
- This distribution highlights the diverse feedstock base utilized in biofuel production, emphasizing the reliance on agricultural and forestry resources to meet energy demands.
(Source: U.S. Department of Energy)
Cost of Producing Biofuels Statistics
- The costs of biofuels are influenced primarily by factors such as labor and land expenses, feedstock prices, the oil market, and agricultural subsidies.
- Currently, producing ethanol from sugar cane is more expensive, costing over $0.40-$0.50 per liter of gasoline-equivalent (lge), compared to gasoline prices which range from $0.30-$0.40 per lge.
- Ethanol derived from sugar beet, maize, or wheat is even pricier, with costs around $0.60-$0.80 per lge, though these can potentially be reduced to $0.40-$0.60 per lge through efficiency improvements.
- Lignocellulosic ethanol, at the pilot scale, is currently priced at about $1.00 per lge. However, with advancements in processing, the use of low-cost waste feedstock, co-production of by-products, and scaling up of production plants, this cost is expected to drop by half over the next decade.
- Biodiesel made from animal fat is presently the most economical, costing between $0.40-$0.50 per liter of diesel equivalent (LDE).
- It is anticipated that new process developments and scaling up production will further reduce biodiesel costs to between $0.10-$0.30 per LDE.
(Source: Azo Cleantech)
Biofuel Consumption Statistics
Global Biofuel Consumption
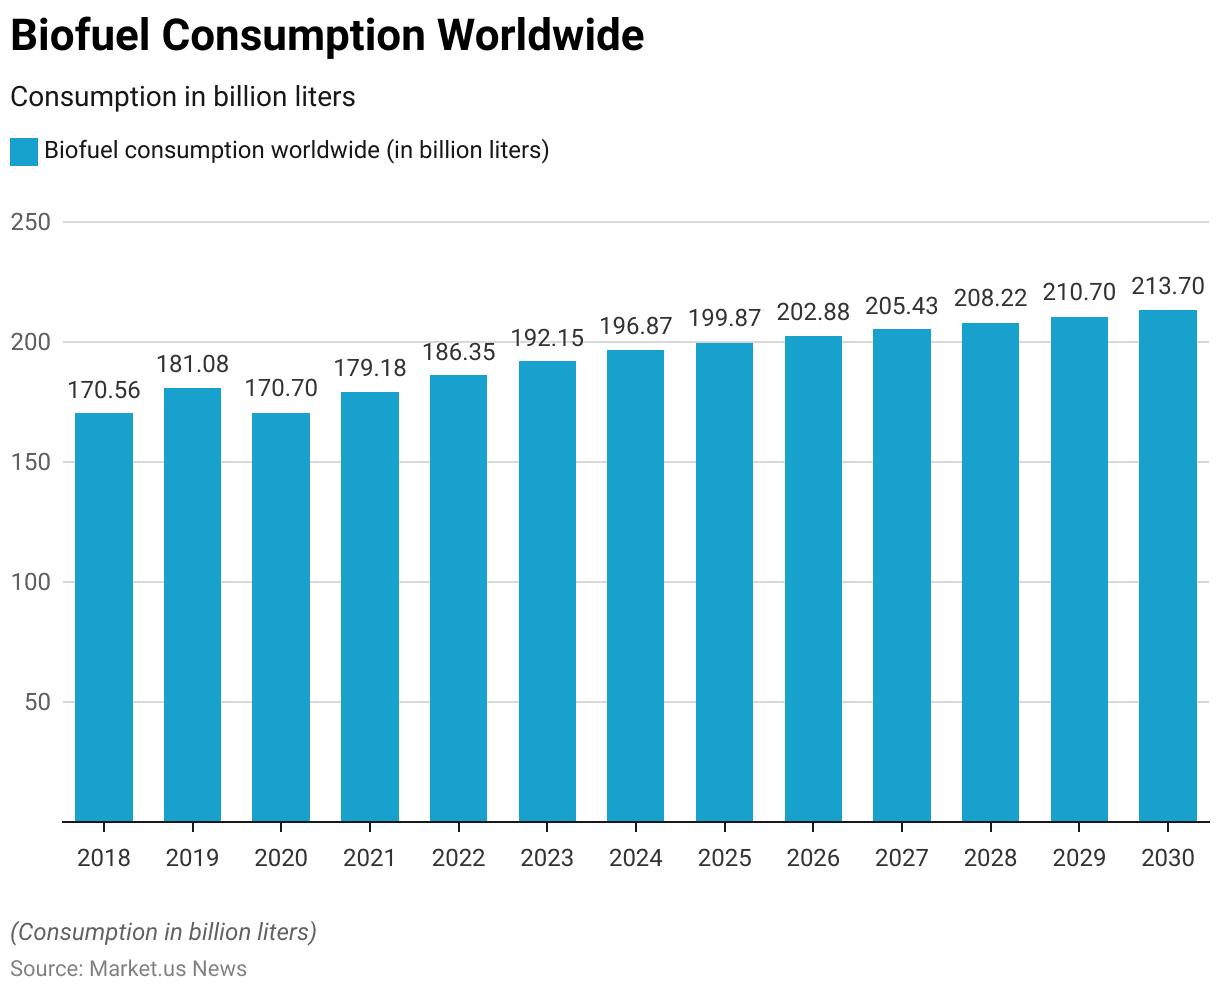
- Global biofuel consumption has shown a generally upward trend from 2018 to 2030.
- In 2018, biofuel consumption was recorded at 170.56 billion liters.
- This increased to 181.08 billion liters in 2019. The year 2020 saw a slight dip to 170.7 billion liters, likely due to the impacts of the global pandemic.
- However, by 2021, consumption had rebounded to 179.18 billion liters.
- The upward trajectory continued in 2022 with 186.35 billion liters and reached 192.15 billion liters in 2023.
- Forecasts for the coming years indicate continued growth, with consumption expected to be 196.87 billion liters in 2024 and 199.87 billion liters in 2025.
- By 2026, global biofuel consumption is projected to reach 202.88 billion liters, increasing to 205.43 billion liters in 2027.
- The trend is expected to persist, with consumption reaching 208.22 billion liters in 2028, 210.7 billion liters in 2029, and 213.7 billion liters by 2030.
- This data highlights a consistent increase in the demand for biofuels worldwide over the forecast period.
(Source: Statista)
Projected Biofuel Consumption Worldwide- By Country/Region
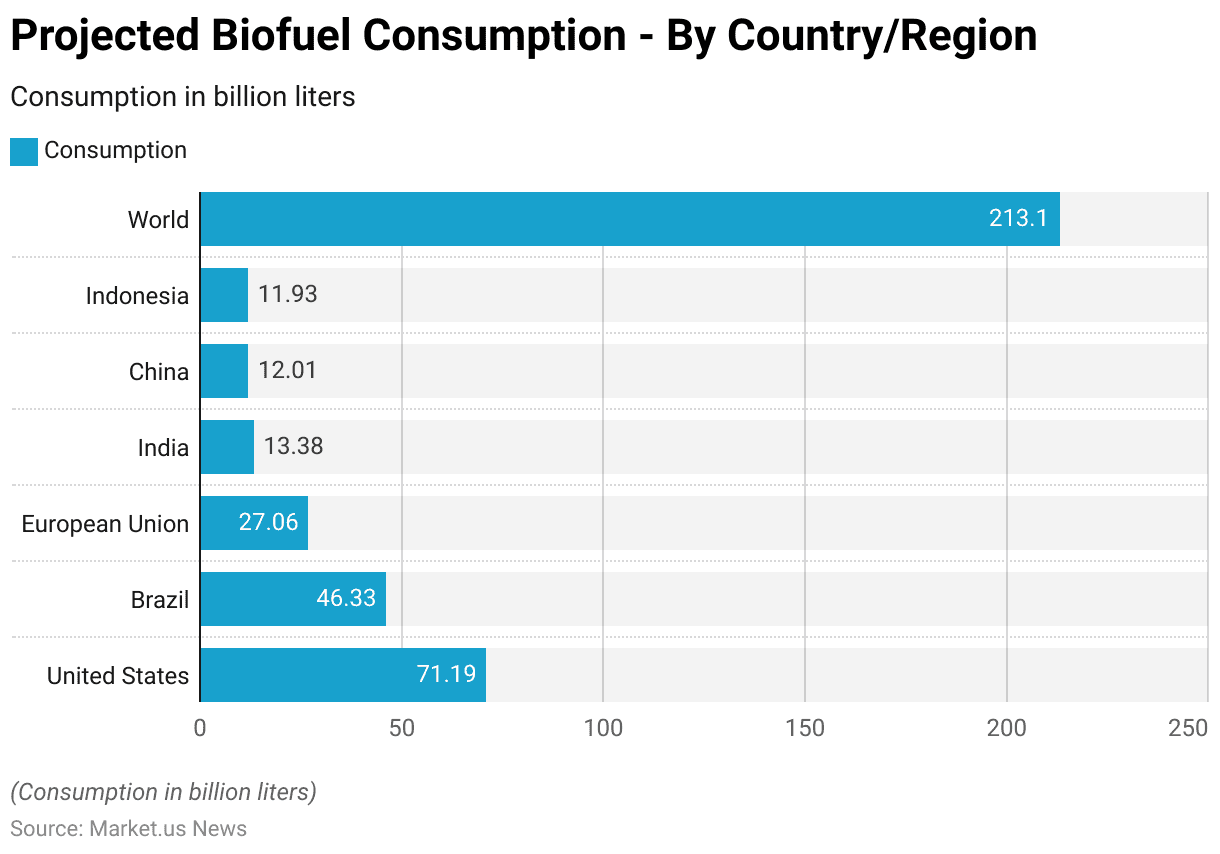
- The projected biofuel consumption for various countries and regions highlights significant contributions from key players in the global market.
- The United States is expected to lead with a substantial consumption of 71.19 billion liters.
- Brazil follows with a projected consumption of 46.33 billion liters, underscoring its significant role in the biofuel sector.
- The European Union is anticipated to consume 27.06 billion liters, reflecting its ongoing commitment to renewable energy.
- India and China are projected to consume 13.38 billion liters and 12.01 billion liters, respectively, indicating their growing focus on sustainable energy sources.
- Indonesia is also expected to contribute significantly, with a projected consumption of 11.93 billion liters.
- Collectively, these countries and regions form a considerable portion of the global biofuel consumption, which is projected to reach 213.1 billion liters.
- This data underscores the widespread adoption and increasing demand for biofuels worldwide.
(Source: Statista)
Biofuel Demand Statistics
Global Biofuel Demand
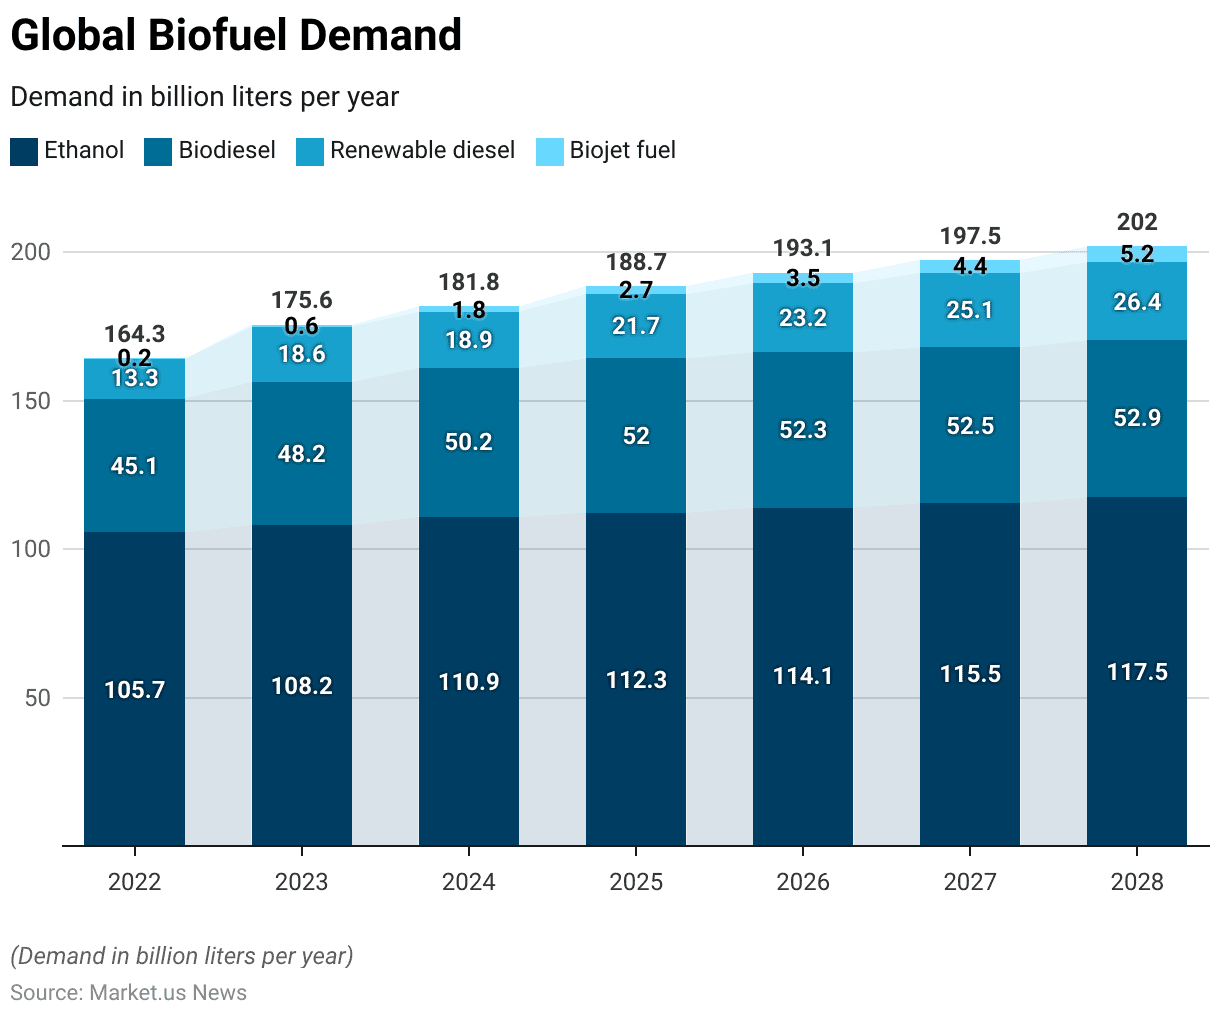
- Global biofuel demand has demonstrated a consistent increase across various fuel types from 2022 to 2028.
- In 2022, the demand for ethanol was 105.7 billion liters, biodiesel was 45.1 billion liters, renewable diesel was 13.3 billion liters, and biojet fuel was 0.2 billion liters.
- By 2023, these figures had risen to 108.2 billion liters for ethanol, 48.2 billion liters for biodiesel, 18.6 billion liters for renewable diesel, and 0.6 billion liters for biojet fuel.
- The upward trend continued in 2024, with ethanol demand reaching 110.9 billion liters, biodiesel 50.2 billion liters, renewable diesel 18.9 billion liters, and biojet fuel 1.8 billion liters.
- In 2025, the demand further increased to 112.3 billion liters for ethanol, 52 billion liters for biodiesel, 21.7 billion liters for renewable diesel, and 2.7 billion liters for biojet fuel.
- The year 2026 saw the demand rise to 114.1 billion liters for ethanol, 52.3 billion liters for biodiesel, 23.2 billion liters for renewable diesel, and 3.5 billion liters for biojet fuel.
- By 2027, ethanol demand reached 115.5 billion liters, biodiesel 52.5 billion liters, renewable diesel 25.1 billion liters, and biojet fuel 4.4 billion liters.
- The growth trend is expected to persist, with 2028 projected to see ethanol demand at 117.5 billion liters, biodiesel at 52.9 billion liters, renewable diesel at 26.4 billion liters, and biojet fuel at 5.2 billion liters.
- This consistent increase underscores the expanding role of biofuels in the global energy mix.
(Source: International Energy Agency (IEA)
Biofuels Demand in Advanced Economies Statistics
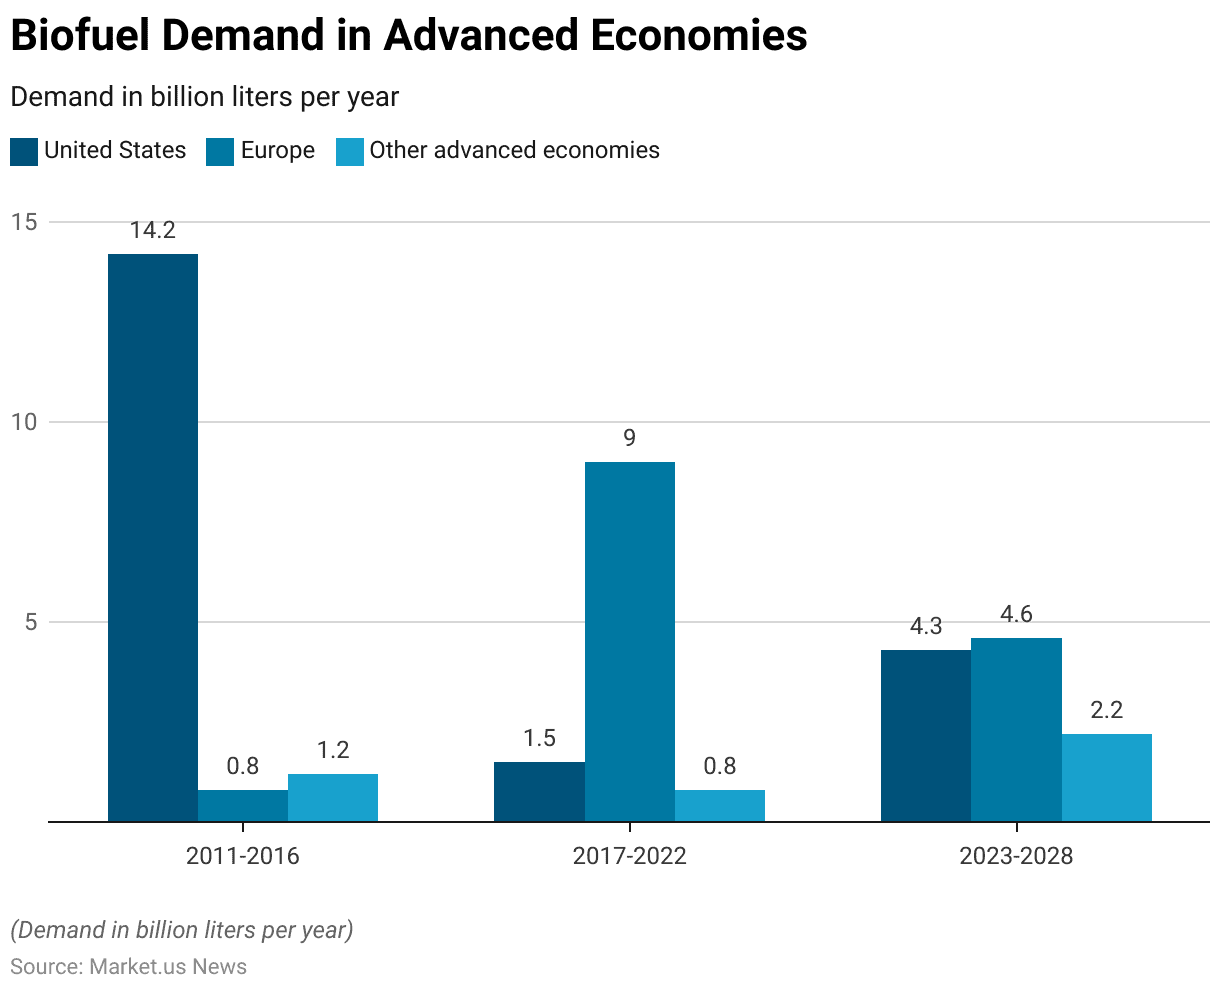
- Biofuel demand in advanced economies has exhibited notable shifts over the past years and is projected to continue evolving through 2028.
- From 2011 to 2016, the United States led with a demand of 14.2 billion liters per year. Meanwhile, Europe and other advanced economies had comparatively lower demands of 0.8 billion liters and 1.2 billion liters per year, respectively.
- The period from 2017 to 2022 saw a significant reduction in demand in the United States to 1.5 billion liters per year. While Europe experienced a substantial increase to 9 billion liters per year. Other advanced economies saw a slight decrease to 0.8 billion liters per year.
- Looking ahead to the period from 2023 to 2028, the demand in the United States is projected to rise to 4.3 billion liters per year, with Europe adjusting to a demand of 4.6 billion liters per year. Other advanced economies are expected to see an increase in demand to 2.2 billion liters per year.
- These trends highlight dynamic changes in biofuel consumption patterns across advanced economies, reflecting varying policy, market, and technological developments.
(Source: International Energy Agency (IEA)
Biofuel Demand in Emerging Economies
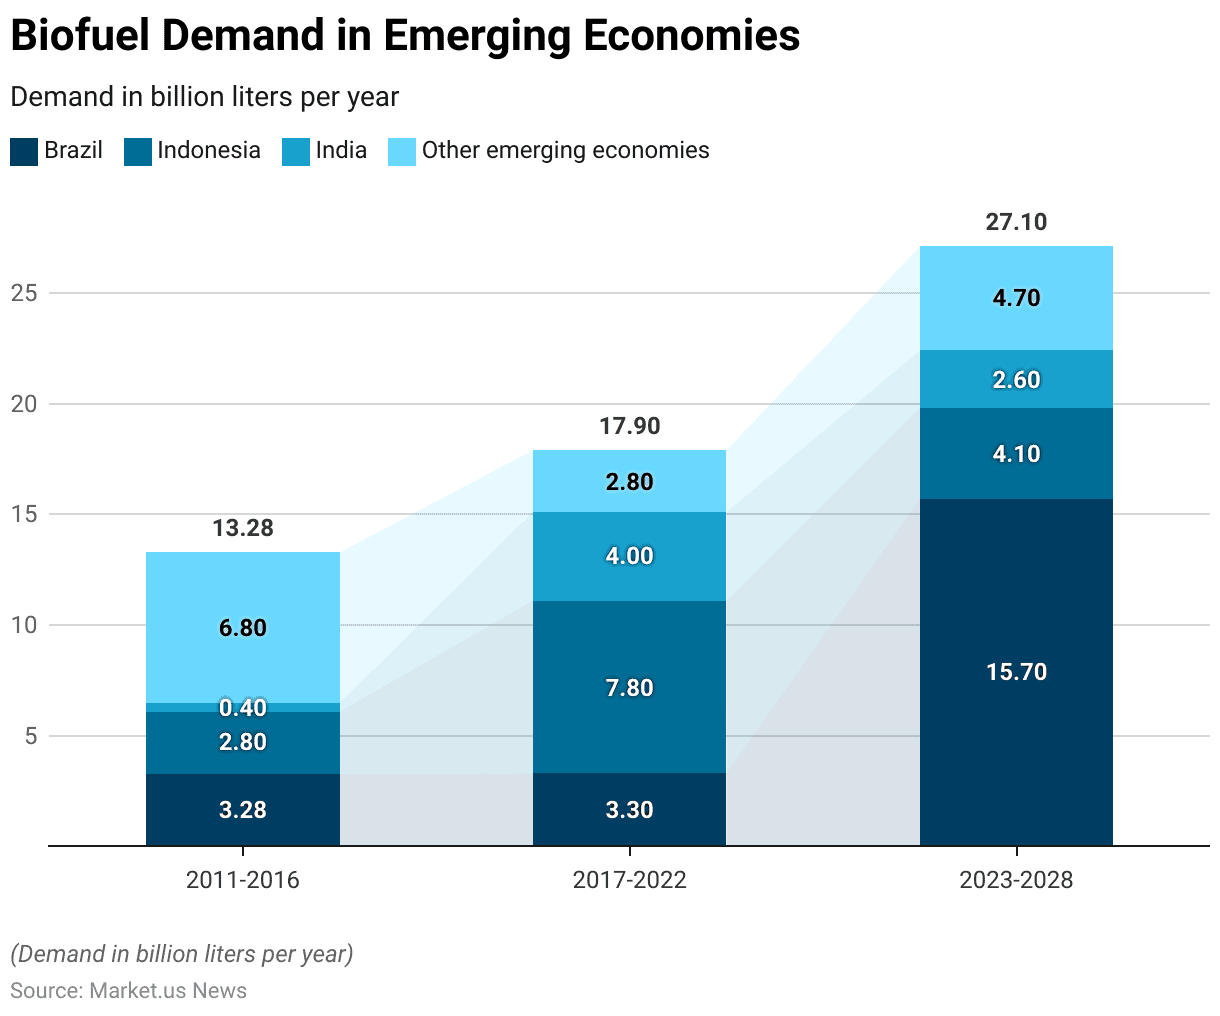
- Biofuel demand in emerging economies has shown significant fluctuations and growth over the past years. With projections indicating continued changes through 2028.
- From 2011 to 2016, Brazil had a biofuel demand of 3.28 billion liters per year. Which slightly increased to 3.3 billion liters per year during the period from 2017 to 2022. This demand is expected to surge to 15.7 billion liters per year from 2023 to 2028.
- Indonesia’s biofuel demand was 2.8 billion liters per year from 2011 to 2016. Then increased substantially to 7.8 billion liters per year from 2017 to 2022 before a projected decrease to 4.1 billion liters per year from 2023 to 2028.
- India saw its biofuel demand rise from 0.4 billion liters per year in the 2011–2016 period to 4 billion liters per year in 2017–2022. With a forecasted decrease to 2.6 billion liters per year from 2023 to 2028.
- Other emerging economies collectively experienced a demand of 6.8 billion liters per year from 2011 to 2016. Which then declined to 2.8 billion liters per year from 2017 to 2022. With an expected rebound to 4.7 billion liters per year from 2023 to 2028.
- These trends illustrate the dynamic nature of biofuel demand in emerging economies, influenced by economic, policy, and technological factors.
(Source: International Energy Agency (IEA)
Biofuels Energy Production Statistics
Biofuels Energy Production – By Region Statistics
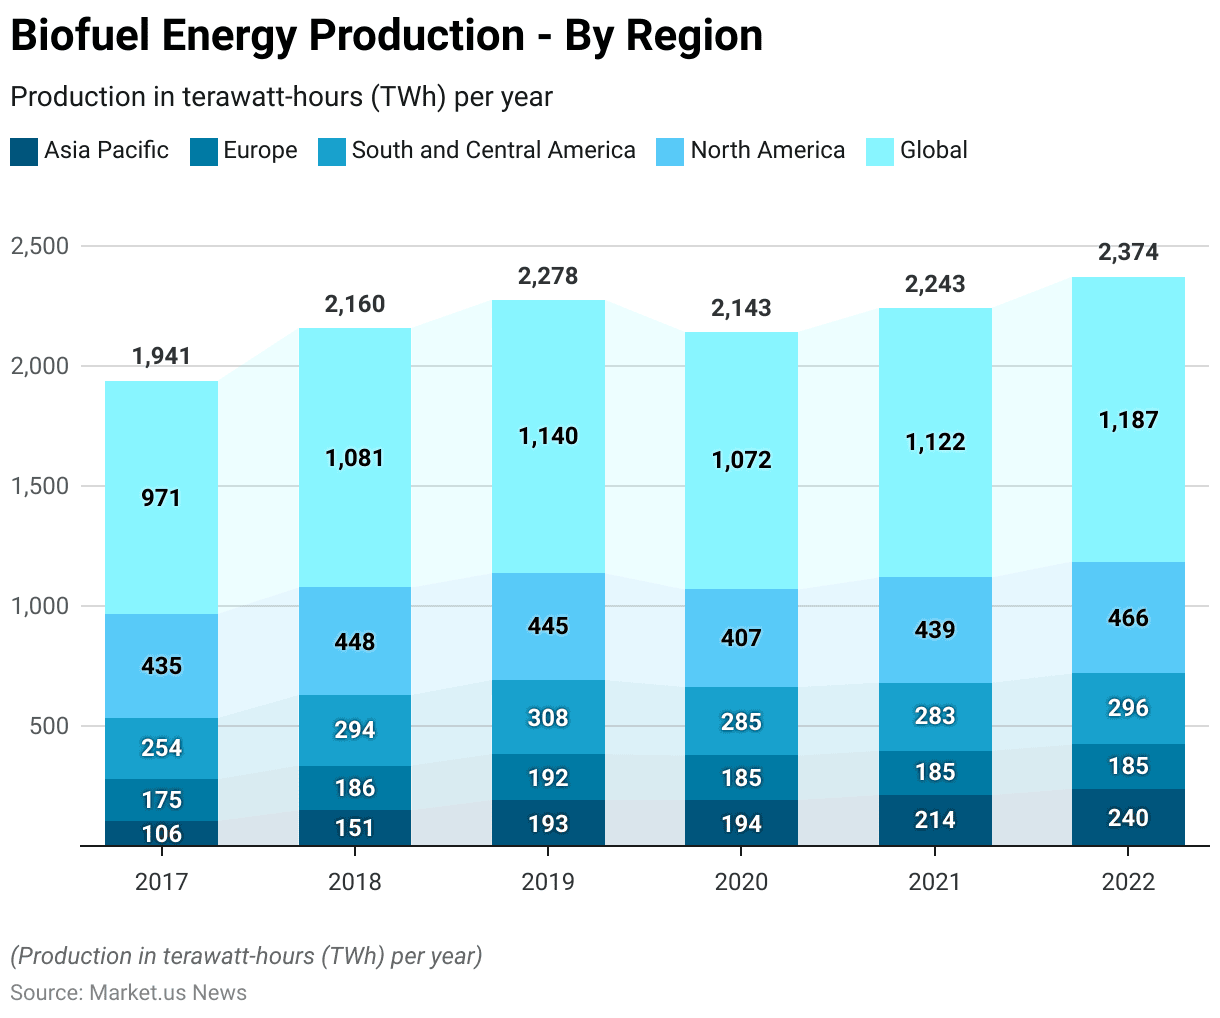
- Biofuel energy production by region has shown significant variations and growth from 2017 to 2022, measured in terawatt-hours (TWh) per year.
- In 2017, global energy biofuel production totaled 971 TWh, with North America leading at 435 TWh, followed by South and Central America at 254 TWh, Europe at 175 TWh, and the Asia Pacific at 106 TWh.
- The following year, 2018, saw an increase to 1,081 TWh globally, with North America at 448 TWh, South and Central America at 294 TWh, Europe at 186 TWh, and the Asia Pacific at 151 TWh.
- By 2019, global energy production reached 1,140 TWh, with North America contributing 445 TWh, South and Central America 308 TWh, Europe 192 TWh, and the Asia Pacific 193 TWh.
- In 2020, global energy production experienced a slight decline to 1,072 TWh, with North America at 407 TWh, South and Central America at 285 TWh, Europe at 185 TWh, and the Asia Pacific maintaining 194 TWh.
- The year 2021 saw a rebound in global production to 1,122 TWh, with North America at 439 TWh, South and Central America at 283 TWh, Europe at 185 TWh, and the Asia Pacific increasing to 214 TWh.
- By 2022, global energy biofuel production reached 1,187 TWh, with North America leading at 466 TWh, South and Central America at 296 TWh, Europe steady at 185 TWh, and the Asia Pacific at 240 TWh.
- This data highlights the dynamic changes in regional biofuel energy production, reflecting varying economic, policy, and technological developments across different regions.
(Source: Our World in Data)
Biofuels Energy Production – By Country Statistics
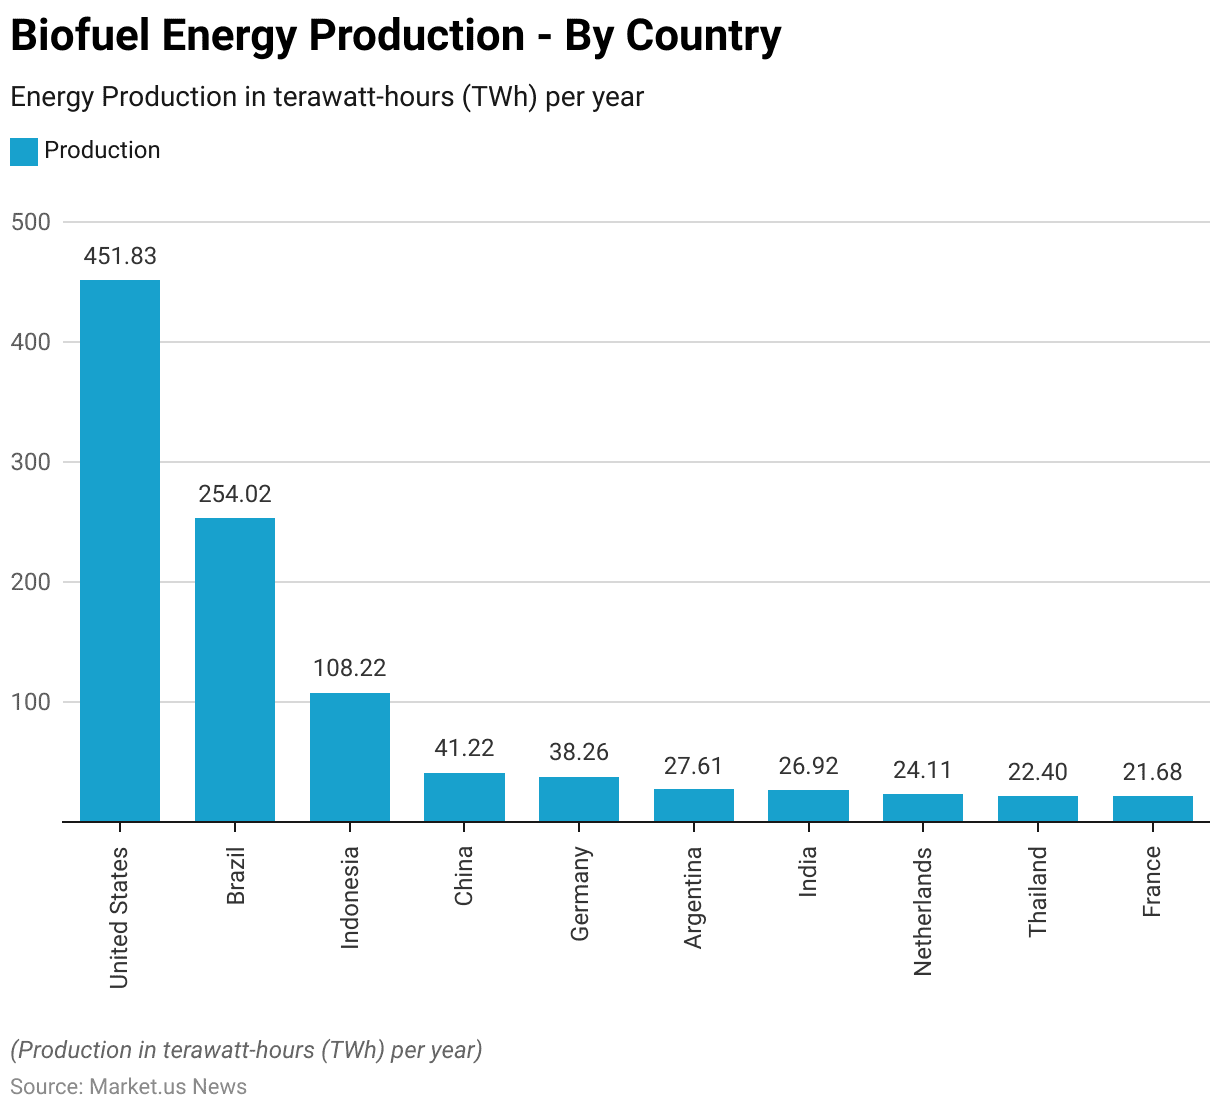
- In terms of biofuel energy production, the United States leads globally with an impressive output of 451.83 terawatt-hours (TWh) per year.
- Brazil follows as the second-largest producer, with 254.02 TWh per year, highlighting its significant contribution to the global biofuel market.
- Indonesia ranks third with a production of 108.22 TWh per year. While China and Germany produce 41.22 TWh and 38.26 TWh per year, respectively.
- Argentina and India also contribute notably, with 27.61 TWh and 26.92 TWh per year, respectively.
- The Netherlands produces 24.11 TWh per year, closely followed by Thailand at 22.4 TWh and France at 21.68 TWh per year.
- This distribution underscores the diverse and widespread production of biofuels across various countries. Each playing a crucial role in the global energy landscape.
(Source: Our World in Data)
Potential Benefits of Biofuels
- Ethanol from sugarcane is highly efficient due to high yields per hectare.
- Utilizing bagasse for power and heat during production reduces fossil energy input and can lower CO2 emissions to 0.2-0.3 kg CO2 per liter of ethanol, compared to 2.8 kg CO2 per liter for gasoline.
- Ethanol from corn and cereals can reduce CO2 emissions by 15%-25% compared to gasoline.
- Lignocellulosic ethanol shows a greater reduction, cutting CO2 emissions by 40%-60% compared to fossil fuels like diesel.
- The cetane number, indicating autoignition quality, is higher for biodiesel (45.8 to 56.9 for soybean oil methyl esters, averaging 50.9) compared to petroleum diesel (40 to 52). Biodiesel, however, can form wax crystals in cold temperatures, clogging filters and fuel lines.
- Its oxygen content improves combustion, reducing particulate emissions, carbon monoxide, and hydrocarbons.
(Source: AZO Cleantech)
Potential Side-effects of Biofuels Statistics
- In 2020, the Midwest, renowned for its robust agricultural output, recorded a notable greenhouse gas footprint. The agriculture sector emitted 315 million tons of CO2 equivalent (MtCO2e) and sequestered 38 MtCO2e, resulting in net emissions of 278 MtCO2e.
- This constitutes approximately 20% of the region’s total emissions, while nationally, agriculture contributes around 10% of emissions. Emissions originate from fertilizer use, manure management, on-farm energy consumption, and land use alterations.
- Corn and soybeans occupy 75% of the Midwest’s arable land. It plays a pivotal role in these emissions, largely due to their extensive use in biofuel production. Consequently, the biofuels industry significantly influences the region’s agricultural emissions.
- Biofuel production significantly increases emissions and environmental damage by converting natural areas like forests and grasslands into farmland for crops such as corn and soy. USDA data shows a 17% increase in corn and soy cultivation in the Midwest from 2008 to 2022, displacing other crops and natural habitats.
- Additionally, a model indicates that the Renewable Fuel Standard caused a 26% nationwide rise in converting natural land to cropland compared to scenarios without the policy.
- Another study observed a conversion of approximately 4.2 million acres of land to cropland within 100 miles of biorefineries between 2008 and 2012, likely due to heightened biofuel demand.
- This conversion not only raises emissions but also diminishes crucial forests and grasslands. Encroaching on already fragile ecosystems and worsening water pollution.
(Source: World Resources Institute)
Regulations, Laws, And Policies for Biofuels
- Biofuel regulations, laws, and policies vary significantly across countries, reflecting diverse approaches to promoting renewable energy.
- In the United States, the Renewable Fuel Standard (RFS) sets specific biofuel volume requirements, aiming to reduce dependence on foreign oil and support domestic production of low-carbon fuels.
- For 2023-2025, the U.S. Environmental Protection Agency (EPA) has established targets for various biofuels, including cellulosic biofuel and biomass-based diesel.
- The European Union, under the revised Renewable Energy Directive (RED II), emphasizes sustainability criteria and aims to limit the negative impacts of biofuel production, such as indirect land use change (ILUC).
- The EU’s Union Database for Biofuels ensures traceability and transparency in biofuel production and usage.
- In the UAE, the National Policy on Biofuels sets standards for the production, utilization, and trading of biofuels. This policy aims to ensure environmental protection and public health while promoting biofuel production within the country.
- These frameworks highlight the global commitment to advancing biofuel technologies while addressing environmental concerns and promoting sustainable energy practices.
(Source: EPA, European Commission, European Renewable Ethanol, U.ae)
Recent Developments
Acquisitions and Mergers:
- Over the last quarter, the biofuels sector has seen notable acquisitions and mergers. A significant example is BP’s acquisition of Bunge’s biofuel business for $1.5 billion.
- This strategic move allows BP to expand its biofuels portfolio and strengthen its position in the renewable energy market.
New Product Launches:
- Several companies have introduced innovative biofuel products to meet growing market demand.
- For instance, Renewable Energy Group (REG) launched REG Ultra Clean™, a new line of biodiesel produced from renewable raw materials. This product launch underscores REG’s commitment to providing cleaner and more sustainable fuel options.
- Additionally, Gevo Inc. unveiled its Net-Zero 1 project, aiming to produce sustainable aviation fuel (SAF) using renewable feedstocks.
- The project’s launch signifies Gevo’s efforts to address the aviation industry’s need for eco-friendly fuel alternatives.
Funding:
- The biofuels sector has attracted significant investments in recent months.
- LanzaTech, a leading carbon recycling company, secured $300 million in funding led by the Canada Pension Plan Investment Board (CPPIB).
- This investment will support LanzaTech’s efforts to scale up its carbon capture and utilization technology for biofuel production.
- In another instance, Fulcrum BioEnergy received $350 million in funding from a consortium of investors, including BP and Waste Management.
- This funding will facilitate the construction of Fulcrum’s Sierra BioFuels Plant. Which aims to convert municipal solid waste into low-carbon transportation fuels.
Legislative Developments:
- Legislative initiatives have also impacted the biofuels market landscape.
- The European Union’s Renewable Energy Directive (RED II) has set ambitious targets for increasing the share of renewable energy in the transportation sector, driving demand for biofuels across the region.
Conclusion
Biofuels Statistics – In conclusion, the future of biofuels appears promising amid heightened concerns about climate change and the quest for renewable energy sources.
Technological advancements and increased investment underscore their potential to reduce greenhouse gas emissions, diversify energy sources, and bolster rural economies. However, challenges such as land use competition and sustainability issues persist.
Addressing these requires collaborative efforts among stakeholders, integrating sustainable practices, innovation, and supportive policies.
Despite hurdles, biofuels remain pivotal in the transition to a sustainable energy future, offering opportunities for significant impact on both environmental and economic fronts.
FAQs
Biofuels are renewable fuels derived from organic materials, such as plants, agricultural residues, and algae. They are used as alternatives to conventional fossil fuels like gasoline and diesel.
Biofuels are typically produced through processes such as fermentation, transesterification, or thermochemical conversion. For example, ethanol, a common biofuel, is produced by fermenting sugars from crops such as corn or sugarcane.
There are several types of biofuels, including ethanol, biodiesel, biogas, and renewable diesel. Each type has its production process and feedstock sources.
Biofuels are considered more environmentally friendly than fossil fuels because they generally produce fewer greenhouse gas emissions. However, the environmental impact can vary depending on factors such as feedstock selection, land use practices, and production methods.
The economic viability of biofuels depends on factors such as feedstock availability, production costs, government policies, and market demand. In some cases, biofuels can be competitive with fossil fuels, especially when considering long-term sustainability and energy security benefits.


