Table of Contents
- Introduction
- Editor’s Choice
- Global Road Safety Statistics
- Car Safety Market Statistics
- Factors Driving the Demand for Car Safety Solutions Statistics
- Car Accidents – Role in Increasing Emphasis on Car Safety Statistics
- Use of Car Safety Features and Statistics
- Autonomous Driving Car Safety Statistics
- Consumer Preferences and Trends in Car Safety Statistics
- Initiatives to Promote Car Safety Statistics
- Technological Advancements in Car Safety Statistics
- Car Safety Regulations
- Recent Developments
- Conclusion
- FAQs
Introduction
Car Safety Statistics: Car safety encompasses essential features and practices aimed at protecting occupants and preventing accidents.
Passive safety measures include seat belts, airbags, crumple zones, and child safety seats. All are designed to mitigate injury in the event of a collision.
Active safety features like ABS, ESC, collision warning systems, and blind spot monitoring enhance driver control and awareness on the road.
Safe driving practices such as defensive driving, avoiding distractions, and regular vehicle maintenance. Adherence to speed limits, and abstaining from driving under the influence further contribute to overall road safety.
Together, these elements create a comprehensive approach to car safety. Integrating both vehicle technologies and responsible driving behaviors to reduce risks and enhance protection for everyone on the road.
Editor’s Choice
- Between 2009 and 2019, the rate of car traffic accidents across various countries demonstrated notable trends. In the United States, traffic accidents increased by 25.9%, rising from 1,548,000 in 2009.
- In 2023, the global car safety market revenue stood at USD 145.3 billion.
- By 2033, the market is projected to reach USD 363.4 billion. With active safety revenues at USD 266.7 billion and passive safety at USD 96.7 billion.
- From 2011 onwards, side airbags were ubiquitous in both domestic and imported cars in the United States, with both achieving a 100% penetration rate.
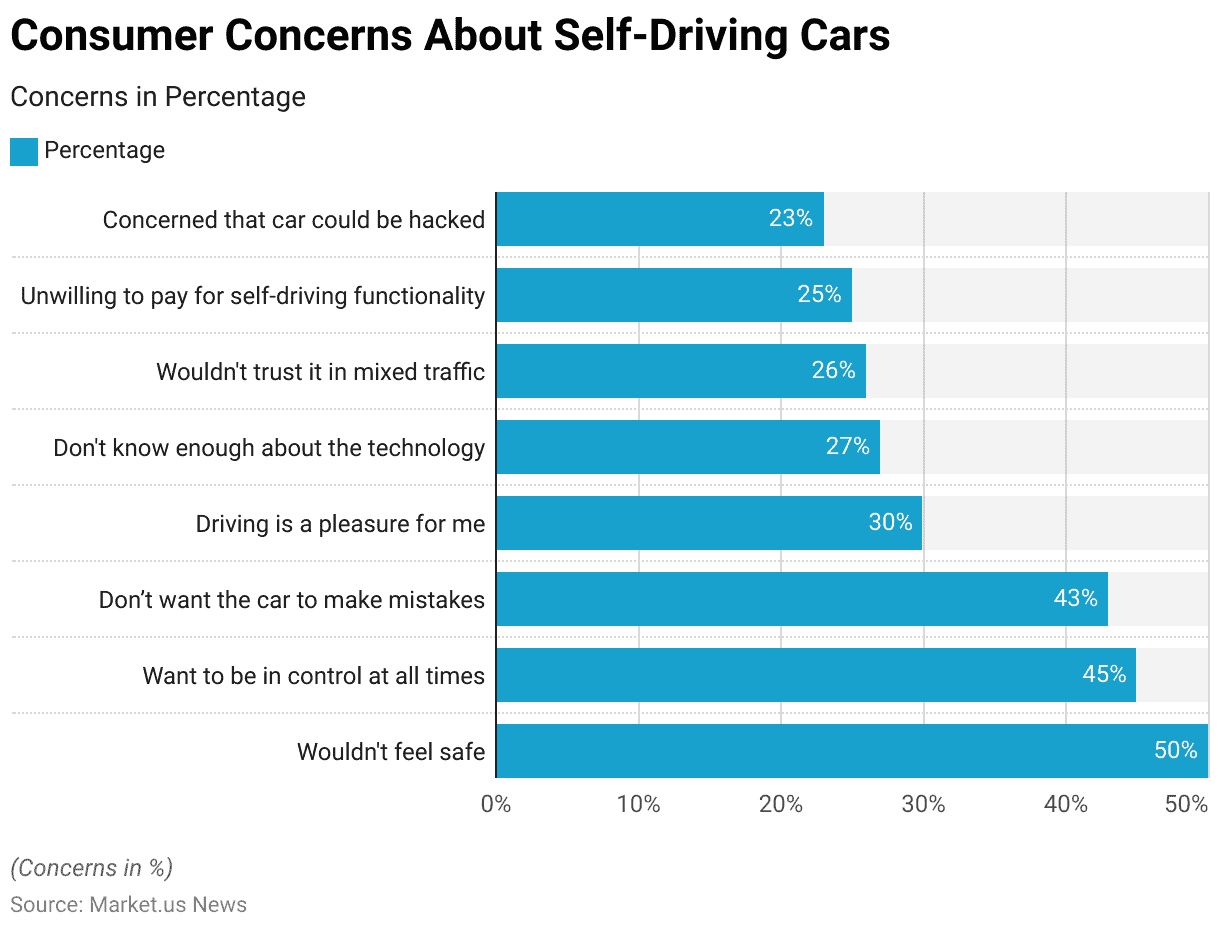
- A survey on the reluctance to use self-driving cars revealed several key concerns among respondents. The most significant reason, cited by 50% of respondents, was that they wouldn’t feel safe in a self-driving car.
- 92% of Indian customers want cars to undergo crash tests and receive safety ratings.
- In Australia, the government has committed $33.4 billion over 5 years to improve road safety through infrastructure investments. Grants for sector-led initiatives, and programs like the Car Safety Ratings Program, which supports independent vehicle safety assessments and promotes consumer awareness.
Global Road Safety Statistics
- Every 24 seconds, roughly one person dies in a road accident, adding up to approximately 1.35 million fatalities each year.
- Daily, more than 500 children under 18 years old die in traffic incidents globally.
- Road traffic injuries are the leading cause of death among young people aged 15 to 29.
- Pedestrians, cyclists, and motorcyclists account for more than half of all road deaths worldwide.
- Men and boys make up 75% of fatalities from road accidents.
- Annually, between 20 to 50 million non-fatal injuries are caused by road crashes.
- Low- and middle-income countries, which have around 60% of the world’s vehicles, experience 93% of global road fatalities. The death rate from road accidents in these countries is more than three times higher than in high-income nations.
- Besides human suffering, road accidents lead to high economic costs, totaling about 3% of GDP in many countries.
- Traffic-related fatalities and injuries impose substantial financial burdens on the global economy every year.
(Source: United Nations Sustainable Transport Conference)
Car Safety Market Statistics
Global Car Safety Market Size Statistics
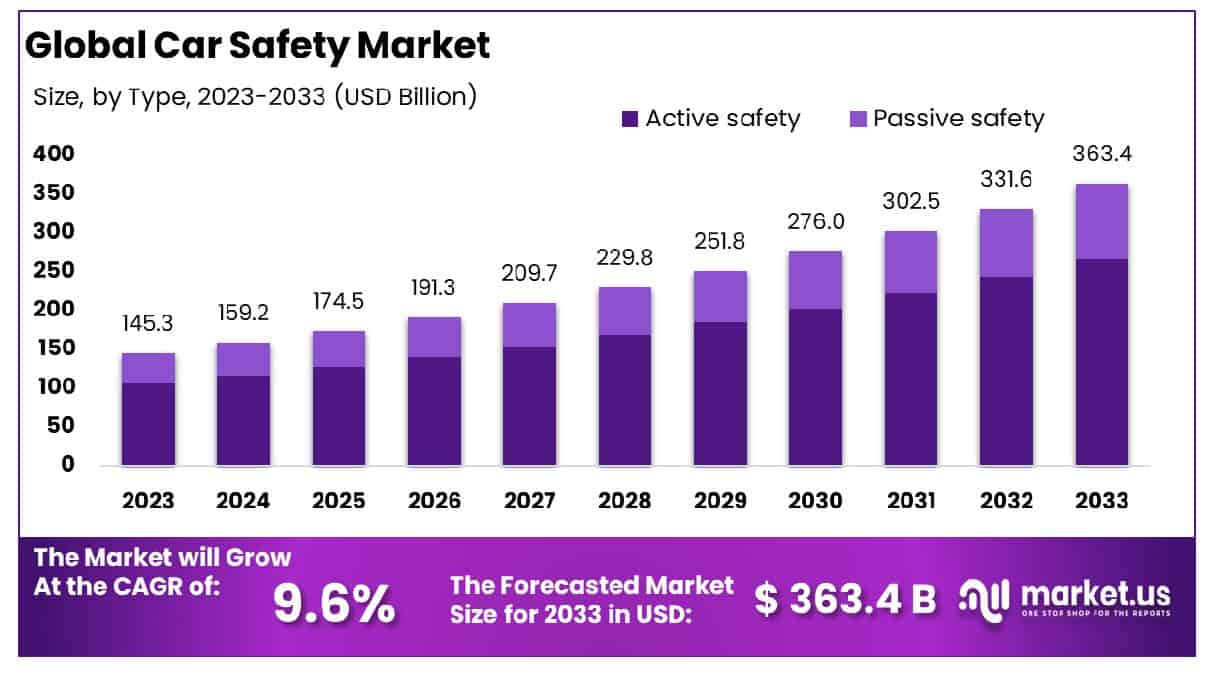
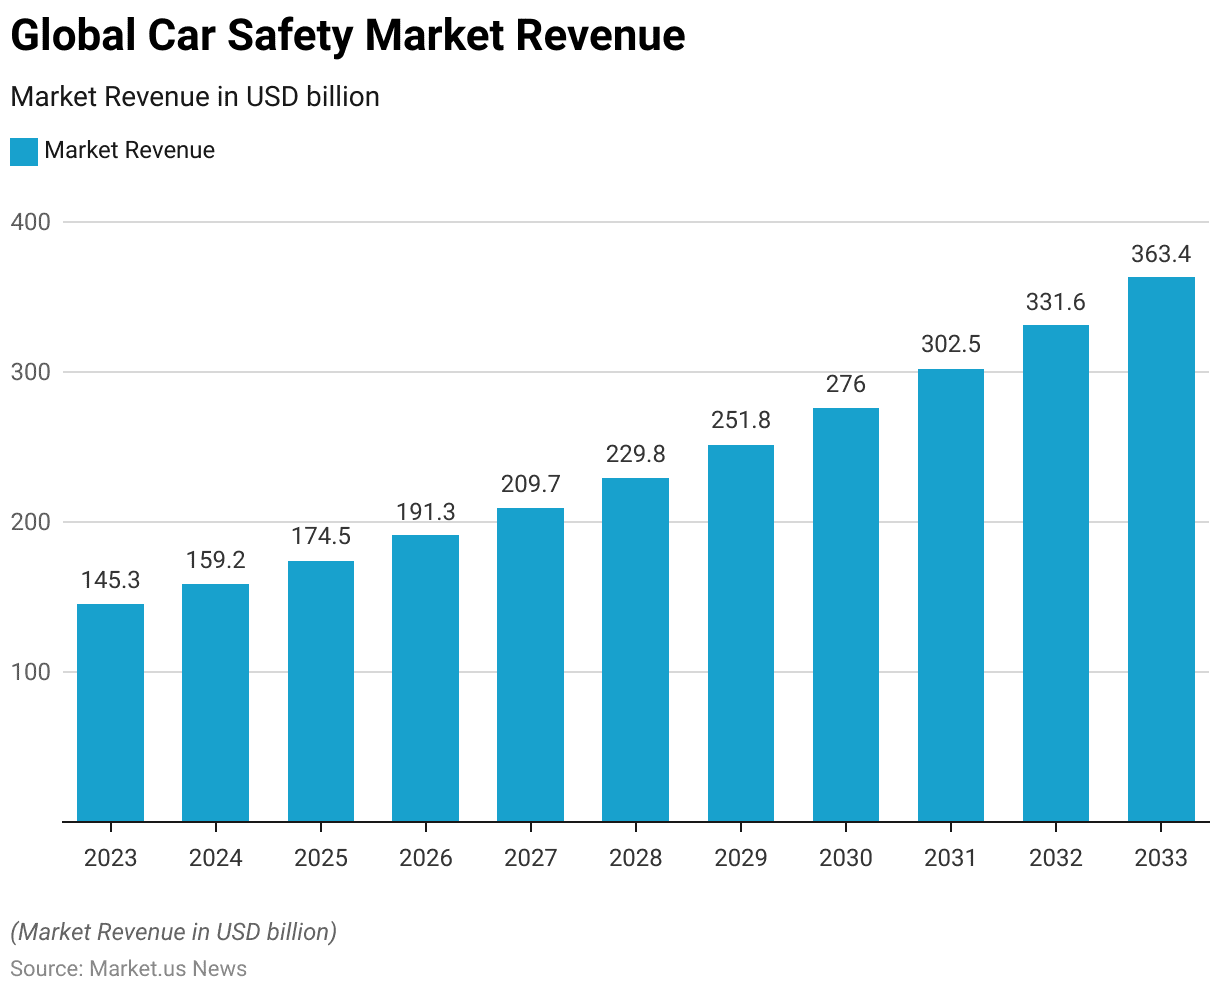
- The global car safety market has shown significant growth over the past decade and is projected to continue its upward trajectory at a CAGR of 9.60%.
- In 2023, the market revenue stood at USD 145.3 billion.
- By 2024, it is expected to increase to USD 159.2 billion and further to USD 174.5 billion in 2025.
- The trend continues with projections of USD 191.3 billion in 2026, USD 209.7 billion in 2027, and USD 229.8 billion in 2028.
- The market is anticipated to reach USD 251.8 billion in 2029 and will likely surpass USD 276.0 billion by 2030.
- The growth is expected to persist, with revenues projected to hit USD 302.5 billion in 2031, USD 331.6 billion in 2032, and an impressive USD 363.4 billion by 2033.
- This steady increase in market revenue highlights the growing importance and investment in car safety technologies globally.
(Source: market.us)
Global Car Safety Market Size – By Type Statistics
2023-2028
- The global car safety market is experiencing robust growth, segmented into active and passive safety components. In 2023, the total market revenue was USD 145.3 billion, with active safety contributing USD 106.7 billion and passive safety USD 38.6 billion.
- By 2024, total revenue is projected to rise to USD 159.2 billion, with active safety at USD 116.9 billion and passive safety at USD 42.3 billion.
- This upward trend continues, with 2025 estimates at USD 174.5 billion (USD 128.1 billion active, USD 46.4 billion passive).
- In 2026, the market is expected to reach USD 191.3 billion, with USD 140.4 billion from active safety and USD 50.9 billion from passive safety.
- For 2027, the figures are anticipated to be USD 209.7 billion (USD 153.9 billion active, USD 55.8 billion passive), and in 2028, USD 229.8 billion (USD 168.7 billion active, USD 61.1 billion passive).
2029-2033
- By 2029, the market should achieve USD 251.8 billion, with active safety at USD 184.8 billion and passive safety at USD 67.0 billion.
- In 2030, projections are USD 276.0 billion (USD 202.6 billion active, USD 73.4 billion passive), and in 2031, USD 302.5 billion (USD 222.0 billion active, USD 80.5 billion passive).
- The trend is set to continue through 2032, with an estimated USD 331.6 billion (USD 243.4 billion active, USD 88.2 billion passive), and by 2033, the market is projected to reach USD 363.4 billion, with active safety revenues at USD 266.7 billion and passive safety at USD 96.7 billion.
- This data underscores the expanding investment and focus on both active and passive safety technologies in the automotive industry.
(Source: market.us)

Factors Driving the Demand for Car Safety Solutions Statistics
Rise in Traffic-related Deaths – By Region
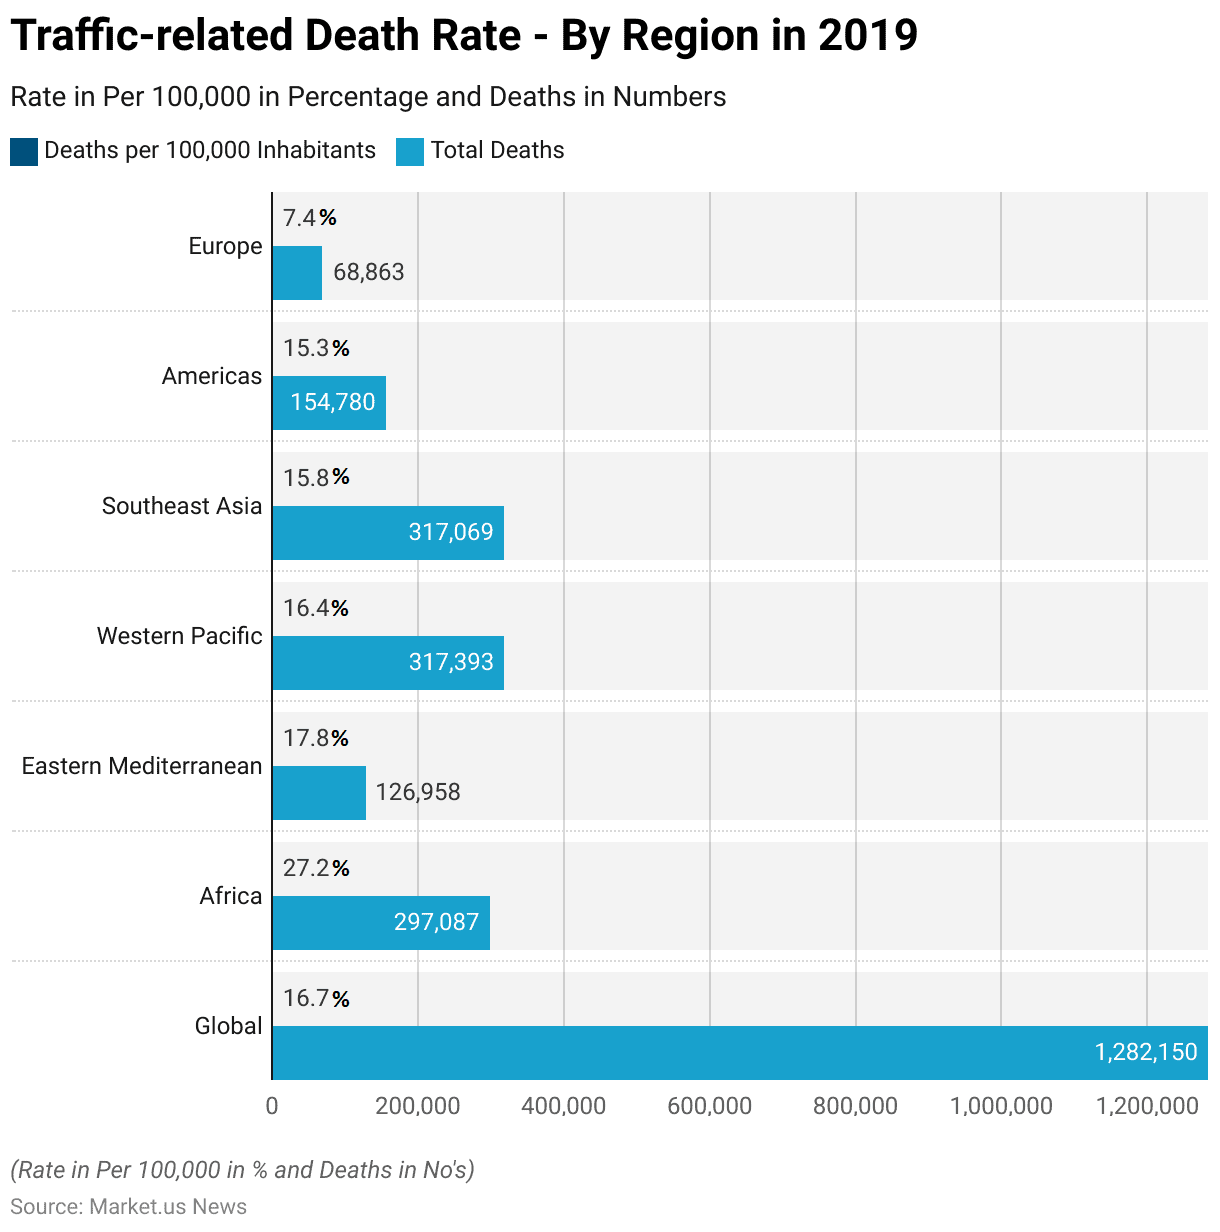
- In 2019, the global traffic-related death rate was 16.7 deaths per 100,000 inhabitants, resulting in a total of 1,282,150 deaths worldwide.
- Regionally, Africa had the highest death rate at 27.2 per 100,000 inhabitants, accounting for 297,087 deaths.
- The Eastern Mediterranean region followed with a rate of 17.8 and 126,958 deaths.
- The Western Pacific region recorded 16.4 deaths per 100,000 inhabitants, totaling 317,393 deaths, while Southeast Asia had a similar total of 317,069 deaths but a slightly lower rate of 15.8.
- The Americas had a rate of 15.3, resulting in 154,780 deaths.
- Europe reported the lowest traffic-related death rate at 7.4 per 100,000 inhabitants, with a total of 68,863 deaths.
- These statistics highlight significant regional disparities in traffic-related fatalities.
(Source: World Health Organization (WHO))
Rise in Road Fatalities – By Country
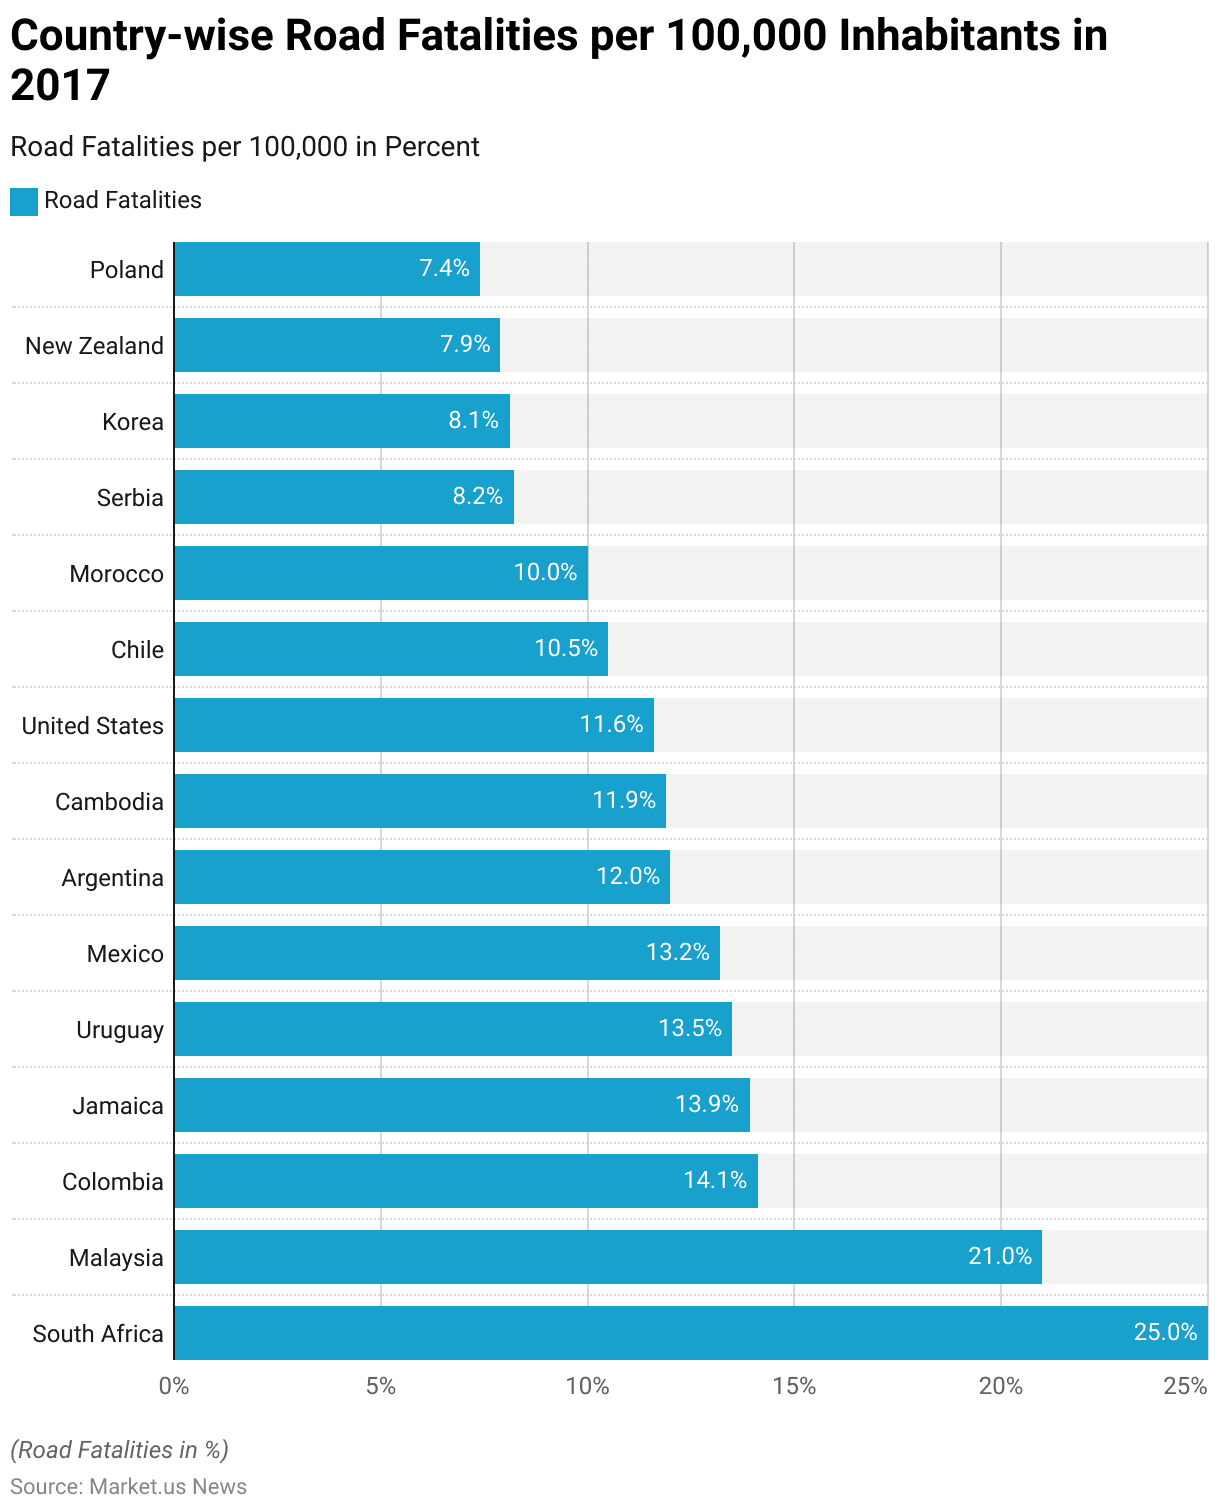
- In 2017, the road fatalities per 100,000 inhabitants varied significantly across different countries.
- South Africa reported the highest rate of 25.0 fatalities per 100,000 inhabitants, followed by Malaysia with a rate of 21.0.
- Colombia and Jamaica had similar rates of 14.1 and 13.9, respectively.
- Uruguay recorded 13.5 fatalities per 100,000 inhabitants, closely followed by Mexico at 13.2 and Argentina at 12.0.
- Cambodia’s rate stood at 11.9, while the United States reported 11.6.
- Chile had a slightly lower rate of 10.5, with Morocco at 10.0. Serbia and Korea had rates of 8.2 and 8.1, respectively.
- New Zealand reported 7.9 fatalities per 100,000 inhabitants, while Poland had the lowest rate among the listed countries at 7.4.
- These figures highlight the significant variations in road safety outcomes across different nations.
(Source: Road Safety Annual Report – 2018)
Car Accidents – Role in Increasing Emphasis on Car Safety Statistics
Rise in Car Accidents and Deaths – By Country
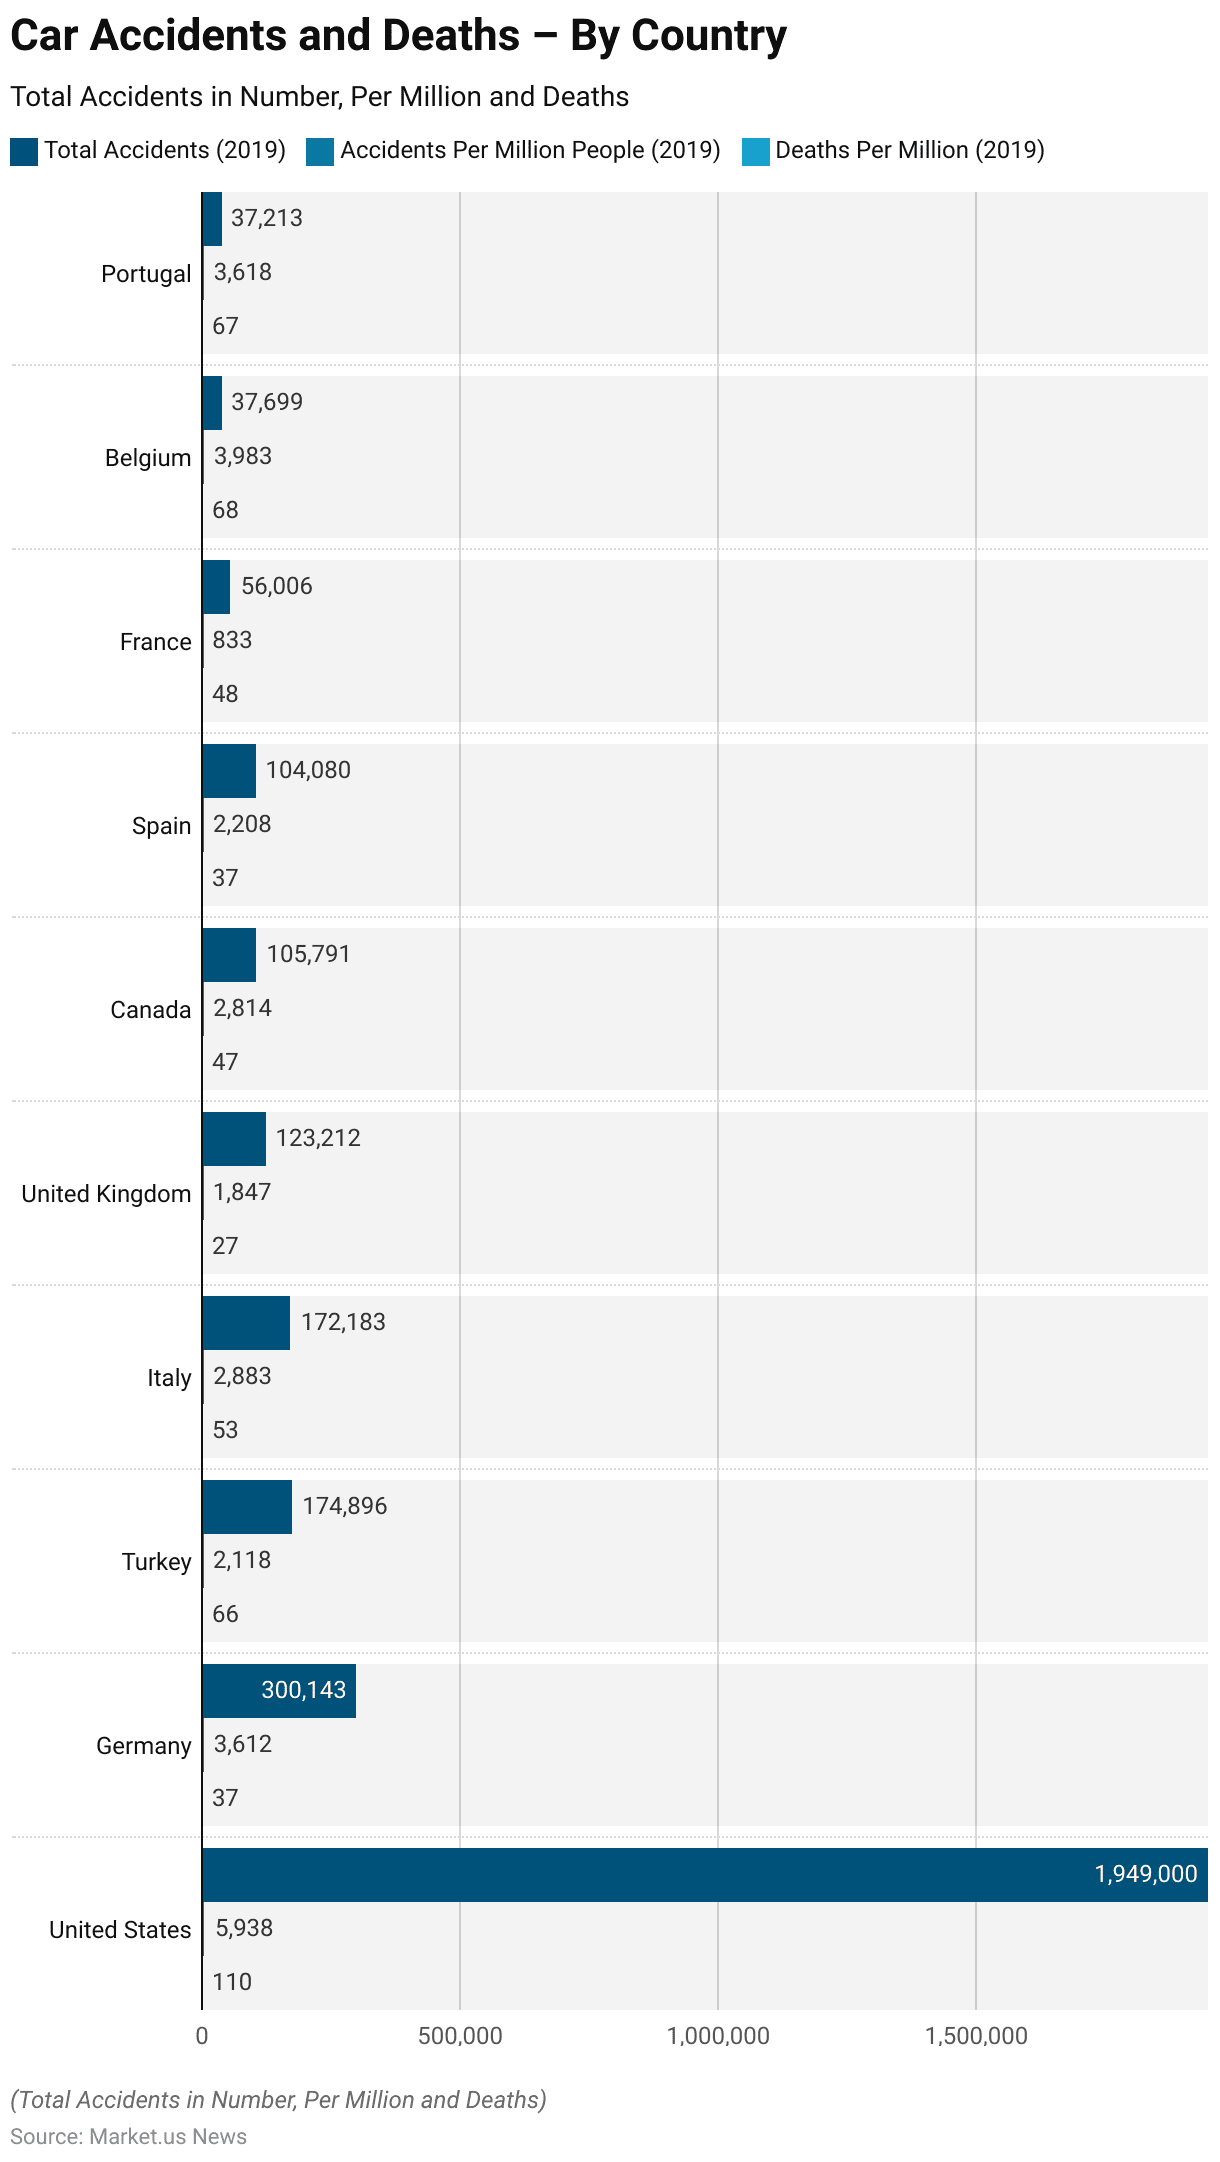
- In 2019, the incidence of car accidents and resulting fatalities varied considerably across several countries. The United States reported the highest total number of accidents at 1,949,000, translating to 5,938 accidents per million people and 110 deaths per million.
- Germany had 300,143 total accidents, with 3,612 accidents per million people and a death rate of 37 per million. Turkey recorded 174,896 accidents, equating to 2,118 accidents per million and 66 deaths per million.
- Italy’s figures were 172,183 total accidents, 2,883 accidents per million people, and 53 deaths per million. The United Kingdom reported 123,212 accidents, 1,847 per million people, and 27 deaths per million.
- In Canada, there were 105,791 accidents, resulting in 2,814 accidents per million people and 47 deaths per million. Spain had 104,080 accidents, with 2,208 accidents per million people and 37 deaths per million.
- France reported 56,006 accidents, equating to 833 per million people and 48 deaths per million. Belgium recorded 37,699 accidents, with a high rate of 3,983 accidents per million people and 68 deaths per million.
- Lastly, Portugal had 37,213 accidents, resulting in 3,618 accidents per million people and 67 deaths per million. These statistics illustrate significant differences in road safety and accident rates among these nations.
(Source: World Population Review)
Car Injuries Rise – By Country
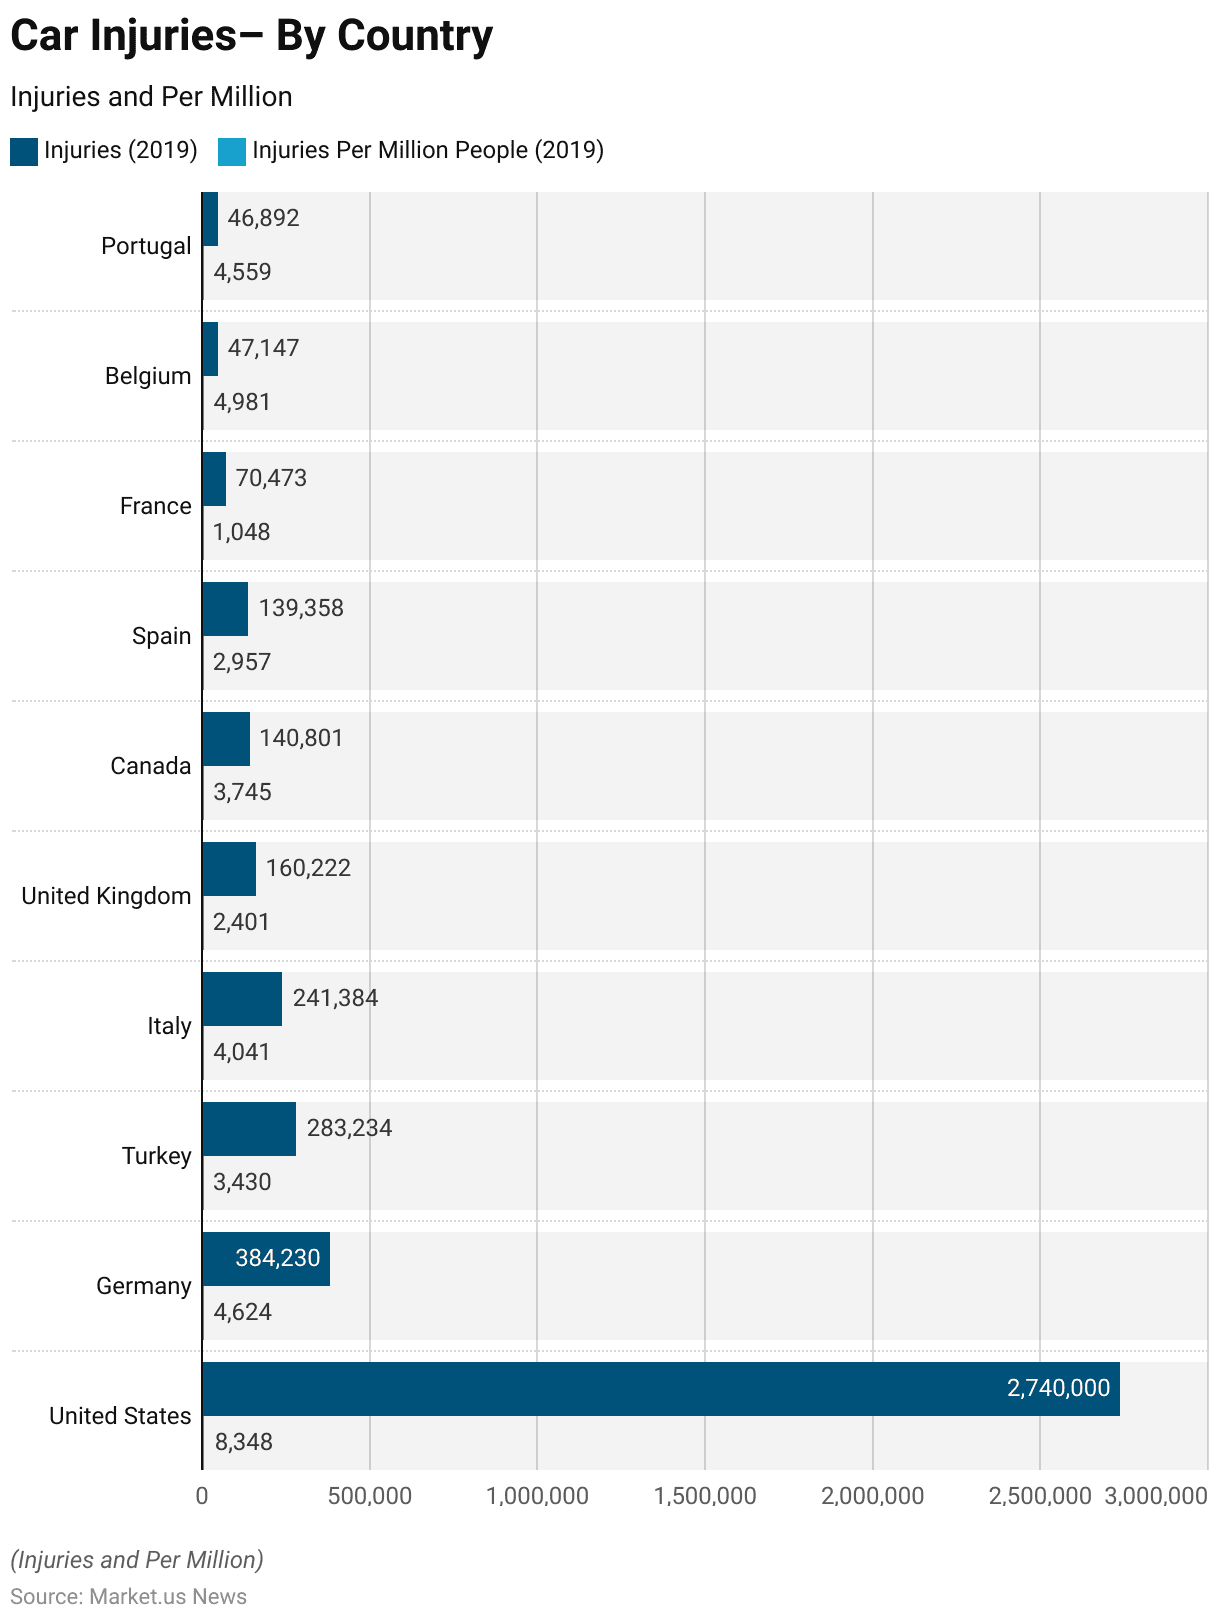
- In 2019, the incidence of car-related injuries also displayed considerable variation across different countries.
- The United States experienced the highest number of injuries, with 2,740,000 cases, which corresponds to 8,348 injuries per million people. Germany followed with 384,230 injuries, equating to 4,624 injuries per million people.
- Turkey recorded 283,234 injuries, or 3,430 per million people, while Italy had 241,384 injuries, resulting in 4,041 injuries per million people. The United Kingdom reported 160,222 injuries, which translates to 2,401 injuries per million people.
- Canada experienced 140,801 injuries, corresponding to 3,745 per million people. Spain’s injury count stood at 139,358, with an injury rate of 2,957 per million people.
- France had 70,473 injuries or 1,048 per million people. Belgium recorded 47,147 injuries, resulting in a high rate of 4,981 injuries per million people, and Portugal had 46,892 injuries, equating to 4,559 injuries per million people.
- These statistics highlight significant differences in the rate of car-related injuries among the listed countries.
(Source: World Population Review)
Rise in Car Traffic Accidents – By Country
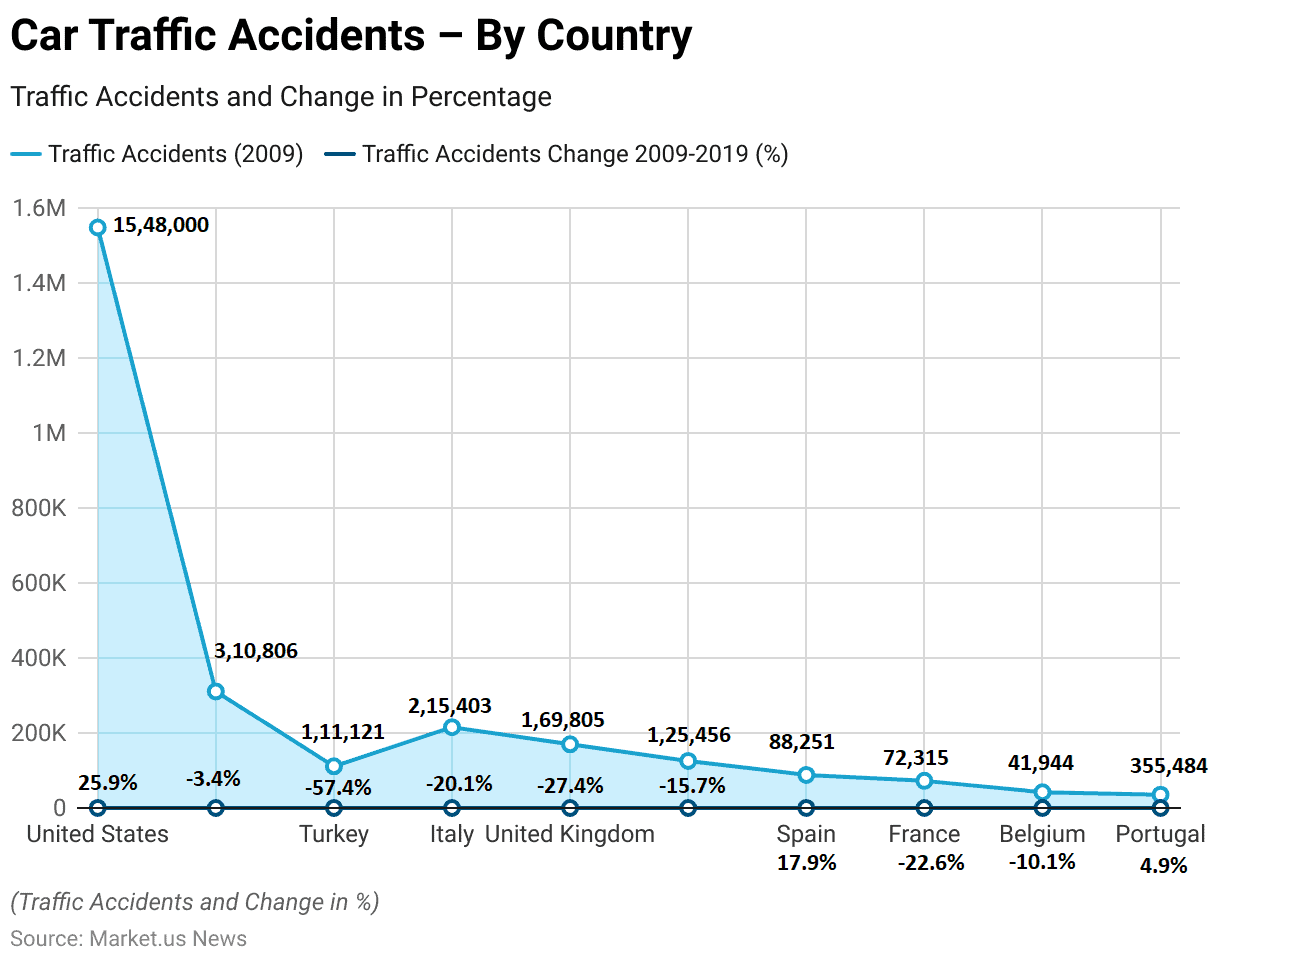
- Between 2009 and 2019, the rate of car traffic accidents across various countries demonstrated notable trends. In the United States, traffic accidents increased by 25.9%, rising from 1,548,000 in 2009.
- Germany saw a slight decrease of 3.4%, with accidents declining from 310,806 in 2009. Turkey experienced a significant rise of 57.4%, with traffic accidents increasing from 111,121.
- Italy reported a substantial reduction of 20.1%, with accidents dropping from 215,403. The United Kingdom saw an even greater decline of 27.4%, with traffic accidents decreasing from 169,805.
- In Canada, there was a 15.7% reduction, with accidents falling from 125,456. Spain experienced a 17.9% increase in traffic accidents, rising from 88,251.
- France reported a 22.6% decrease, with accidents falling from 72,315. Belgium saw a 10.1% reduction, with traffic accidents decreasing from 41,944. Portugal experienced a modest increase of 4.9%, with traffic accidents rising from 35,484.
- These statistics illustrate diverse trends in car traffic accident rates over the decade, with some countries achieving significant reductions while others saw notable increases.
(Source: World Population Review)
Use of Car Safety Features and Statistics
Seat Belts
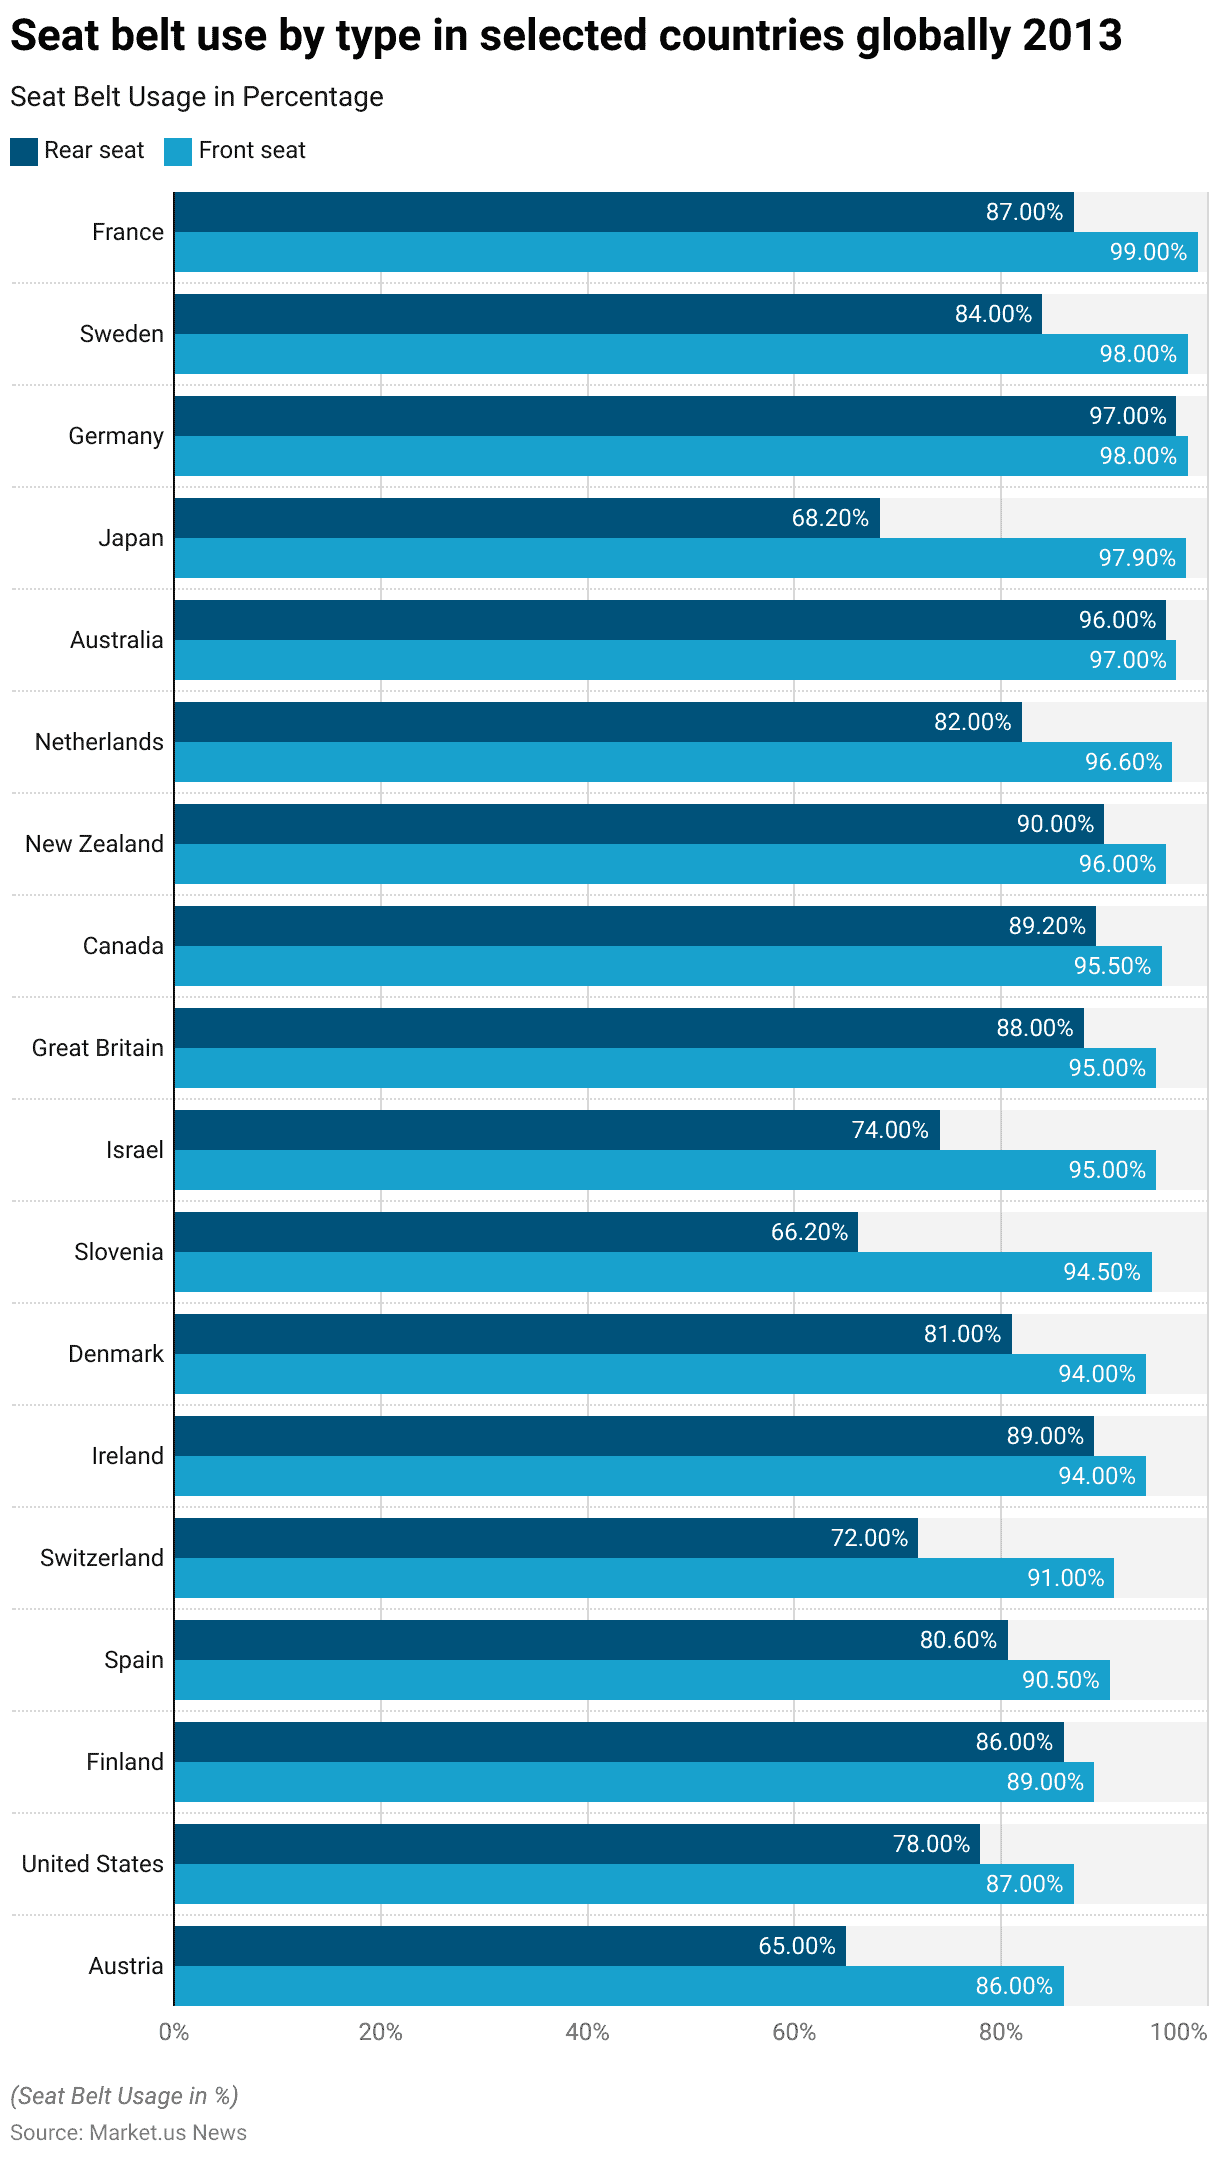
- In 2013, seat belt usage rates in selected countries worldwide showed considerable variation between rear and front seat occupants.
- Austria reported a 65% usage rate in the rear seat and 86% in the front seat. In the United States, the rates were 78% for the rear and 87% for the front. Finland exhibited higher usage, with 86% in the rear and 89% in the front.
- Spain’s rates were 80.6% for the rear seat and 90.5% for the front seat. Switzerland reported 72% rear seat belt use and 91% front seat use. In Ireland, the rates were 89% for the rear and 94% for the front.
- Denmark and Slovenia had similar front seat rates of 94%, with rear seat usage at 81% and 66.2%, respectively. Israel’s rates were 74% for the rear and 95% for the front, while Great Britain reported 88% for the rear and 95% for the front.
More Car Safety Statistics
- Canada had a rear seat belt use rate of 89.2% and 95.5% for the front. New Zealand showed 90% rear seat usage and 96% front seat usage.
- The Netherlands reported 82% for the rear and 96.6% for the front. Australia’s rates were notably high at 96% for the rear and 97% for the front. Japan had 68.2% rear seat belt use and 97.9% front seat use.
- Germany exhibited a high rate of 97% for the rear and 98% for the front. Sweden’s rates were 84% for the rear and 98% for the front, while France showed 87% for the rear and a leading 99% for the front.
- These figures highlight the varying levels of adherence to seat belt use regulations across different nations, with generally higher compliance in the front seats compared to the rear.
(Source: Statista)
Airbags
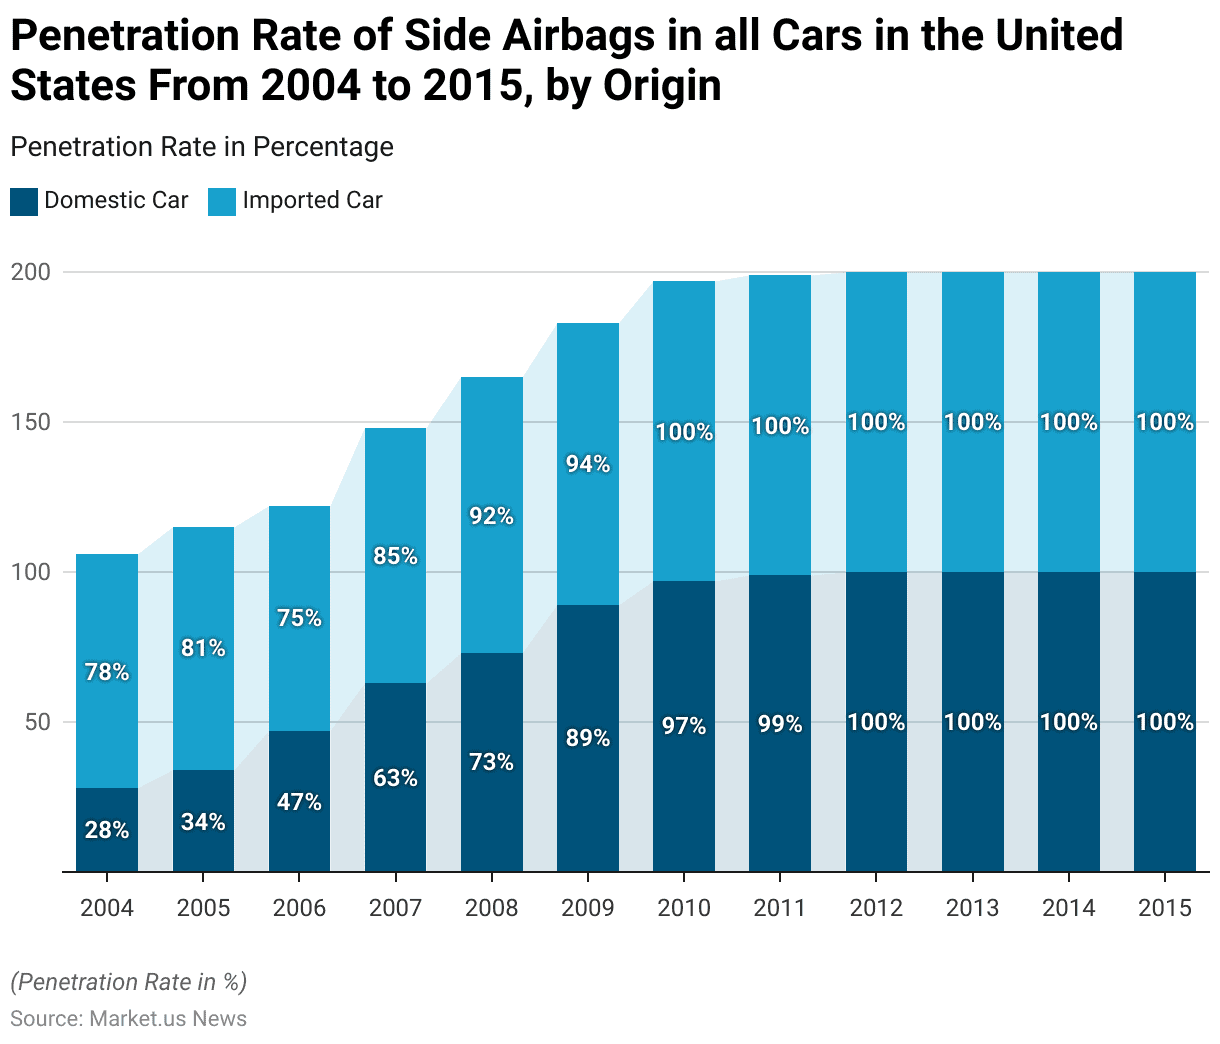
- The penetration rate of side airbags in cars in the United States showed a remarkable increase from 2004 to 2015, with notable differences between domestic and imported vehicles.
- In 2004, side airbags were present in 28% of domestic cars and 78% of imported cars. By 2005, these figures rose to 34% for domestic and 81% for imported cars.
- The trend continued, with 47% of domestic cars and 75% of imported cars equipped with side airbags in 2006.
- In 2007, the rates increased to 63% for domestic and 85% for imported cars. By 2008, 73% of domestic cars and 92% of imported cars featured side airbags.
- A significant jump occurred in 2009, with 89% of domestic cars and 94% of imported cars having side airbags.
- The penetration rate for domestic cars reached 97% in 2010, matching the 100% rate for imported cars.
- From 2011 onwards, side airbags were ubiquitous in both domestic and imported cars, with both achieving a 100% penetration rate.
- This data highlights the rapid adoption and standardization of side airbags in the U.S. automotive market over a decade.
(Source: Statista)
Crumple Zones
- The concept of the crumple zone was first devised and patented by Béla Barényi, a Hungarian engineer who later joined Mercedes-Benz, initially in 1937 and further developed in 1952.
- A study conducted by the British Motor Insurance Repair Research Centre revealed that 65% of vehicle impact damage occurs from front impacts, 25% from rear impacts, and 5% each from left-side and right-side impacts.
- In a demonstration aired on September 10, 2009, on ABC News programs like Good Morning America and World News, the U.S. Insurance Institute for Highway Safety conducted a crash test.
- The test involved a 2009 Chevrolet Malibu colliding offset head-on with a 1959 Chevrolet Bel Air sedan, vividly illustrating the superior safety benefits of modern car designs, particularly highlighting advancements in rigid passenger safety cells and crumple zones.
- In 1951, Béla Barényi patented his design ideas under patent DBP 854.157, which became widely recognized as the “crumple zone.” Barényi is credited as the pioneer of passive safety measures.
- During the 1990s, Volvo introduced its Side Impact Protection System (SIPS), incorporating a crumple zone to enhance occupant safety during side collisions. This technology has since become standard across Volvo’s vehicle lineup.
- Crumple zones have significantly contributed to improving road safety in Australia. Since 1975, annual road fatalities have declined from 26.59 per 100,000 people to just 4.92 in 2014, largely due to the implementation of crumple zone technology.
(Source: Autospeed, ABC News, Autoblog, British Motor Insurance Repair Research Centre Study, Fleetcare)
Booster Seat
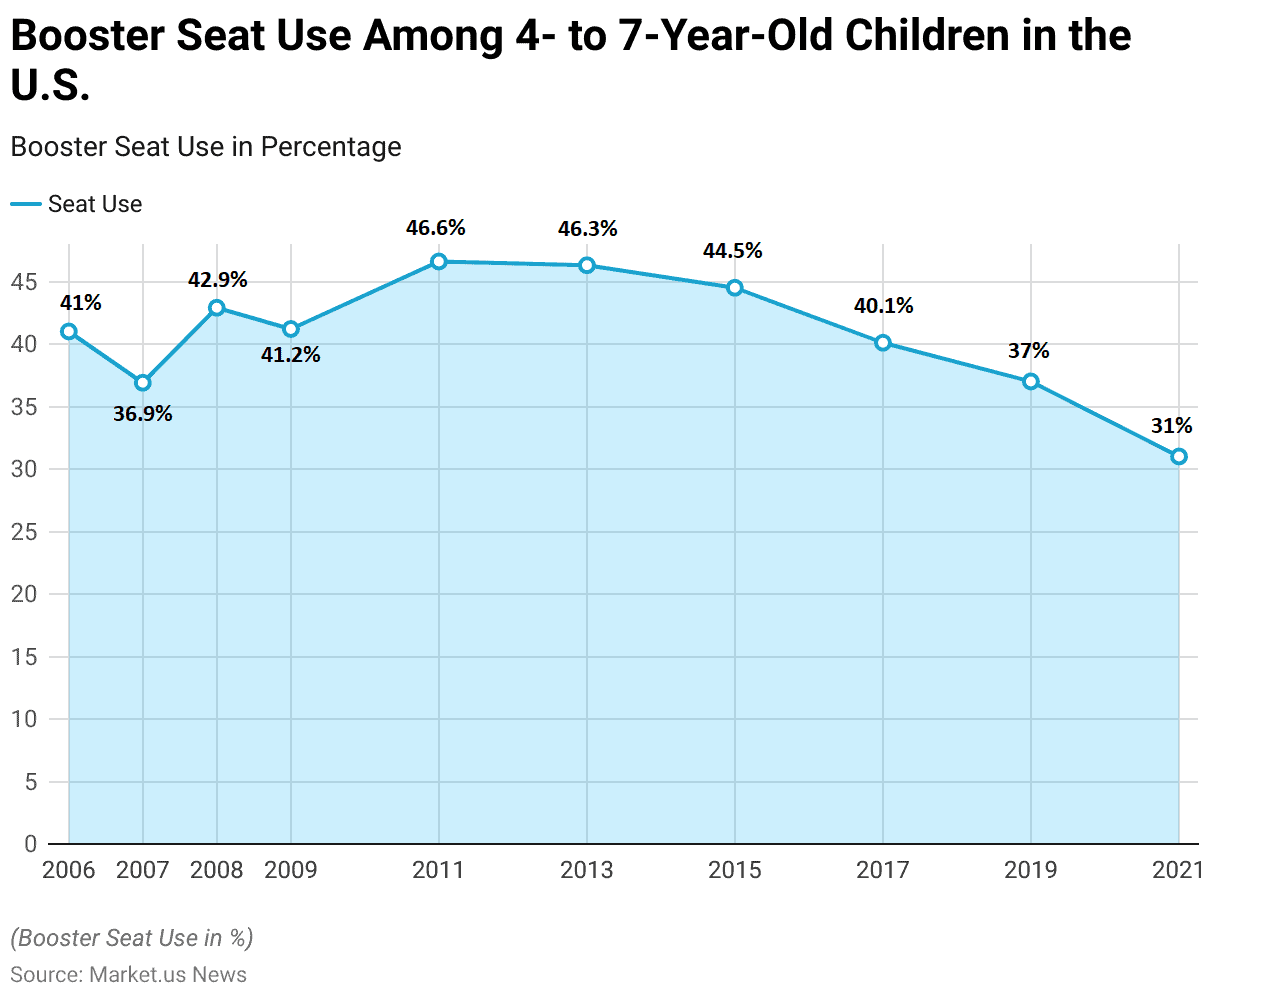
- The use of booster seats among 4- to 7-year-old children in the United States has fluctuated significantly from 2006 to 2021.
- In 2006, 41% of children in this age group used booster seats.
- This percentage decreased slightly to 36.9% in 2007 before increasing to 42.9% in 2008.
- The rate dropped again to 41.2% in 2009.
- By 2011, booster seat usage had risen to 46.6%, maintaining a relatively high rate of 46.3% in 2013.
- However, the trend began to decline, with 44.5% in 2015 and further to 40.1% in 2017.
- The downward trend continued at 37% in 2019, and by 2021, the usage rate had fallen to 31%.
- This data indicates a notable decline in booster seat use over the 15 years despite intermittent increases.
(Source: The 2021 National Survey of the Use of Booster Seats)
Autonomous Driving Car Safety Statistics
Adoption of Autonomous Driving in Newly Registered Car Safety Statistics
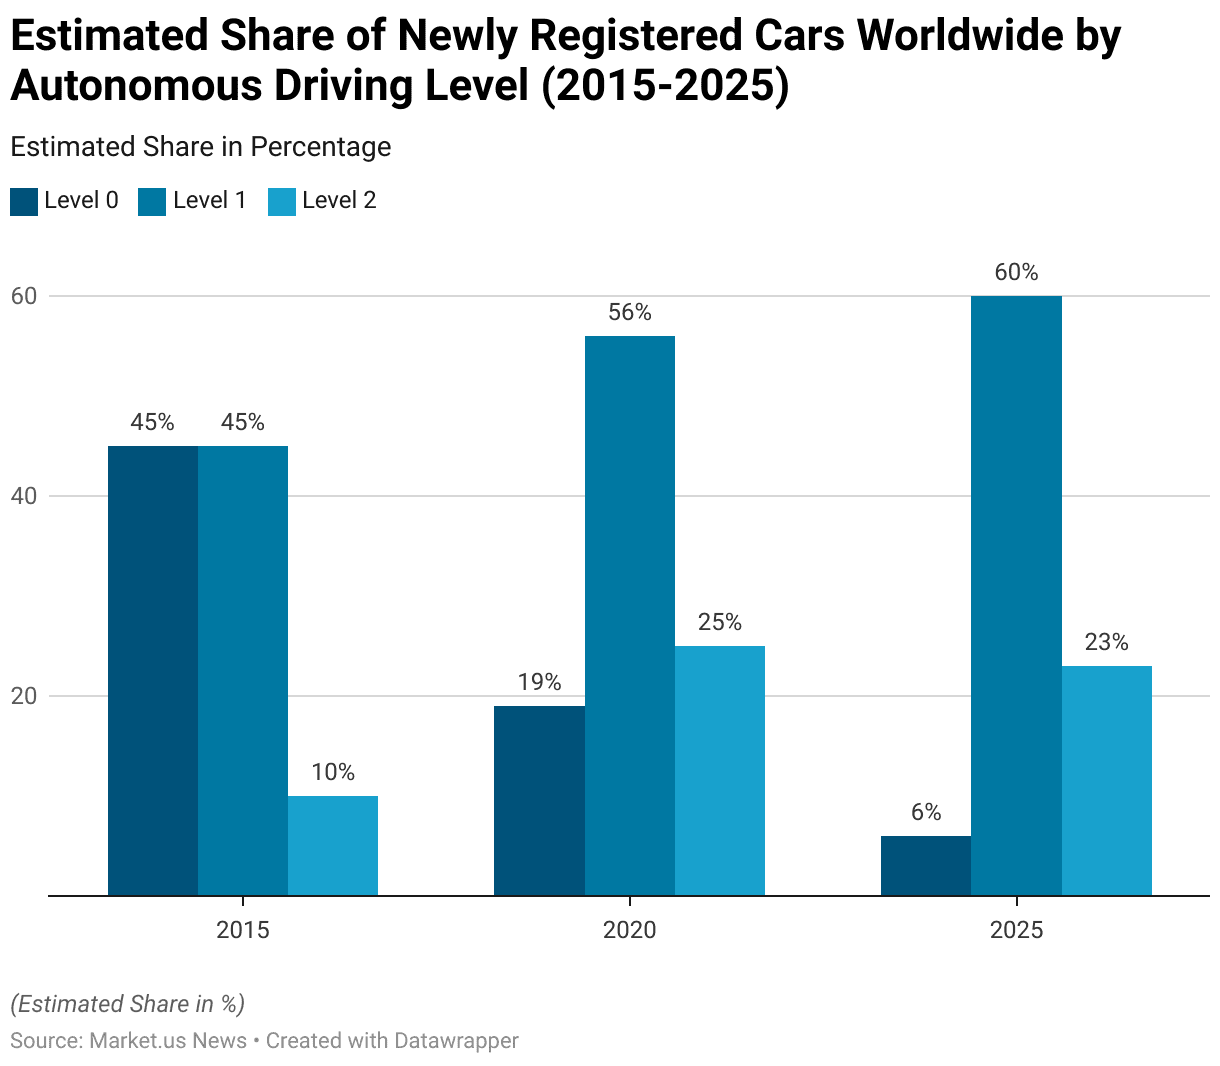
- The estimated share of newly registered cars worldwide by autonomous driving level from 2015 to 2025 demonstrates a significant shift towards higher levels of automation.
- In 2015, cars with Level 0 (no automation) constituted 45% of new registrations, while Level 1 (driver assistance) and Level 2 (partial automation) cars accounted for 45% and 10%, respectively.
- By 2020, the share of Level 0 cars had decreased to 19%, whereas Level 1 cars increased to 56%, and Level 2 cars saw a substantial rise to 25%.
- Projections for 2025 indicate a further decline in Level 0 cars to just 6%, while Level 1 cars are expected to represent 60% of new registrations. Level 2 cars are anticipated to hold a 23% share.
- This trend reflects the automotive industry’s rapid advancements toward incorporating more autonomous driving features in new vehicles.
(Source: Statista)
Concerns About Self-Driving Cars
- A survey on the reluctance to use self-driving cars revealed several key concerns among respondents.
- The most significant reason, cited by 50% of respondents, was that they wouldn’t feel safe in a self-driving car.
- Following this, 45% of respondents expressed a desire to maintain control at all times, and 43% were worried about the potential for the car to make mistakes.
- For 30% of respondents, driving was considered a pleasure they did not wish to forgo.
- Additionally, 27% felt they did not know enough about the technology, and 26% didn’t trust self-driving cars in mixed-traffic situations.
- Financial concerns also played a role, with 25% unwilling to pay for self-driving functionality.
- Lastly, 23% of respondents were concerned about the possibility of the car being hacked.
- These findings highlight a range of safety, control, knowledge, trust, financial, and security concerns that contribute to the reluctance to adopt self-driving technology.
(Source: Statista)
Consumer Preferences and Trends in Car Safety Statistics
- 91% of Indian customers want cars to undergo crash tests and receive safety ratings.
- For 47.6% of customers, safety is the top priority over other car features.
- Crash ratings are the foremost consideration in car purchasing decisions, with fuel efficiency coming in third.
- 91% believe that providing incentives for cars with safety features would be very effective.
- Only 30% of customers are knowledgeable about separate safety ratings for child/rear occupants.
- A 5-star crash rating is the most favored among car buyers. The crash rating of a car is the most influential factor in purchase decisions, holding an importance score of 22.3%, followed by the number of airbags at 21.6%. Fuel efficiency ranks third with an importance score of 15.0%.
- When it comes to crash ratings, 22.2% of customers prefer a 5-star rating, while 21.3% favor a 4-star rating. A zero rating is the least popular, with only 6.8% support.
- While 76% of customers are aware of the existence of two sets of 5-star safety ratings for crash tests, only 30% can identify the rating for child/rear occupant safety as one of them.
(Source: Skoda Auto)
Initiatives to Promote Car Safety Statistics
- Various initiatives are being implemented worldwide to promote car safety.
- In the United States, the National Roadway Safety Strategy emphasizes a Safe System Approach, focusing on safer roads, safer vehicles, and safer speeds.
- It includes initiatives like updating safety manuals and promoting safety culture among state departments of transportation.
- In Australia, the government has committed $33.4 billion over four years to improve road safety through infrastructure investments, grants for sector-led initiatives, and programs like the Car Safety Ratings Program, which supports independent vehicle safety assessments and promotes consumer awareness.
- Globally, the Bloomberg Philanthropies Initiative for Global Road Safety funds projects aimed at strengthening road safety policies and implementing evidence-based interventions.
- These efforts collectively aim to reduce road fatalities and improve vehicle safety standards, demonstrating a comprehensive approach to enhancing car safety across different regions.
(Source: United States Department of Transportation, National Road Safety Strategy, Global Road Safety Partnership)
Technological Advancements in Car Safety Statistics
- Technological advancements in car safety have seen significant progress, with various companies introducing innovative features to enhance vehicle safety.
- Adaptive Cruise Control (ACC) has evolved to include stop-and-go functionality, allowing vehicles to handle congested traffic more effectively.
- Blind Spot Monitoring systems now cover larger areas with improved accuracy, reducing the risk of lane-change accidents.
- Additionally, 360-degree cameras provide drivers with a complete view of their surroundings, enhancing safety during parking and tight maneuvers.
- Companies like XYZ Motors and ABC Automakers are leading the way with models like the Sentinel 2024 and Safeguard SUV, incorporating these advanced safety technologies.
- These innovations are complemented by Vehicle-to-Everything (V2X) communication systems that enable real-time information exchange about road conditions and potential hazards, further boosting road safety.
(Sources: rinf.tech., David Altmejd)
Car Safety Regulations
- Car safety regulations vary significantly by country, reflecting different standards and priorities.
- In the United States, the National Highway Traffic Safety Administration (NHTSA) mandates safety features such as seat belts, airbags, electronic stability control, and the LATCH child safety seat system. Recent proposals include the potential requirement for vehicle-to-vehicle communication technology.
- In the European Union, regulations are more stringent, mandating advanced systems like automatic emergency braking, lane-keeping assistance, and intelligent speed assistance.
- Countries like Japan and Australia also enforce strict safety standards, including advanced driver assistance systems.
- These diverse regulations aim to reduce traffic fatalities and enhance vehicle safety globally, influencing car manufacturers to integrate various safety technologies into their models.
(Sources: The Automotive Regulatory, The News Wheel)
Recent Developments
Acquisitions and Mergers:
- ZF acquires WABCO: In early 2023, ZF Friedrichshafen AG completed its $7 billion acquisition of WABCO, a global supplier of braking control systems. This acquisition aims to enhance ZF’s capabilities in vehicle safety systems and advanced driver-assistance systems (ADAS), providing integrated safety solutions for commercial vehicles.
- Aptiv acquires Wind River: Aptiv acquired Wind River, a leader in software for intelligent systems, for $4.3 billion in mid-2023. This merger is expected to strengthen Aptiv’s position in the market for automotive safety and autonomous driving technologies.
New Product Launches:
- Bosch’s Advanced Driver Assistance System (ADAS): In late 2023, Bosch introduced a new generation of its ADAS, featuring improved sensors, AI-based data processing, and enhanced functionality for autonomous driving. This system aims to increase safety by providing real-time hazard detection and response.
- Volvo’s Safe Space Technology: Volvo launched its Safe Space Technology in early 2024, which includes new interior airbags, advanced collision avoidance systems, and automated emergency braking designed to protect passengers in various crash scenarios.
Funding:
- Waymo secures $2.5 billion: In 2023, Waymo, a subsidiary of Alphabet Inc. focused on autonomous driving technology, raised $2.5 billion to expand its research and development efforts, improve its vehicle safety systems, and accelerate the deployment of self-driving cars.
- Nuro raises $600 million: Nuro, an autonomous delivery vehicle company, secured $600 million in early 2024 to enhance its safety features and expand its fleet of self-driving delivery vehicles, aiming to provide safer and more efficient last-mile delivery services.
Technological Advancements:
- AI and Machine Learning in Safety Systems: AI and machine learning are increasingly being integrated into vehicle safety systems to improve real-time decision-making. Enhance predictive analytics for crash avoidance, and provide personalized safety features based on driver behavior.
- Vehicle-to-Everything (V2X) Communication: Advances in V2X communication technology are enabling vehicles to communicate with each other and with infrastructure, providing real-time information about road conditions, traffic, and potential hazards, thereby improving overall road safety.
Market Dynamics:
- Growth in Automotive Safety Market: The global automotive safety market is projected to grow at a CAGR of 9.3% from 2023 to 2028, driven by increasing demand for advanced safety features, regulatory mandates for vehicle safety, and the rise of autonomous vehicles.
- Increased Adoption of ADAS: There is a significant increase in the adoption of ADAS features, such as lane departure warning. Adaptive cruise control, and automatic emergency braking, as consumers and regulators prioritize vehicle safety.
Regulatory and Strategic Developments:
- EU’s General Safety Regulation: The European Union’s General Safety Regulation, which came into effect in 2024, mandates advanced safety technologies in new vehicles. Including intelligent speed assistance, advanced emergency braking, and lane-keeping systems, to enhance road safety.
- US NHTSA Safety Standards: The National Highway Traffic Safety Administration (NHTSA) in the US issued new safety standards in early 2024, focusing on the implementation of advanced crash avoidance technologies and stricter crashworthiness criteria to protect vehicle occupants.
Research and Development:
- Crash Simulation and Testing: R&D efforts are focusing on improving crash simulation and testing technologies to develop more robust and effective safety features, using advanced modeling techniques and high-performance computing to predict and mitigate crash impacts.
- Enhanced Driver Monitoring Systems: Researchers are developing advanced driver monitoring systems that use cameras, sensors, and AI to detect signs of driver fatigue, distraction, and impairment, providing alerts and taking preventive measures to avoid accidents.
Conclusion
Car Safety Statistics – In conclusion, the car safety landscape is rapidly evolving. Driven by technological advancements and heightened awareness of vehicle safety features.
The global car safety market is projected to grow significantly, with major investments in active and passive safety technologies.
Despite regional disparities in traffic-related fatalities and injuries, efforts to improve road safety continue worldwide.
While seat belt and side airbag usage show positive trends, challenges remain, particularly in the acceptance of self-driving cars.
Concerns about safety, control, and reliability persist, requiring rigorous testing and transparent communication to build public trust.
Additionally, declining booster seat use among children and the need for robust cybersecurity measures for autonomous vehicles highlight areas for further focus.
Overall, a multifaceted approach combining innovation, regulation, and public education is essential for creating safer roads and vehicles.
FAQs
Car safety is crucial as it helps prevent accidents and reduces the severity of injuries when accidents occur. Effective safety features protect drivers, passengers, and pedestrians, ultimately saving lives and reducing medical costs.
Key safety features include seat belts, airbags (front, side, and curtain), anti-lock braking systems (ABS), electronic stability control (ESC), traction control, rear-view cameras, blind-spot detection, and collision avoidance systems.
Airbags provide a cushioning effect during collisions, reducing the impact on passengers. They work in conjunction with seat belts to prevent serious injuries by protecting the head, neck, and torso.
Active safety features are designed to prevent accidents (e.g., ABS, ESC, traction control), while passive safety features protect occupants during a crash (e.g., seat belts, airbags, crumple zones).
Efforts include implementing stricter safety regulations, enhancing vehicle safety standards, improving road infrastructure, promoting public awareness campaigns, and encouraging the adoption of advanced driver-assistance systems (ADAS).


