Table of Contents
- Introduction
- Editor’s Choice
- Confectionery Market Statistics
- Confectionery & Snacks Market Statistics
- Chocolate Confectionery Market Overview
- Confectionery Sales Statistics
- Confectionery Average Revenue Per Capita Worldwide Statistics
- Confectionery Price Statistics
- Age-related Dynamics of Confectionery Consumers Statistics
- Generation-related Dynamics of Confectionery Consumers Statistics
- Gender-related Dynamics of Confectionery Consumers
- Consumer Preferences and Trends
- Impact of COVID-19
- Related Emerging Markets
- Emerging Trends
- Regulations for Confectionery Products Statistics
- Recent Developments
- Conclusion
- FAQs
Introduction
Confectionery Statistics: The confectionery industry encompasses a diverse range of sweet products. Categorized into sugar-based items like candies and chocolates and non-sugar alternatives such as sugar-free snacks.
Key ingredients include various sweeteners, flavorings, and texturizers, with production processes involving cooking, molding, and coating.
Further, Current market trends highlight a growing demand for healthier options, premium products, and sustainable practices.
The global market is projected to grow significantly, driven by rising disposable incomes, particularly in North America, Europe, and Asia-Pacific.
Additionally, compliance with food safety and labeling regulations is essential for market access and consumer trust.
Editor’s Choice
- The global confectionery market revenue is projected to reach USD 762.60 billion in 2029.
- In 2023, the global confectionery market witnessed significant revenue generation across various countries. China led the market with an estimated revenue of USD 79.56 billion.
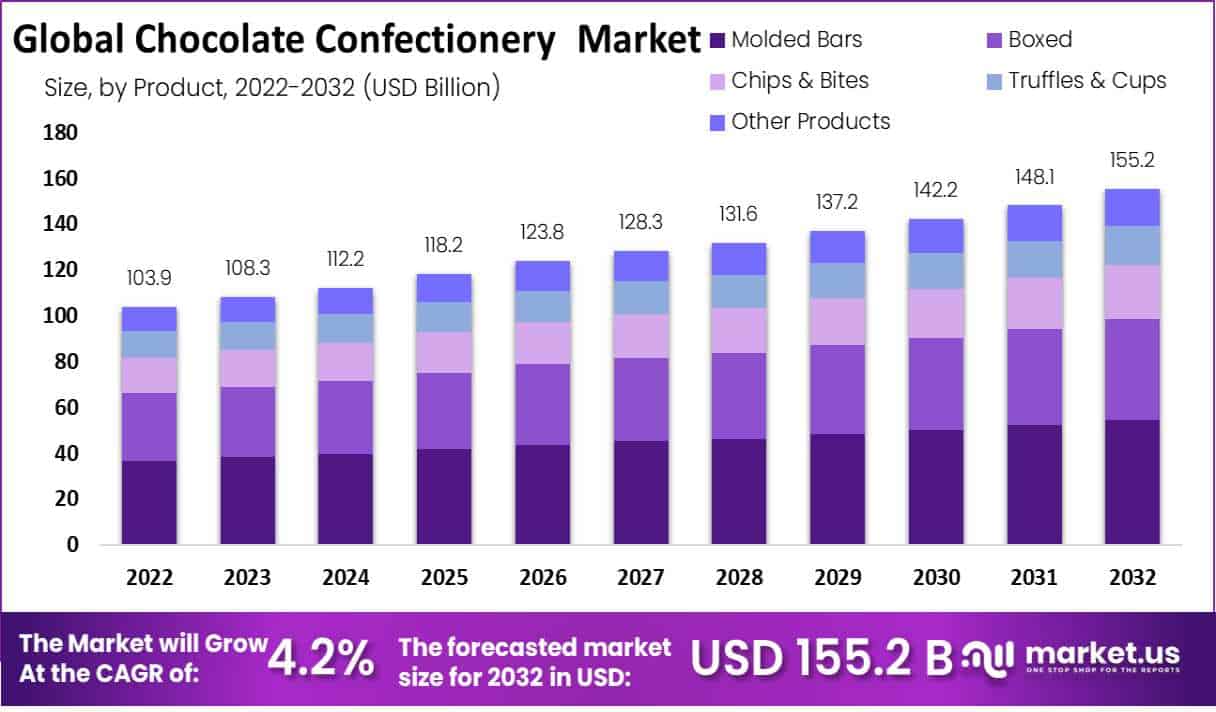
- The global chocolate confectionery market revenue is projected to reach USD 316.3 billion by 2028.
- In 2023, the age distribution of consumers in the U.S. confectionery market reveals that individuals aged 35-44 represented the largest share of the market at 23%.
- As of August 2023, the primary factors influencing snack brand preferences in Indonesia were dominated by taste. With 75% of respondents favoring brands, they perceived as tasting better than others.
- Further, as of March 2020, the COVID-19 pandemic had a varied impact on the purchase volume of bakery, biscuits, and chocolate in Thailand. Among respondents, 43% indicated they would maintain their current purchasing levels.
- Between 2013 and 2017, the global confectionery market saw a significant increase in product launches targeting vegan and vegetarian consumers. Further, vegan confectionery product launches experienced a remarkable growth of 140%, reflecting a strong trend toward plant-based and animal-free options.
Confectionery Market Statistics
Global Confectionery Market Size Statistics
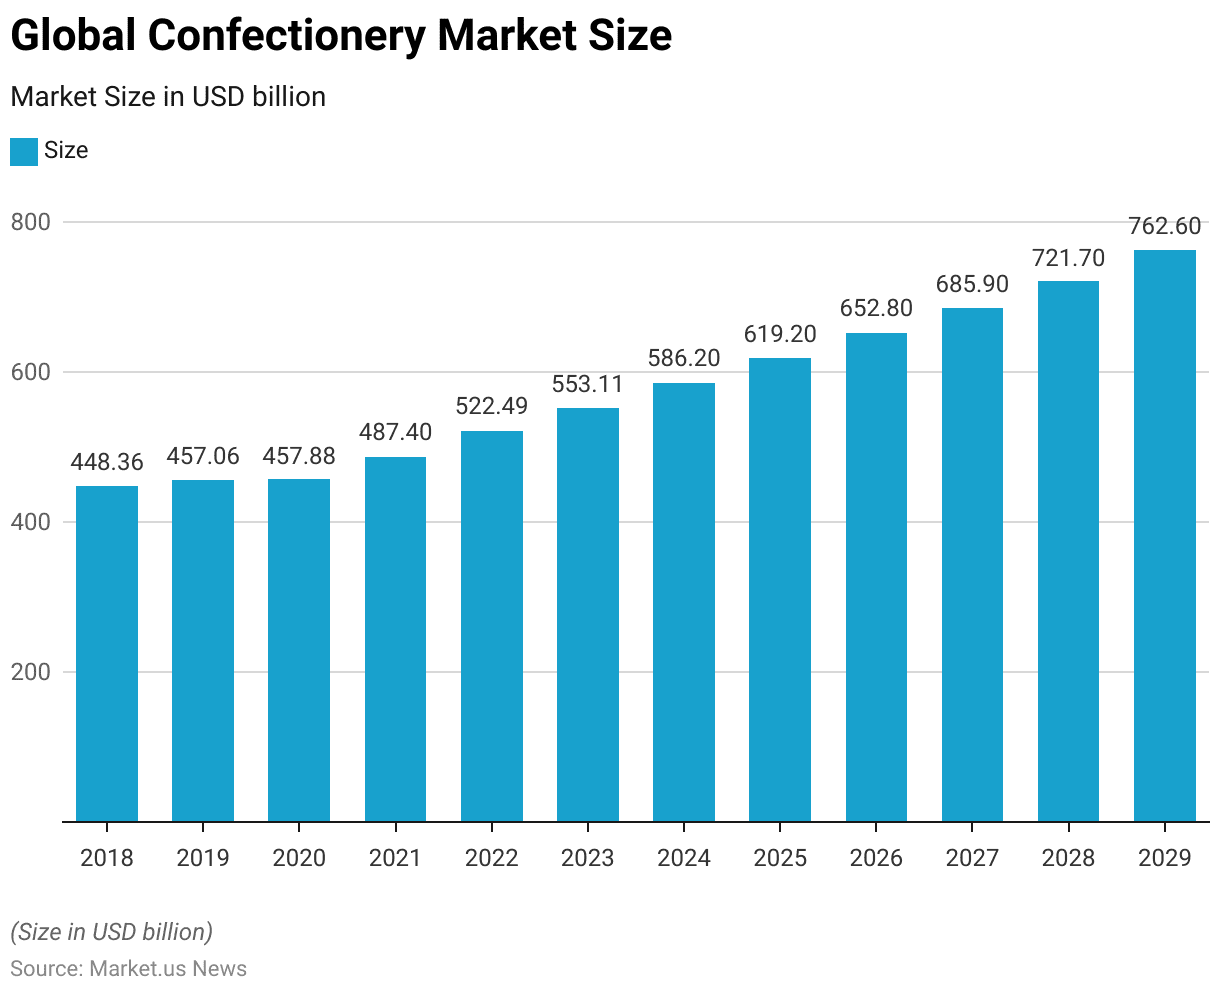
- The global confectionery market has shown a consistent upward trajectory from 2018 through to projected figures in 2029 at a CAGR of 5.40%.
- In 2018, the market was valued at approximately USD 448.36 billion.
- This figure rose to USD 457.06 billion in 2019, followed by a slight increase to USD 457.88 billion in 2020.
- The market experienced a more pronounced growth from 2021 onward. Reaching USD 487.40 billion in 2021 and subsequently climbing to USD 522.49 billion in 2022.
- By 2023, the market value had escalated to USD 553.11 billion.
- The upward trend is expected to continue, with projections for 2024 placing the market at USD 586.20 billion and a further increase to USD 619.20 billion in 2025.
- The market is anticipated to grow to USD 652.80 billion in 2026 and USD 685.90 billion in 2027.
- The forecast suggests sustained growth, reaching USD 721.70 billion by 2028 and achieving a market size of USD 762.60 billion by 2029.
- This steady growth pattern reflects the expanding demand and market penetration of confectionery products globally.
(Source: Statista)
Global Confectionery Market Revenue – By Segment Statistics
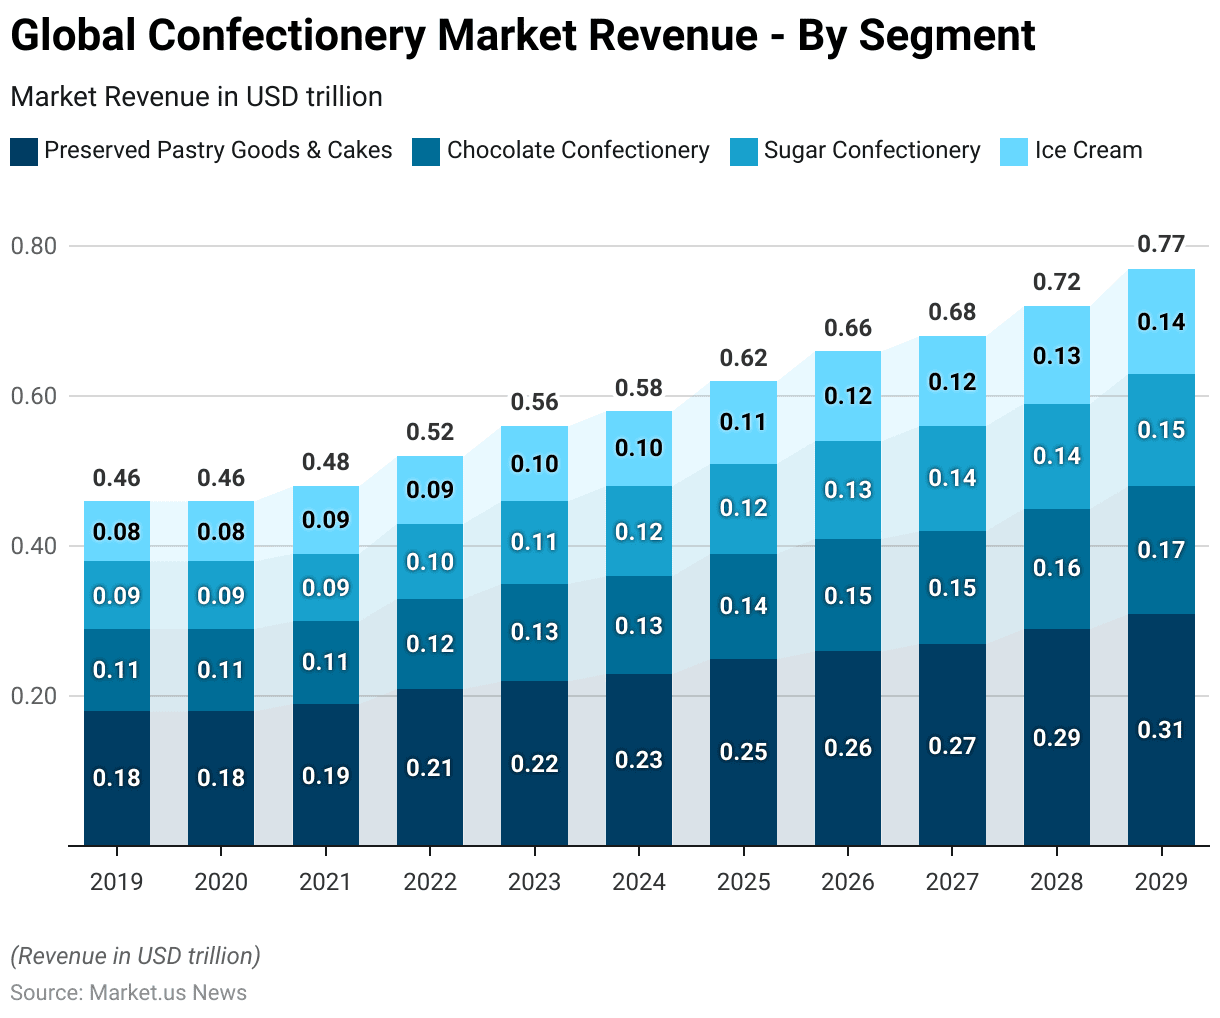
- Moreover, the global confectionery market is segmented by product categories, revealing a consistent increase in revenue from 2019 to 2029 across preserved pastry goods and cakes, chocolate confectionery, sugar confectionery, and ice cream.
- In 2019, preserved pastry goods and cakes contributed USD 0.18 trillion. A figure that remained stable through 2020 before experiencing gradual growth in subsequent years. Reaching an anticipated USD 0.31 trillion by 2029.
- Chocolate confectionery began with a market size of USD 0.11 trillion in 2019 and 2020. Gradually increasing year over year to reach USD 0.17 trillion by 2029.
- Sugar confectionery started at USD 0.09 trillion in 2019. Showing steady growth to a projected USD 0.15 trillion by 2029.
- Ice cream, beginning with a revenue of USD 0.08 trillion in 2019. Experienced moderate increases each year, reaching USD 0.14 trillion by 2029.
- These projections underscore a gradual but steady expansion across all confectionery segments. Reflecting growing consumer demand and market expansion in various regions.
(Source: Statista)
Confectionery Market Revenue Change – By Segment Statistics
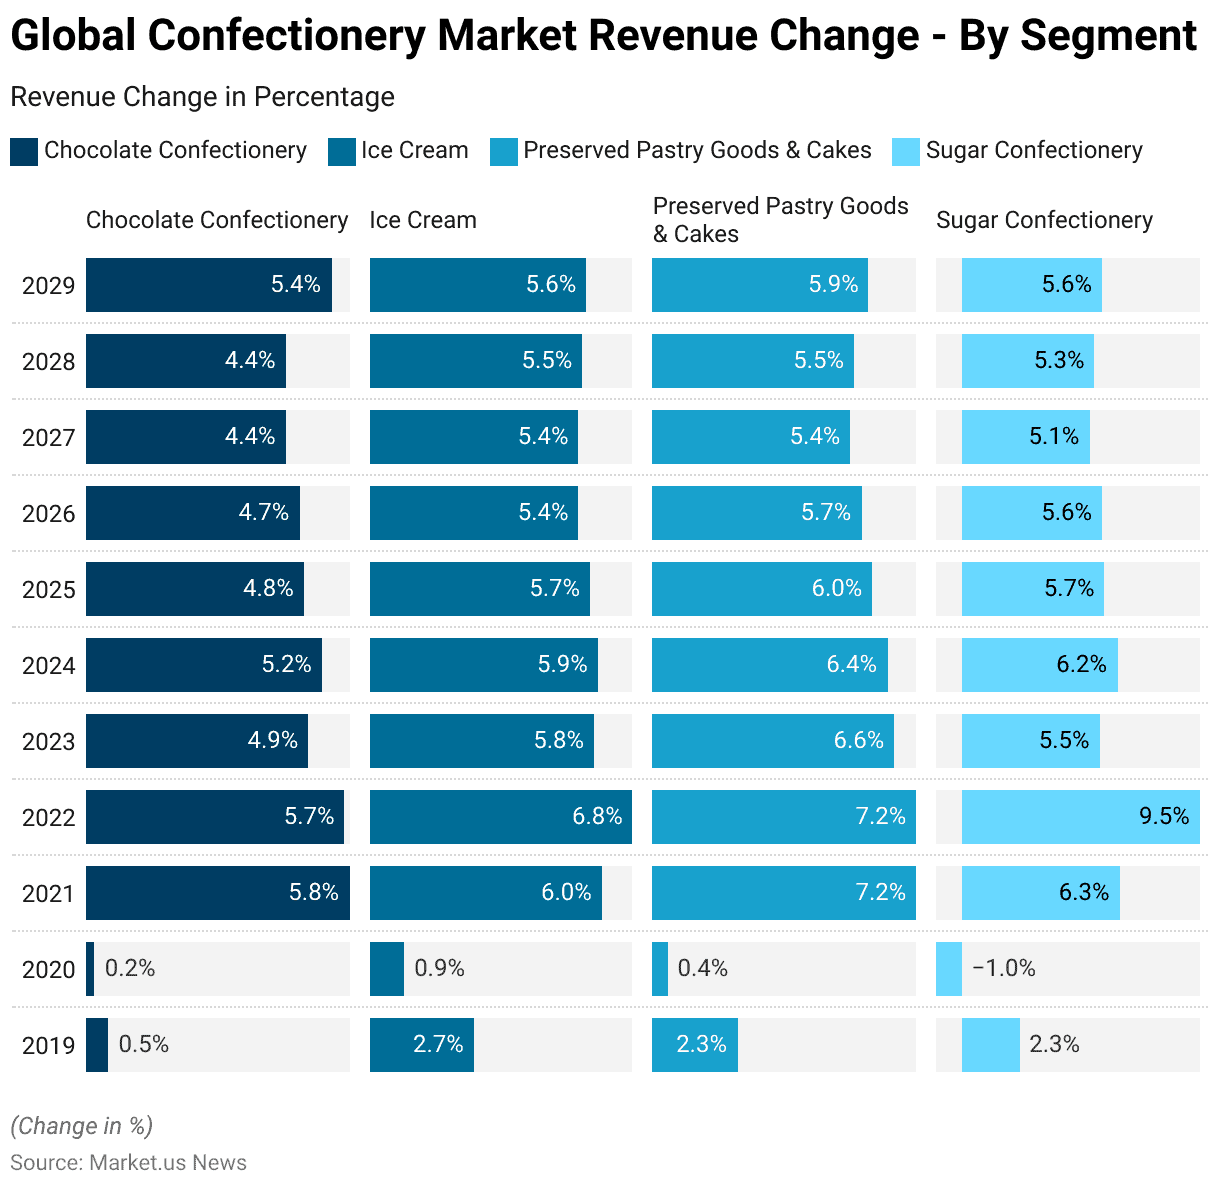
- The global confectionery market has demonstrated varied annual revenue growth rates across different segments. Including chocolate confectionery, ice cream, preserved pastry goods & cakes, and sugar confectionery, from 2019 to 2029.
- In 2019, chocolate confectionery showed modest growth of 0.5%. While ice cream and preserved pastry goods & cakes exhibited higher growth rates of 2.7% and 2.3%, respectively. Sugar confectionery also grew by 2.3% in the same year.
- However, in 2020, growth slowed markedly across all segments. With chocolate confectionery increasing by only 0.2% and preserved pastry goods by 0.4%. Sugar confectionery notably declined by 1.0%, indicating a challenging year for this segment.
- A significant recovery and acceleration were observed in 2021. With chocolate confectionery growing by 5.8%, ice cream by 6.0%, preserved pastry goods by 7.2%, and sugar confectionery by 6.3%.
More Insights
- This positive trend continued into 2022, with preserved pastry goods maintaining a high growth rate of 7.2%, ice cream reaching 6.8%, and sugar confectionery showing the highest growth at 9.5%. Growth rates gradually stabilized over the following years. In 2023, chocolate confectionery grew by 4.9%, ice cream by 5.8%, preserved pastry goods by 6.6%, and sugar confectionery by 5.5%.
- By 2024, these rates slightly fluctuated, with chocolate at 5.2%, ice cream at 5.9%, preserved pastry goods at 6.4%, and sugar confectionery at 6.2%.
- Between 2025 and 2029, each segment exhibited consistent yet moderate growth. Chocolate confectionery’s growth rate fluctuated between 4.4% and 5.4%. Ice cream maintained growth near 5.4%-5.6%, preserved pastry goods stabilized around 5.4%-5.9%, and sugar confectionery around 5.1%-5.6%.
- This data reflects the sector’s resilience, with notable fluctuations due to external factors in 2020 but an overall steady growth trend in subsequent years across all segments.
(Source: Statista)
Global Confectionery Market Share- By Sales Channel Statistics
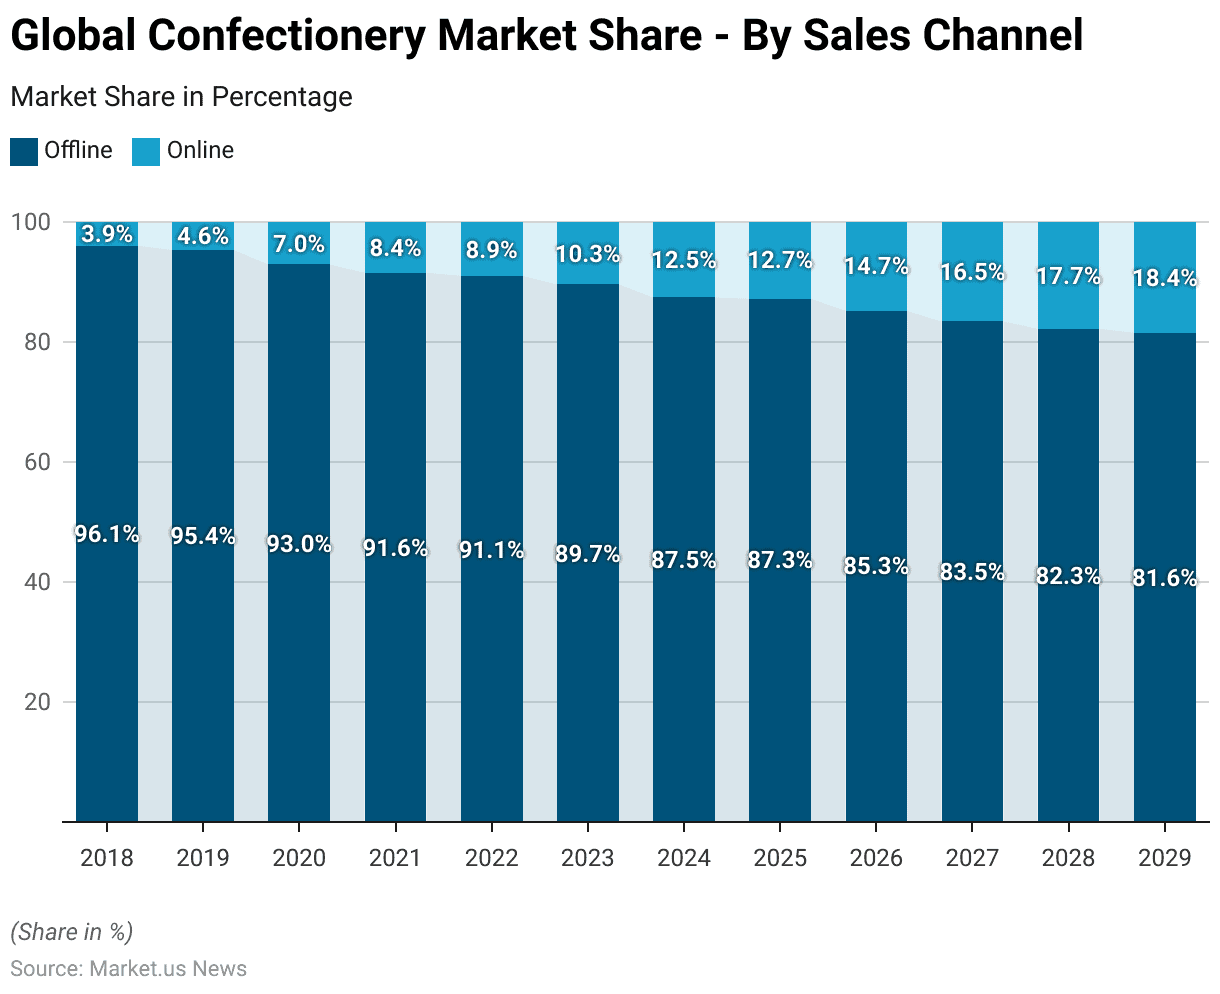
- From 2018 to 2029, the global confectionery market has shown a consistent shift towards online sales channels. Although offline sales continue to dominate.
- In 2018, offline sales commanded a significant majority, accounting for 96.1% of the market, with online sales representing only 3.9%. This trend began to evolve gradually, as offline sales declined to 95.4% in 2019, while online sales increased to 4.6%.
- The transition gained momentum in 2020, when offline sales dropped to 93.0% and online sales rose to 7.0%. This trend continued each year, with offline sales decreasing to 91.6% in 2021 and 91.1% in 2022, while online sales reached 8.4% and 8.9%, respectively.
- By 2023, offline sales reduced further to 89.7%, with online sales crossing the 10% threshold at 10.3%. Forecasts suggest this shift will persist, with offline sales projected to constitute 87.5% in 2024 and online sales expanding to 12.5%.
- The following years indicate a steady decline in offline market share. Expected to reach 85.3% in 2026 and 83.5% in 2027. While online sales continue their upward trend, reaching 14.7% and 16.5%, respectively.
- By 2028, offline sales are anticipated to account for 82.3%, with online sales at 17.7%. In 2029, the online market share is projected to grow to 18.4%. While offline sales are expected to decrease to 81.6%.
- This data indicates a gradual but steady rise in the adoption of online sales channels within the global confectionery market. Reflecting changing consumer preferences, greater access to digital shopping platforms, and increased convenience associated with online purchasing.
(Source: Statista)
Confectionery Market Revenue – By Country Statistics
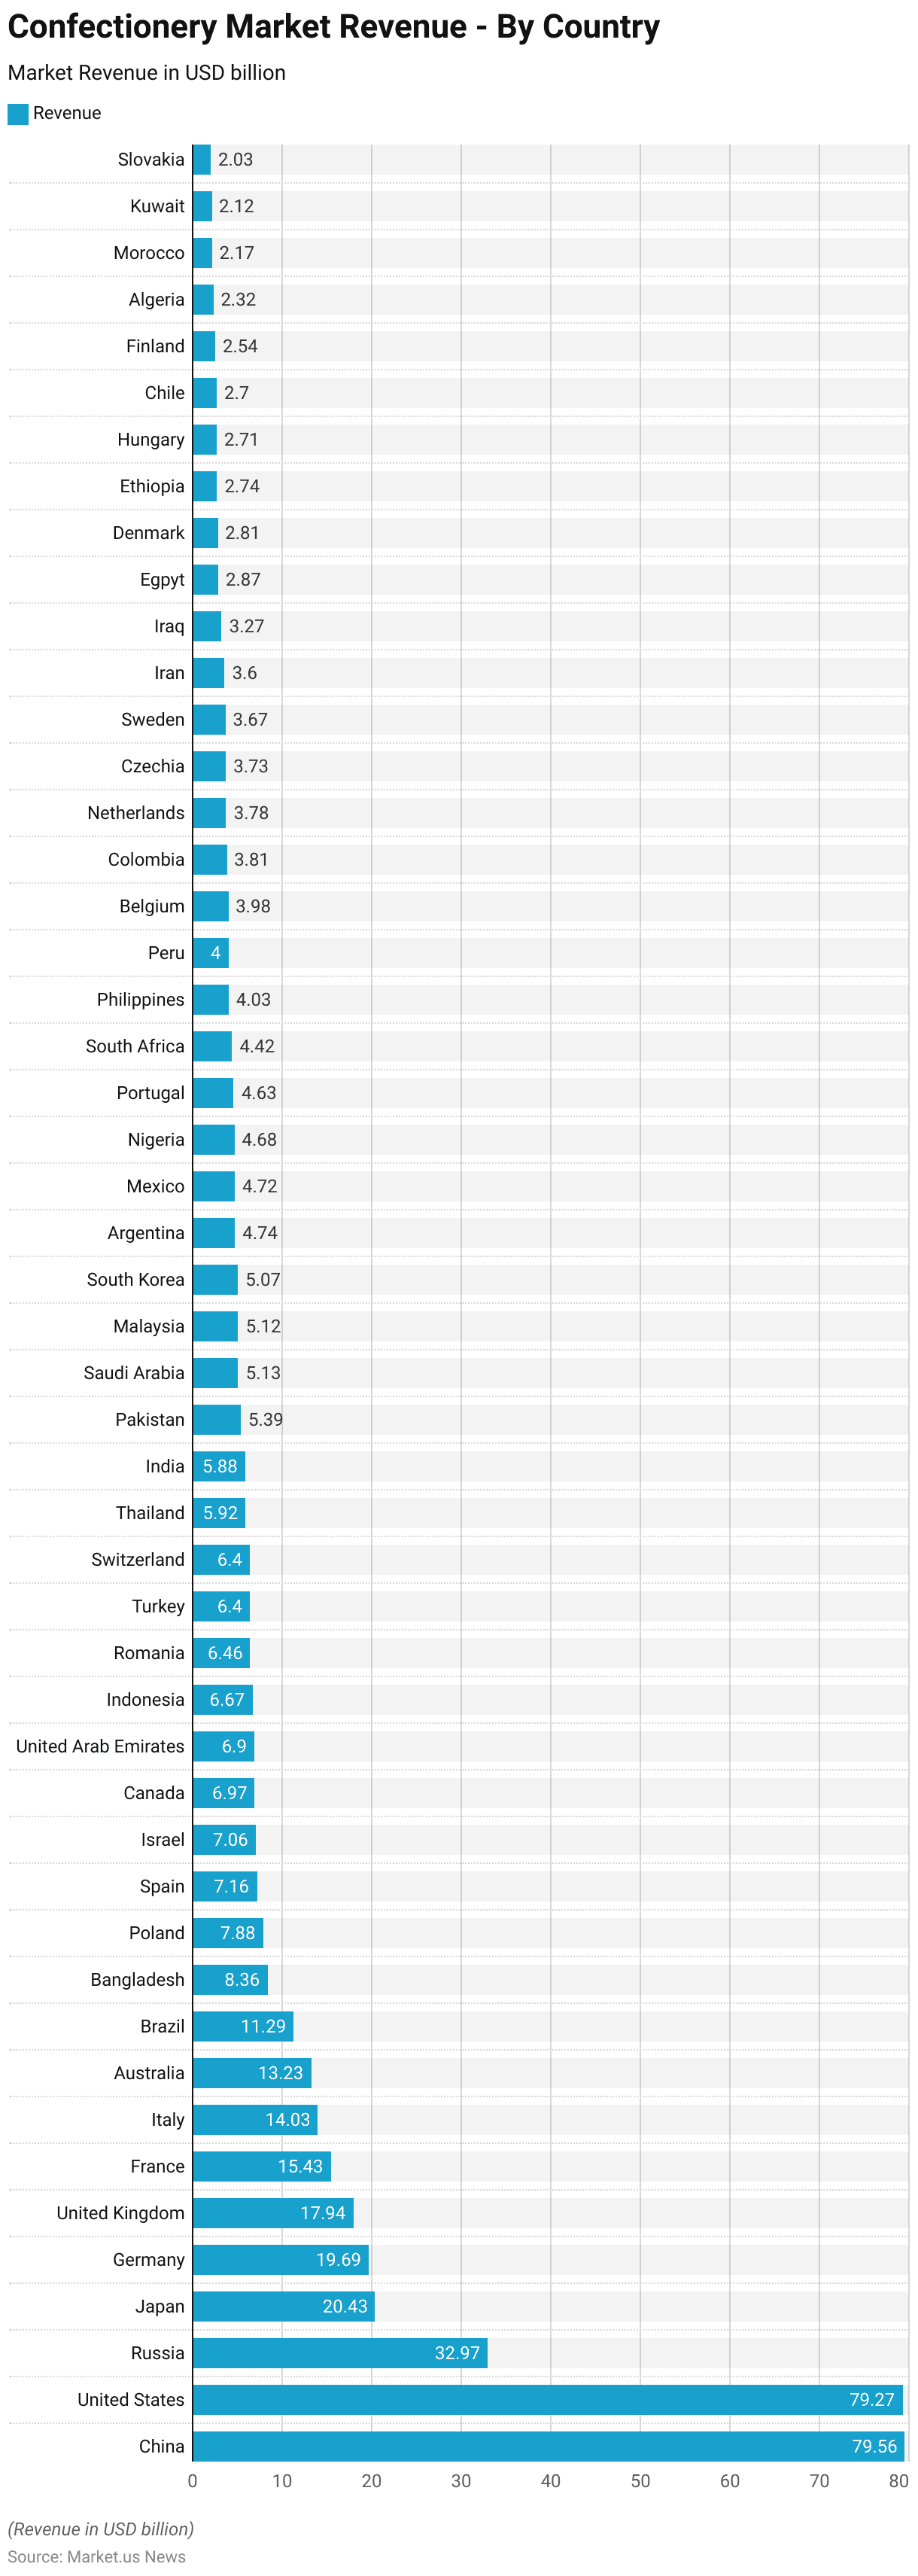
- In 2023, the global confectionery market witnessed significant revenue generation across various countries.
- China led the market with an estimated revenue of USD 79.56 billion. Closely followed by the United States at USD 79.27 billion. Russia held the third position with USD 32.97 billion. While Japan and Germany followed with revenues of USD 20.43 billion and USD 19.69 billion, respectively.
- The United Kingdom contributed USD 17.94 billion, with France generating USD 15.43 billion and Italy USD 14.03 billion. Other major markets included Australia at USD 13.23 billion and Brazil at USD 11.29 billion.
- Several emerging markets also showed considerable revenue figures, such as Bangladesh (USD 8.36 billion), Poland (USD 7.88 billion), and Spain (USD 7.16 billion). Israel and Canada contributed USD 7.06 billion and USD 6.97 billion, respectively. While the United Arab Emirates, Indonesia, and Romania generated between USD 6.4 billion and USD 6.9 billion.
- Turkey and Switzerland each reported USD 6.4 billion, with Thailand at USD 5.92 billion and India close behind at USD 5.88 billion. Pakistan and Saudi Arabia generated USD 5.39 billion and USD 5.13 billion, respectively.
Moreover
- Other countries with notable contributions included Malaysia (USD 5.12 billion), South Korea (USD 5.07 billion), Argentina (USD 4.74 billion), and Mexico (USD 4.72 billion). African markets also played a role, with Nigeria at USD 4.68 billion and South Africa at USD 4.42 billion. Additionally, the Philippines and Peru contributed USD 4.03 billion and USD 4 billion, respectively.
- In Europe, Belgium generated USD 3.98 billion, while Colombia and the Netherlands brought in USD 3.81 billion and USD 3.78 billion. Czechia and Sweden reported around USD 3.7 billion each, with Iran at USD 3.6 billion and Iraq at USD 3.27 billion.
- Smaller but impactful markets included Egypt (USD 2.87 billion), Denmark (USD 2.81 billion), Ethiopia (USD 2.74 billion), and Hungary (USD 2.71 billion). Chile, Finland, Algeria, and Morocco contributed between USD 2.17 billion and USD 2.7 billion, with Kuwait and Slovakia rounding off the list at USD 2.12 billion and USD 2.03 billion, respectively.
- This distribution underscores the global appeal and diverse demand for confectionery products, with significant market penetration in both developed and emerging economies.
(Source: Statista)
Confectionery & Snacks Market Statistics
Global Confectionery & Snacks Market Size Statistics
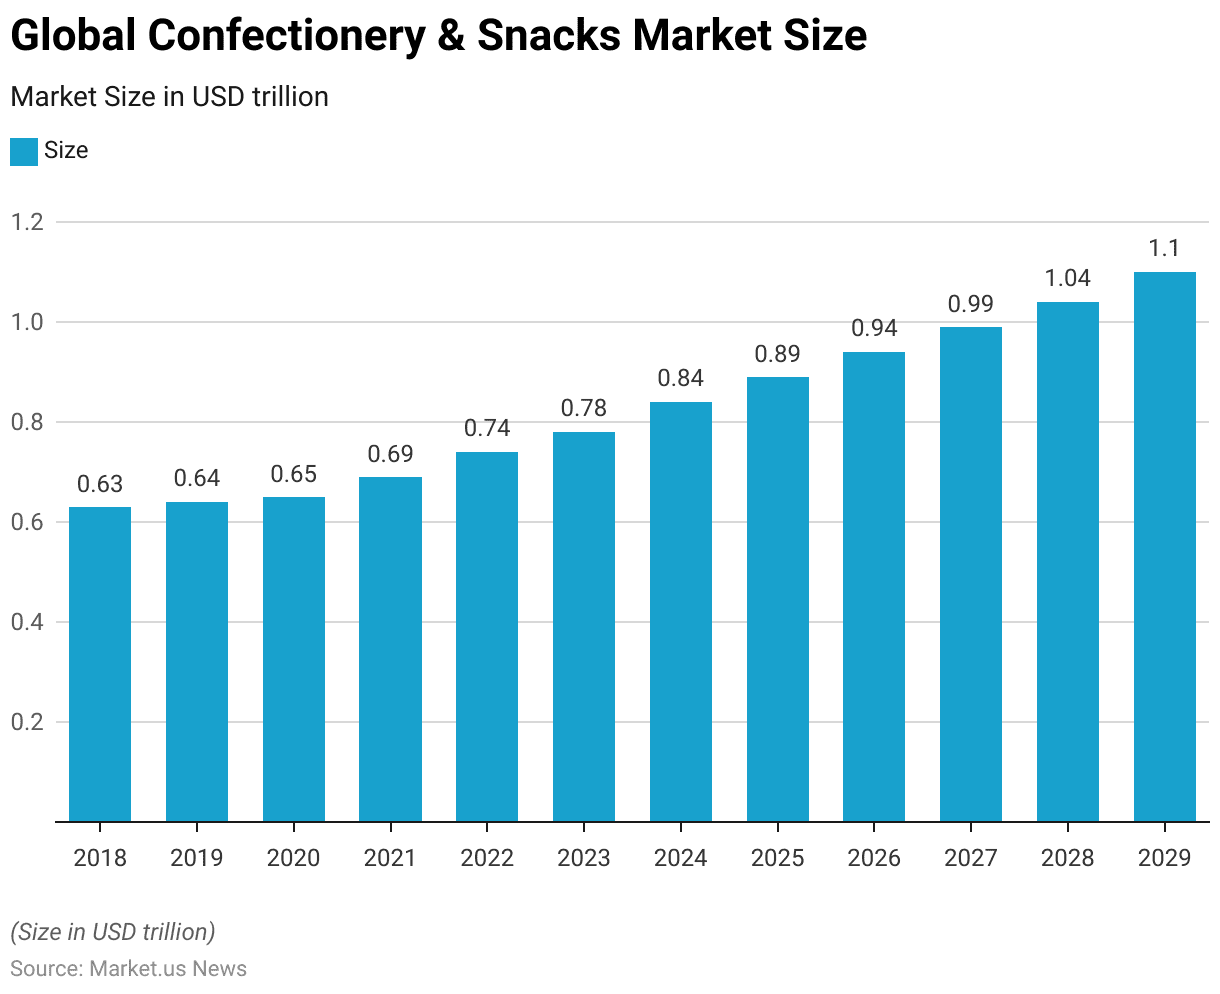
- The global confectionery and snacks market has exhibited steady growth from 2018 to projected figures for 2029. Highlighting a consistent increase in market revenue at a CAGR of 5.54%.
- In 2018, the market generated approximately USD 0.63 trillion. Rising slightly to USD 0.64 trillion in 2019 and reaching USD 0.65 trillion in 2020.
- The market expansion accelerated from 2021 onwards, with revenue climbing to USD 0.69 trillion in 2021 and USD 0.74 trillion in 2022.
- By 2023, the market is estimated to reach USD 0.78 trillion, with continuous growth projected in the following years.
- In 2024, the market is anticipated to generate USD 0.84 trillion. Increasing further to USD 0.89 trillion in 2025 and reaching USD 0.94 trillion in 2026.
- By 2027, the revenue is expected to approach the USD 1 trillion mark at USD 0.99 trillion.
- The upward trajectory continues, with projections for 2028 and 2029 suggesting revenues of USD 1.04 trillion and USD 1.10 trillion, respectively.
- This consistent growth underscores the increasing global demand for confectionery and snacks. Likely driven by rising consumer spending, product diversification, and expanding distribution channels across various regions.
(Source: Statista)
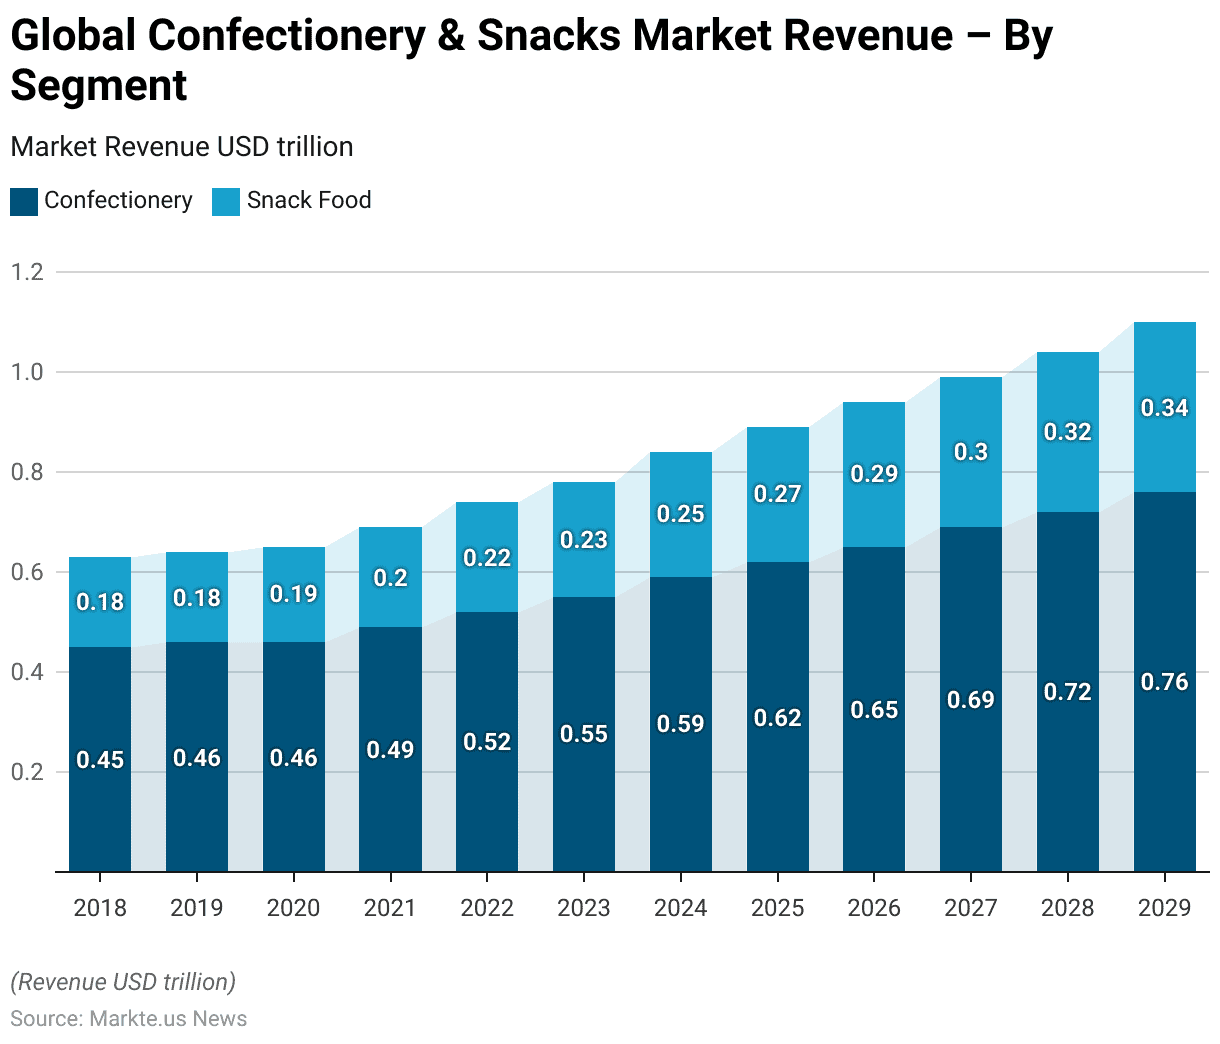
Global Confectionery & Snacks Market Size – By Segment Statistics
2018-2023
- The global confectionery and snacks market has shown consistent growth across both confectionery and snack food segments from 2018 through projected figures for 2029.
- In 2018, the confectionery segment generated approximately USD 0.45 trillion. While the snack food segment contributed USD 0.18 trillion.
- This trend continued with slight increases in 2019, with confectionery at USD 0.46 trillion and snack food maintaining its share at USD 0.18 trillion.
- By 2020, the confectionery segment remained at USD 0.46 trillion, while snack food rose to USD 0.19 trillion.
- The market began to expand more notably in 2021, with confectionery reaching USD 0.49 trillion and snack food reaching USD 0.20 trillion.
- This growth trajectory continued in 2022, with confectionery and snack food generating USD 0.52 trillion and USD 0.22 trillion, respectively.
- Projections for the coming years indicate further growth across both segments. In 2023, confectionery is expected to reach USD 0.55 trillion, with snack food at USD 0.23 trillion.
2024-2029
- By 2024, these values are forecasted to rise to USD 0.59 trillion for confectionery and USD 0.25 trillion for snack food.
- The trend is expected to persist, with confectionery reaching USD 0.62 trillion and snack food USD 0.27 trillion in 2025 and continuing to USD 0.65 trillion and USD 0.29 trillion, respectively, in 2026.
- By 2027, the confectionery market is projected to be USD 0.69 trillion. While snack food is expected to contribute USD 0.30 trillion.
- Further growth is anticipated in 2028, with confectionery and snack food segments generating USD 0.72 trillion and USD 0.32 trillion, respectively.
- By 2029, the confectionery market is forecasted to reach USD 0.76 trillion, with snack food expected to account for USD 0.34 trillion.
- This steady increase in revenue across both segments reflects a robust demand for confectionery and snack products. Driven by consumer preferences for convenience and indulgent treats. Alongside a broadening product range to cater to diverse tastes.
(Source: Statista)
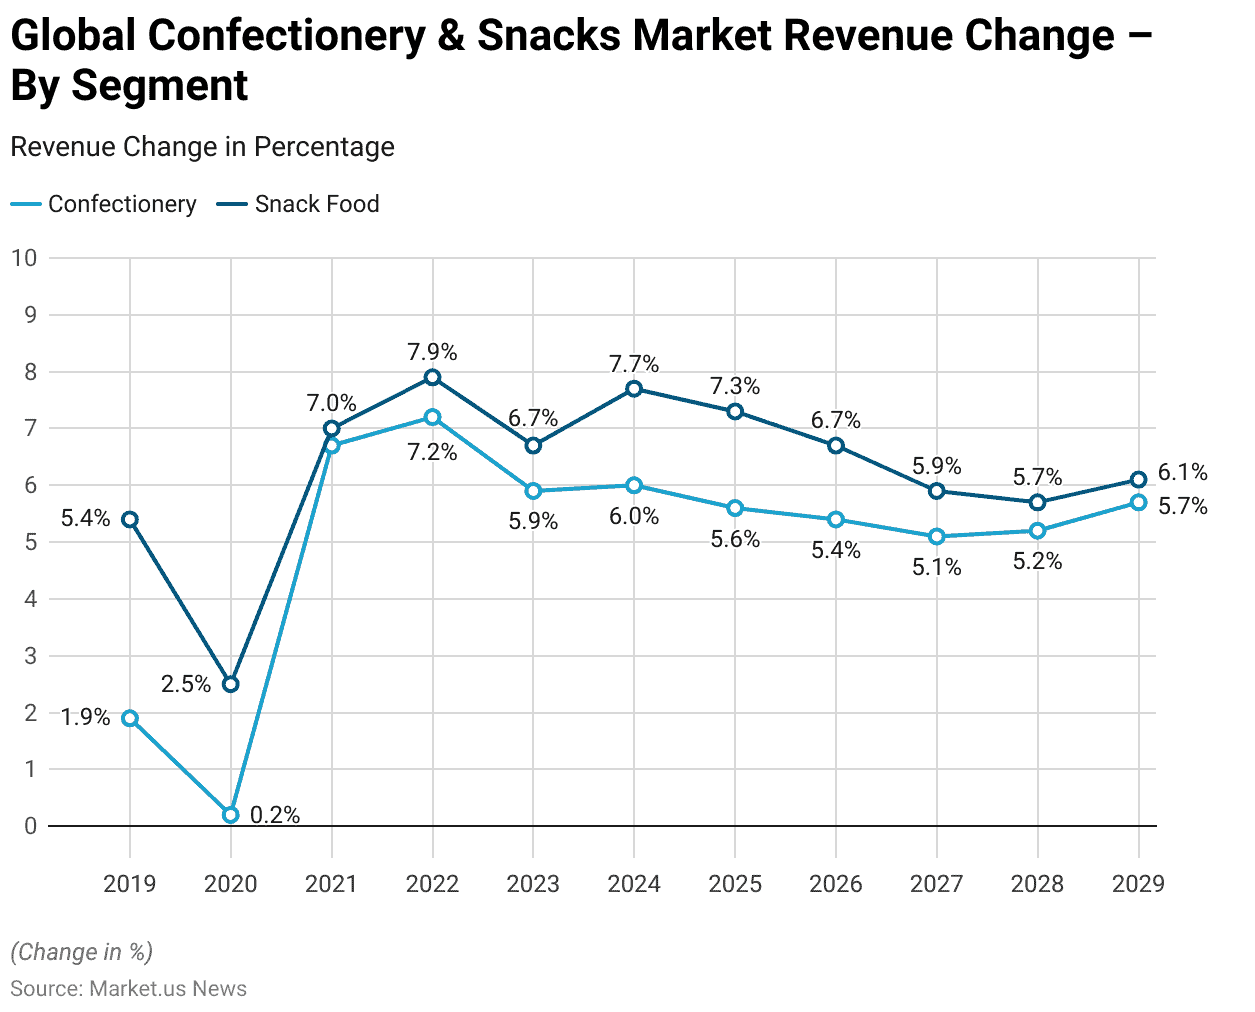
Global Confectionery & Snacks Market Revenue Change – By Segment Statistics
2018-2023
- The global confectionery and snacks market has demonstrated varying rates of revenue growth by segment from 2019 through projections for 2029.
- In 2019, the confectionery segment showed a modest growth rate of 1.9%. While snack food experienced a stronger growth at 5.4%.
- However, in 2020, growth decelerated significantly across both segments, with confectionery increasing by only 0.2% and snack food by 2.5%, likely due to market disruptions.
- A significant recovery and acceleration were observed in 2021, with confectionery achieving a growth rate of 6.7% and snack food growing by 7.0%.
- This positive momentum continued into 2022, as confectionery and snack food saw growth rates of 7.2% and 7.9%, respectively. Marking one of the strongest growth years in the period.
- In 2023, growth slightly moderated to 5.9% for confectionery and 6.7% for snack food.
2024-2029
- Projected figures from 2024 indicate sustained growth, with confectionery expected to grow by 6.0% and snack food by 7.7%.
- By 2025, the confectionery segment is forecasted to increase by 5.6%. While snack food is projected to grow by 7.3%.
- A steady growth pattern continues, with both segments slightly moderating: confectionery is expected to grow by 5.4% in 2026 and snack food by 6.7%.
- Further, in 2027, confectionery is anticipated to experience a growth rate of 5.1%, with snack food at 5.9%.
- The trend continues into 2028 with growth rates of 5.2% for confectionery and 5.7% for snack food.
- By 2029, the market is projected to see a slight rebound, with confectionery growth increasing to 5.7% and snack food at 6.1%.
- This data reflects the resilience and steady demand within both segments, with periods of accelerated growth driven by consumer demand and market recovery, particularly following disruptions.
- The stable growth projections underscore the enduring appeal of confectionery and snack products. Bolstered by expanding global markets and evolving consumer preferences.
(Source: Statista)
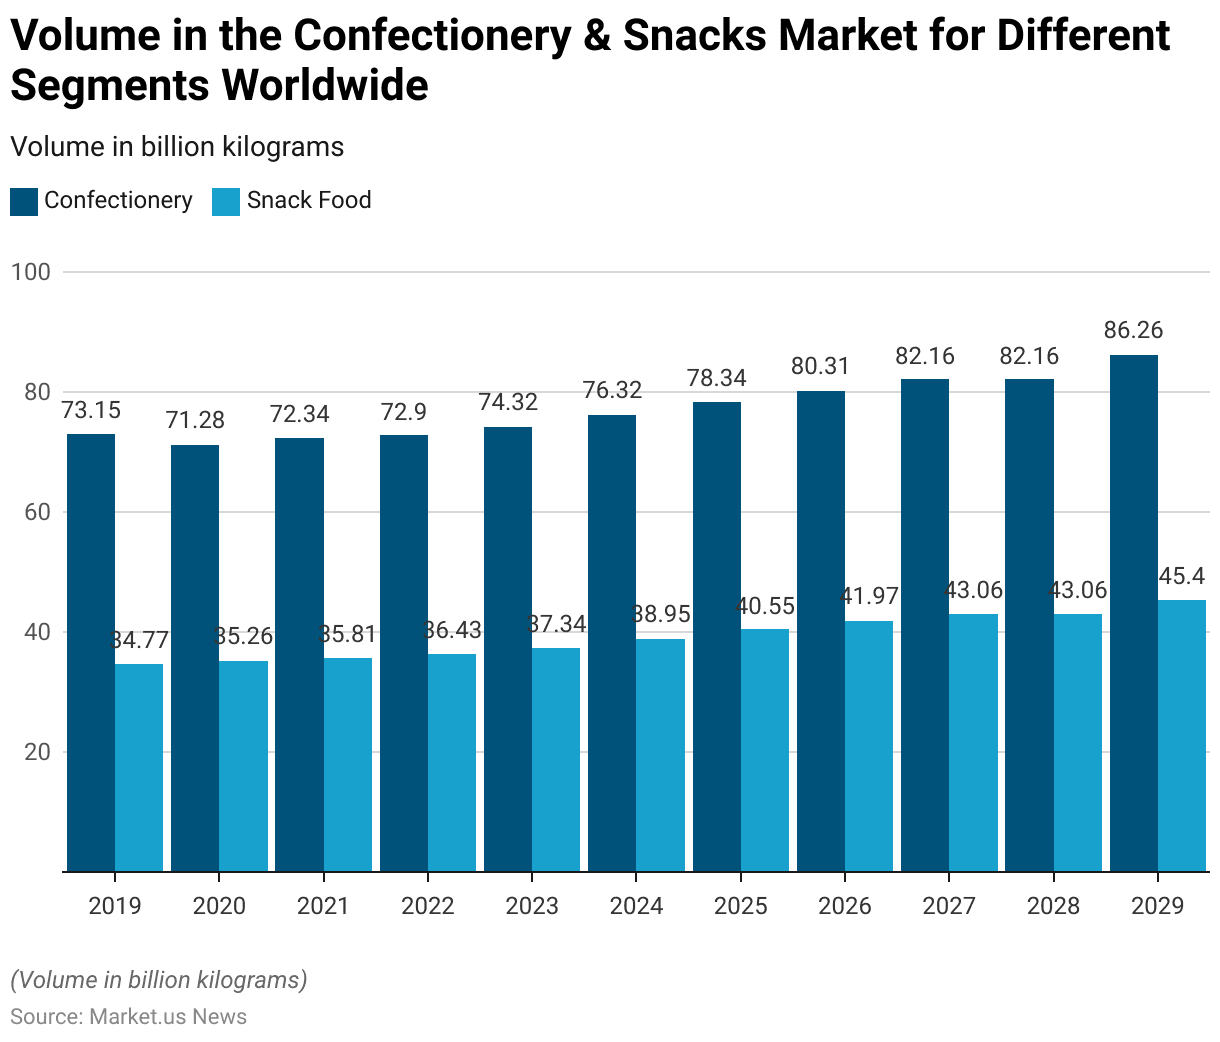
Volume in the Confectionery & Snacks Market for Different Segments Worldwide Statistics
2019-2023
- The global confectionery and snacks market has shown a steady increase in volume across both segments from 2019 to projected figures in 2029.
- In 2019, the confectionery segment reached a volume of approximately 73.15 billion kilograms. While snack foods accounted for 34.77 billion kilograms.
- In 2020, the volume of confectionery slightly decreased to 71.28 billion kilograms, whereas snack food increased to 35.26 billion kilograms.
- The market rebounded in 2021, with confectionery rising to 72.34 billion kilograms and snack foods growing to 35.81 billion kilograms.
- This upward trend continued in 2022, as confectionery reached 72.9 billion kilograms and snack foods increased to 36.43 billion kilograms.
- By 2023, the volume of confectionery grew to 74.32 billion kilograms, and snack food volumes expanded to 37.34 billion kilograms.
2024-2029
- Projections for 2024 indicate that the volume of confectionery will rise further to 76.32 billion kilograms, while snack foods are expected to reach 38.95 billion kilograms.
- In 2025, volumes are anticipated to grow to 78.34 billion kilograms for confectionery and 40.55 billion kilograms for snack foods.
- A notable jump in snack food volume is projected for 2026, reaching 41.97 billion kilograms, with confectionery at 80.31 billion kilograms.
- By 2027, confectionery is expected to increase to 82.16 billion kilograms. While snack foods are projected to reach 43.06 billion kilograms, a volume that remains steady in 2028.
- In 2029, the market volume is forecasted to reach 86.26 billion kilograms for confectionery, with snack food volumes expected to hit 45.4 billion kilograms.
- This consistent volume growth reflects robust demand across both segments, driven by a combination of factors. Including expanding consumer bases and increasing product availability in emerging markets.
(Source: Statista)
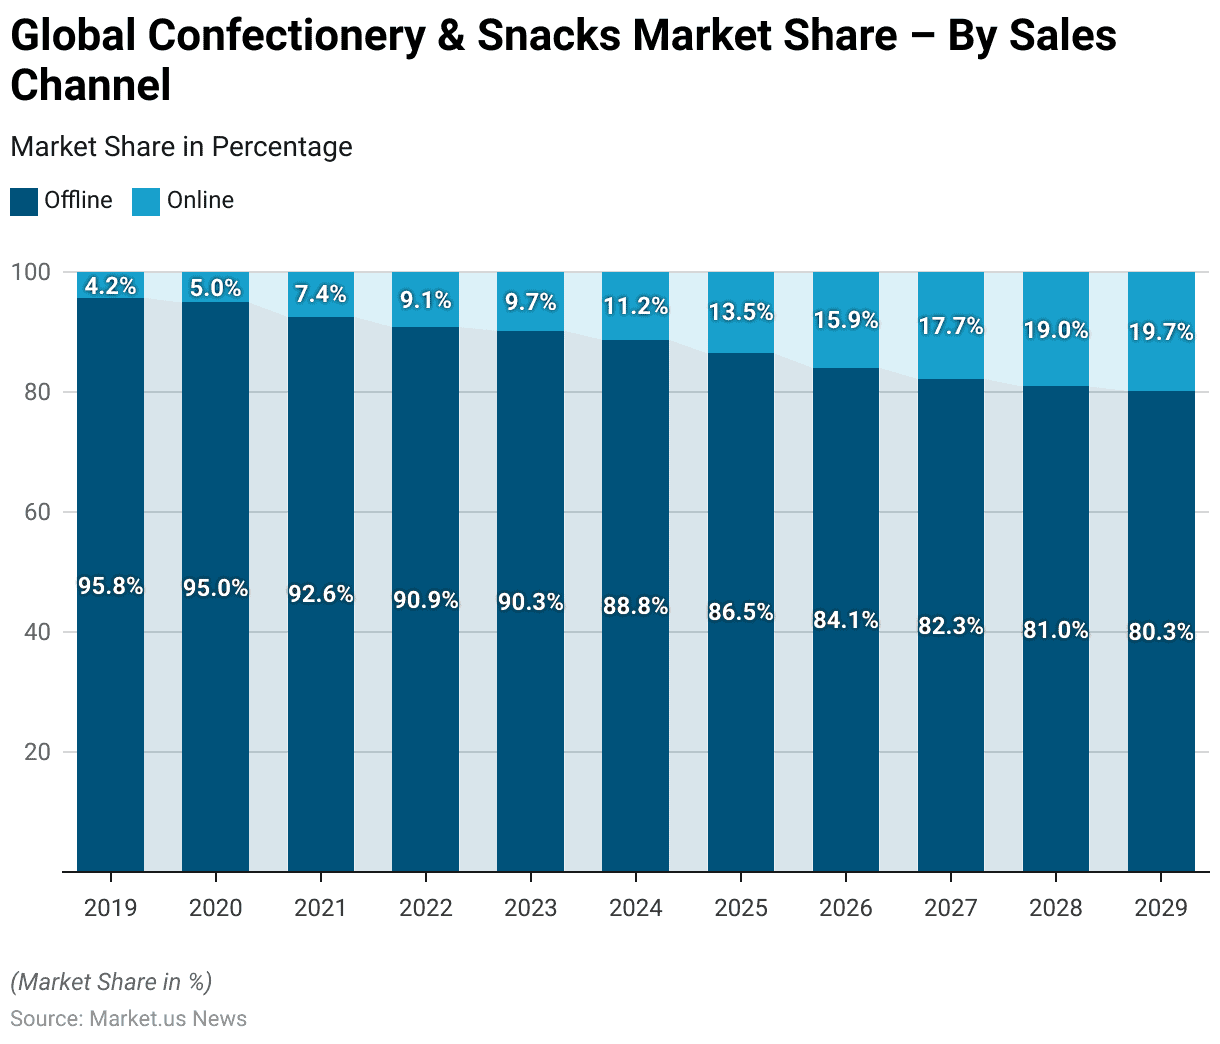
Global Confectionery & Snacks Market Share – By Sales Channel (%) Statistics
2019-2023
- The global confectionery and snacks market has shown a gradual shift in sales channel preferences from offline to online from 2019 through the projected figures for 2029.
- In 2019, offline sales dominated with a substantial 95.8% share, while online sales accounted for only 4.2%.
- This gap began to narrow in 2020, as online sales increased to 5.0% and offline sales slightly decreased to 95.0%.
- This trend continued in 2021, with offline sales declining to 92.6% and online sales rising to 7.4%.
- By 2022, offline sales further reduced to 90.9%, while online sales climbed to 9.1%.
- In 2023, the offline share reached 90.3%, with online sales increasing to 9.7%.
- Projections indicate a continued shift in the following years, with offline sales expected to drop to 88.8% in 2024 as online sales expand to 11.2%.
2025-2029
- By 2025, online sales are anticipated to capture 13.5% of the market. While offline sales are projected to reduce to 86.5%.
- This shift is expected to progress, with offline sales declining to 84.1% in 2026 and online sales reaching 15.9%.
- By 2027, offline sales are forecasted to drop to 82.3%, with online sales capturing 17.7% of the market.
- This trend continues in 2028, with offline sales at 81.0% and online sales at 19.0%.
- In 2029, the market share for online sales is projected to reach 19.7%, while offline sales continue to decrease, falling to 80.3%.
- Moreover, this shift reflects evolving consumer behaviors, with increasing reliance on digital platforms for convenience and accessibility. Contributing to the steady growth of the online sales channel within the global confectionery and snacks market.
(Source: Statista)
Confectionery & Snacks Market Revenue – By Country Statistics
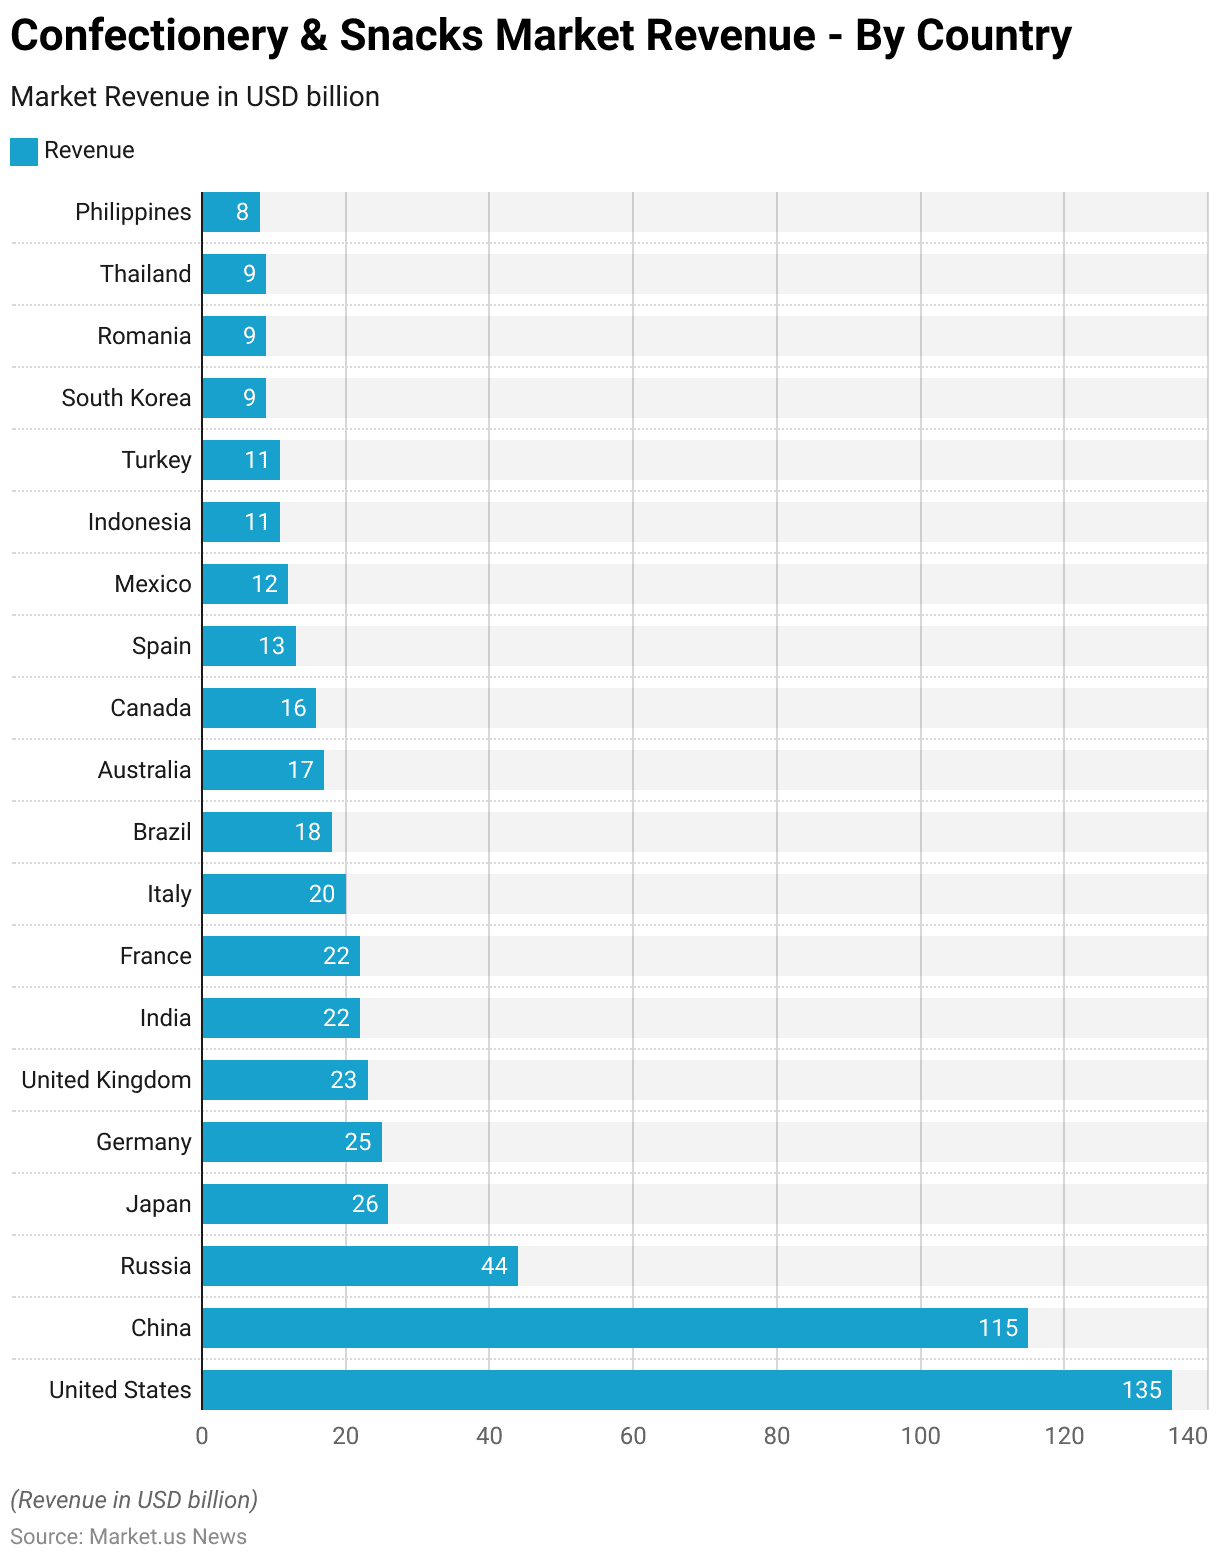
- In 2024, the global confectionery and snacks market is projected to generate substantial revenue across various countries.
- The United States is anticipated to lead the market with an estimated revenue of USD 135 billion, followed by China at USD 115 billion. Highlighting these two countries as dominant players in the sector.
- Russia is expected to hold the third position with a market size of USD 44 billion. While Japan and Germany are projected to generate USD 26 billion and USD 25 billion, respectively.
- The United Kingdom is forecasted to reach USD 23 billion, with India and France both at USD 22 billion.
- Italy’s market is expected to generate USD 20 billion, and Brazil is projected to reach USD 18 billion.
- Other notable contributors include Australia at USD 17 billion, Canada at USD 16 billion, and Spain at USD 13 billion.
- Mexico is anticipated to contribute USD 12 billion, followed by Indonesia and Turkey, each at USD 11 billion.
- South Korea, Romania, and Thailand are projected to generate USD 9 billion each. While the Philippines is expected to reach USD 8 billion in revenue.
- These figures indicate a wide distribution of market revenue across diverse regions. Driven by the sustained demand for confectionery and snack products globally.
(Source: Statista)
Chocolate Confectionery Market Overview
Global Chocolate Confectionery Market Size Statistics
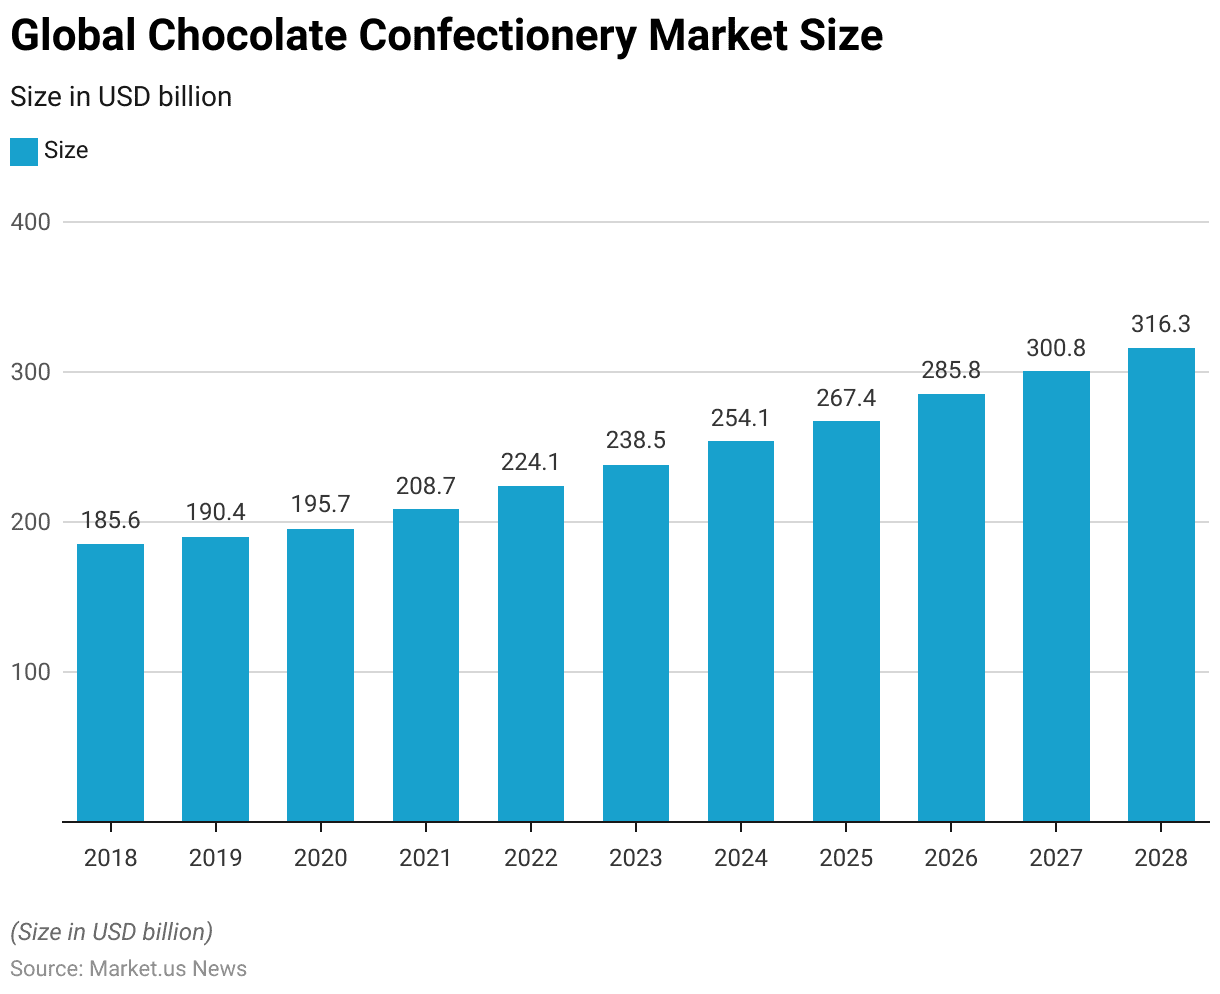
- The global chocolate confectionery market has shown steady growth from 2018 through projections for 2028.
- In 2018, the market was valued at approximately USD 185.6 billion, increasing to USD 190.4 billion in 2019.
- The upward trend continued in 2020, with the market size reaching USD 195.7 billion.
- By 2021, the chocolate confectionery market expanded further to USD 208.7 billion, followed by USD 224.1 billion in 2022.
- This growth trajectory is projected to persist, with the market estimated at USD 238.5 billion in 2023 and expected to reach USD 254.1 billion in 2024.
- The following years indicate continued expansion, with the market size forecasted to grow to USD 267.4 billion in 2025 and USD 285.8 billion in 2026.
- By 2027, the market is anticipated to reach USD 300.8 billion, with projections for 2028 suggesting a further increase to USD 316.3 billion.
- This consistent growth reflects the sustained demand for chocolate confectionery products worldwide, driven by factors such as product innovation. Increased consumer indulgence, and expanding market penetration in emerging regions.
(Source: Statista)
Chocolate Confectionery Market Share – By Region Statistics
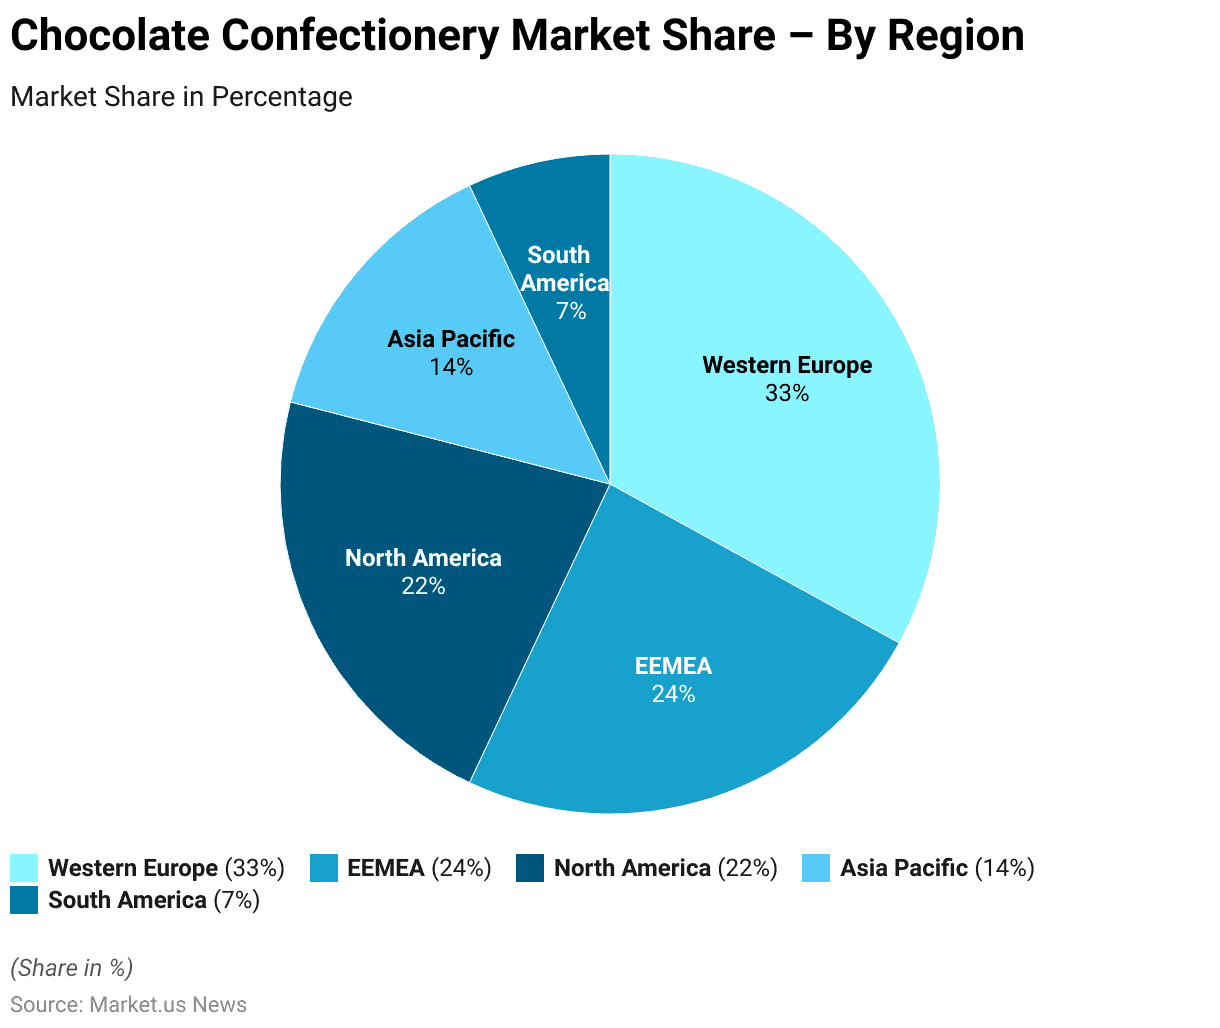
- In the financial year 2022/23, the global chocolate confectionery market was primarily dominated by Western Europe, which held the largest market share at 33%.
- The EEMEA region (Eastern Europe, Middle East, and Africa) followed with a significant share of 24%.
- North America accounted for 22% of the market, making it the third-largest region in terms of chocolate confectionery consumption.
- The Asia Pacific region held a 14% share, reflecting its growing importance in the market. While South America contributed the remaining 7%.
- This distribution underscores Western Europe’s leading position in chocolate confectionery, with substantial contributions from emerging markets in EMEA and Asia Pacific.
(Source: Statista)
Confectionery Sales Statistics
Global Confectionery Sales – By Region Statistics
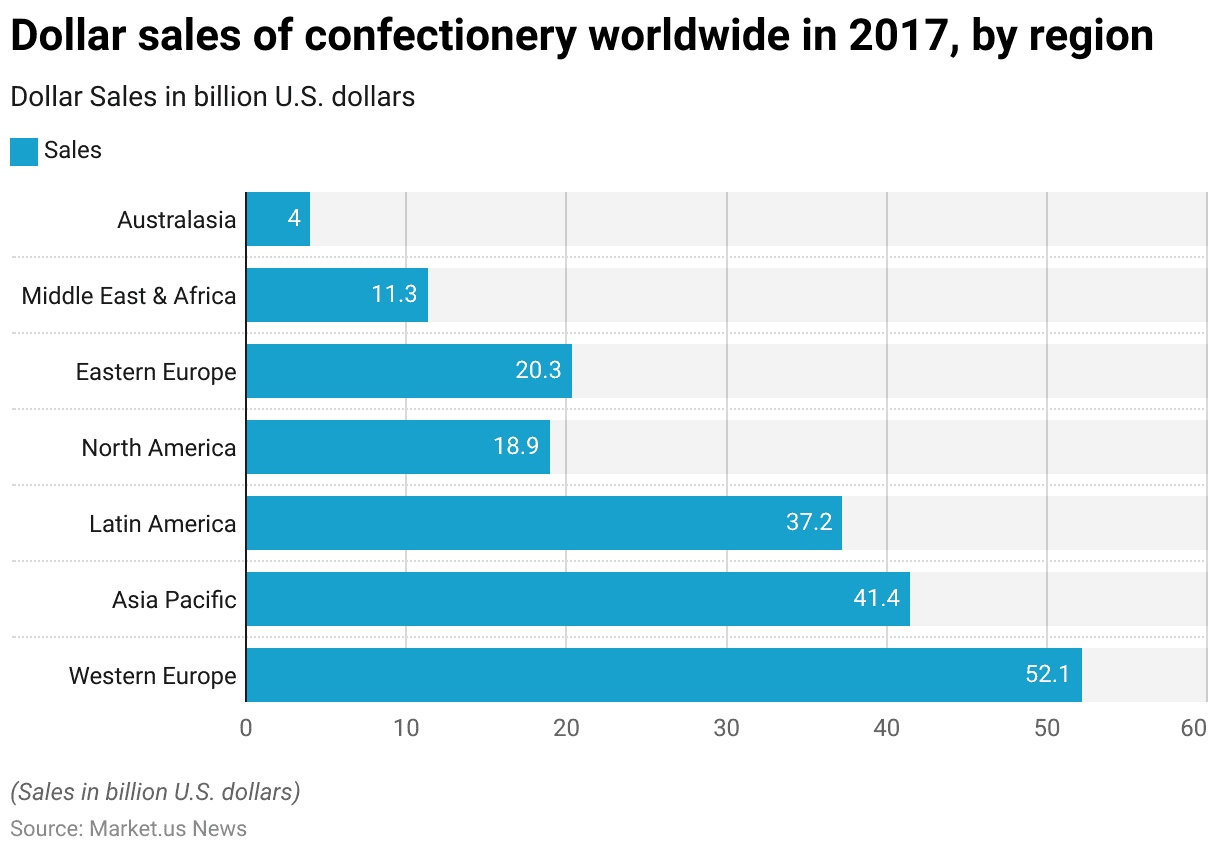
- In 2017, global confectionery sales varied significantly by region. Western Europe led the market with USD 52.1 billion in sales. Followed by the Asia Pacific region, which generated USD 41.4 billion.
- Latin America also represented a major market, contributing USD 37.2 billion in confectionery sales.
- North America and Eastern Europe saw lower but substantial sales figures at USD 18.9 billion and USD 20.3 billion, respectively.
- The Middle East & Africa region accounted for USD 11.3 billion. While Australasia had the smallest market size, with USD 4 billion in sales.
- This distribution highlights Western Europe and the Asia Pacific as dominant regions within the global confectionery market in 2017.
(Source: Statista)
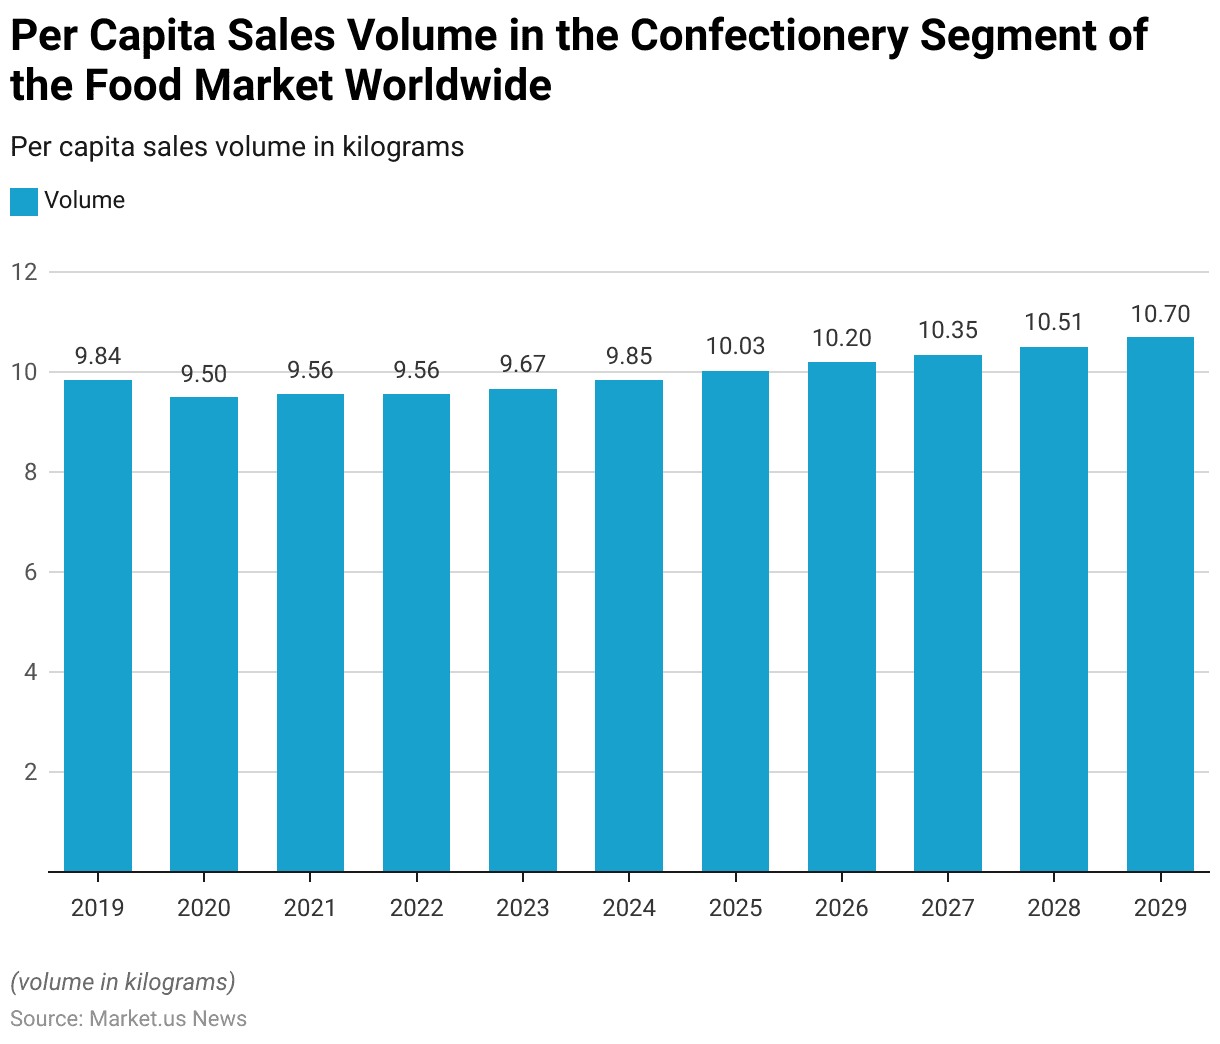
Per Capita Sales Volume in the Confectionery Segment of the Food Market Worldwide Statistics
- The per capita sales volume in the global confectionery segment has demonstrated steady growth from 2019 and is projected to continue through 2029.
- In 2019, per capita sales volume stood at approximately 9.84 kilograms. Which slightly declined to 9.5 kilograms in 2020, likely influenced by market fluctuations.
- Recovery was observed in 2021 with an increase to 9.56 kilograms, a level maintained in 2022.
- By 2023, per capita sales volume rose to 9.67 kilograms, and further growth is anticipated in subsequent years.
- In 2024, per capita sales volume is projected to reach 9.85 kilograms. Crossing the 10-kilogram mark in 2025 with an estimated 10.03 kilograms.
- This upward trend is expected to continue, with per capita volume increasing to 10.2 kilograms in 2026, 10.35 kilograms in 2027, and 10.51 kilograms in 2028.
- By 2029, the per capita sales volume in the confectionery segment is forecasted to reach 10.7 kilograms.
- This consistent growth highlights the increasing global consumption of confectionery products, reflecting changing consumer preferences and expanding market penetration.
(Source: Statista)
Net Sales of the Leading Confectionery Companies Worldwide Statistics
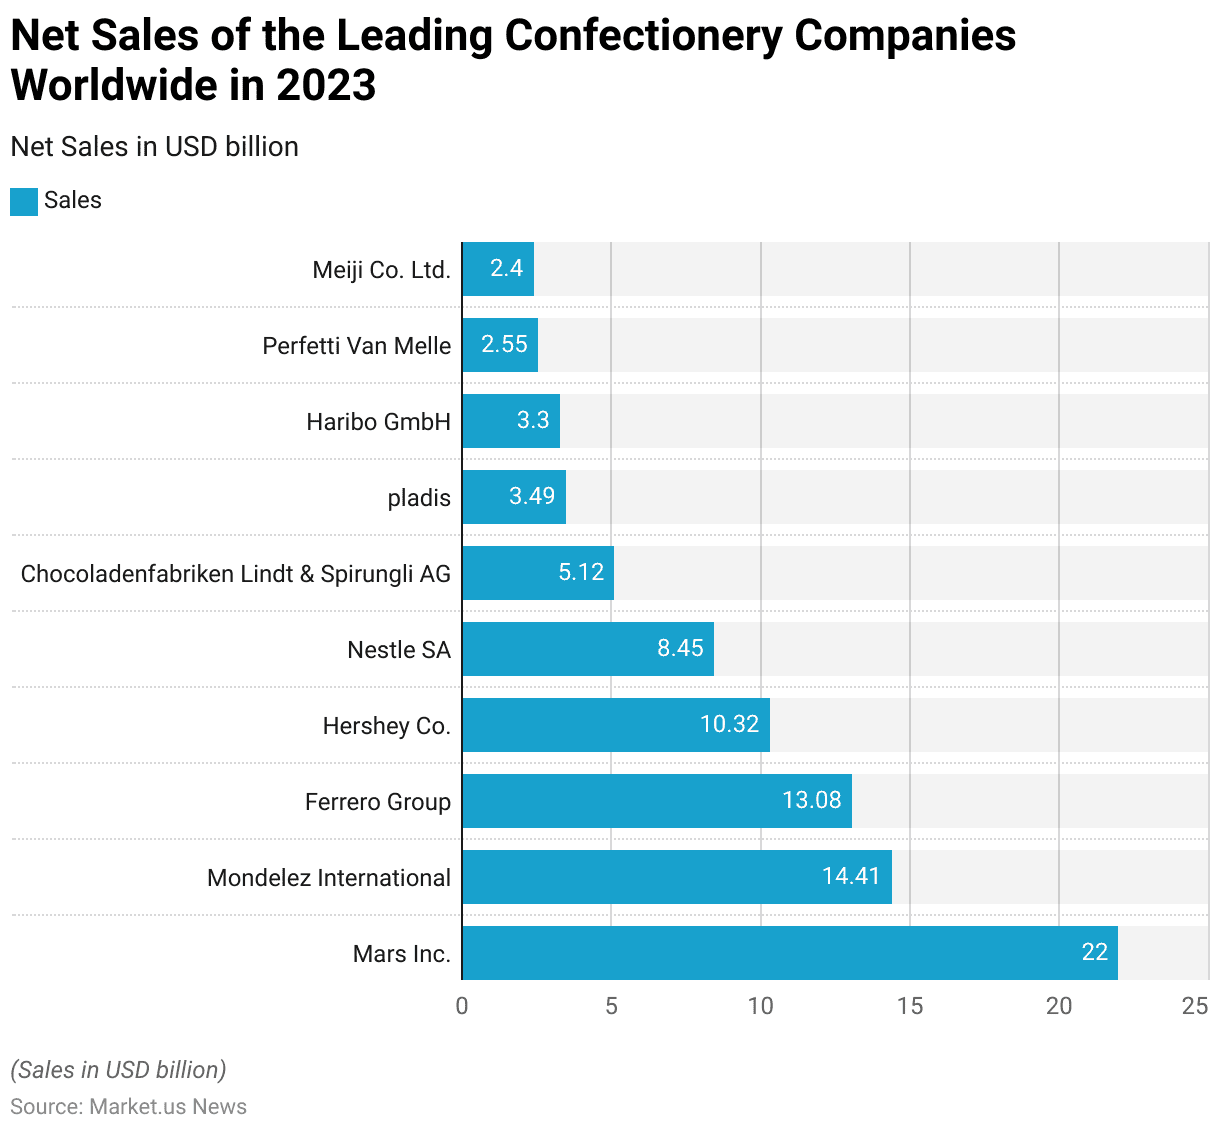
- In 2023, Mars Inc. led the global confectionery industry, with net sales reaching USD 22 billion, making it the top player in the market.
- Mondelez International followed with USD 14.41 billion in sales, while Ferrero Group ranked third, generating USD 13.08 billion.
- Hershey Co. secured the fourth position with USD 10.32 billion in sales, and Nestle SA rounded out the top five with USD 8.45 billion.
- Chocoladenfabriken Lindt & Sprüngli AG held a significant position with USD 5.12 billion in sales. Followed by Pladis with USD 3.49 billion.
- Haribo GmbH reported net sales of USD 3.3 billion, while Perfetti Van Melle generated USD 2.55 billion.
- Meiji Co. Ltd. completed the list of top global confectionery companies with USD 2.4 billion in net sales.
- This ranking underscores the dominance of these companies in the global confectionery market. Driven by extensive brand portfolios, innovative product offerings, and broad geographic reach.
(Source: Statista)
Confectionery Average Revenue Per Capita Worldwide Statistics
2019-2023
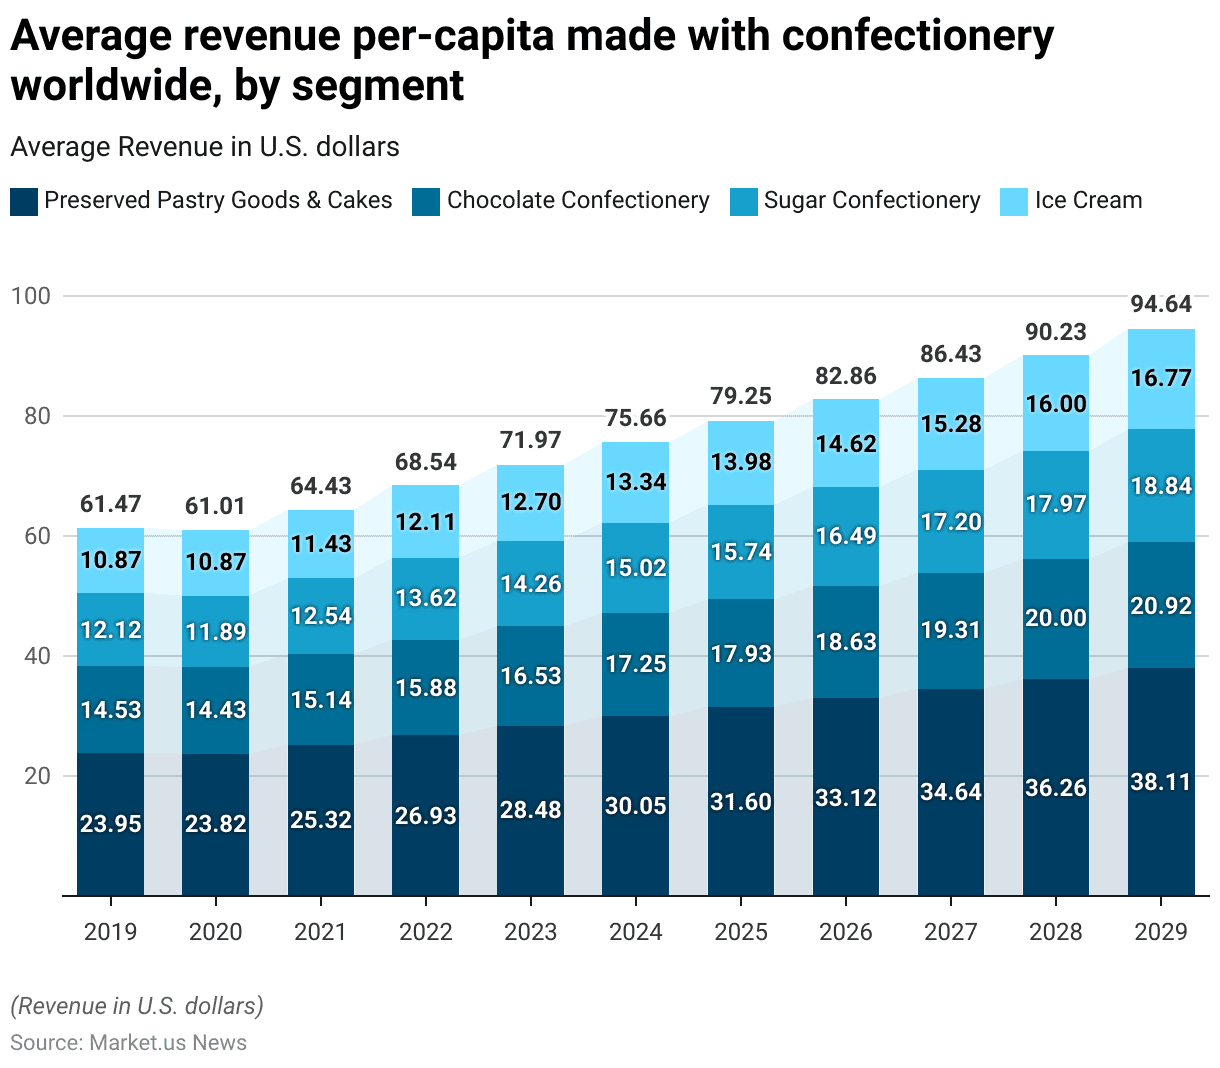
- From 2019 to 2029, the average per capita revenue generated from different segments. The global confectionery market is expected to experience steady growth.
- In 2019, per capita revenue for preserved pastry goods and cakes was approximately USD 23.95. While chocolate confectionery generated USD 14.53, sugar confectionery reached USD 12.12, and ice cream contributed USD 10.87.
- In 2020, there was a slight decline in some categories, with preserved pastry goods and cakes at USD 23.82 and chocolate confectionery at USD 14.43. While sugar confectionery dropped to USD 11.89. However, ice cream remained stable at USD 10.87.
- By 2021, the market saw a recovery, with preserved pastry goods and cakes increasing to USD 25.32. Chocolate confectionery to USD 15.14, sugar confectionery to USD 12.54, and ice cream to USD 11.43.
- Growth continued into 2022, where preserved pastry goods and cakes rose to USD 26.93, chocolate confectionery to USD 15.88, sugar confectionery to USD 13.62, and ice cream to USD 12.11.
- This upward trend persisted through 2023, with preserved pastry goods and cakes reaching USD 28.48, chocolate at USD 16.53, sugar confectionery at USD 14.26, and ice cream at USD 12.7.
2024-2029
- Projected figures indicate further growth, with preserved pastry goods and cakes expected to reach USD 30.05 per capita in 2024, chocolate at USD 17.25, sugar confectionery at USD 15.02, and ice cream at USD 13.34.
- By 2025, the market is anticipated to reach USD 31.6 for preserved goods, USD 17.93 for chocolate, USD 15.74 for sugar, and USD 13.98 for ice cream.
- The trend is projected to continue, with preserved pastry goods reaching USD 33.12, chocolate at USD 18.63, sugar confectionery at USD 16.49, and ice cream at USD 14.62 in 2026.
- By 2027, per capita revenue is expected to be USD 34.64 for preserved goods, USD 19.31 for chocolate, USD 17.2 for sugar confectionery, and USD 15.28 for ice cream.
- By 2028, these values are projected to reach USD 36.26, USD 20, USD 17.97, and USD 16, respectively.
- Finally, by 2029, preserved pastry goods and cakes are expected to generate USD 38.11 per capita, chocolate confectionery USD 20.92, sugar confectionery USD 18.84, and ice cream USD 16.77.
- This continuous increase in per capita revenue across all segments underscores the growing consumer demand and the rising value attributed to confectionery and related products worldwide.
(Source: Statista)
Confectionery Price Statistics
Average Price Per Unit (PPU) in the Confectionery Segment of the Food Market Worldwide
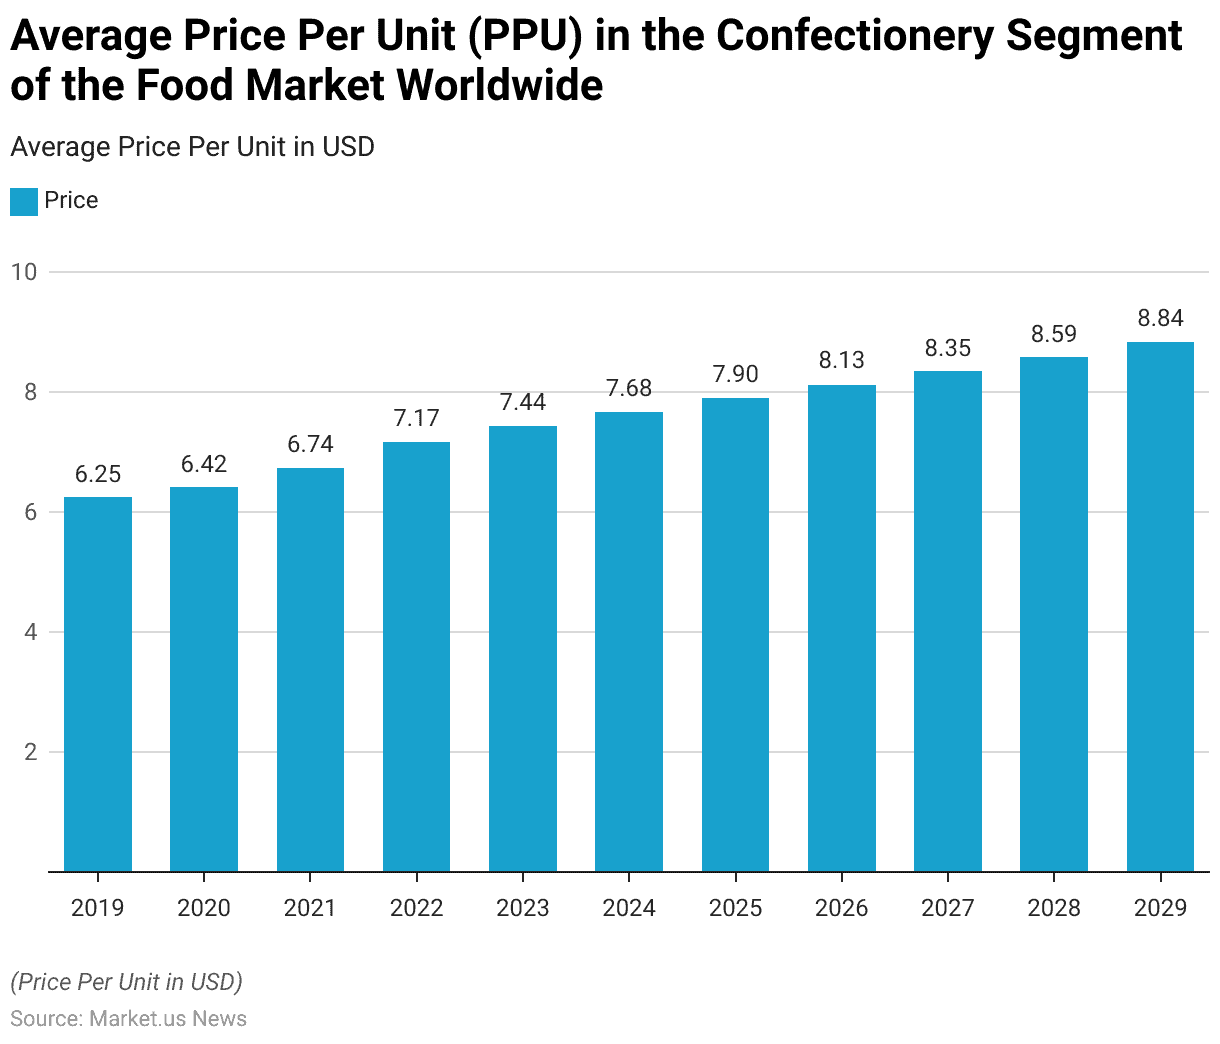
- The average price per unit (PPU) in the global confectionery segment has shown a consistent upward trend from 2019 through to the projected figures for 2029.
- In 2019, the average price per unit was USD 6.25, which increased to USD 6.42 in 2020.
- This rise continued in 2021, with the PPU reaching USD 6.74, and further climbed to USD 7.17 in 2022.
- In 2023, the average price per unit is estimated to be around USD 7.44.
- Forecasts indicate continued growth in the average unit price, with the PPU projected to reach USD 7.68 in 2024 and USD 7.9 in 2025.
- By 2026, the price is expected to increase to USD 8.13 and USD 8.35 in 2027.
- The upward trend persists in 2028, with an anticipated PPU of USD 8.59, reaching USD 8.84 by 2029.
- This steady increase in the average price per unit reflects rising production costs. Inflationary pressures, and potentially enhanced value-added features in confectionery products. This indicates a robust consumer demand that is willing to accommodate higher prices in this market segment globally.
(Source: Statista)
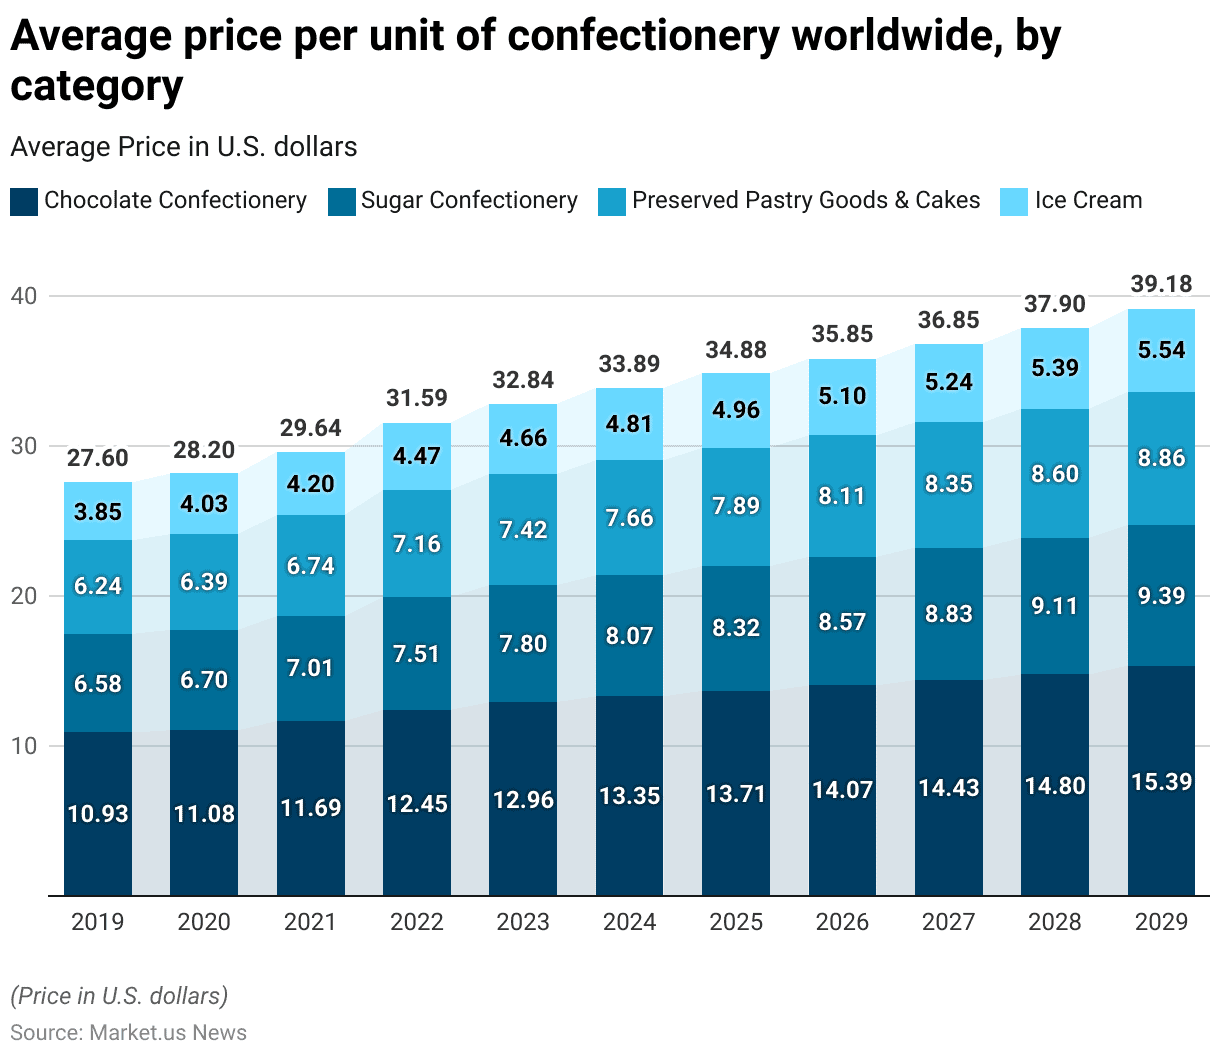
Confectionery Average Price Worldwide – By Category Statistics
2019-2023
- The average price per unit (PPU) across various confectionery categories worldwide has shown a consistent increase from 2019 through the projected figures for 2029.
- In 2019, chocolate confectionery held the highest average PPU at USD 10.93. Followed by sugar confectionery at USD 6.58, preserved pastry goods and cakes at USD 6.24, and ice cream at USD 3.85.
- The prices in each category rose slightly in 2020, with chocolate reaching USD 11.08, sugar confectionery at USD 6.7, preserved pastry goods at USD 6.39, and ice cream at USD 4.03.
- This upward trend continued in 2021, with chocolate increasing to USD 11.69. Sugar confectionery to USD 7.01, preserved pastry goods to USD 6.74, and ice cream to USD 4.2.
- By 2022, the PPU for chocolate confectionery reached USD 12.45, sugar confectionery rose to USD 7.51, preserved pastry goods to USD 7.16, and ice cream to USD 4.47.
- In 2023, the PPU is projected to reach USD 12.96 for chocolate, USD 7.8 for sugar confectionery, USD 7.42 for preserved pastry goods, and USD 4.66 for ice cream.
- This growth is expected to continue, with projections for 2024 indicating an average price of USD 13.35 for chocolate, USD 8.07 for sugar confectionery, USD 7.66 for preserved goods, and USD 4.81 for ice cream.
2025-2029
- By 2025, the PPU for chocolate confectionery is anticipated to rise to USD 13.71, with sugar confectionery at USD 8.32, preserved pastry goods at USD 7.89, and ice cream at USD 4.96.
- Further increases are expected, reaching USD 14.07, USD 8.57, USD 8.11, and USD 5.1, respectively, in 2026.
- The upward trend continues, with chocolate expected to reach USD 14.43 by 2027, sugar confectionery at USD 8.83, preserved goods at USD 8.35, and ice cream at USD 5.24.
- By 2028, the average price per unit is forecasted to be USD 14.8 for chocolate, USD 9.11 for sugar confectionery, USD 8.6 for preserved goods, and USD 5.39 for ice cream.
- The final year in the projection, 2029, shows further increases, with chocolate at USD 15.39, sugar confectionery at USD 9.39, preserved pastry goods at USD 8.86, and ice cream at USD 5.54.
- These rising average prices reflect factors such as increased production costs, inflation, and potential enhancements in product quality and innovation within the global confectionery market.
(Source: Statista)
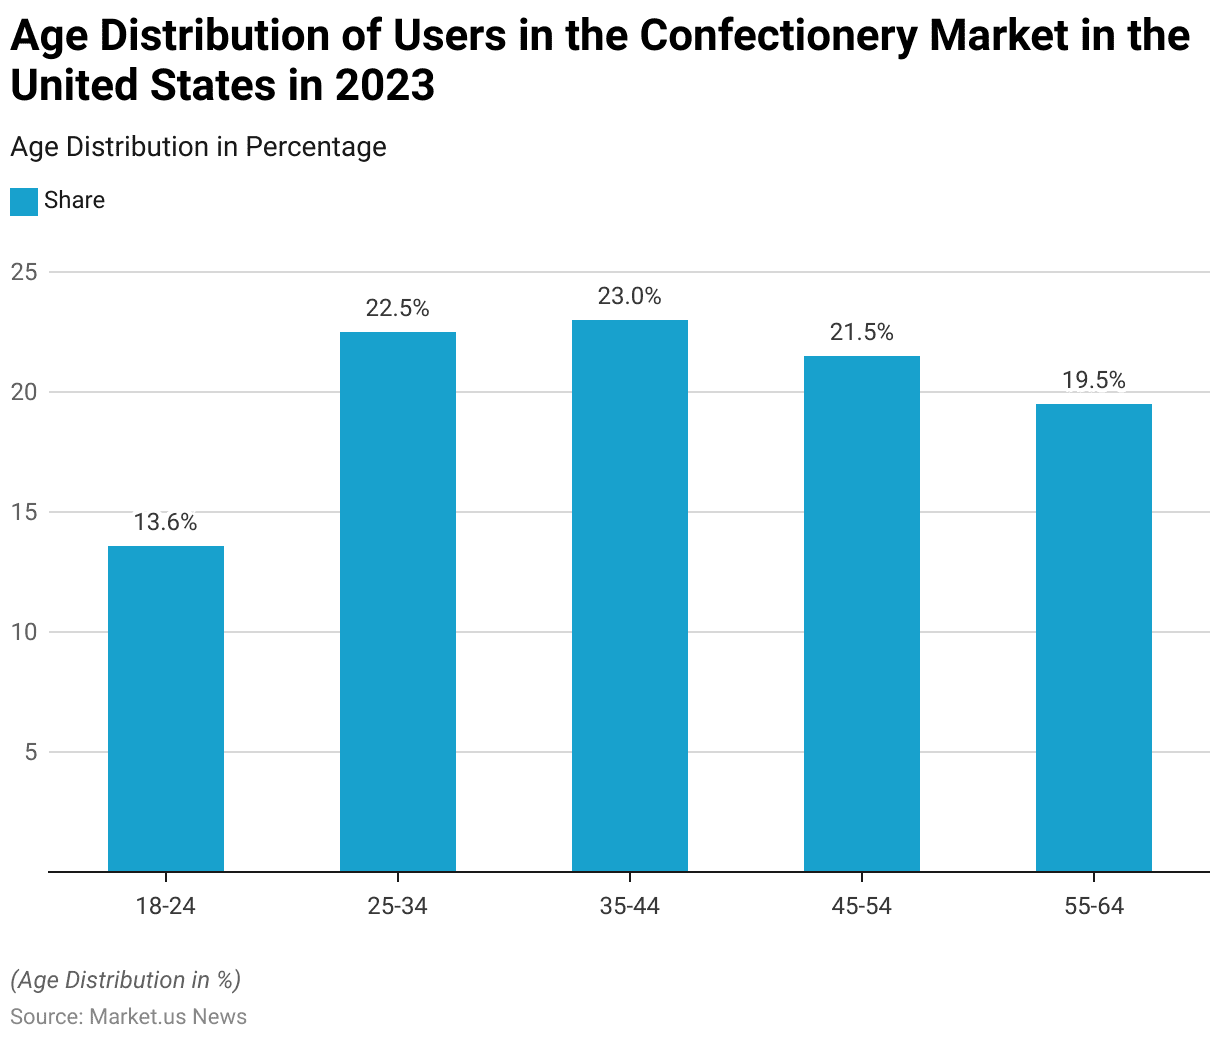
Age Distribution of Users in the Confectionery Market in the United States Statistics
- In 2023, the age distribution of consumers in the U.S. confectionery market reveals that individuals aged 35-44 represented the largest share of the market at 23%.
- This was closely followed by the 25-34 age group, which comprised 22.5% of consumers. Indicating a strong preference for confectionery among younger to middle-aged adults.
- The 45-54 age group also held a significant portion, accounting for 21.5% of consumers. While those aged 55-64 made up 19.5% of the market.
- Younger consumers aged 18-24 represented the smallest share at 13.6%.
- These figures highlight a broad appeal for confectionery products across various age groups, with a particular concentration among individuals between 25 and 54 years.
(Source: Statista)
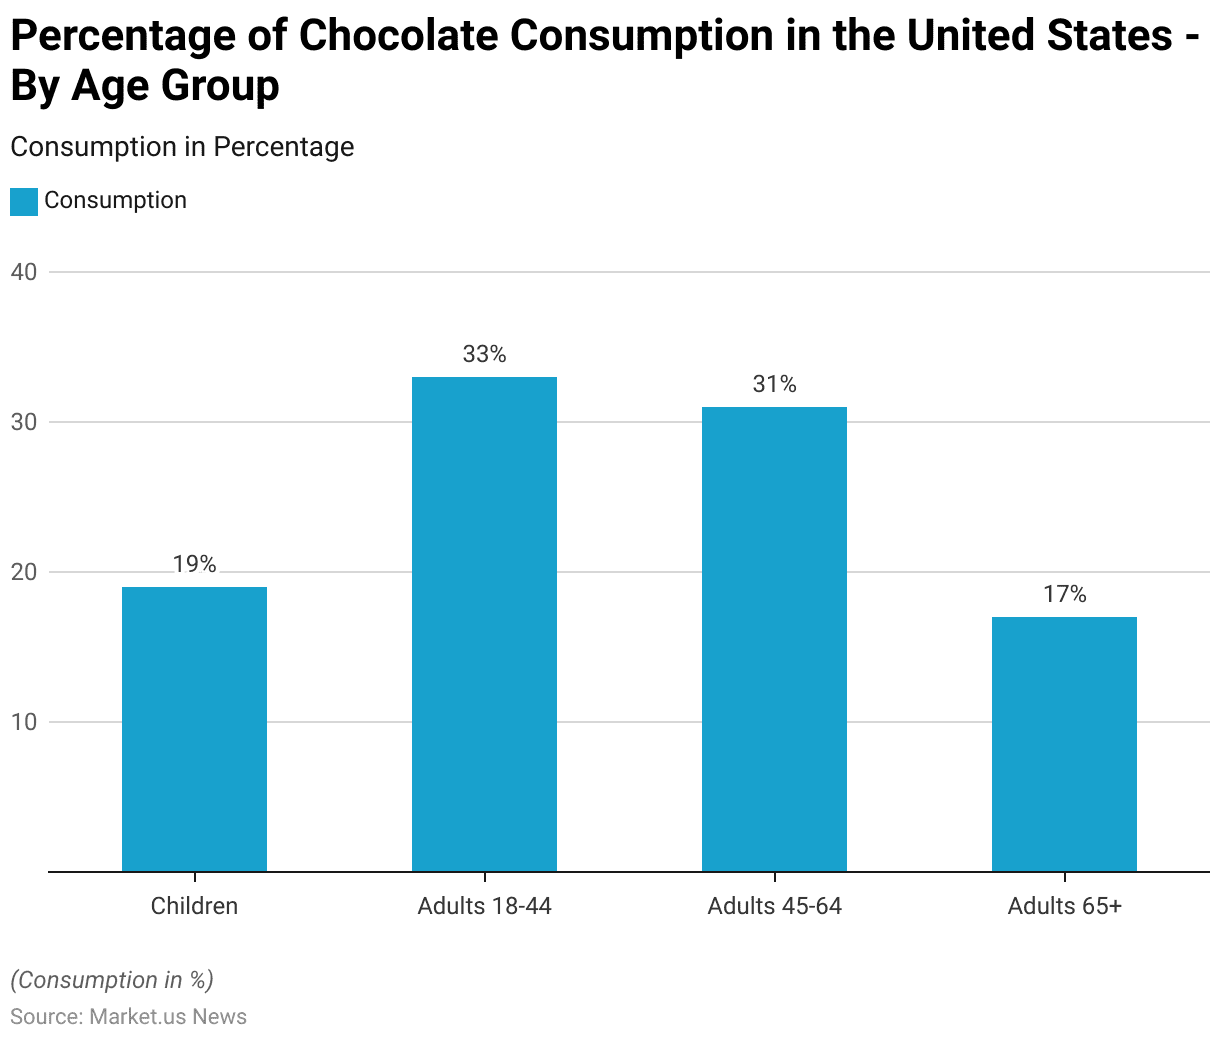
Percentage of Chocolate Consumption in the United States – By Age Group
- In 2010, chocolate consumption in the United States was distributed across various age groups, with adults aged 18-44 comprising the largest share at 33%.
- Adults aged 45-64 followed closely, accounting for 31% of chocolate consumption.
- Children represented 19% of chocolate consumers, indicating a strong appeal for chocolate among younger audiences.
- Adults aged 65 and older made up the smallest share of the market, contributing 17% to total chocolate consumption.
- This distribution highlights chocolate’s broad appeal across age groups, with particularly high consumption among adults aged 18-64.
(Source: Statista)
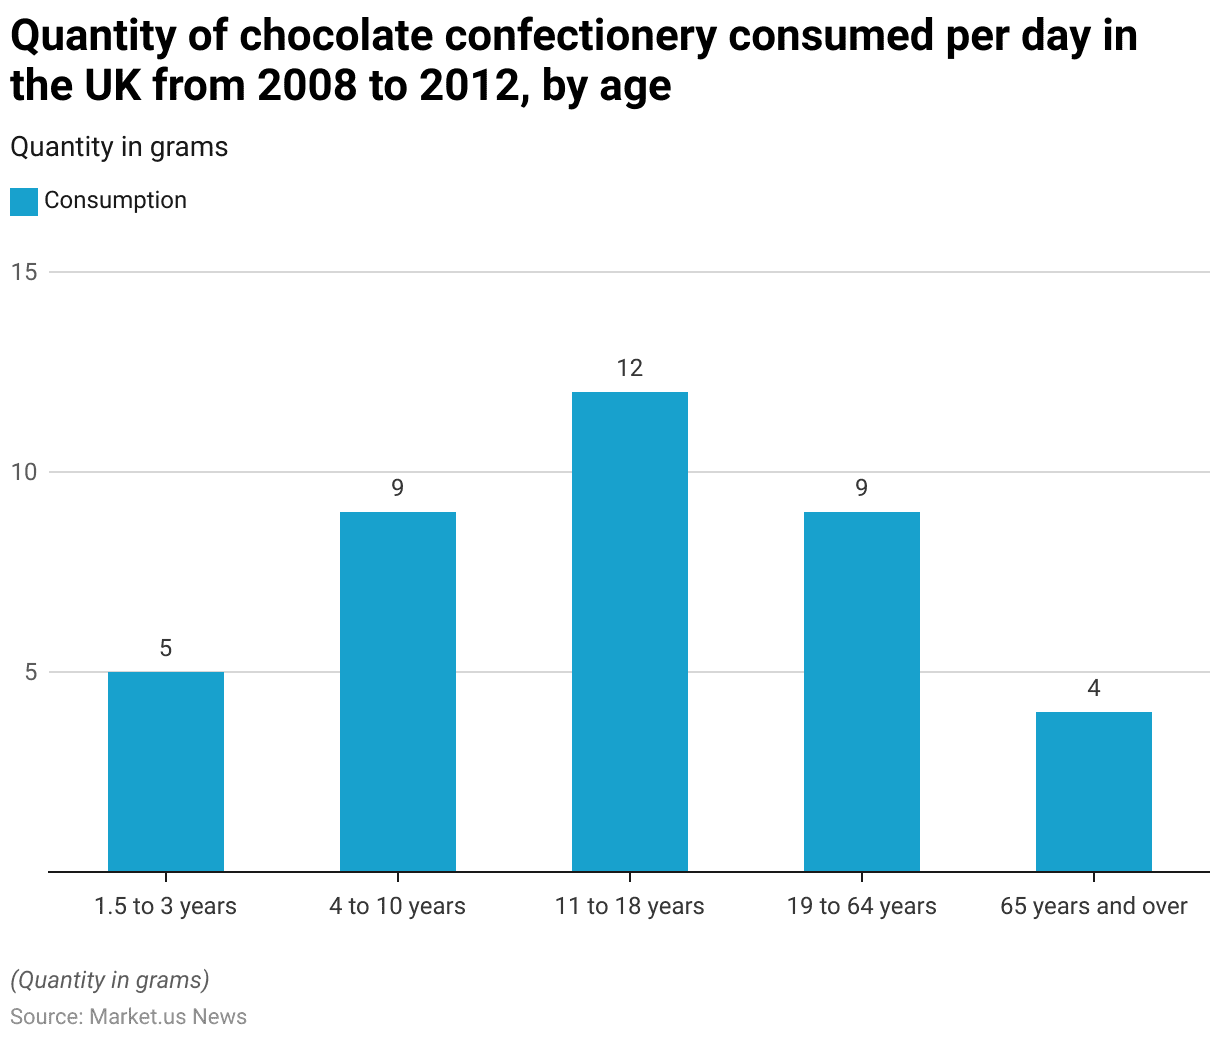
Quantity of Chocolate Confectionery Consumed in the United Kingdom – By Age Statistics
- Between 2008 and 2012 in the United Kingdom, the average daily consumption of chocolate confectionery varied by age group.
- Children aged 1.5 to 3 years consumed approximately 5 grams of chocolate per day. While those aged 4 to 10 years consumed a higher amount at 9 grams daily.
- Teenagers aged 11 to 18 years had the highest chocolate consumption, averaging 12 grams per day.
- Adults aged 19 to 64 years consumed about 9 grams daily, similar to younger children.
- The lowest consumption was among adults aged 65 years and over, who averaged 4 grams per day.
- This data indicates that chocolate consumption was highest among teenagers and declined in older age groups.
(Source: Statista)
Quantity of Biscuit and Cake Products Consumed in the UK – By Age
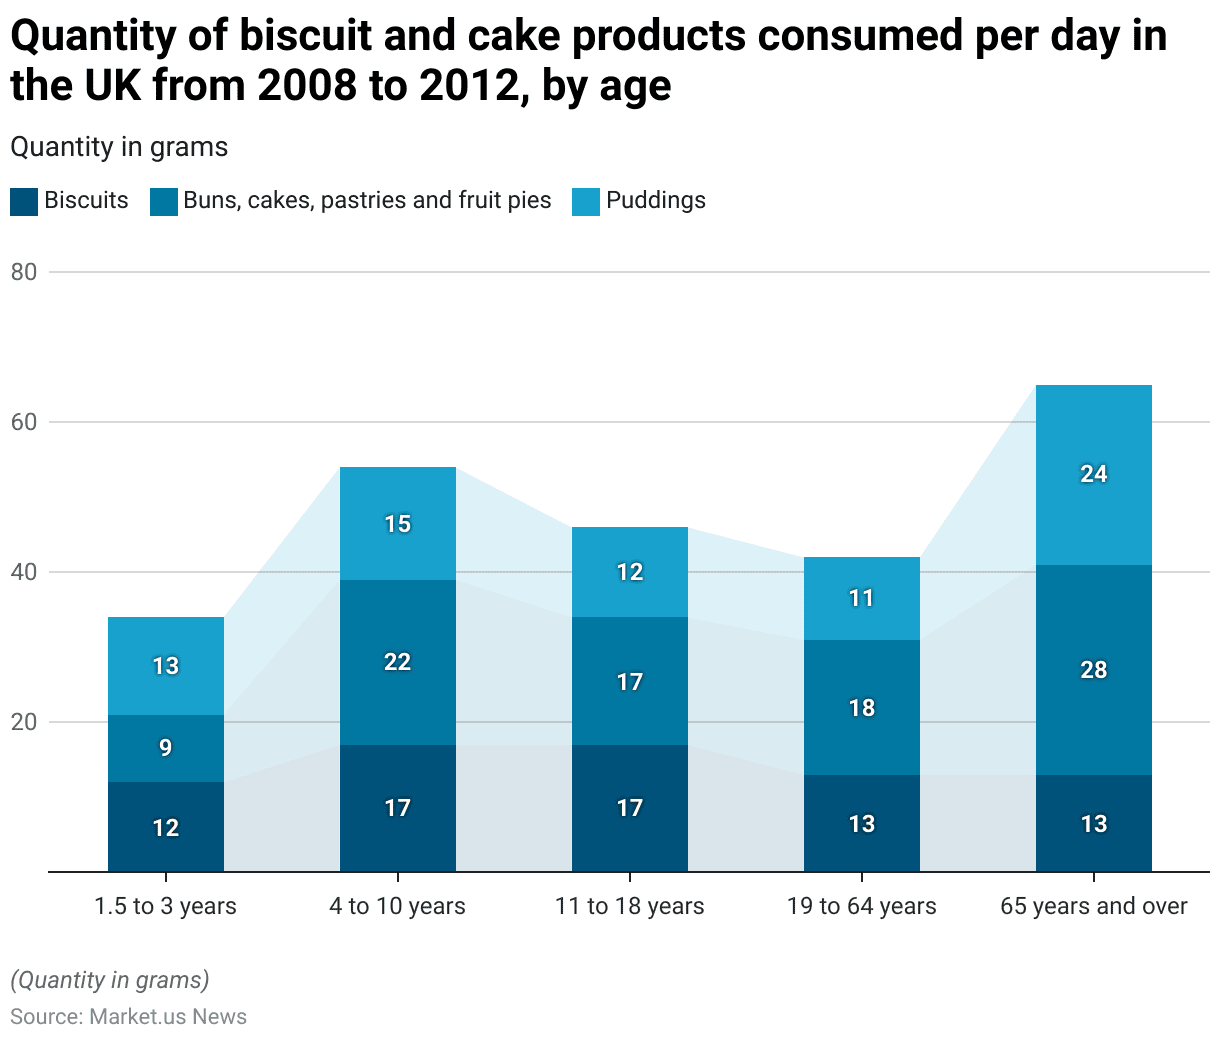
- Between 2008 and 2012 in the United Kingdom, the average daily consumption of biscuits, cakes, and puddings varied across different age groups.
- Children aged 1.5 to 3 years consumed about 12 grams of biscuits, 9 grams of buns, cakes, pastries, and fruit pies, and 13 grams of puddings per day.
- In the 4 to 10-year age group, consumption was higher, with 17 grams of biscuits, 22 grams of cakes, and 15 grams of puddings daily.
- Teenagers aged 11 to 18 years consumed 17 grams of biscuits, 17 grams of cakes, and 12 grams of puddings each day.
- Adults aged 19 to 64 years had a slightly lower daily intake of these items, consuming 13 grams of biscuits, 18 grams of cakes, and 11 grams of puddings.
- Among those aged 65 years and over, daily consumption patterns shifted, with 13 grams of biscuits, a higher 28 grams of cakes, and 24 grams of puddings.
- This data reveals that cake consumption is particularly prominent among older people. While younger age groups show a more balanced intake of biscuits and other sweet baked goods.
(Source: Statista)
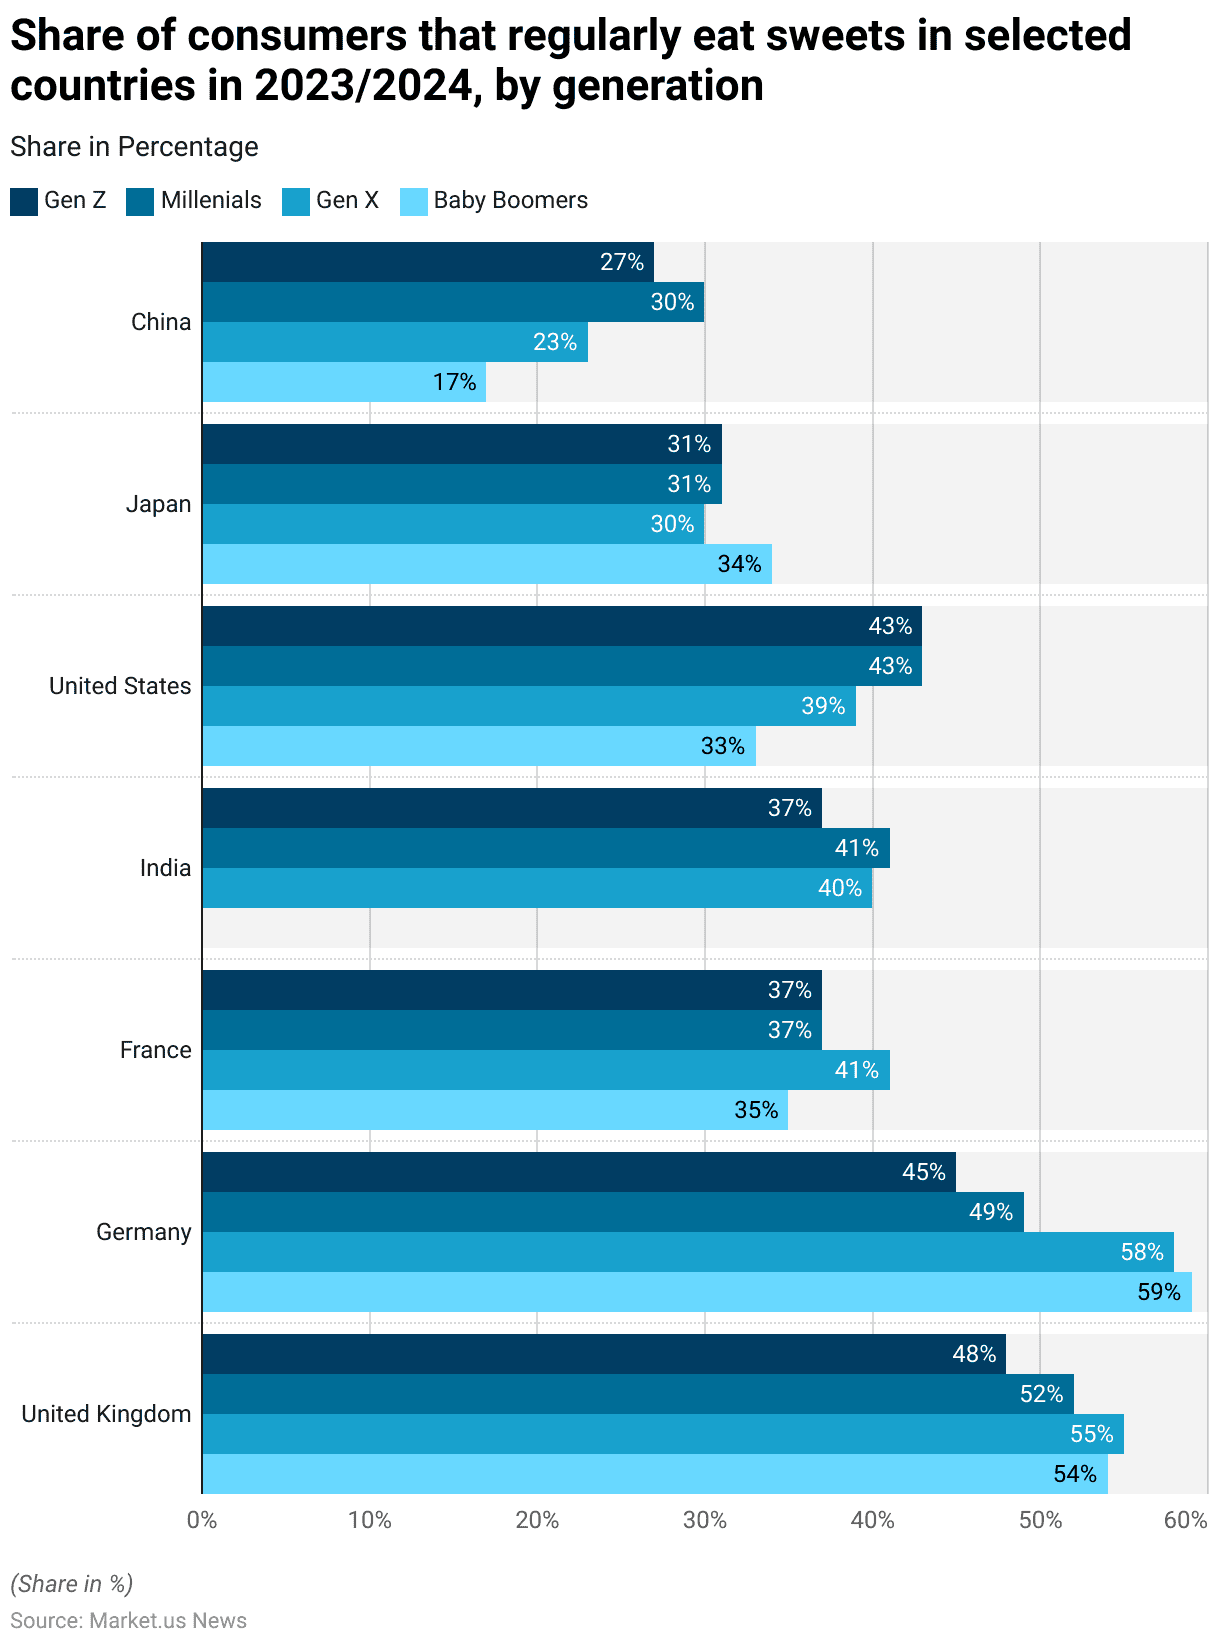
- In 2023/2024, the regular consumption of sweets varied by generation across several countries worldwide.
- In the United Kingdom, 48% of Gen Z, 52% of Millennials, 55% of Gen X, and 54% of Baby Boomers reported regularly eating sweets. Indicating a high and relatively even consumption across age groups.
- Similarly, in Germany, a high proportion of each generation indulged in sweets, with 45% of Gen Z, 49% of Millennials, 58% of Gen X, and 59% of Baby Boomers.
- In France, regular sweet consumption was lower, with 37% for both Gen Z and Millennials, 41% for Gen X, and 35% for Baby Boomers.
- India showed moderate levels of regular consumption, with 37% of Gen Z, 41% of Millennials, and 40% of Gen X consuming sweets, though data for Baby Boomers was not available.
- In the United States, 43% of both Gen Z and Millennials, 39% of Gen X, and 33% of Baby Boomers reported regular sweet consumption.
- Japan and China exhibited the lowest levels of regular sweet consumption. In Japan, 31% of both Gen Z and Millennials, 30% of Gen X, and 34% of Baby Boomers reported eating sweets regularly.
- China recorded the lowest percentages, with 27% of Gen Z, 30% of Millennials, 23% of Gen X, and 17% of Baby Boomers consuming sweets regularly.
- These figures highlight the variation in sweet consumption habits across generations and regions, with Western countries generally exhibiting higher regular consumption rates than Asian countries.
(Source: Statista)
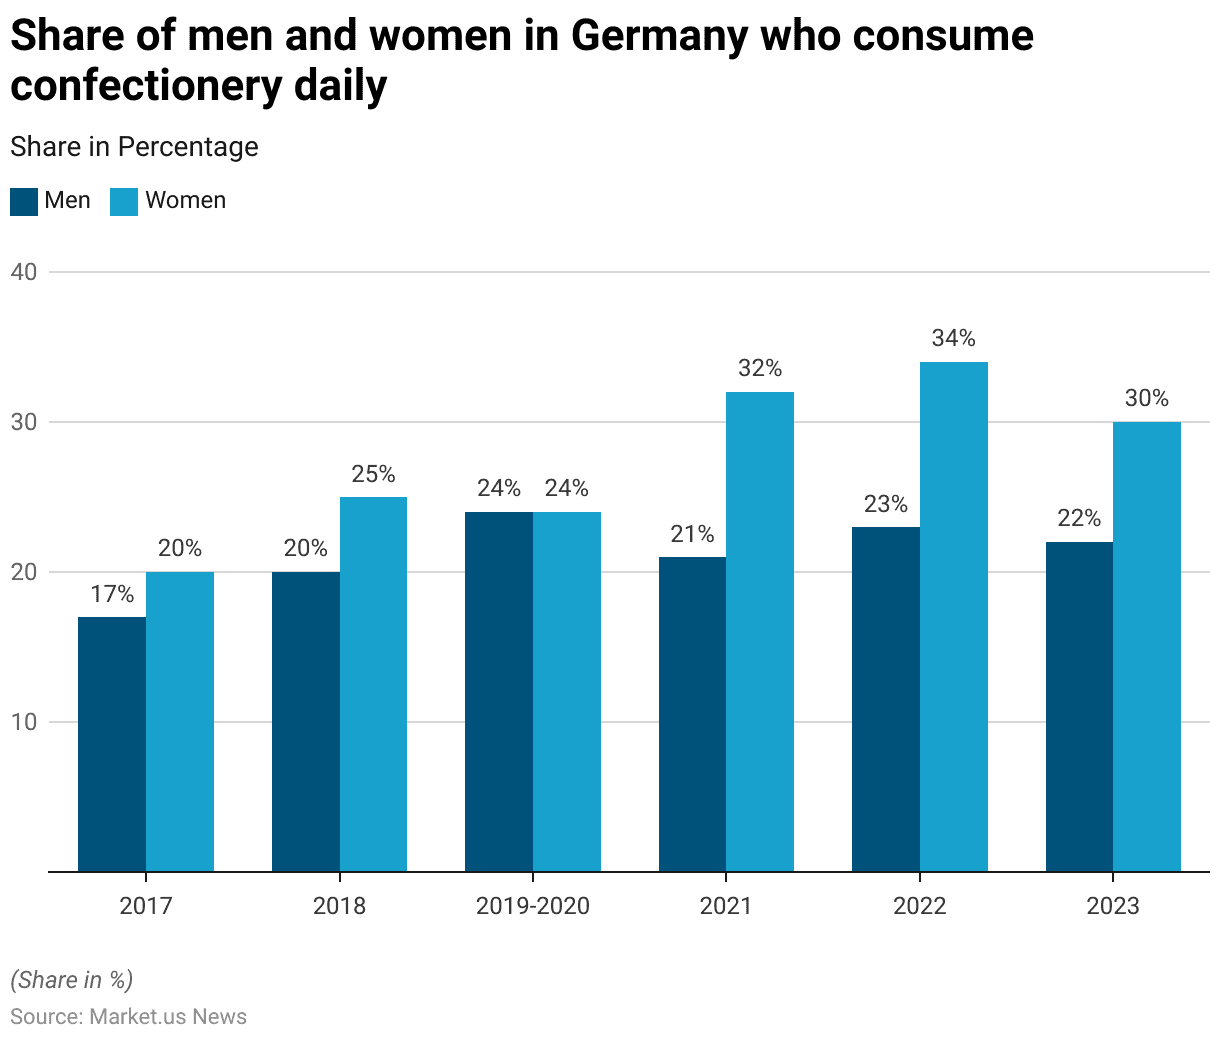
Daily Confectionery Consumption in Germany – by Gender Statistics
- From 2017 to 2023, the share of men and women in Germany who consumed confectionery daily varied, showing distinct trends by gender.
- In 2017, 17% of men and 20% of women reported daily consumption of confectionery.
- By 2018, this increased to 20% for men and 25% for women.
- During 2019-2020, both genders reached an equal share of 24% for daily consumption.
- In 2021, the share of women consuming confectionery daily rose sharply to 32%. While men declined slightly to 21%.
- This trend continued into 2022, with 34% of women and 23% of men reporting daily consumption.
- By 2023, daily confectionery consumption slightly decreased for both genders, with 22% of men and 30% of women partaking in daily consumption.
- Overall, women consistently showed a higher tendency for daily confectionery consumption than men over these years.
(Source: Statista)
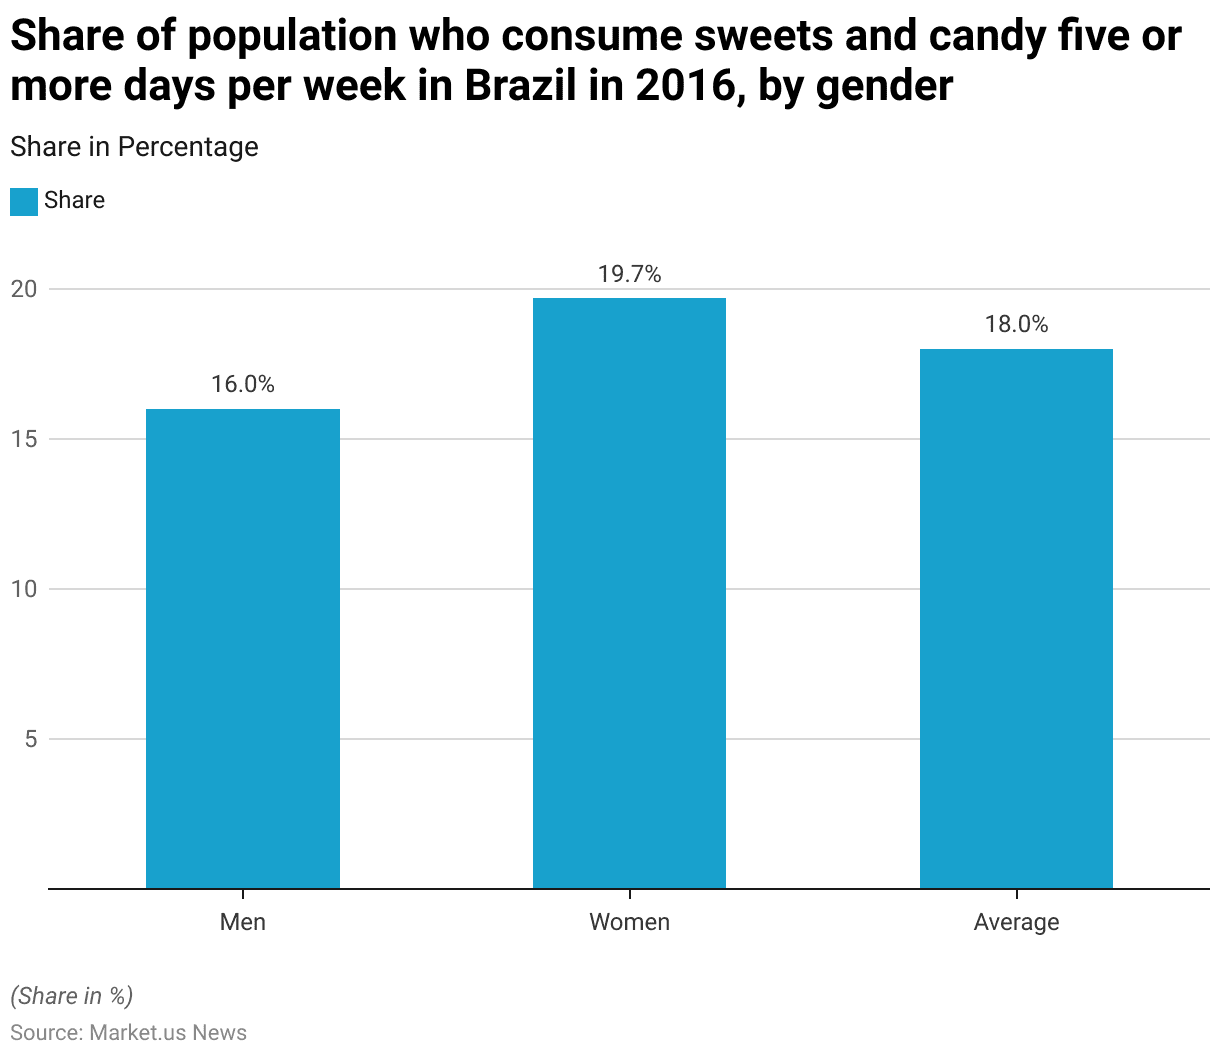
Regular Consumption of Sweets & Candy in Brazil – By Gender
- In 2016, the share of the Brazilian population consuming sweets and candy five or more days per week varied by gender.
- Among respondents, 16% of men reported frequent confectionery consumption, while a higher percentage of women, 19.7%, indicated similar habits.
- The overall average for both genders was 18%, highlighting a slightly greater inclination for frequent candy consumption among women compared to men in Brazil during that year.
(Source: Statista)
Consumer Preferences and Trends
Chocolate Consumption in the Festive Season in the United Kingdom – By Flavor
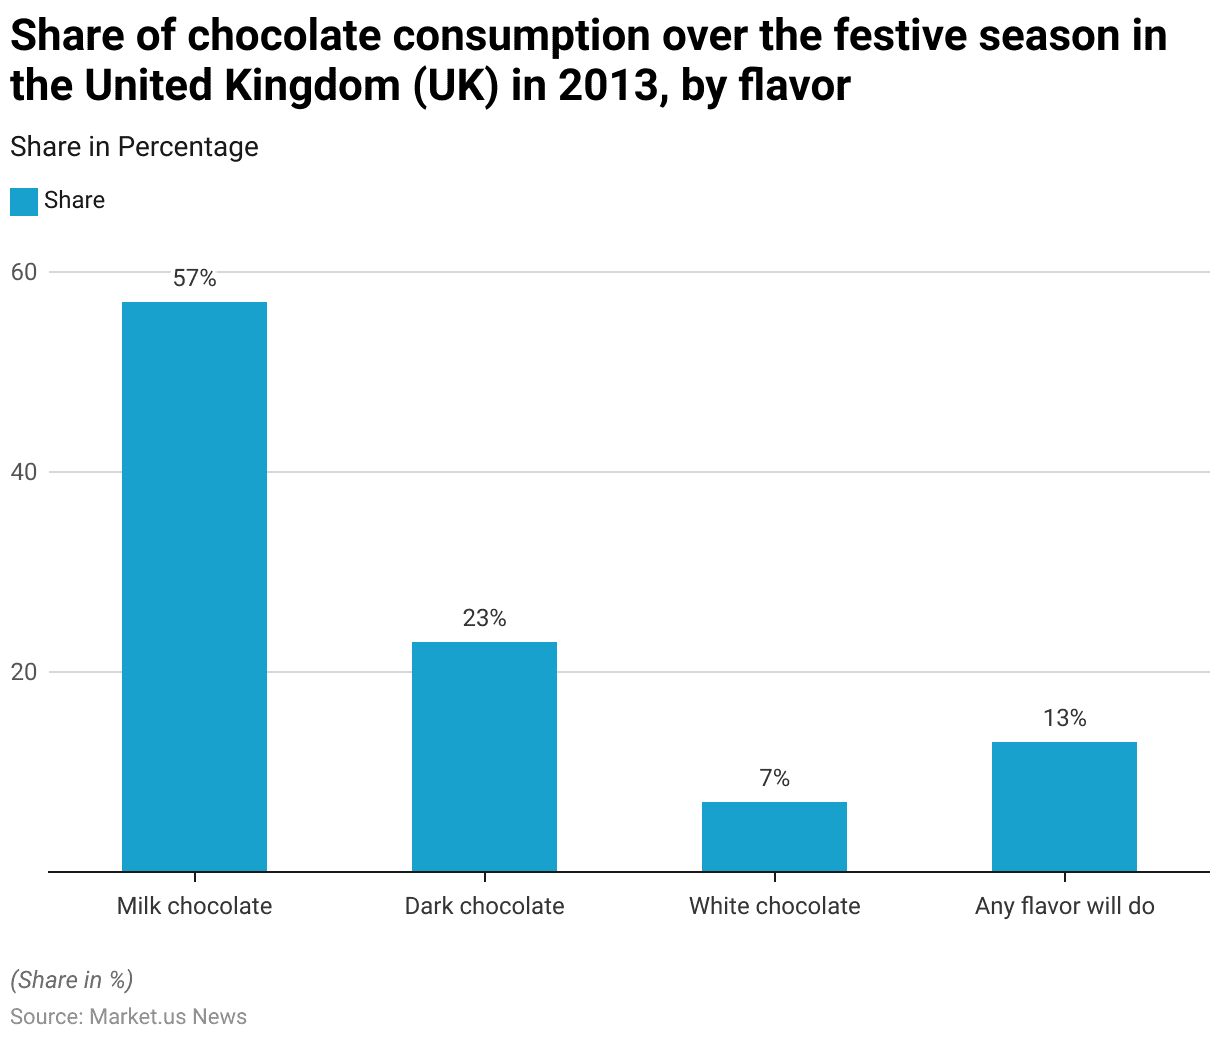
- In the United Kingdom, during the 2013 festive season, milk chocolate was the preferred choice among chocolate consumers, with 57% of respondents favoring this flavor.
- Dark chocolate was chosen by 23% of respondents, while white chocolate appealed to a smaller segment of 7%.
- Additionally, 13% of respondents indicated they had no specific flavor preference and would enjoy any type of chocolate.
- This data highlights milk chocolate’s popularity during the holidays, followed by a significant interest in dark chocolate.
(Source: Statista)
Chocolate Candy Brand Preferences in the U.S.
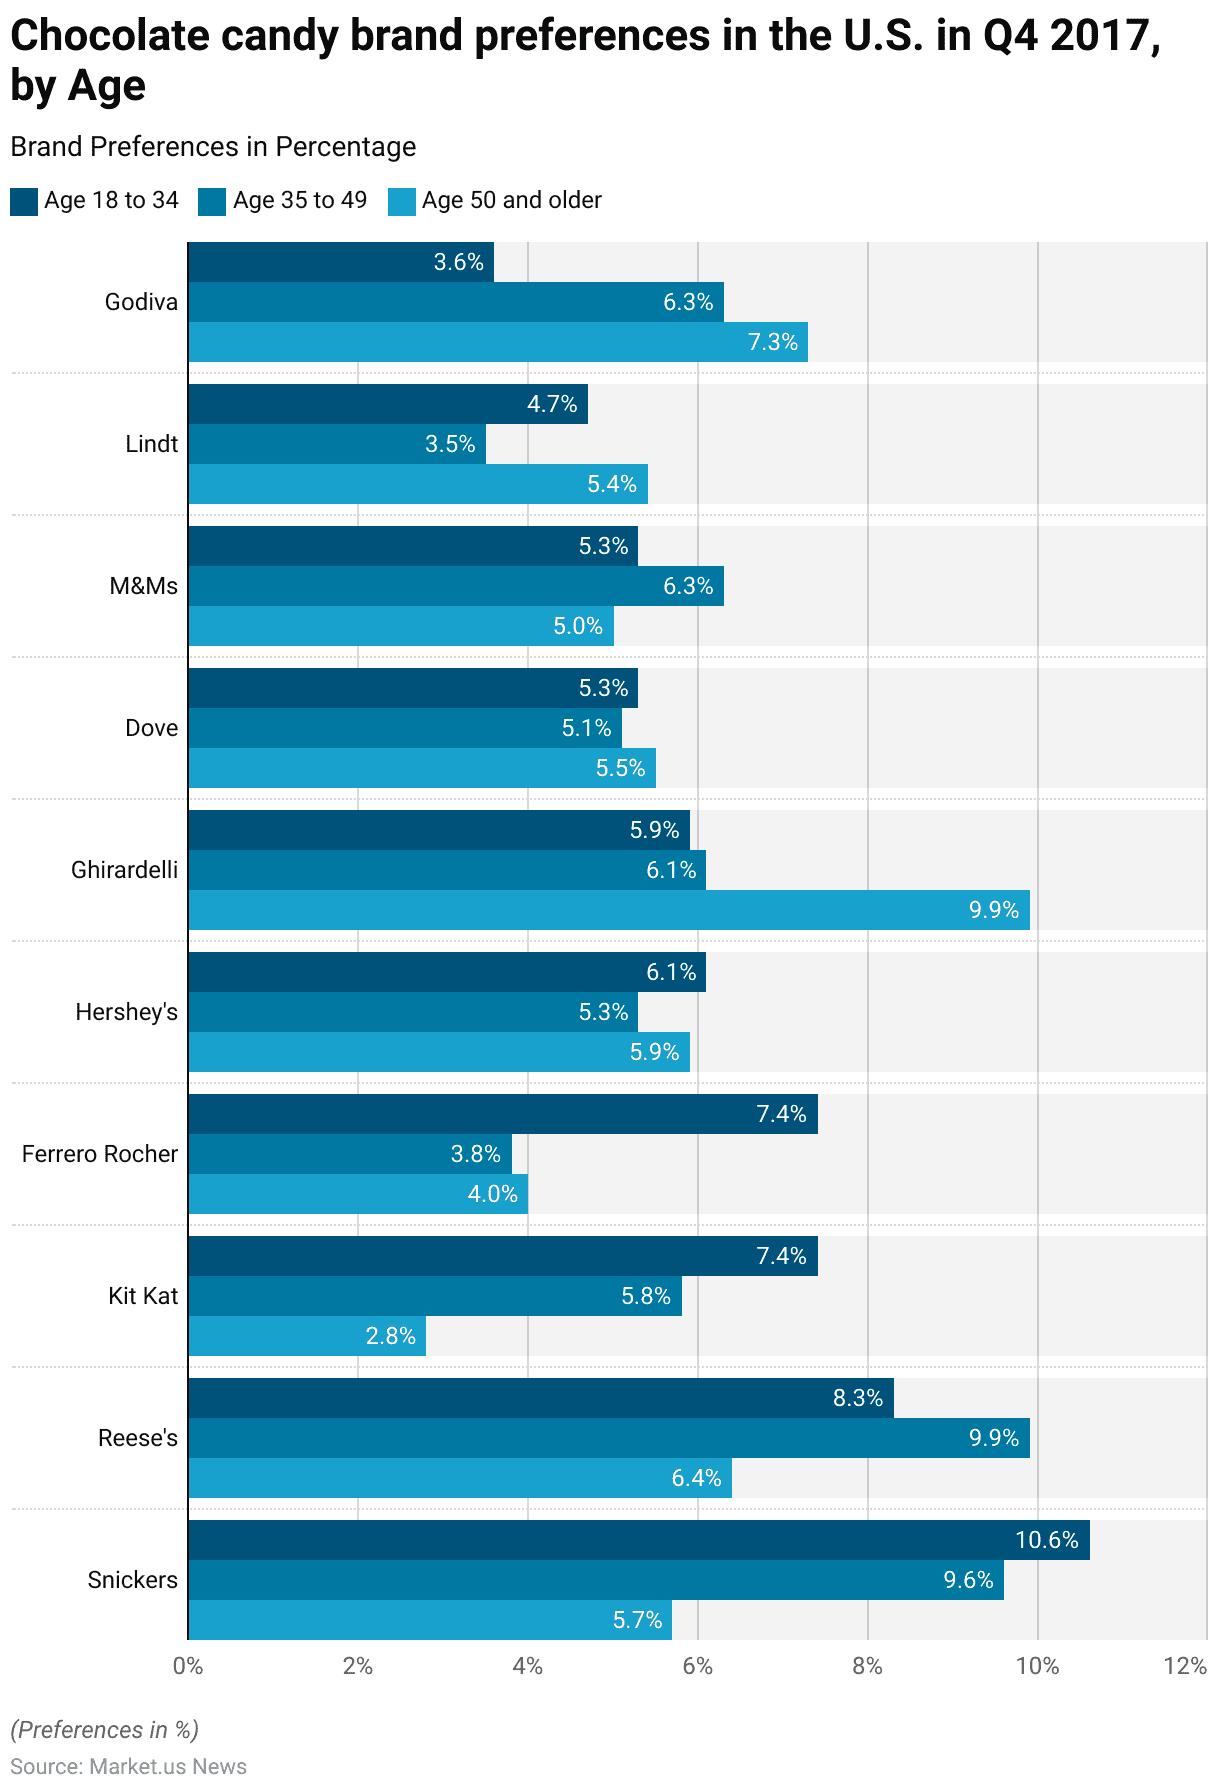
- In the United States, chocolate candy brand preferences varied by age group between October and December 2017.
- Among consumers aged 18 to 34, Snickers was the most popular brand, favored by 10.6%, followed by Reese’s at 8.3%, and Kit Kat and Ferrero Rocher, each at 7.4%.
- Hershey’s and Ghirardelli were chosen by 6.1% and 5.9%, respectively. While Dove and M&M each captured 5.3% of preferences. Lindt and Godiva were preferred by 4.7% and 3.6% of this younger demographic, respectively.
- For those aged 35 to 49, Reese’s was slightly more popular, with 9.9% favoring it, while Snickers followed closely at 9.6%.
- Ghirardelli was preferred by 6.1% in this age group. Along with M&Ms at 6.3% and Godiva at 6.3%. Kit Kat, Ferrero Rocher, Dove, and Hershey’s were less popular, with percentages ranging from 5.8% to 5.1%, and Lindt was chosen by 3.5%.
- Among consumers aged 50 and older, Ghirardelli and Godiva emerged as the top choices, each preferred by 9.9% and 7.3%, respectively. Reese’s was also popular among this group, with a 6.4% preference rate.
- Hershey’s, Lindt, and Dove each had around 5.5% to 5.9% support, while M&Ms captured 5%. Snickers saw a drop in preference among older consumers at 5.7%, and Kit Kat was chosen by only 2.8%.
- This data suggests a shift in brand preference with age, with Snickers and Reese’s favored among younger consumers, while Ghirardelli and Godiva gain popularity among older adults.
(Source: Statista)
Leading Factors Influencing Snack Brand Preference in Indonesia
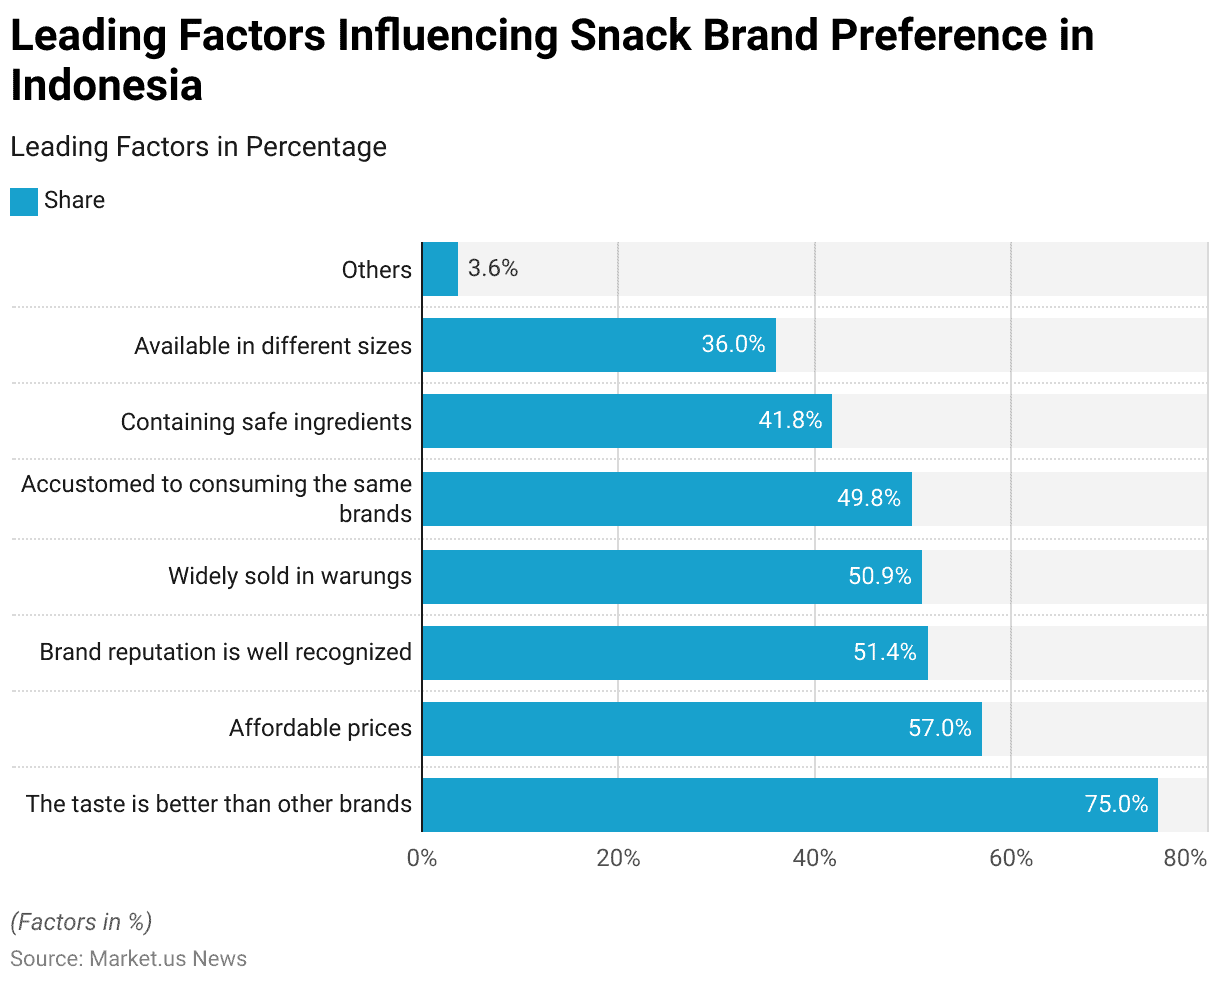
- As of August 2023, the primary factors influencing snack brand preferences in Indonesia were dominated by taste, with 75% of respondents favoring brands they perceived as tasting better than others.
- Price was another significant factor, with 57% of respondents valuing affordability.
- Brand reputation played an important role as well, with 51.4% of consumers choosing brands with recognized reputations.
- Additionally, 50.9% of respondents preferred brands widely sold in local warungs (small shops). While 49.8% continued to buy brands they were accustomed to consuming.
- Ingredient safety was also a key consideration, with 41.8% of consumers prioritizing snacks that contain safe ingredients.
- Variety in packaging sizes influenced 36% of respondents, who appreciated brands available in different sizes.
- A small percentage (3.6%) indicated other miscellaneous factors in their choice of snack brands.
- Further, this data underscores the importance of taste, affordability, and brand familiarity in shaping consumer preferences within Indonesia’s snack market.
(Source: Statista)
Impact of COVID-19
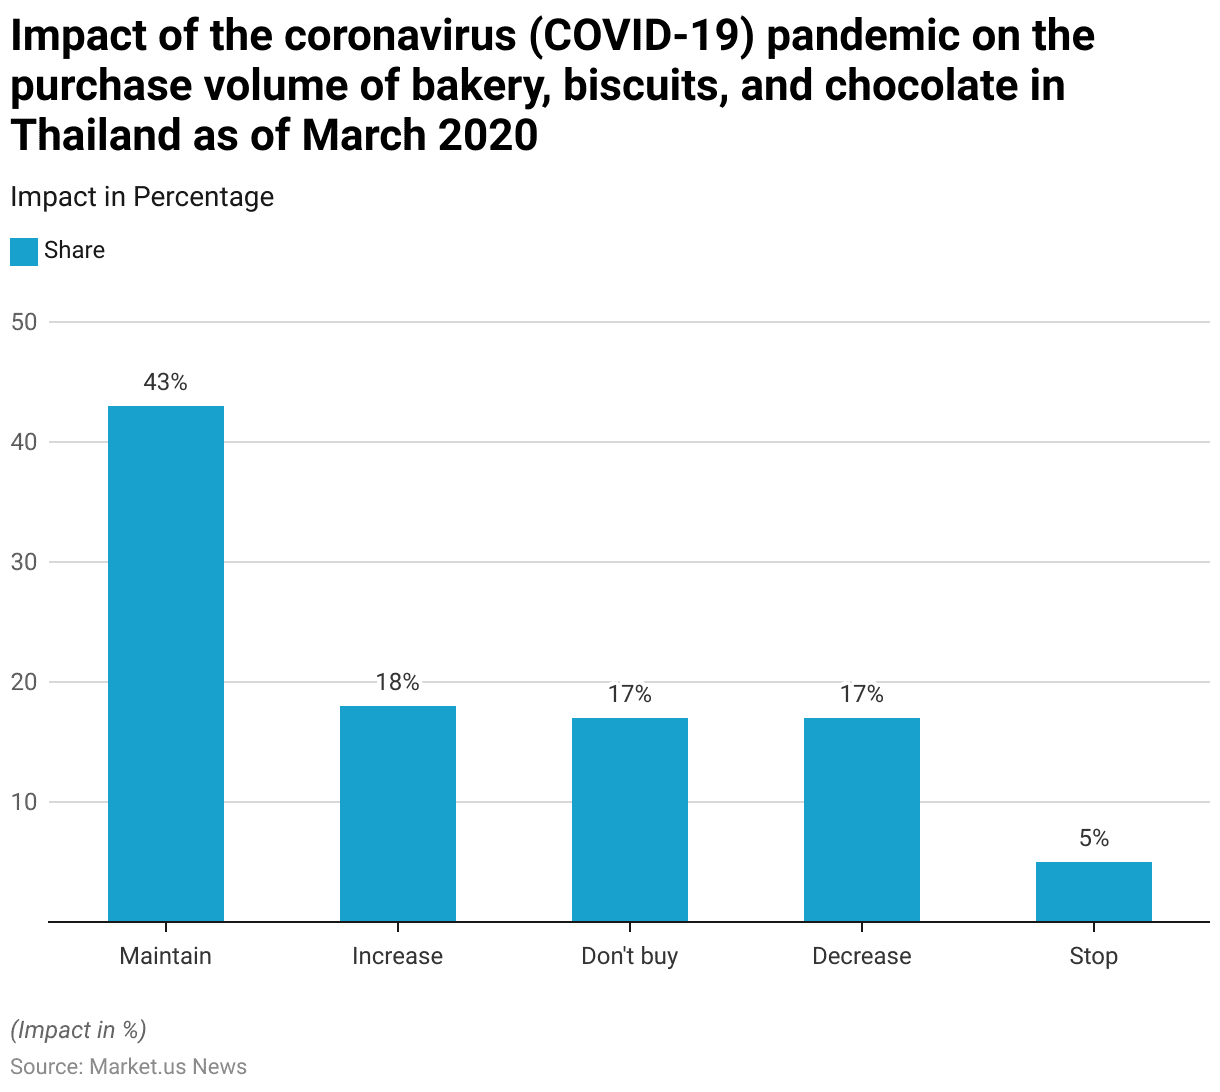
- As of March 2020, the COVID-19 pandemic had a varied impact on the purchase volume of bakery, biscuits, and chocolate in Thailand.
- Among respondents, 43% indicated they would maintain their current purchasing levels, while 18% reported plans to increase their purchases of these items.
- Conversely, 17% of respondents stated they did not buy these products at all, and another 17% planned to decrease their purchase volume.
- A small portion, 5%, indicated they would stop purchasing these items entirely.
- This data reflects a mixed response among consumers in Thailand, with some maintaining or increasing their consumption of indulgent products. In contrast, others chose to reduce or halt purchases amid the pandemic.
(Source: Statista)
Related Emerging Markets
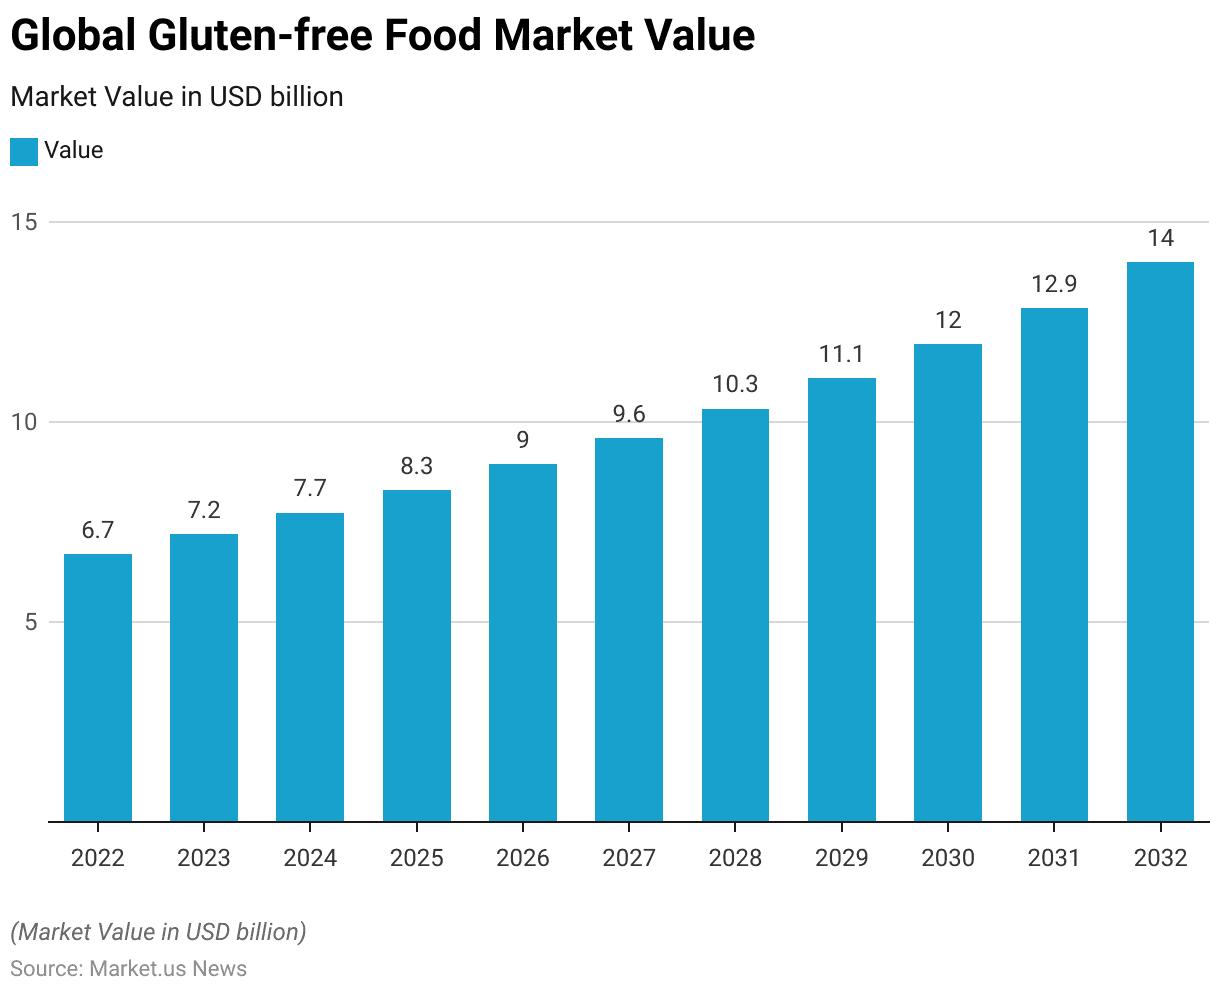
Global Gluten-free Food Market Value
- The global gluten-free food market is projected to experience consistent growth from 2022 through 2032.
- In 2022, the market was valued at approximately USD 6.7 billion, rising to USD 7.2 billion in 2023.
- This upward trend is expected to continue, with market value reaching USD 7.74 billion in 2024 and USD 8.32 billion in 2025.
- By 2026, the gluten-free market is projected to expand further to USD 8.95 billion, followed by USD 9.62 billion in 2027 and USD 10.34 billion in 2028.
- Projections for 2029 indicate a market value of USD 11.12 billion, continuing to USD 11.95 billion in 2030.
- The growth is anticipated to accelerate, with the market reaching USD 12.85 billion by 2031 and USD 14 billion by 2032.
- This steady increase reflects the rising demand for gluten-free products, driven by health-conscious consumers, increased awareness of gluten intolerance, and a growing trend towards specialized diets globally.
(Source: Statista)
Global Plant-based Bakery and Confectionery Market Size – By Region Statistics
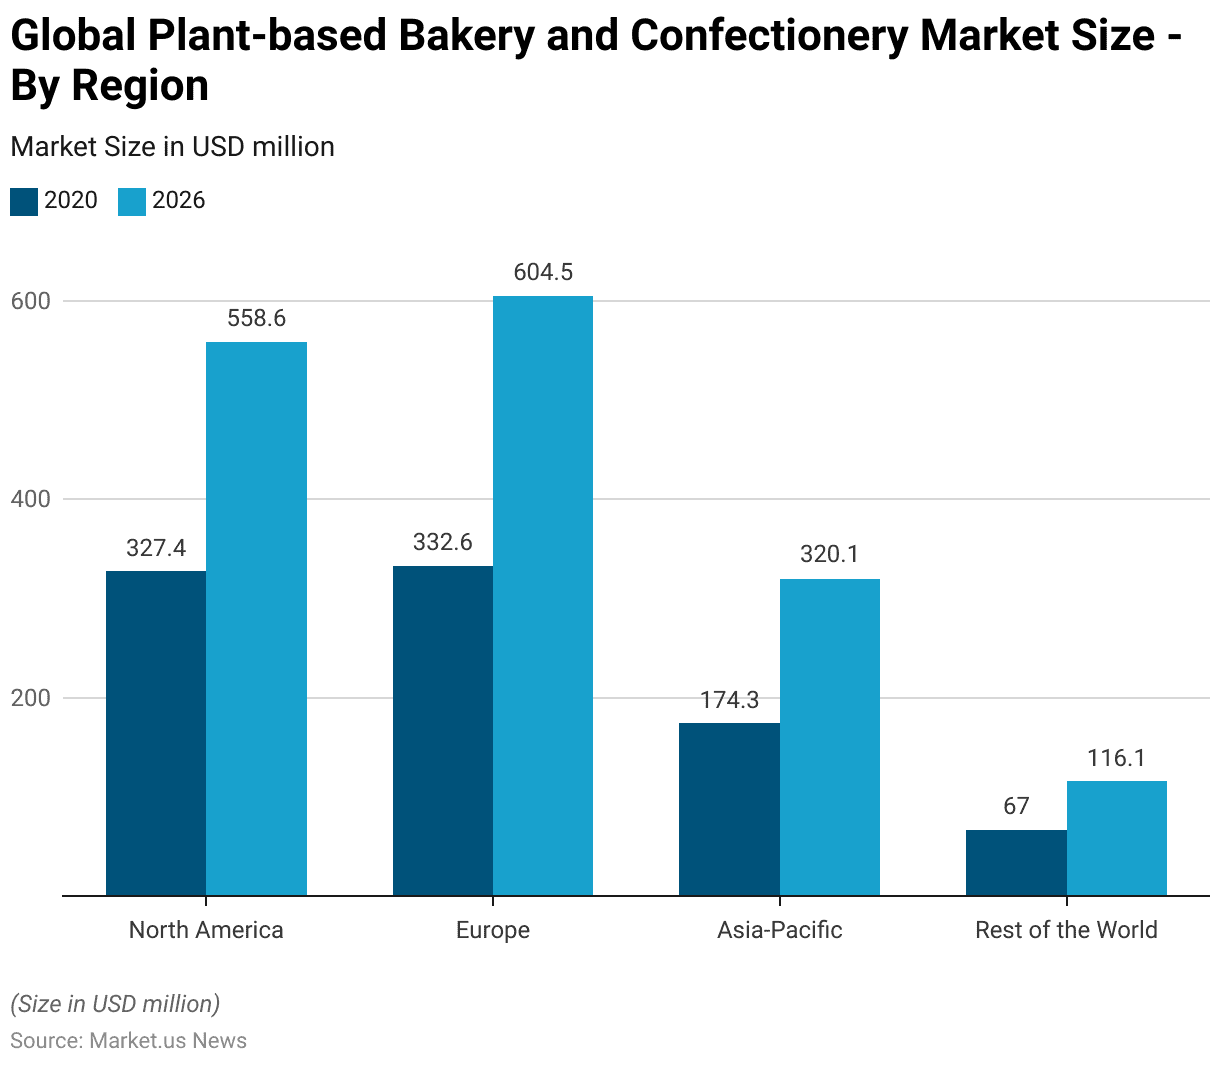
- The global plant-based bakery and confectionery market is expected to see substantial growth across various regions from 2020 to 2026.
- In 2020, North America’s market size was valued at USD 327.4 million, which is projected to increase significantly to USD 558.6 million by 2026.
- Europe held the largest share in 2020, with a market size of USD 332.6 million. Which is anticipated to grow to USD 604.5 million by 2026, reflecting strong demand in the region.
- The Asia-Pacific region is also expected to experience notable growth, with the market size increasing from USD 174.3 million in 2020 to an estimated USD 320.1 million by 2026.
- The “Rest of the World” category, covers regions outside the major markets. If had a market value of USD 67 million in 2020, with projections suggesting growth to USD 116.1 million by 2026.
- Moreover, this data indicates a growing global trend towards plant-based bakery and confectionery products, driven by increasing consumer interest in health-conscious and sustainable dietary choices.
(Source: Statista)
Emerging Trends
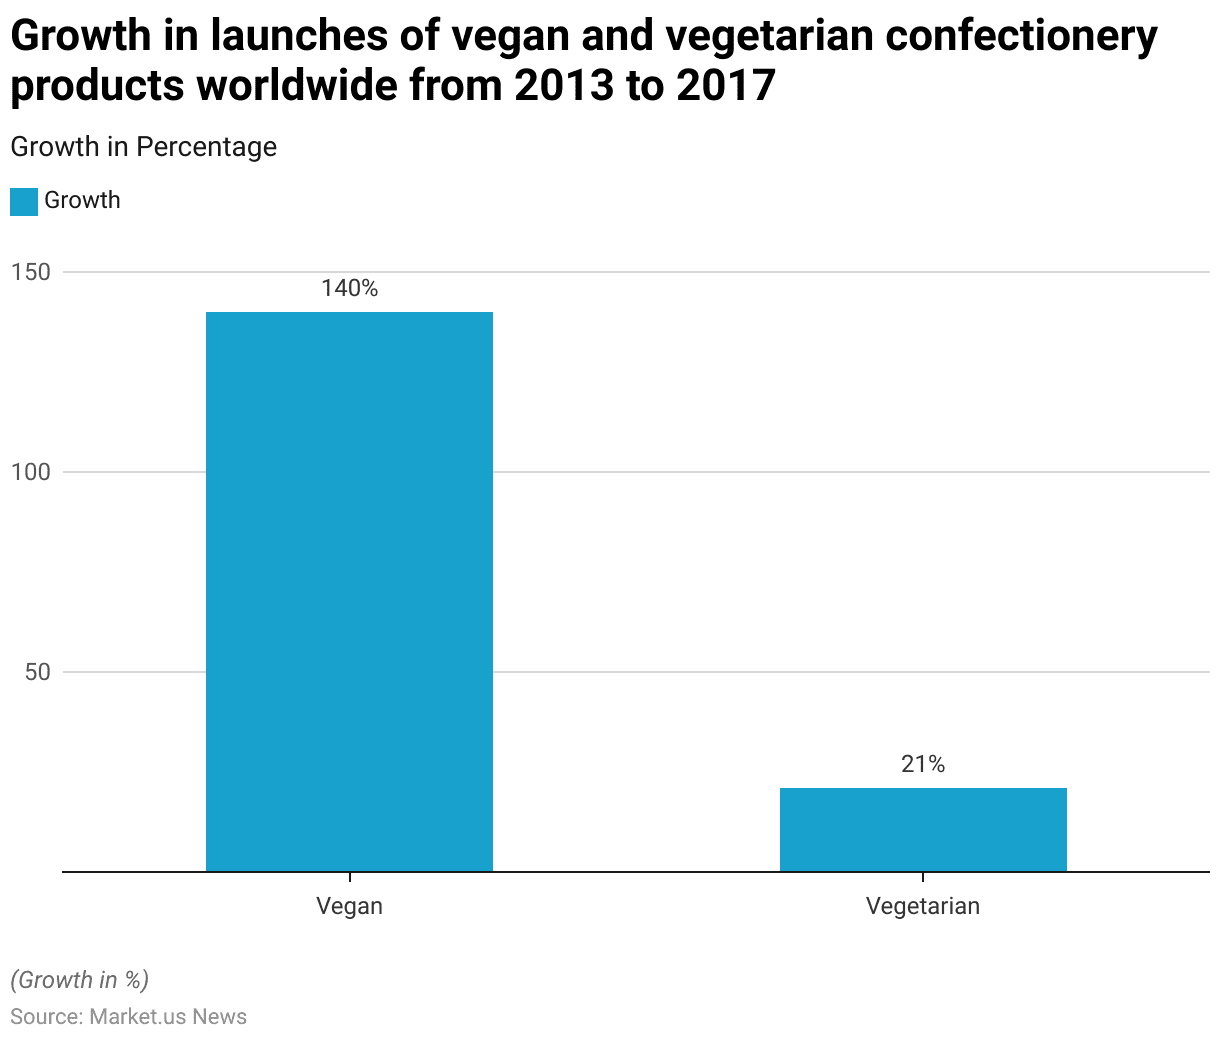
- Between 2013 and 2017, the global confectionery market saw a significant increase in product launches targeting vegan and vegetarian consumers.
- Vegan confectionery product launches experienced a remarkable growth of 140%, reflecting a strong trend toward plant-based and animal-free options.
- In contrast, vegetarian confectionery product launches grew by 21%, indicating a more moderate increase in offerings that cater to consumers avoiding meat but still consuming animal-derived ingredients like dairy.
- This trend underscores a rising demand for vegan options like vegan meat etc, driven by shifting consumer preferences towards plant-based and sustainable diets.
(Source: Statista)
Regulations for Confectionery Products Statistics
- The regulatory landscape for confectionery products varies significantly by country, reflecting diverse concerns about health, environment, and trade.
- In the European Union, recent regulations focus heavily on environmental sustainability. Such as the European Union Deforestation Regulation (EUDR). Which mandates that commodities like cocoa, which are involved in confectionery products, must not contribute to deforestation.
- This regulation, set to be implemented by the end of 2024, requires companies to provide traceability for their commodities. Ensuring they do not originate from protected forest areas.
- Furthermore, the EU has also overhauled its packaging and waste rules, aiming for all packaging to be reusable or recyclable by 2030.
- In the United States, the focus has been on international trade and market competitiveness within the confectionery sector. U.S. confectionery exports valued at $856.88 million in 2023 indicate a robust and competitive market with considerable growth over the past decade.
- Regulations here tend to emphasize food safety and trade compliance, contributing to a dynamic market environment.
- Other countries are also enhancing their regulatory frameworks to address both consumer safety and environmental impact. For example, significant legislation in the EU aims to prevent products linked to deforestation from entering its market, affecting confectionery products containing ingredients like cocoa and palm oil.
- Moreover, these regulatory variations reflect the complex interplay of health, environmental, and economic priorities that companies must navigate in the global confectionery industry. Understanding and complying with these regulations is crucial for companies to maintain market access and competitive advantage.
(Source: confectionerynews.com, USDA foreign agricultural service)
Recent Developments
Acquisitions and Mergers:
- Mondelez International acquires Gourmet Food Company: In 2023, Mondelez International, a leading snack and confectionery company, acquired Gourmet Food Company for $500 million. This acquisition enhances Mondelez’s portfolio in premium chocolates and specialty candies. Catering to the growing consumer demand for high-quality confectionery products.
- Ferrero merges with Barilla: In early 2024, Ferrero announced a merger with Barilla. Primarily known for pasta but also involved in producing confectionery items, for $1.2 billion. This merger aims to expand Ferrero’s reach into the baked goods market and diversify its product offerings.
New Product Launches:
- Mars Wrigley introduces M&M’s with nuts: In mid-2023, Mars Wrigley launched a new line of M&M’s with mixed nuts. Combining the classic chocolate with crunchy nuts. This product aims to cater to health-conscious consumers looking for snacks with added nutritional benefits and is expected to boost M&M’s sales by 15% within the first year.
- Hershey’s unveils plant-based chocolate bars: In late 2023, Hershey’s introduced its new range of plant-based chocolate bars, targeting the growing demand for vegan products. This line includes flavors like dark chocolate and almond, aiming to capture 10% of the vegan chocolate market by 2025.
Funding:
- Sugarfina raises $30 million for expansion: In 2023, Sugarfina, a luxury candy retailer. Raised $30 million in funding to expand its product line and increase its retail footprint. The funds will support the development of new gourmet confections and expansion into international markets.
- Chococo secures $5 million for sustainable chocolate production: In early 2024, Chococo, a UK-based artisanal chocolate brand. Secured $5 million to enhance its sustainable chocolate production methods. This funding will focus on sourcing ethically produced cocoa and reducing environmental impact.
Technological Advancements:
- AI in confectionery manufacturing: By 2025, it is expected that 30% of confectionery manufacturers will integrate AI-driven technologies to optimize production processes. Improve quality control, and reduce waste, leading to increased efficiency and lower costs.
- Sustainable packaging innovations: The trend toward sustainability is growing. By 2026, 40% of confectionery brands are expected to adopt eco-friendly packaging solutions. Such as biodegradable wrappers and recyclable materials, to reduce environmental impact.
Conclusion
Confectionery Statistics – The global confectionery market shows steady growth, fueled by evolving consumer preferences, product innovation, and expanding reach.
While traditional markets in Western Europe and North America remain strong, emerging regions like Asia-Pacific are also seeing increased demand.
Health-conscious trends are shaping the market, driving growth in vegan, gluten-free, and plant-based confectionery alongside indulgent options.
The COVID-19 pandemic reinforced confectionery’s resilience, as many consumers maintained or increased purchases.
Looking forward, digital channels, urbanization, and social media influence are set to further shape this market. With brands balancing indulgence and health-focused offerings to meet diverse consumer needs.
FAQs
Confectionery refers to sweet food products, including chocolates, candies, gums, and pastries. It is generally divided into categories like sugar confectionery (candies, gummies), chocolate confectionery (chocolates), and bakers’ confectionery (cakes, pastries).
Growth is driven by rising disposable incomes and urbanization. Increased demand for indulgent products, seasonal and festive consumption, and product innovation. Such as vegan and gluten-free options. Health-conscious trends are also pushing brands to offer low-sugar, organic, and plant-based alternatives.
The pandemic led to shifts in purchasing behavior, with many consumers buying more indulgent products for comfort. However, economic uncertainty affected disposable income in some regions, impacting sales. Digital channels became increasingly important, with a surge in online confectionery purchases.
Western Europe and North America are traditional strongholds with high per capita consumption. Emerging markets, particularly in Asia-Pacific, Latin America, and parts of Africa. They are also seeing rapid growth due to rising disposable incomes and urbanization.
As consumers become more health-conscious, there is a higher demand for healthier alternatives, including low-sugar, plant-based, and high-protein options. This shift is leading brands to innovate with new ingredients and formulations.


