Table of Contents
- Introduction
- Editor’s Choice
- Fitness Tracker Market Statistics
- Fitness Tracker Devices Shipments Statistics
- Fitness Tracker Users Statistics
- Fitness Tracker Devices Penetration Statistics
- Fitness Tracker Devices Sales Statistics
- Fitness Tracker Devices Brands Statistics
- Consumer Demographics
- Regional Insights
- Consumer Preferences and Trends
- Concerns and Challenges
- Innovations in Fitness Tracking Devices
- Recent Developments
- Conclusion
- FAQs
Introduction
Fitness Tracker Statistics: Fitness trackers are wearable devices designed to monitor and record physical activity and health metrics.
They track steps, distance, calories burned, and heart rate and offer features like sleep tracking and various exercise modes.
Advanced models can measure stress levels and blood oxygen saturation and integrate with smartphones for notifications and music control.
Available in forms such as wristbands, clip-ons, and smart jewelry, fitness trackers vary in display types and battery life.
They are compatible with both iOS and Android devices and provide users. With actionable insights to set and achieve fitness goals, contributing to overall health and wellness.
Editor’s Choice
- The global fitness tracker market generated a revenue of USD 46.3 billion in 2023.
- By 2032, the fitness tracker market is poised to surpass USD 187.2 billion. The revenue for fitness bands alone is projected at USD 81.06 billion.
- The global fitness tracker market is segmented by application, with running tracking holding the largest share at 43%.
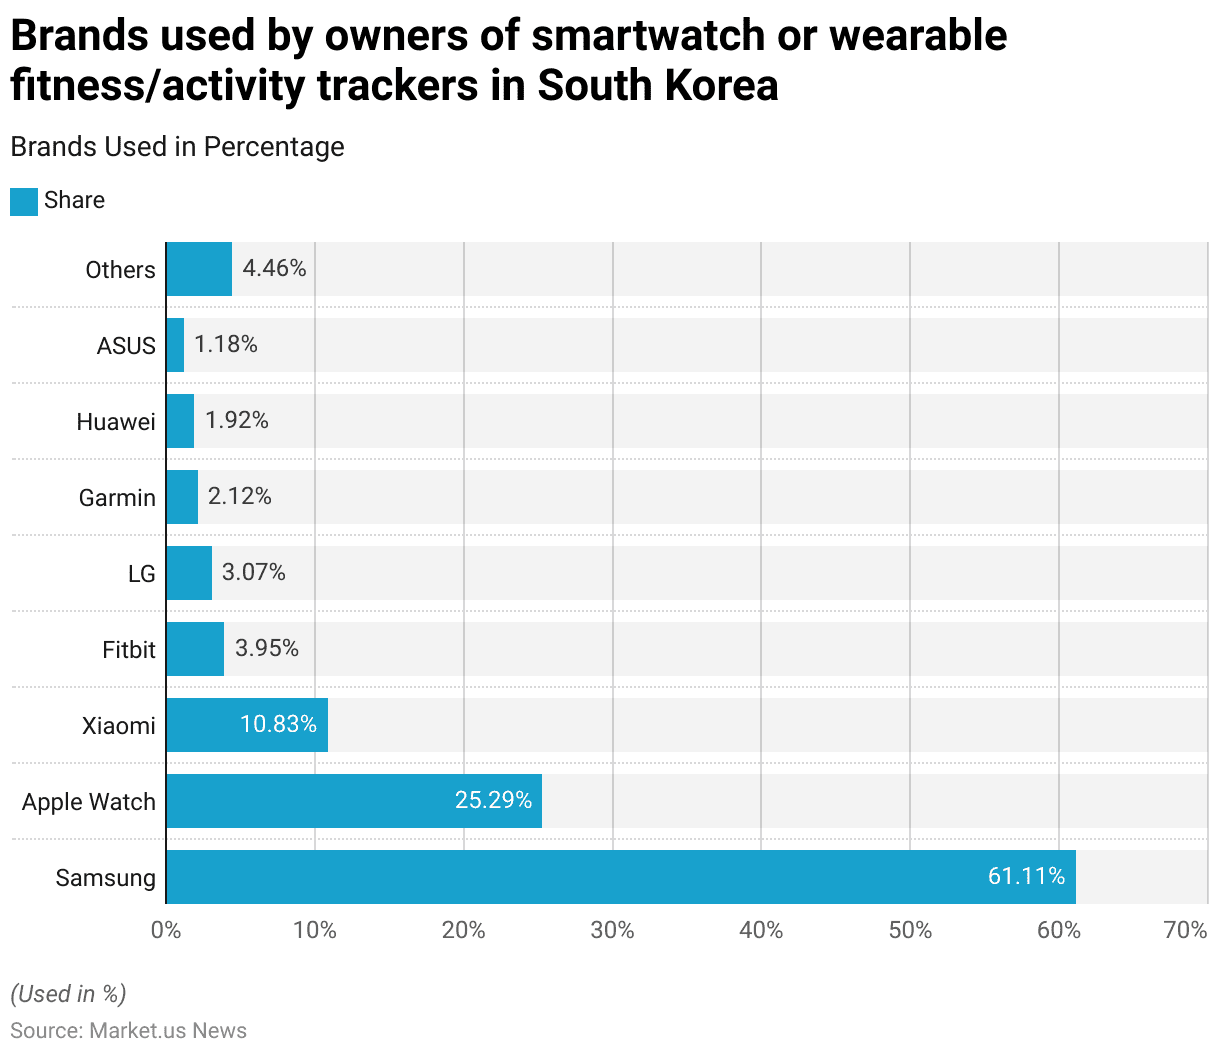
- As of September 2022, the preferences for smartwatch and wearable fitness/activity tracker brands among users. In South Korea showed a strong dominance by Samsung, commanding a significant 61.11% share of respondents.
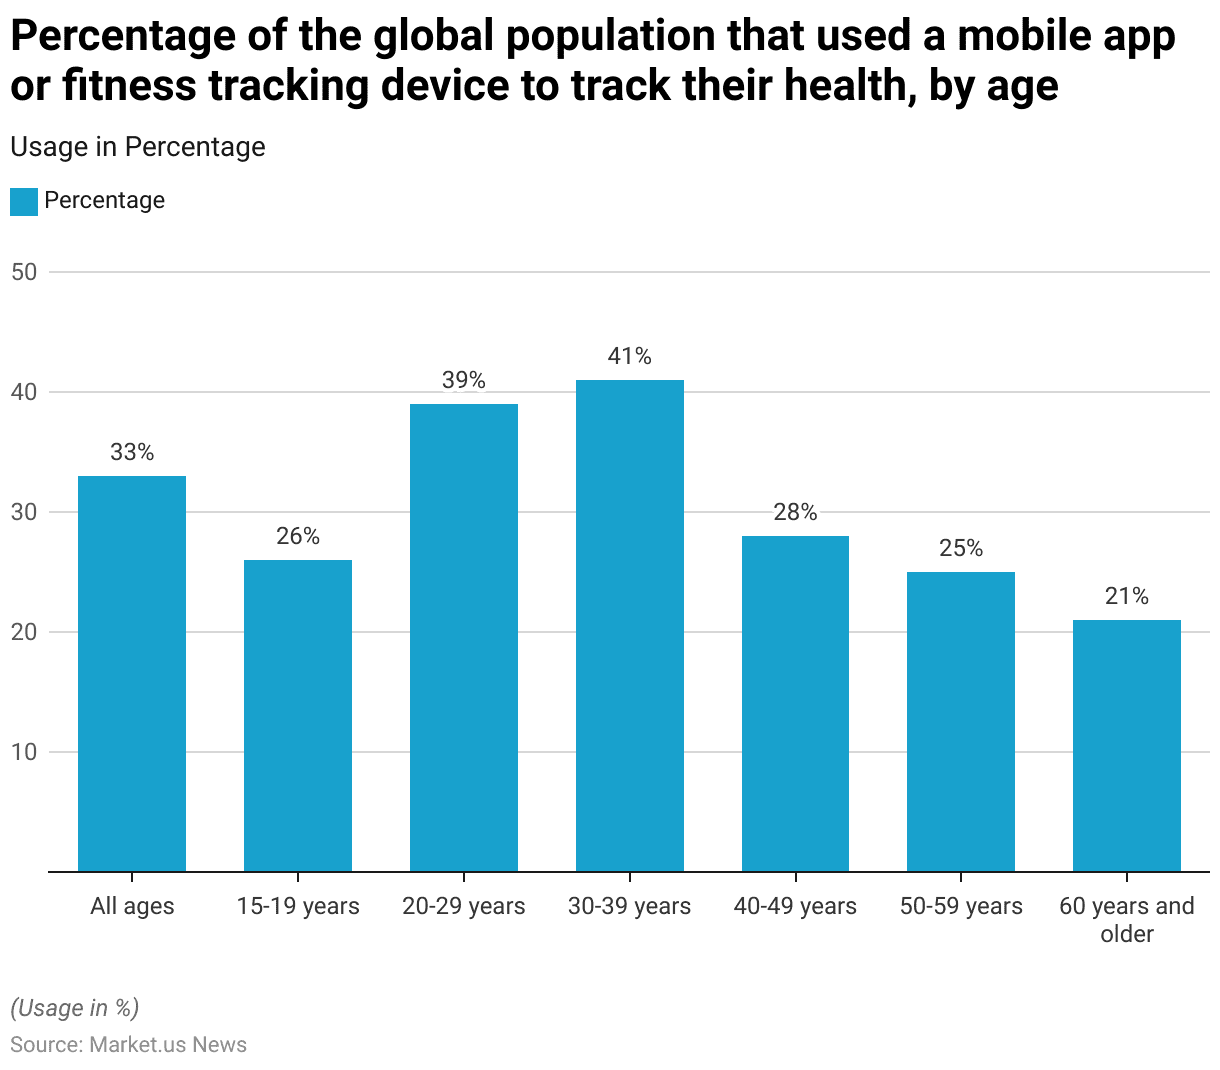
- In 2016, the usage of mobile apps or fitness-tracking devices to monitor health varied across different age groups globally. Usage was highest among those aged 30-39 years, with 41% employing health-tracking tools.
- In the United States, as of 2023, the use of wearable fitness or wellness technologies showed a fairly balanced distribution between genders. Women had a slightly higher usage rate at 35% compared to men, who had a usage rate of 34%.
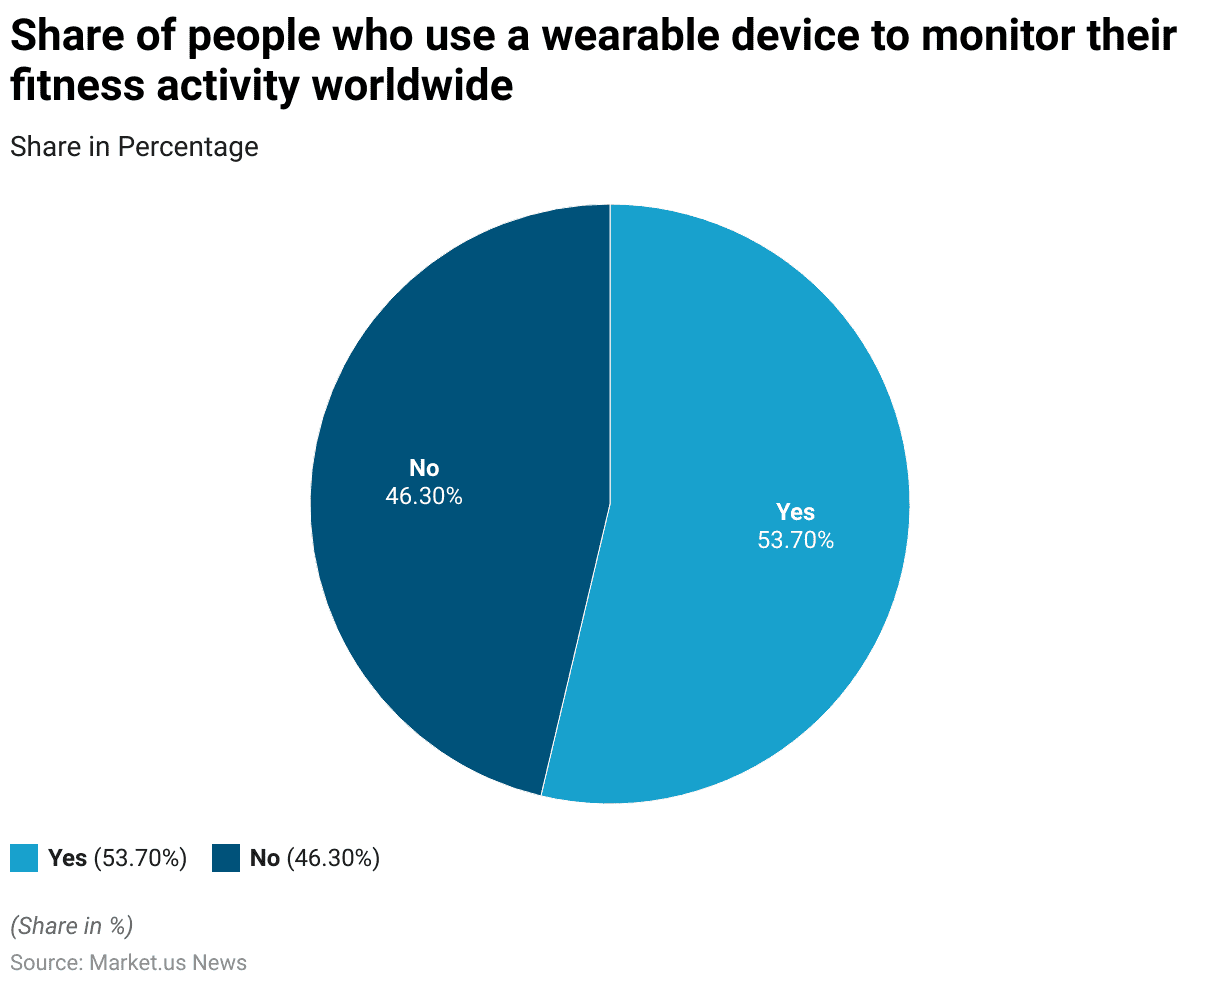
- As of January 2022, a global survey revealed that 53.70% of respondents reported using a wearable device to monitor their fitness activity. Indicating a majority uptake in the use of technology for health monitoring.
- In 2015, a survey conducted in Europe explored the perceived risk of wearable fitness trackers being hacked. Specifically by an employee of an on-demand video streaming media company. The results indicated a considerable concern among respondents. With 24% considering it very likely and 46% viewing it as somewhat likely that such a breach could occur.
Fitness Tracker Market Statistics
Global Fitness Tracker Market Size Statistics
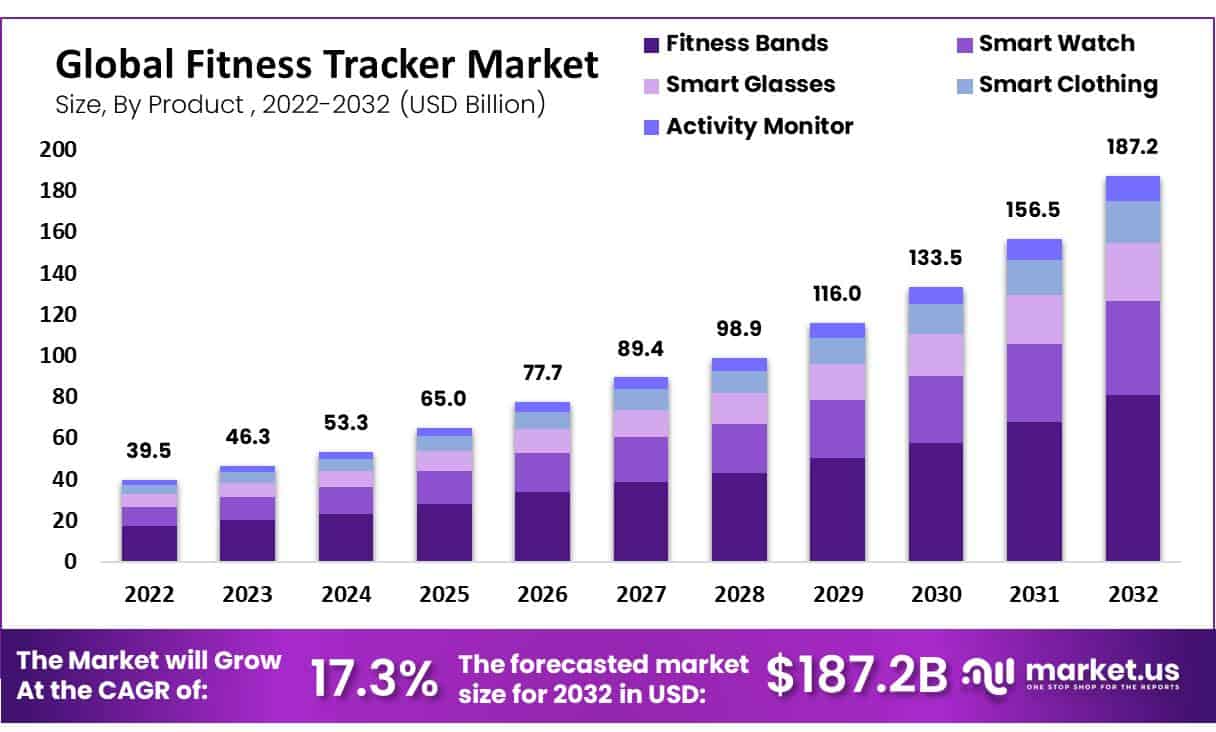
- The global fitness tracker market generated a revenue of USD 39.5 billion in 2022 at a CAGR of 17.3%.
- This figure increased to USD 46.3 billion in 2023 and is projected to continue its upward trajectory, reaching USD 53.3 billion in 2024.
- By 2025, market revenue is expected to grow further to USD 65.0 billion. Followed by USD 77.7 billion in 2026 and USD 89.4 billion in 2027.
- The market is anticipated to expand significantly in the following years, with revenues projected to reach USD 98.9 billion by 2028 and USD 116.0 billion by 2029.
- By 2030, the global fitness tracker market is forecasted to reach USD 133.5 billion. Continuing its robust growth to USD 156.5 billion in 2031 and culminating at an impressive USD 187.2 billion by 2032.
- This steady increase reflects the growing demand for wearable fitness technology across the globe.
(Source: market.us)
Global Fitness Tracker Market Size – By Product Statistics
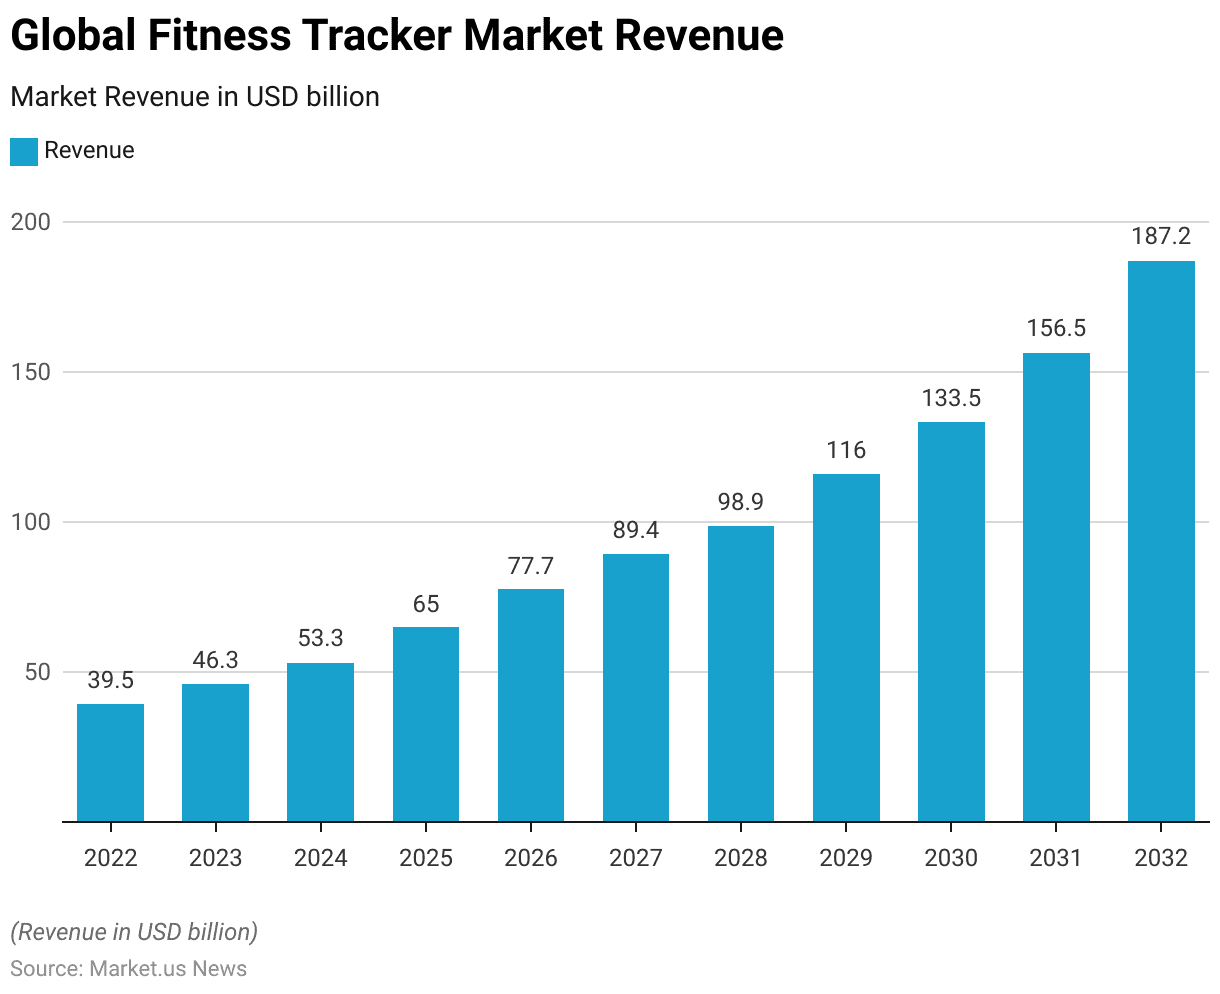
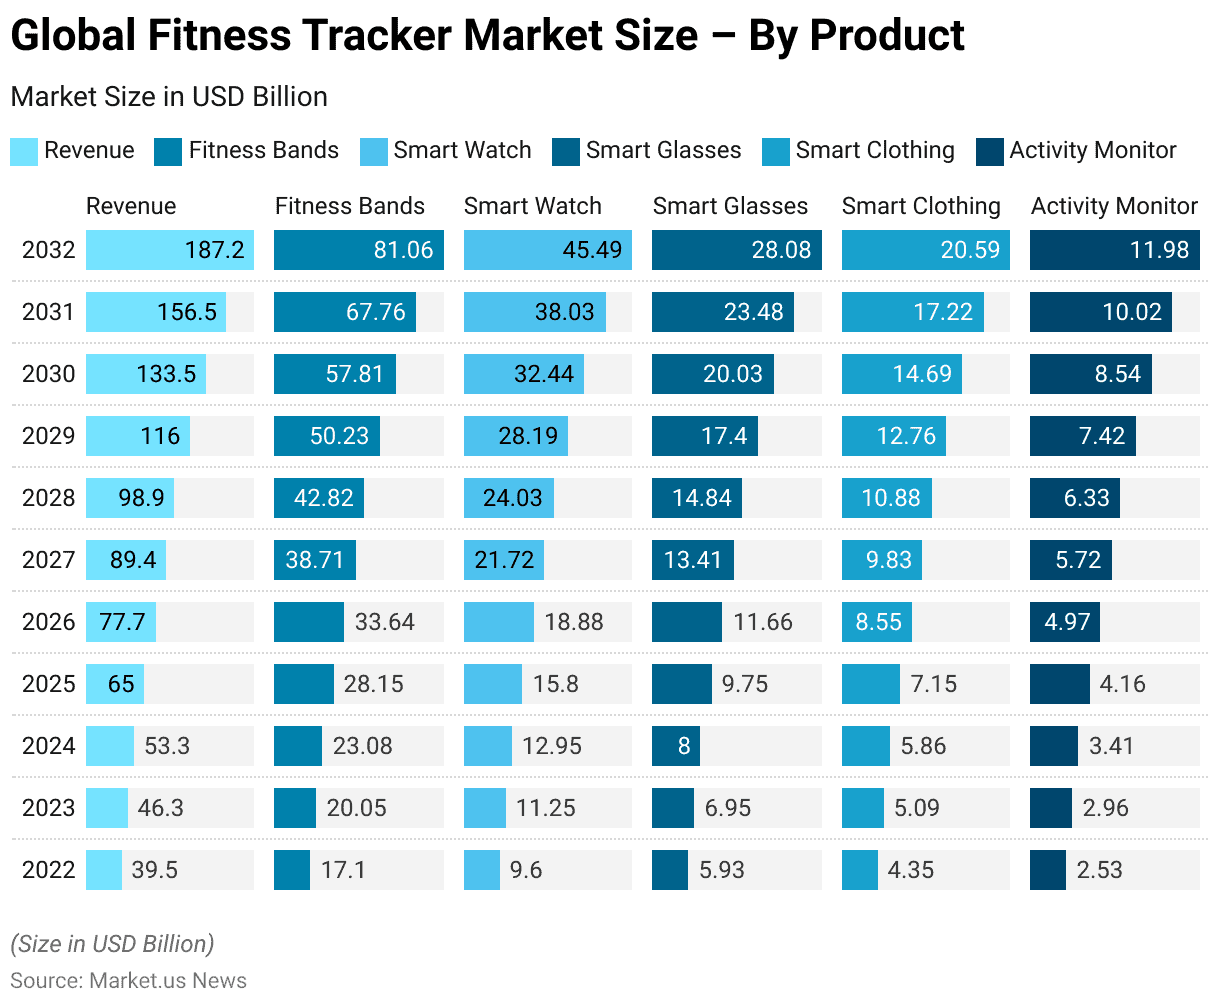
- The global fitness tracker market has experienced substantial growth, with revenues increasing from USD 39.5 billion in 2022 to a projected USD 187.2 billion by 2032.
- In 2022, fitness bands dominated the product segment, generating USD 17.10 billion, followed by smartwatches at USD 9.60 billion, smart glasses at USD 5.93 billion, smart clothing at USD 4.35 billion, and activity monitors at USD 2.53 billion.
- By 2023, the market size had escalated to USD 46.3 billion, reflecting a higher adoption rate across all product categories, with fitness bands rising to USD 20.05 billion and smart watches to USD 11.25 billion.
- This trend will continue through 2024 and beyond, with the market expected to reach USD 53.3 billion in 2024. The revenue for fitness bands is anticipated to increase to USD 23.08 billion, while smartwatches are projected to reach USD 12.95 billion.
- In the following years, all product segments exhibited consistent growth. By 2025, the market is projected to expand to USD 65.0 billion, with fitness bands generating USD 28.15 billion in revenue.
- The growth trajectory maintains upward momentum into the latter part of the decade, with the total market forecasted to achieve USD 98.9 billion by 2028. Here, fitness bands and smartwatches are expected to contribute USD 42.82 billion and USD 24.03 billion, respectively.
- The forecast for 2031 shows a market size of USD 156.5 billion, with significant contributions from all categories. Particularly fitness bands at USD 67.76 billion and smart watches at USD 38.03 billion.
- By 2032, the fitness tracker market is poised to surpass USD 187.2 billion. The revenue for fitness bands alone is projected at USD 81.06 billion.
(Source: market.us)
Fitness Tracker Market Share – By Application Statistics
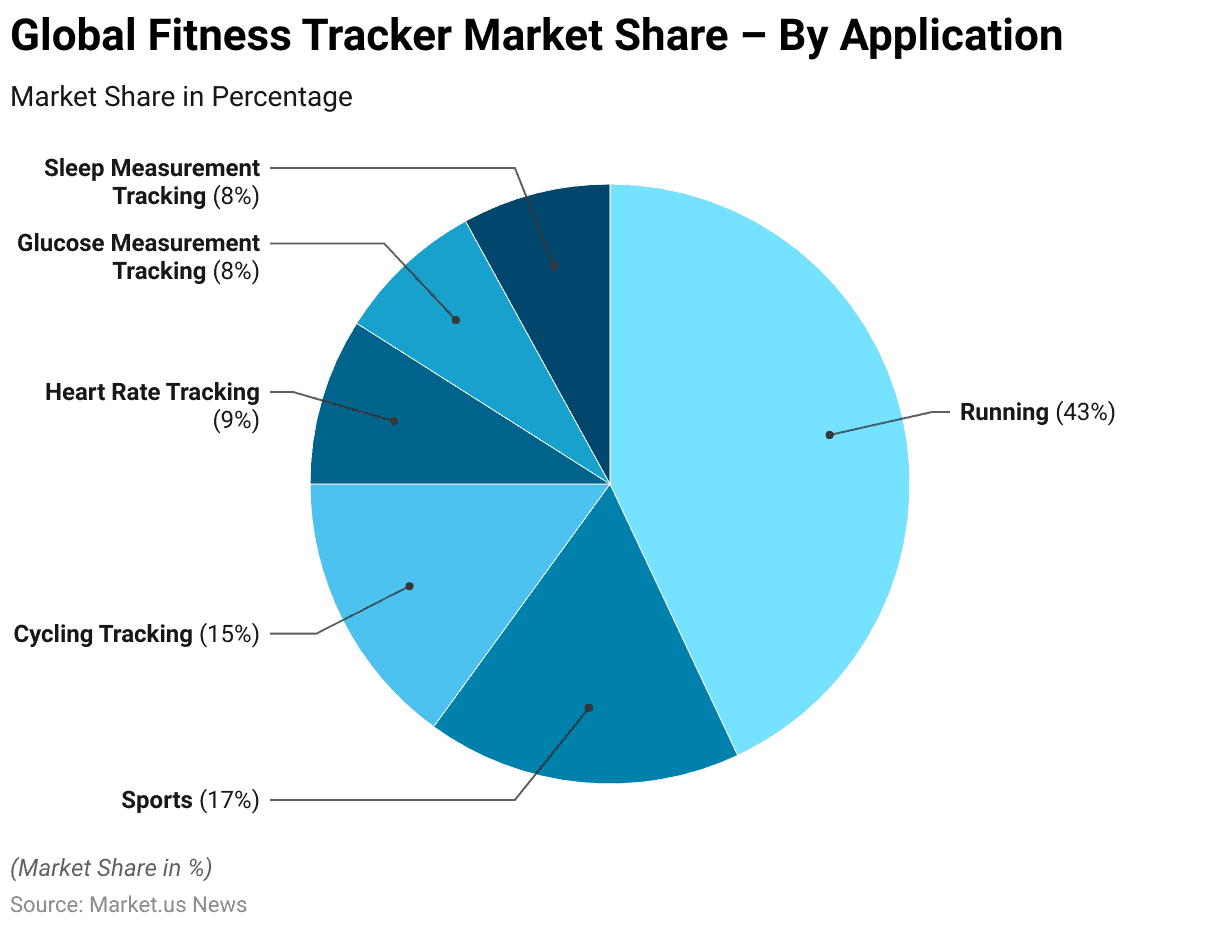
- The global fitness tracker market is segmented by application, with running tracking holding the largest share at 43%.
- Sports tracking follows, accounting for 17% of the market while cycling tracking represents 15% of the market share.
- Heart rate tracking contributes 9%, with glucose measurement tracking and sleep measurement tracking each holding an 8% share.
- This distribution highlights the prominence of running and sports-related applications within the market. At the same time, health-focused functionalities such as heart rate, glucose, and sleep tracking also hold significant market presence.
(Source: market.us)
Fitness Tracker Devices Shipments Statistics
Wearables Unit Shipments Worldwide
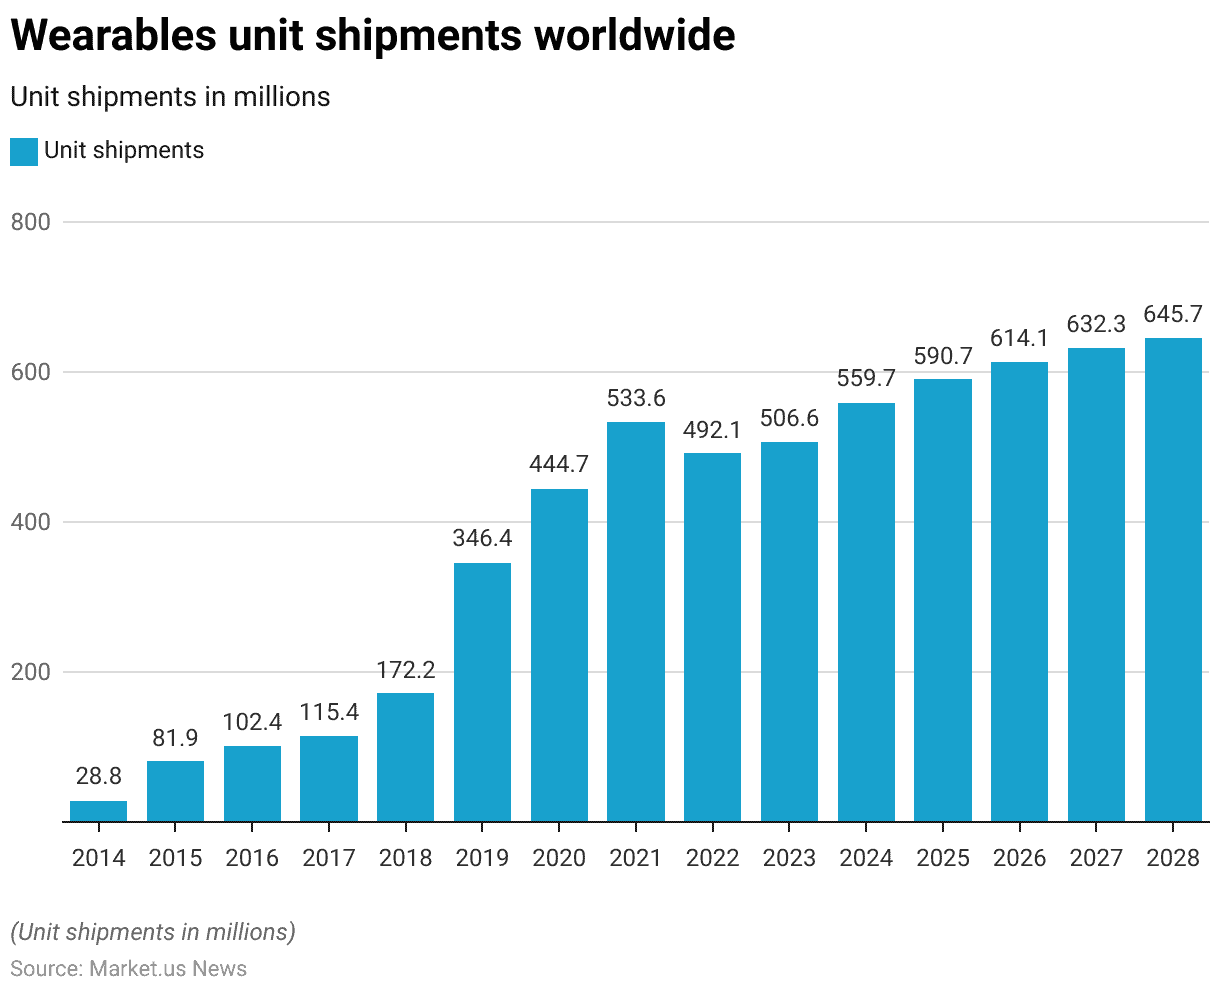
- From 2014 to 2028, worldwide shipments of wearable devices have shown significant growth and fluctuations.
- In 2014, shipments started at 28.8 million units, followed by a substantial rise to 81.9 million in 2015.
- The growth continued, with shipments reaching 102.4 million in 2016, 115.4 million in 2017, and a sharp increase to 172.2 million by 2018.
- A dramatic surge was observed in 2019, with 346.4 million units shipped, which further escalated to 444.7 million in 2020.
- The shipments peaked at 533.6 million in 2021 before experiencing a dip to 492.1 million in 2022.
- The trend is expected to recover slightly to 506.6 million in 2023, with projections indicating a continued rise to 559.7 million in 2024, 590.7 million in 2025, 614.1 million in 2026, 632.3 million in 2027, and finally reaching 645.7 million by 2028.
- This data reflects a robust and dynamic market for wearables over the last fifteen years.
(Source: Statista)
Global Wearable Device Shipments – By Product Category
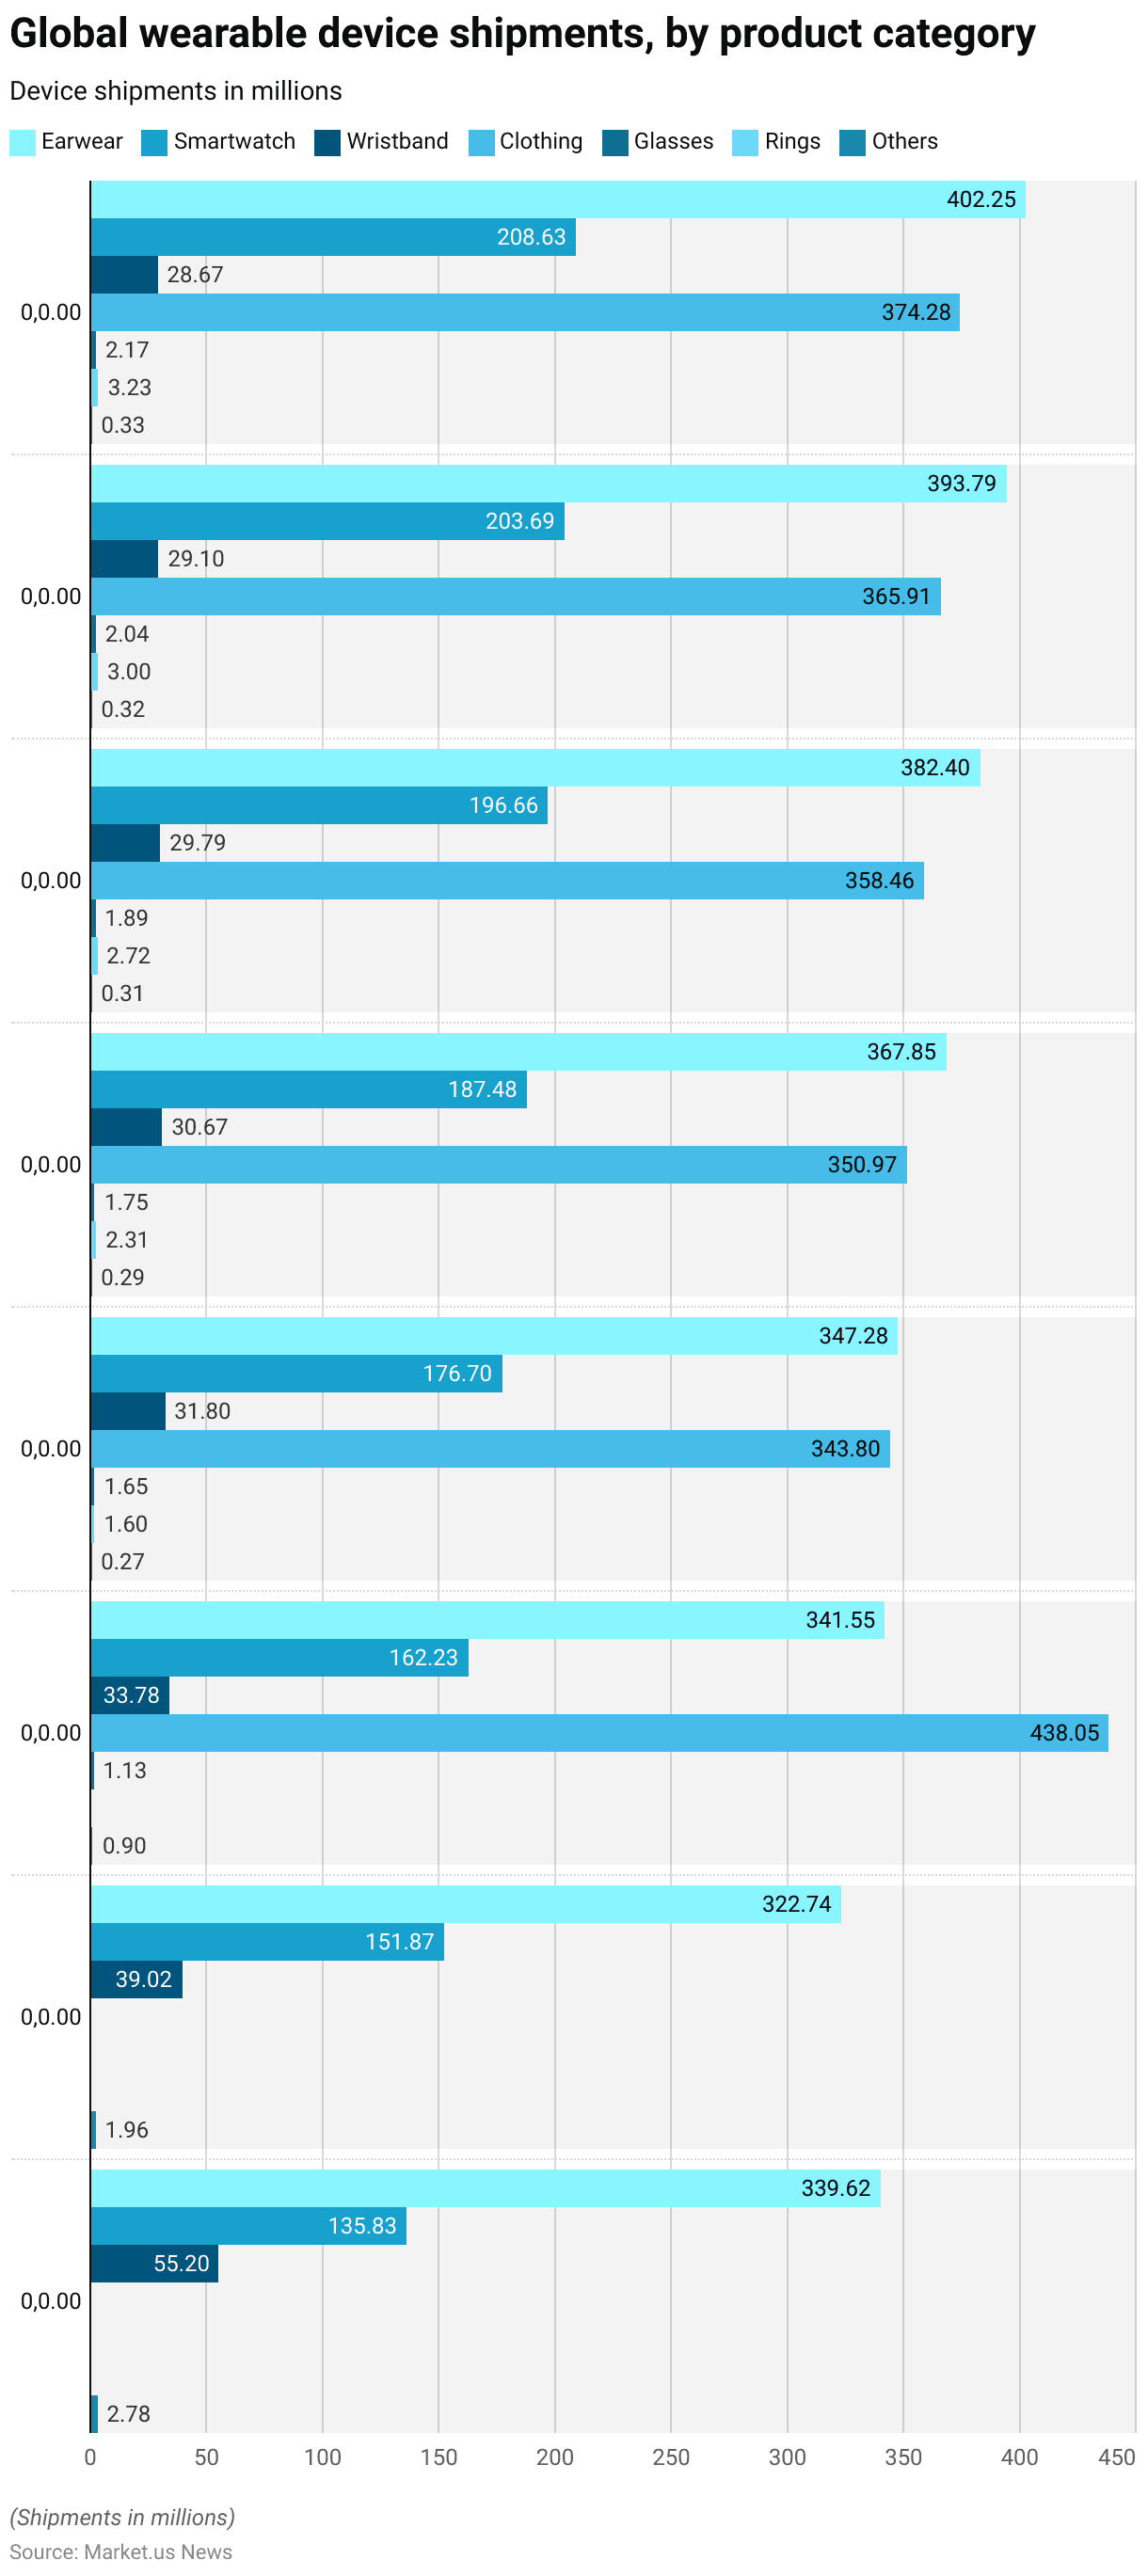
- Global shipments of wearable devices from 2021 to 2028 across various product categories have demonstrated varied growth trajectories.
- In 2021, earwear led the shipments with 339.62 million units, followed by smartwatches at 135.83 million and wristbands at 55.2 million. With clothing and others, including glasses and rings, in smaller volumes.
- By 2022, earwear shipments slightly declined to 322.74 million. Whereas smartwatch shipments increased to 151.87 million, and wristband shipments dropped to 39.02 million.
- A notable change occurred in 2023 when shipments of clothing surged dramatically to 438.05 million, surpassing all other categories, while earwear shipments rose to 341.55 million and smartwatch shipments continued to grow to 162.23 million.
- This upward trend persisted into 2024, with earwear at 347.28 million, smartwatches at 176.7 million, and clothing shipments adjusting to 343.8 million.
- The years 2025 through 2028 showed steady increases across all categories, with earwear reaching 402.25 million by 2028, smartwatches at 208.63 million, and clothing at 374.28 million.
- Additional categories like glasses, rings, and others also experienced incremental growth. Reflecting a broadening acceptance and integration of diverse wearable technologies in the market.
- By 2028, even smaller categories like rings reached shipments of 3.23 million units. Highlighting the expanding scope of wearable device adoption.
(Source: Statista)
Fitness Tracker Device Unit Shipments Worldwide Statistics
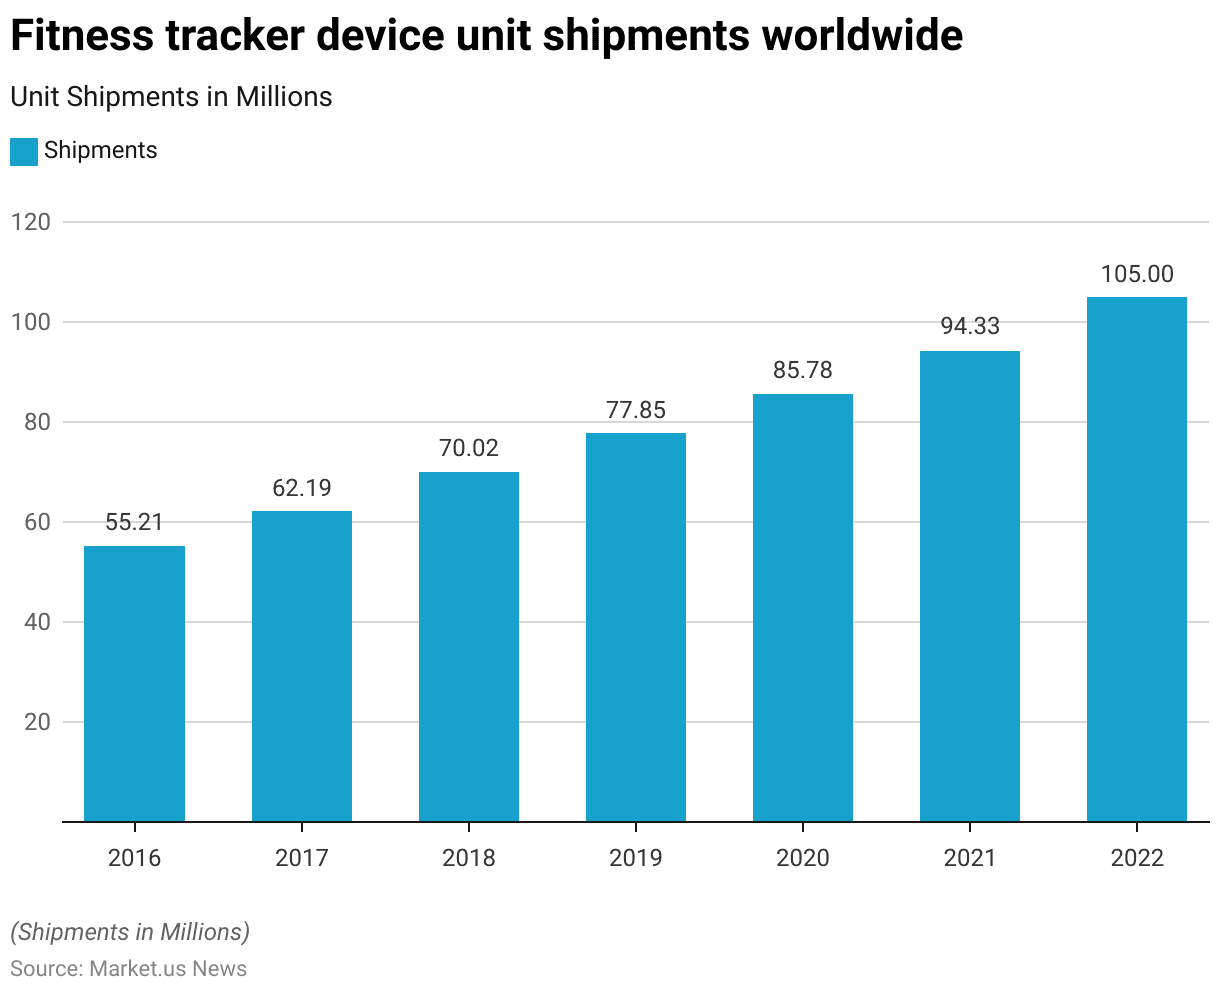
- The global unit shipments of fitness tracker devices have demonstrated a consistent upward trajectory from 2016 to 2022.
- Starting in 2016, approximately 55.21 million units were shipped.
- This number grew to 62.19 million in 2017, followed by a further increase to 70.02 million in 2018.
- The trend continued with 77.85 million units shipped in 2019, and despite global disruptions, shipments rose to 85.78 million in 2020.
- The growth persisted through 2021, with shipments reaching 94.33 million units, culminating in 105 million units shipped in 2022.
- This steady rise reflects a robust and expanding market demand for fitness tracking devices globally.
(Source: Statista)
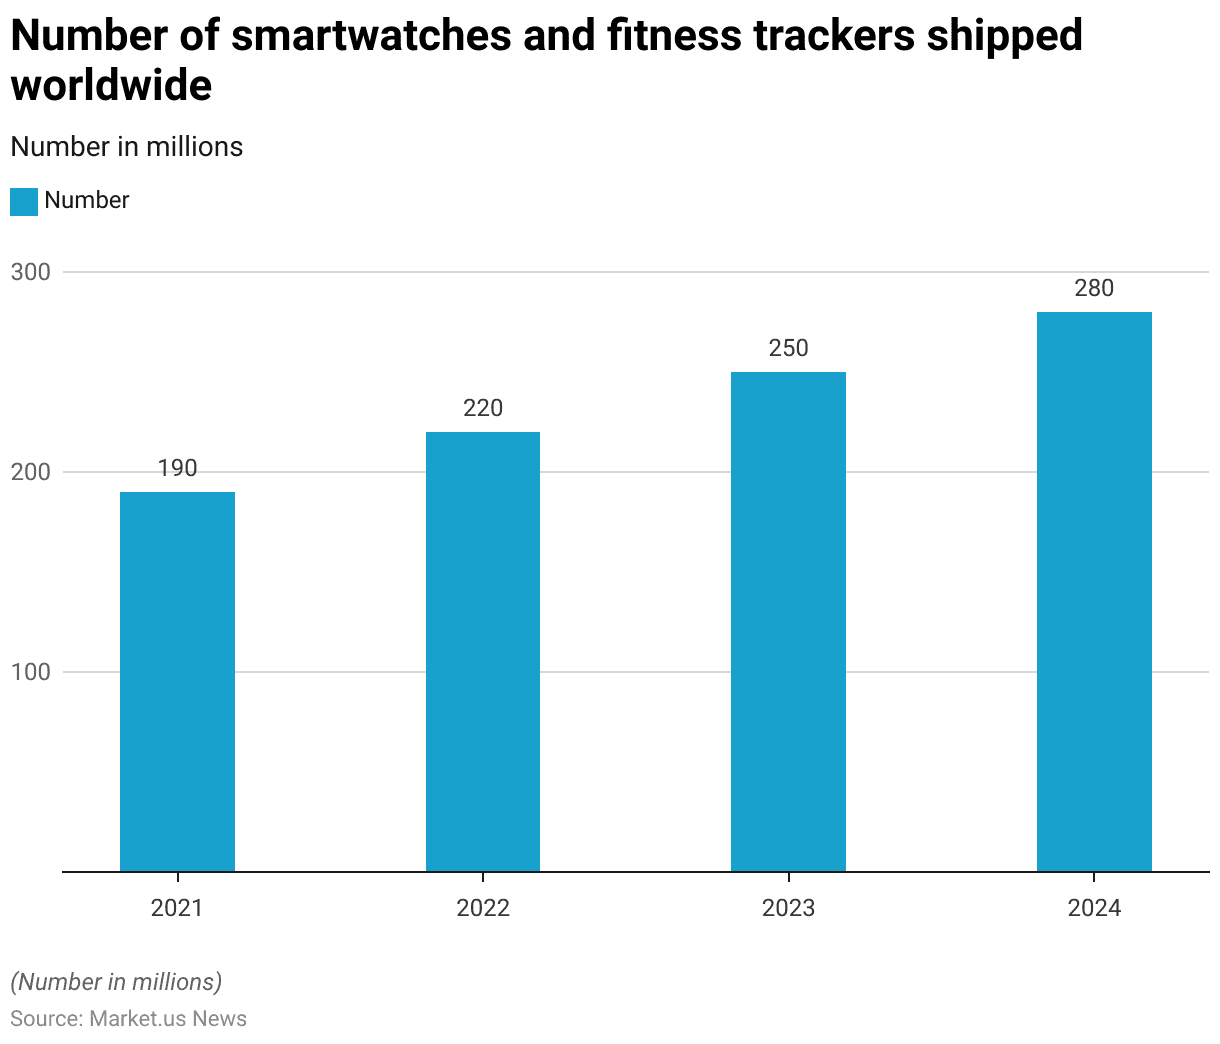
Smartwatch and Fitness Tracker Shipments Worldwide Statistics
- The worldwide shipments of smartwatches and fitness trackers have been experiencing substantial growth from 2021 to 2024.
- In 2021, the total number of units shipped was approximately 190 million.
- This figure increased to 220 million in 2022, indicating a robust demand for wearable technology.
- The upward trend is projected to continue, with an estimated 250 million units expected to be shipped in 2023.
- By 2024, the shipments are forecasted to reach 280 million units, underscoring a sustained expansion in the market for smartwatches and fitness trackers over these years.
(Source: Statista)
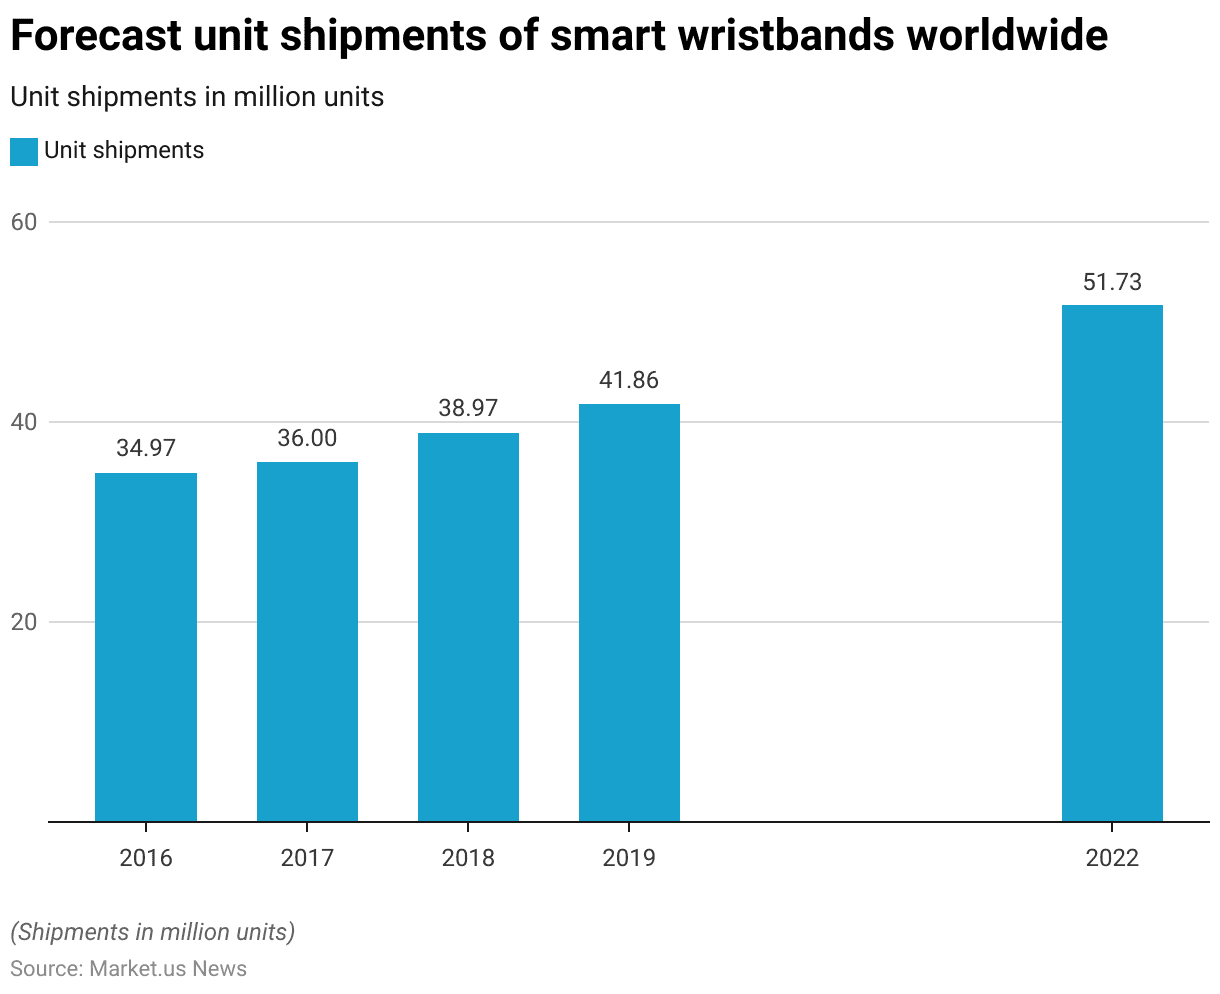
Global Unit Shipments of Smart Wristbands
- The global shipments of smart wristbands have exhibited a steady increase over the period from 2016 to 2019 and saw a further rise in 2022.
- In 2016, around 34.97 million units were shipped worldwide.
- This number modestly increased to 36 million units in 2017, followed by a further growth to 38.97 million units in 2018.
- The upward trend continued, with shipments reaching approximately 41.86 million units in 2019.
- After a gap in the available data for 2020 and 2021, the shipments significantly jumped to 51.73 million units in 2022, indicating a robust resurgence in demand for smart wristbands.
(Source: Statista)
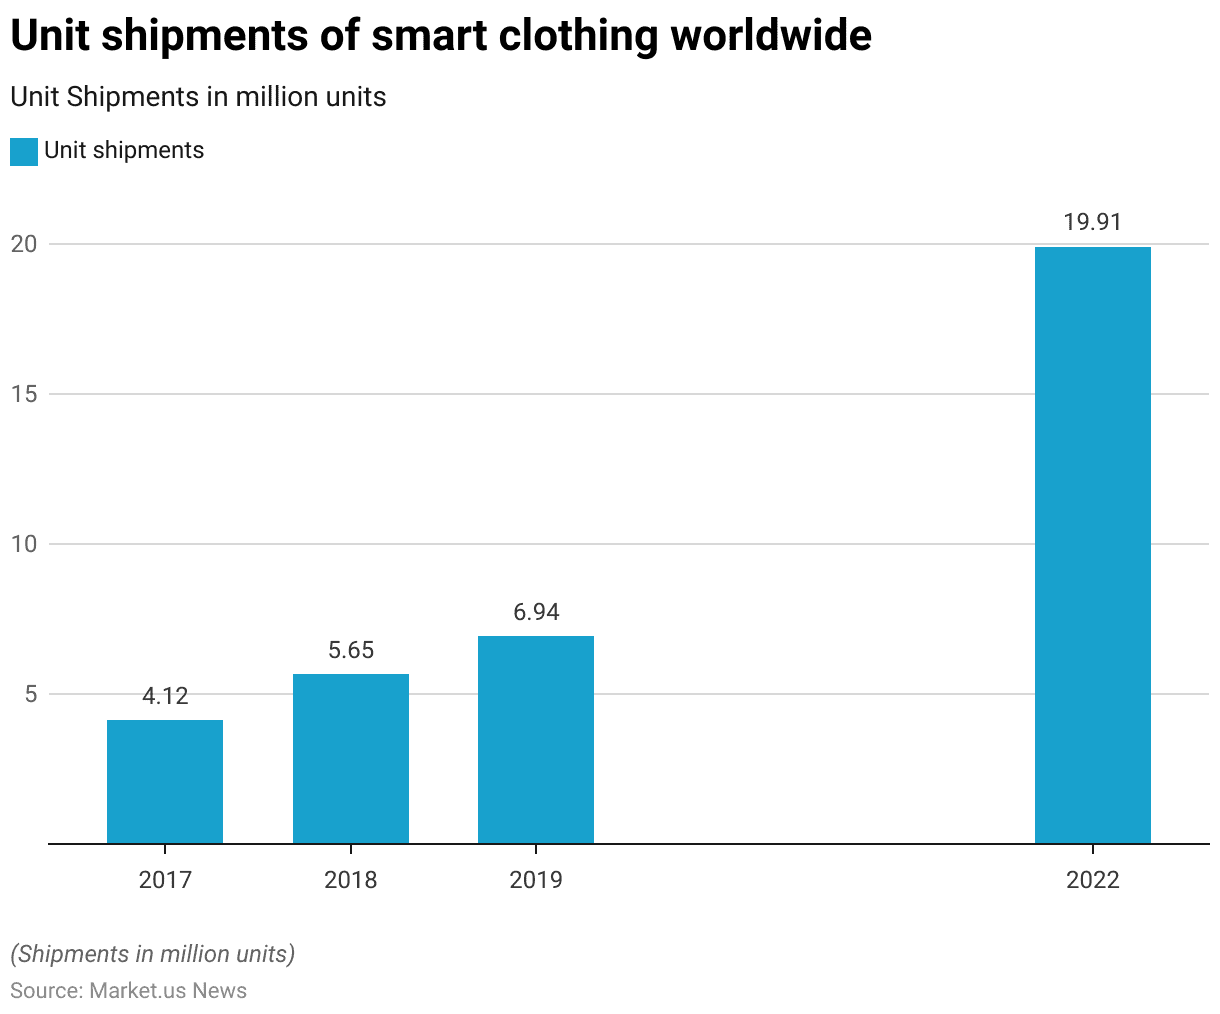
Global Unit Shipments of Smart Clothing
- The global shipments of smart clothing from 2017 to 2019 and in 2022 have shown significant growth.
- In 2017, the shipments amounted to 4.12 million units.
- The following year saw an increase to 5.65 million units.
- This growth trajectory continued into 2019, with shipments climbing to 6.94 million units.
- After a notable gap in the reported data for 2020 and 2021, a substantial surge in shipments occurred in 2022, with a total of 19.91 million units shipped globally.
- This dramatic rise indicates a strong resurgence and expanding market acceptance of smart clothing technologies.
(Source: Statista)
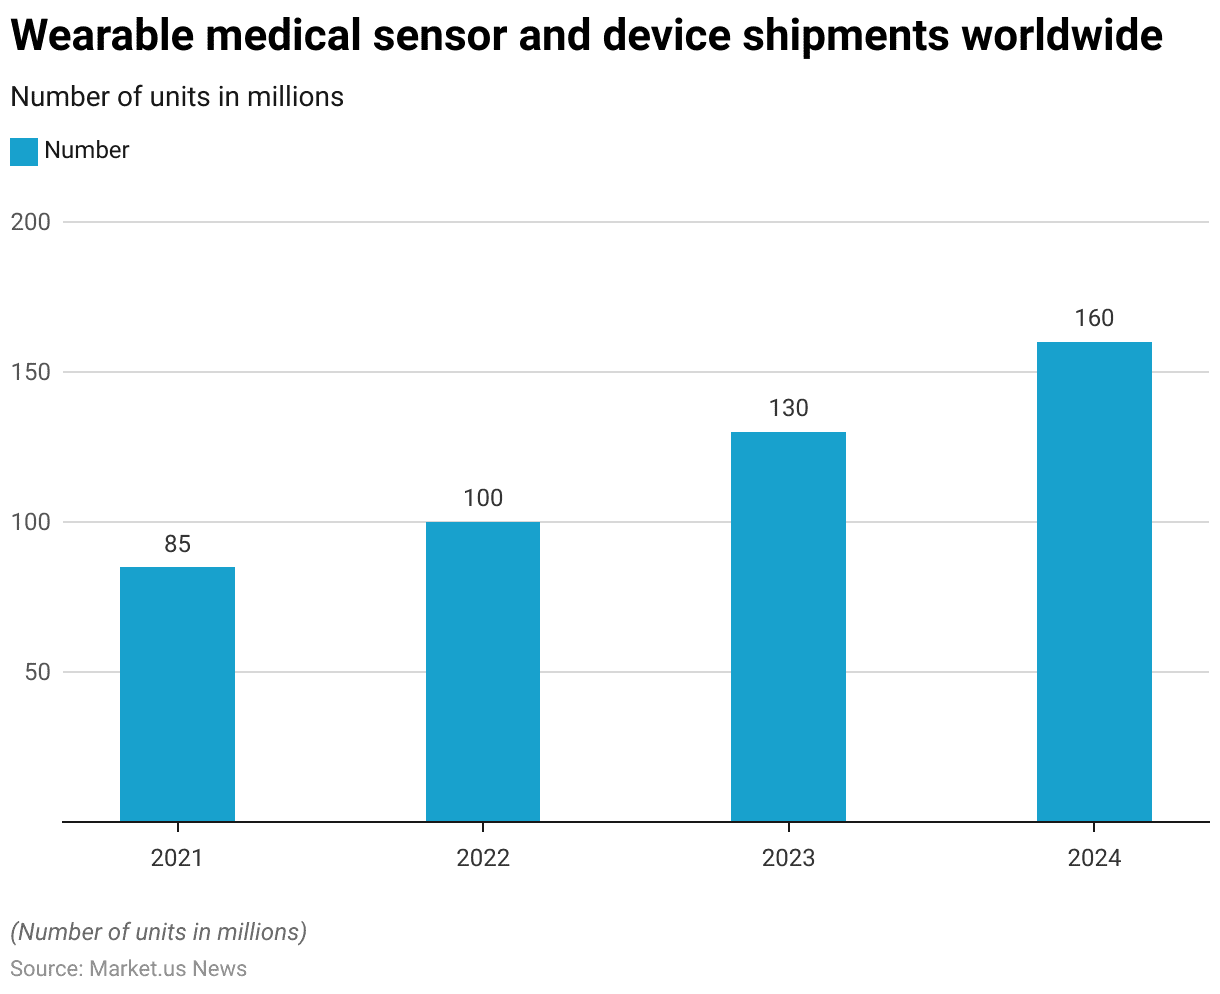
Wearable Medical Sensor and Device Shipments Worldwide
- The global shipments of wearable medical sensors and devices have been on a robust growth trajectory from 2021 to 2024.
- In 2021, approximately 85 million units were shipped worldwide.
- This figure rose to 100 million units in 2022, indicating a growing reliance on wearable medical technology.
- The trend is projected to continue, with shipments expected to reach 130 million units in 2023 and further expand to 160 million units by 2024.
- This sustained increase underscores the escalating adoption and integration of wearable medical technologies in health management and monitoring practices globally.
(Source: Statista)
Fitness Tracker Users Statistics
Fitness Tracker Users – By Segment Statistics
2017-2021
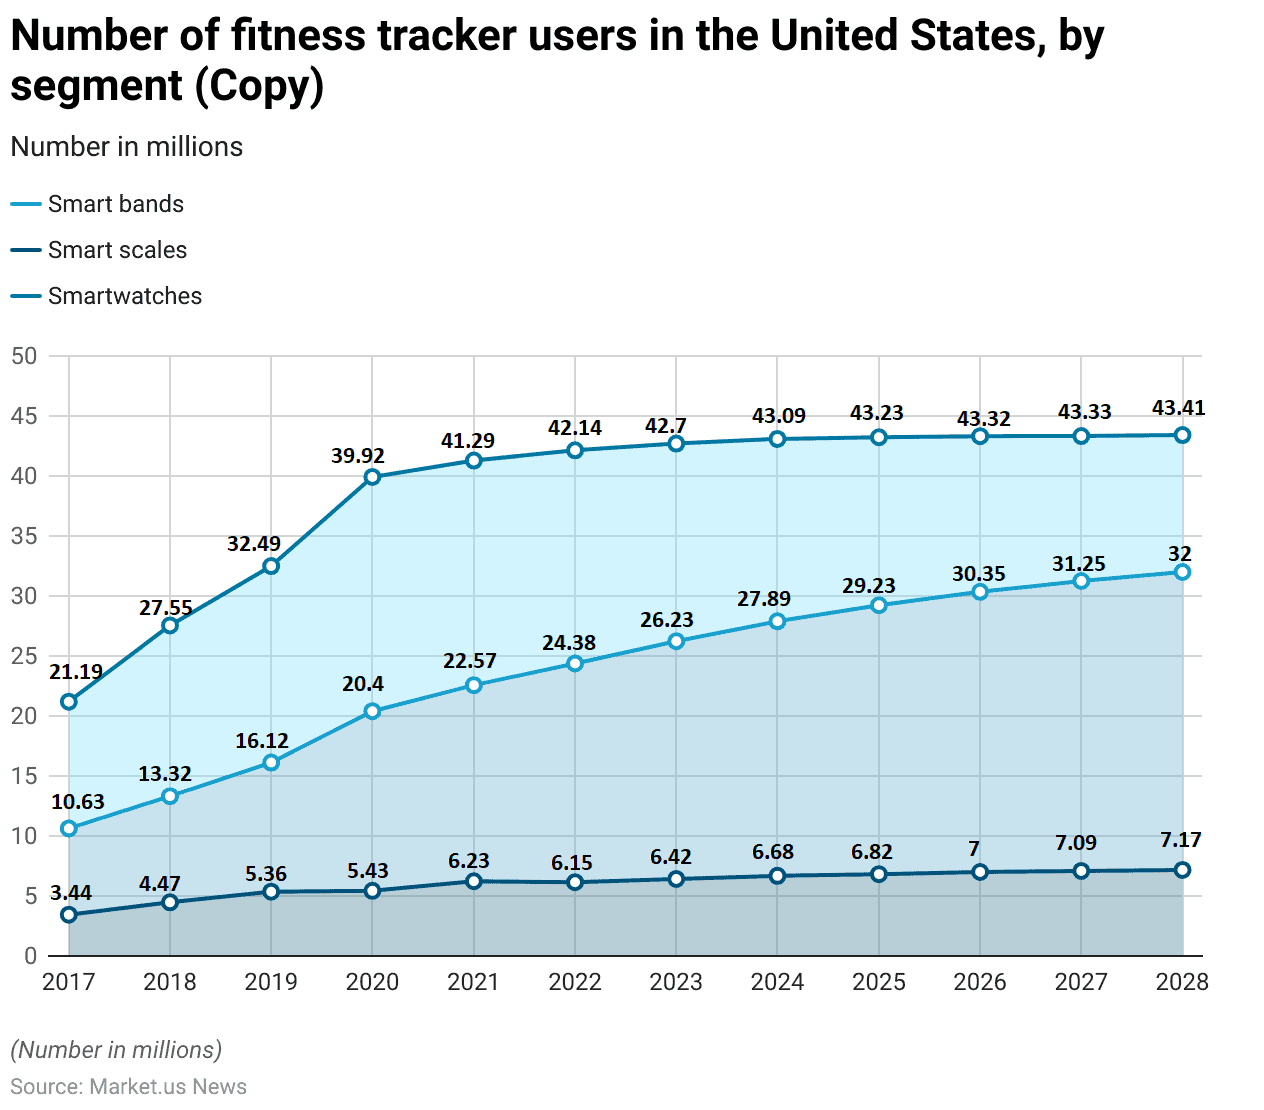
- The adoption of fitness tracking devices in the United States has demonstrated a consistent upward trajectory across various segments from 2017 to 2028.
- In 2017, the number of users of smart bands stood at approximately 10.63 million, smart scales at 3.44 million, and smartwatches at 21.19 million.
- By 2018, these figures rose to 13.32 million for smart bands, 4.47 million for smart scales, and 27.55 million for smartwatches, indicating robust growth across all categories.
- The upward trend continued into 2019, with smart band usage increasing to 16.12 million, smart scales to 5.36 million, and smartwatches to 32.49 million.
- The year 2020 saw a significant jump, particularly in smartwatches, which surged to 39.92 million users, while smart bands reached 20.4 million and smart scales slightly increased to 5.43 million.
- The growth persisted into 2021, with smartwatches reaching 41.29 million, smart bands at 22.57 million, and smart scales at 6.23 million users.
2022-2028
- By 2022, user numbers will be slightly adjusted, with smartwatches at 42.14 million, smart bands at 24.38 million, and smart scales dipping to 6.15 million.
- The following year, 2023, saw all segments experience growth, with smartwatches hitting 42.7 million, smart bands at 26.23 million, and smart scales at 6.42 million users.
- Projections for 2024 indicate a continued increase, with smartwatches expected to reach 43.09 million, smart bands at 27.89 million, and smart scales at 6.68 million.
- The forecast for 2025 and beyond suggests a steady yet moderate growth, culminating in 2028, with smartwatches reaching 43.41 million users, smart bands at 32 million, and smart scales at 7.17 million.
- This steady increase highlights the growing penetration and acceptance of fitness-tracking technology among U.S. consumers, underlining a sustained interest in personal health monitoring and wearable technology across the forecast period.
(Source: Statista)
Users in the Digital Fitness and Well-Being Devices Segment
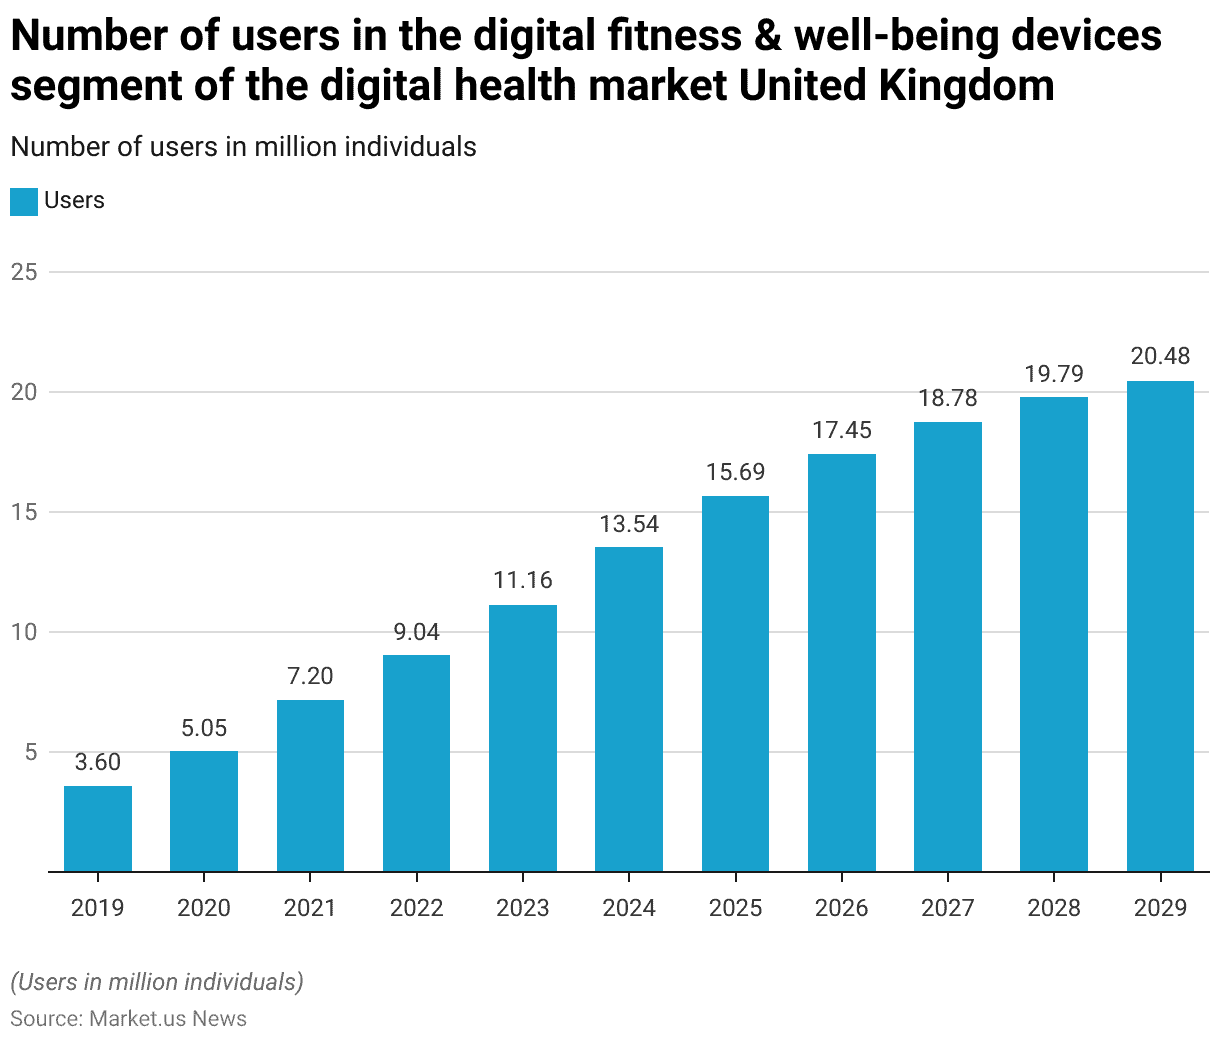
- The number of users in the digital fitness and well-being devices segment of the digital health market in the United Kingdom has shown a progressive increase from 2019 to 2029.
- Starting in 2019, the user base was at 3.6 million individuals.
- This number grew to 5.05 million in 2020, reflecting a significant uptake.
- The growth continued with 7.2 million users in 2021 and further to 9.04 million in 2022.
- By 2023, the number of users increased to 11.16 million and is projected to rise to 13.54 million by 2024.
- The upward trend is expected to persist, with user numbers reaching 15.69 million in 2025, 17.45 million in 2026, 18.78 million in 2027, 19.79 million in 2028, and culminating at 20.48 million by 2029.
- This steady growth underscores the increasing adoption of digital health technologies focused on fitness and well-being in the U.K.
(Source: Statista)
Number of Users of Fitness/Activity Trackers Wristwear Worldwide Statistics
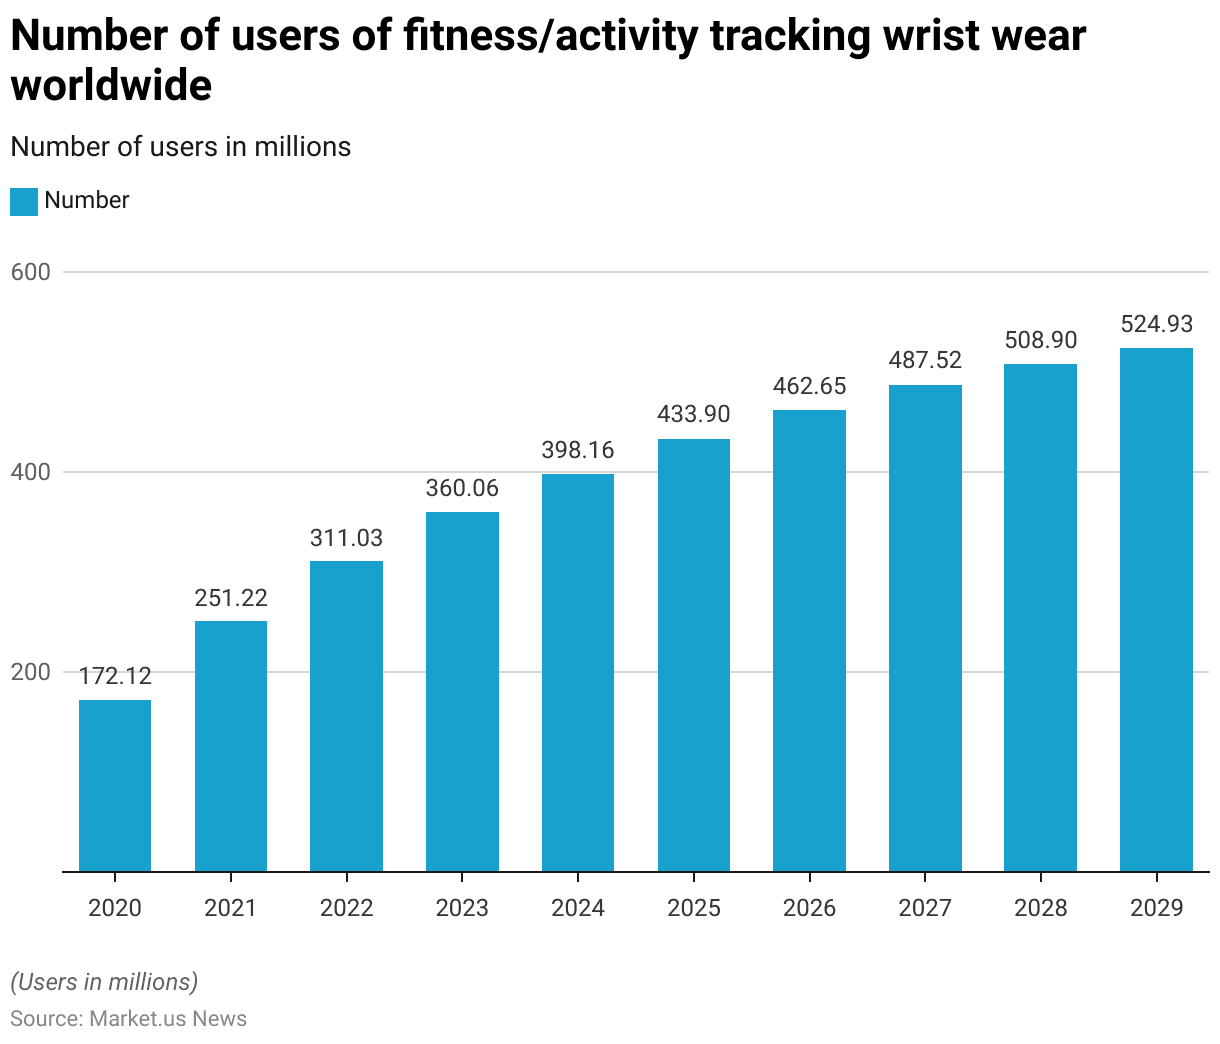
- The number of users of fitness/activity tracking wristwear worldwide has shown a marked increase from 2020 to 2029.
- Starting with 172.12 million users in 2020, the user base expanded to 251.22 million by 2021.
- This upward trend continued into 2022 with 311.03 million users, followed by an increase to 360.06 million in 2023.
- By 2024, the number of users is projected to reach 398.16 million.
- The growth is expected to continue, with user numbers rising to 433.9 million in 2025, 462.65 million in 2026, 487.52 million in 2027, 508.9 million in 2028, and culminating at 524.93 million by 2029.
- This steady growth trajectory highlights the increasing global adoption and interest in fitness and activity-tracking technologies.
(Source: Statista)
No. of Users of Smartwatches Worldwide
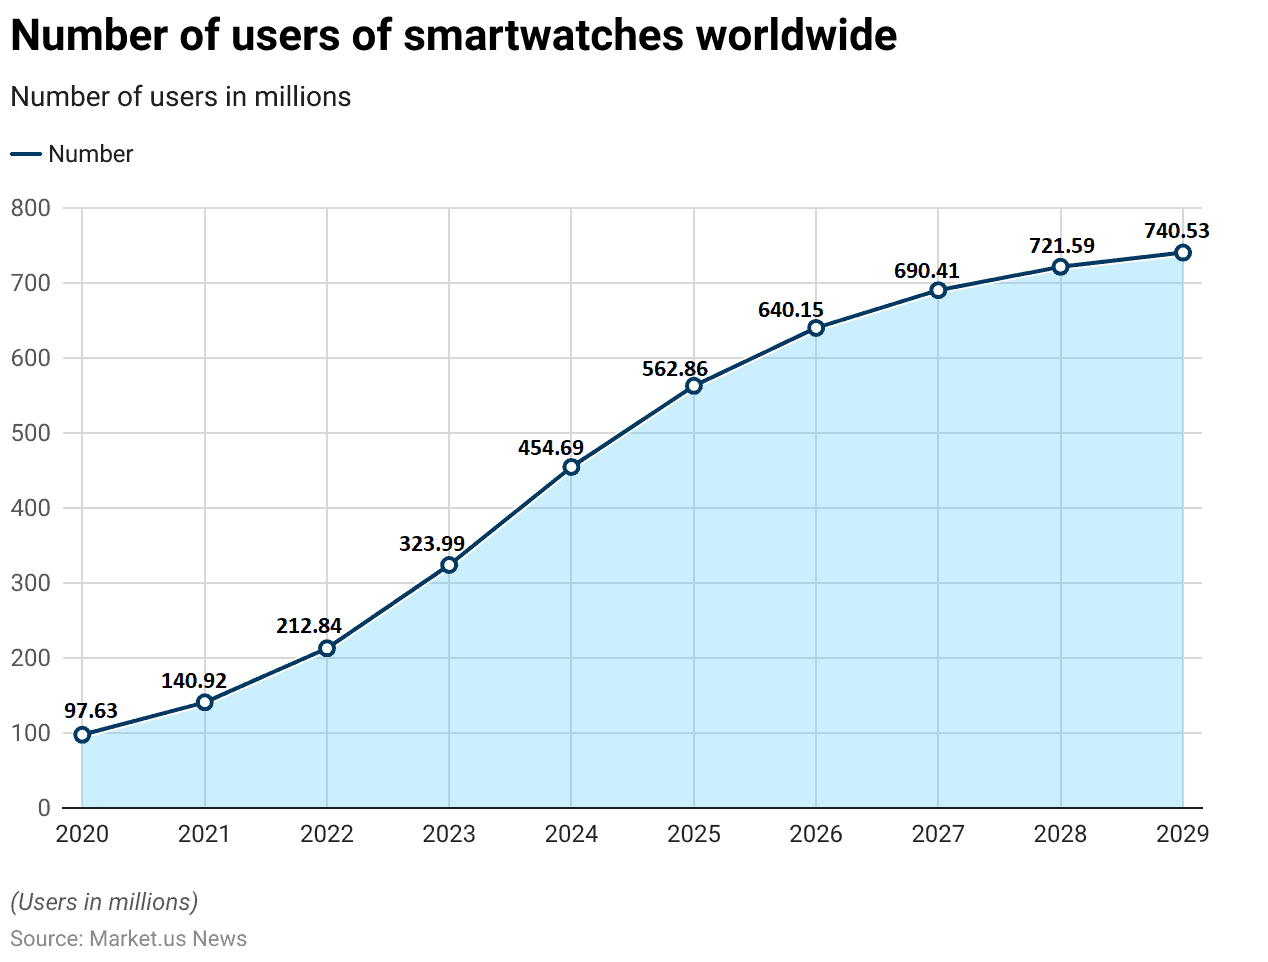
- The number of smartwatch users worldwide has demonstrated impressive growth from 2020 through the projected year of 2029.
- In 2020, there were 97.63 million users, which expanded significantly to 140.92 million in 2021.
- The growth trajectory continued sharply upward to 212.84 million users in 2022, followed by a substantial increase to 323.99 million in 2023.
- By 2024, the user base is expected to reach 454.69 million.
- The expansion persists into the following years, with 562.86 million users in 2025, 640.15 million in 2026, 690.41 million in 2027, 721.59 million in 2028, and culminating at 740.53 million by 2029.
- This pattern highlights a robust and expanding global market for smartwatches over the decade.
(Source: Statista)
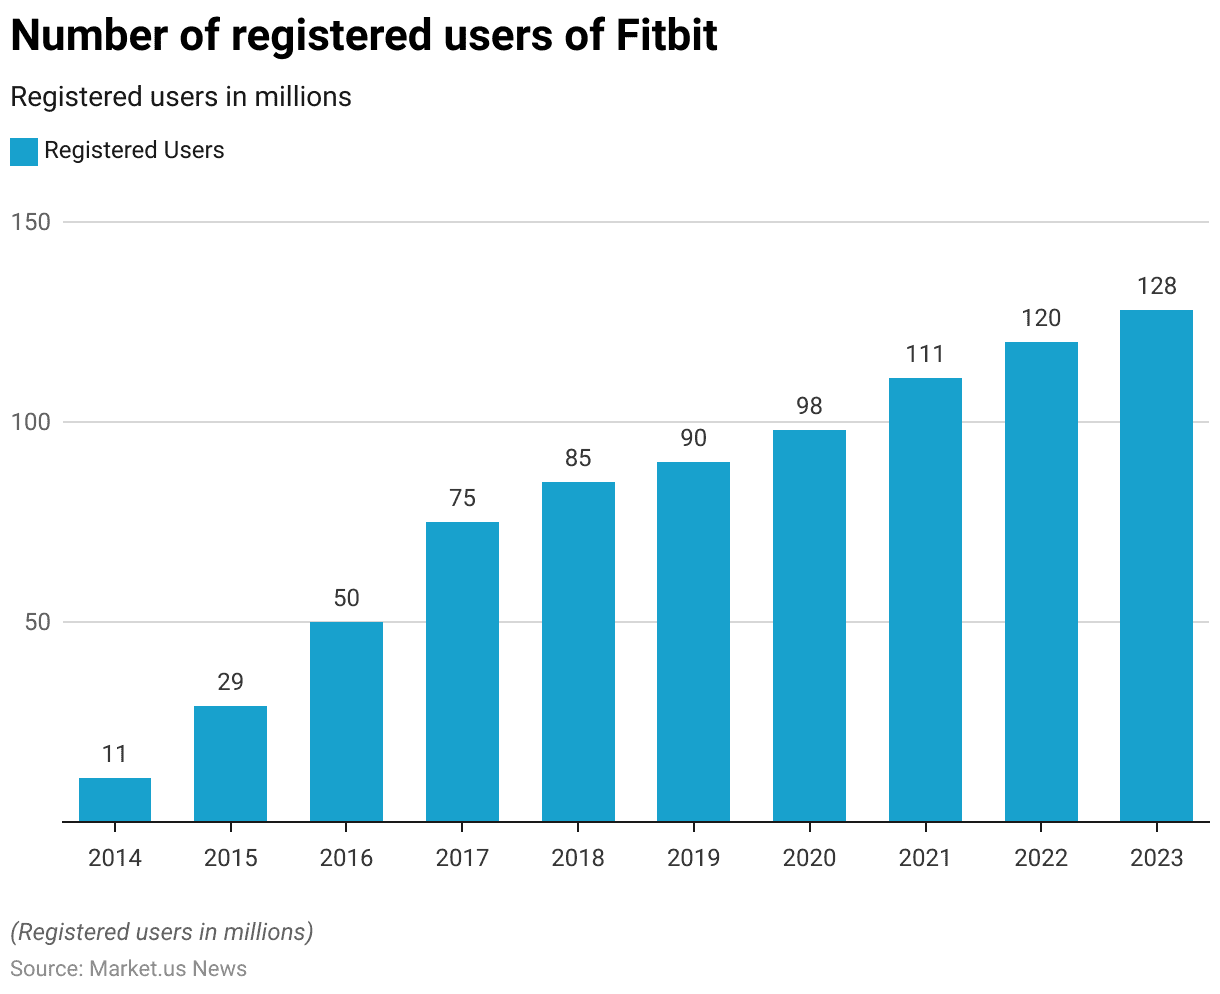
Number of Registered Users of Fitbit
- The number of registered users of Fitbit has seen a substantial increase from 2014 to 2023.
- Starting in 2014 with 11 million users, the figure nearly tripled to 29 million by 2015.
- The upward momentum continued, reaching 50 million users in 2016 and 75 million by 2017.
- The growth slightly tapered but remained positive, with the user count climbing to 85 million in 2018 and 90 million in 2019.
- Despite market fluctuations, there was a steady rise to 98 million in 2020, followed by a more robust increase to 111 million in 2021.
- By 2022, the number of registered users reached 120 million, and it is projected to grow to 128 million by 2023, demonstrating sustained interest and expanding user engagement with Fitbit products over nearly a decade.
(Source: Statista)
Fitness Tracker Devices Penetration Statistics
Penetration Rate of Fitness/Activity Trackers Wristwear Worldwide Statistics
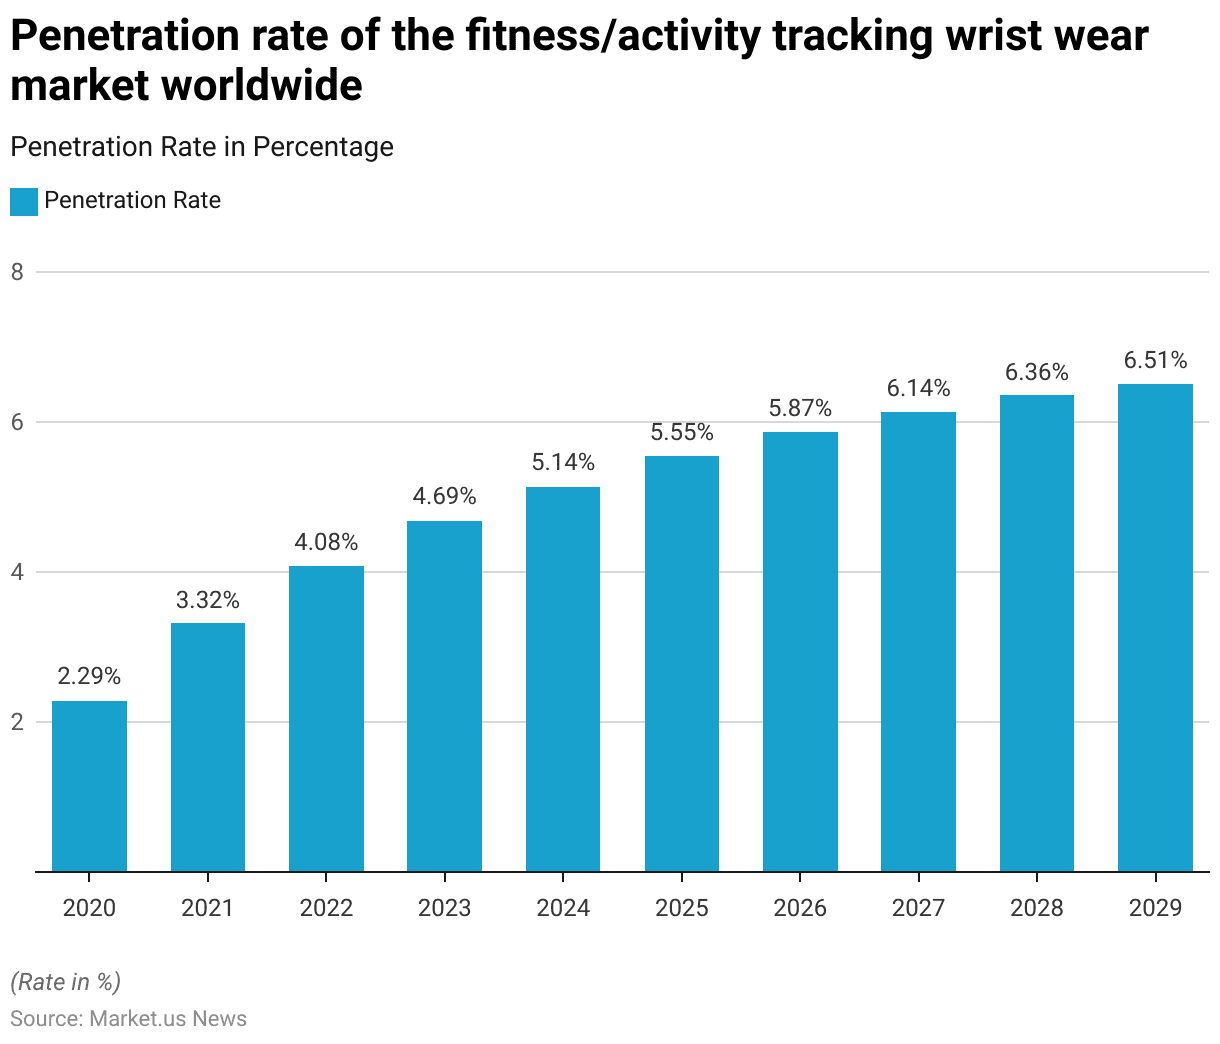
- The penetration rate of the fitness/activity tracking wristwear market worldwide has shown a consistent upward trend from 2020 to 2029.
- Starting at a penetration rate of 2.29% in 2020, the rate increased to 3.32% in 2021, reflecting growing market adoption.
- In 2022, the penetration rate further rose to 4.08% and continued its ascent, reaching 4.69% in 2023.
- The trend persisted, with the penetration rate growing to 5.14% by 2024.
- Incremental increases were observed in the following years, reaching 5.55% in 2025, 5.87% in 2026, 6.14% in 2027, 6.36% in 2028, and finally peaking at 6.51% by 2029.
- This steady increase over the decade indicates a gradually widening acceptance and integration of fitness/activity-tracking wristwear in global markets.
(Source: Statista)
Penetration Rate of Smartwatches Worldwide
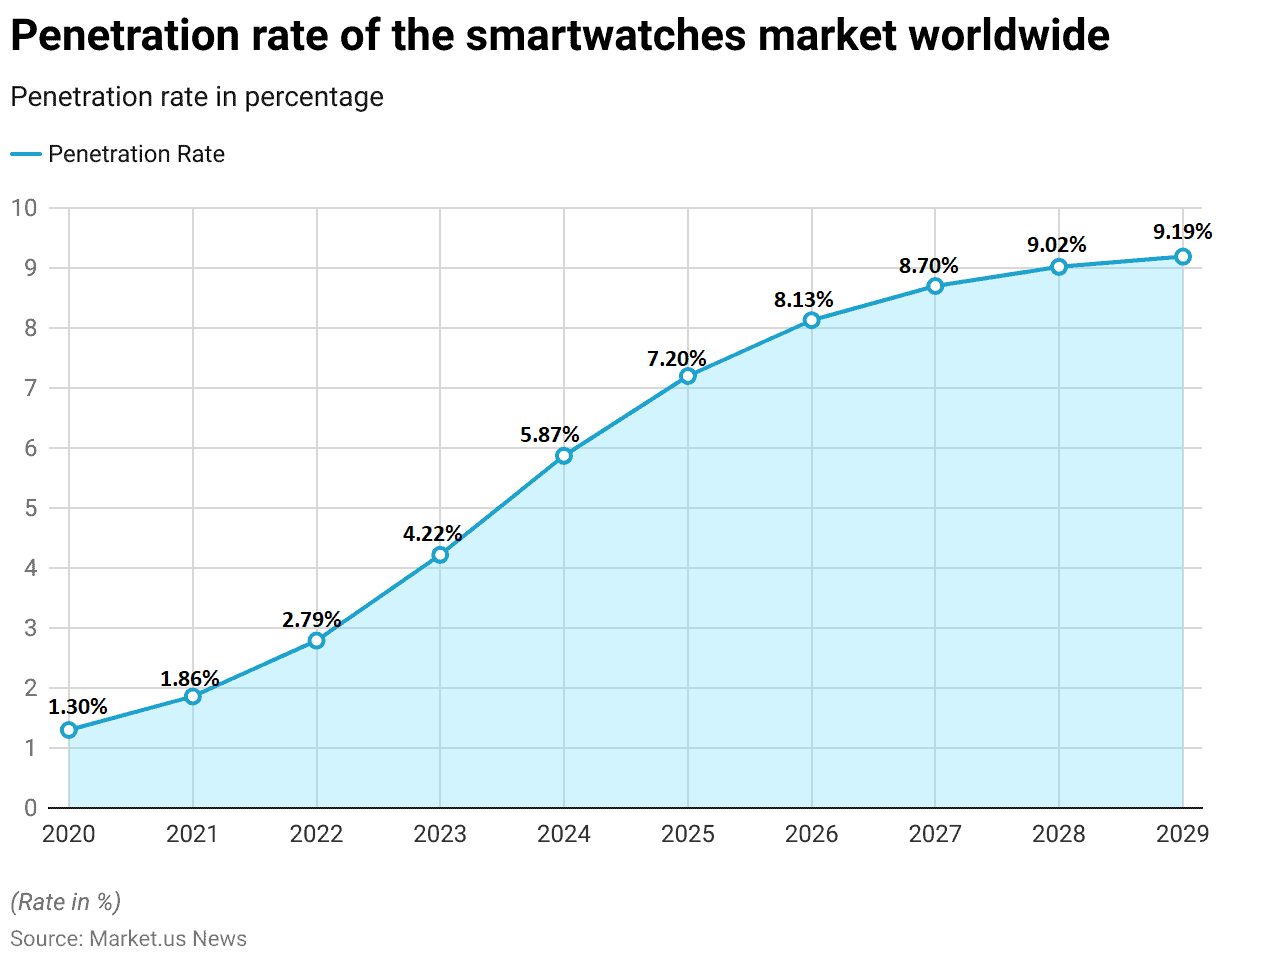
- The penetration rate of the smartwatch market worldwide has demonstrated a significant upward trend from 2020 to 2029.
- In 2020, the penetration rate began at 1.30%, which increased to 1.86% in 2021.
- The following year, 2022, saw a further rise to 2.79%.
- The growth accelerated, with the rate reaching 4.22% in 2023 and then jumping to 5.87% in 2024.
- Continued increases are evident in subsequent years, with the rate climbing to 7.20% in 2025, 8.13% in 2026, and further to 8.70% in 2027.
- The growth slightly tapered off, reaching 9.02% in 2028 and 9.19% in 2029.
- This pattern highlights a steadily increasing global acceptance and integration of smartwatches as a mainstream technology product over the decade.
(Source: Statista)
Wearable Users Penetration
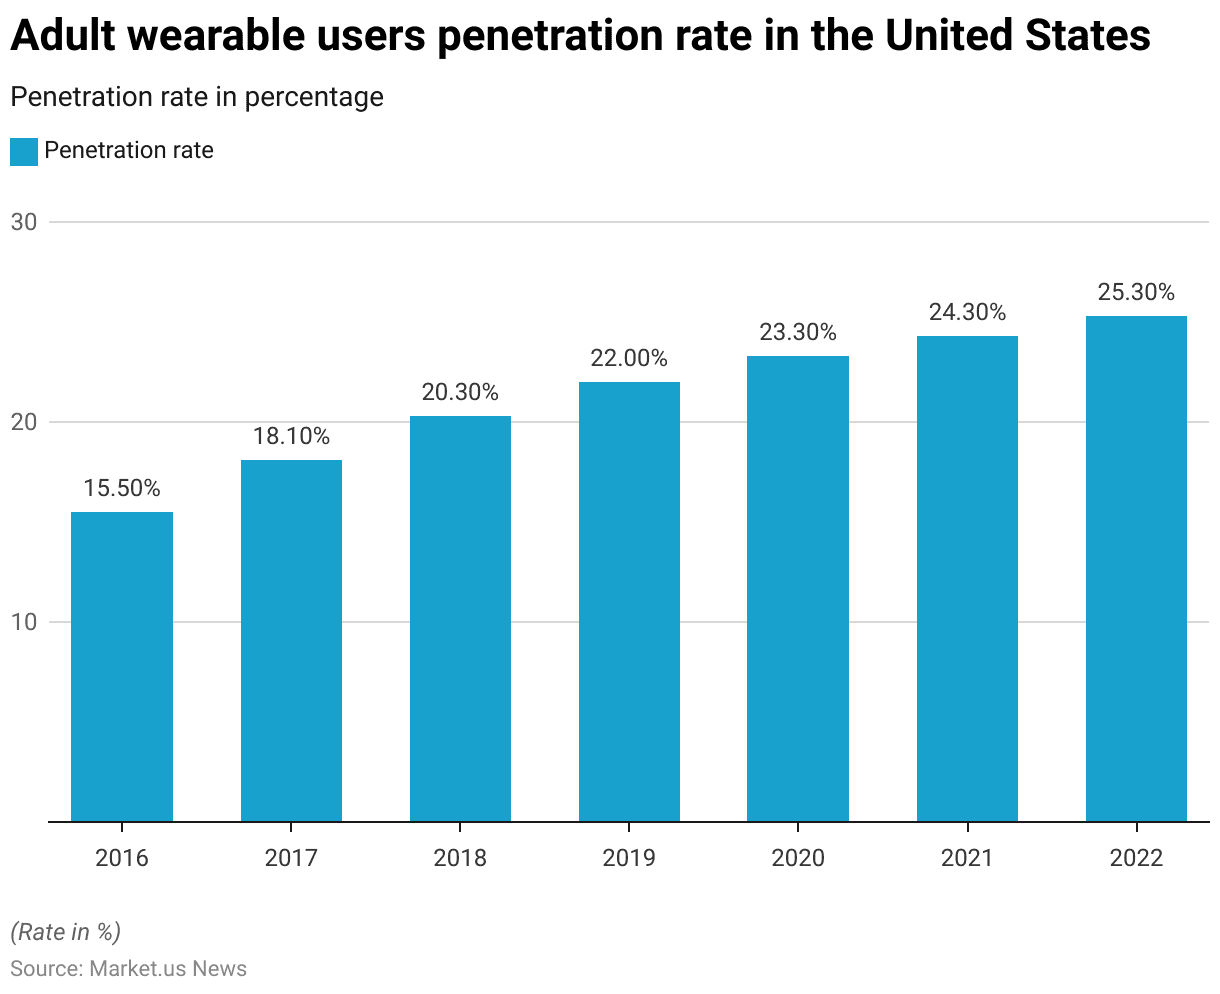
- The penetration rate of adult wearable users in the United States has exhibited a consistent upward trend from 2016 to 2022.
- Starting in 2016, the penetration rate was recorded at 15.50%.
- This rate increased gradually each year, rising to 18.10% in 2017 and then to 20.30% in 2018.
- By 2019, the rate had reached 22%, and it continued to grow, reaching 23.30% in 2020.
- The incremental growth persisted through the subsequent years, with a penetration rate of 24.30% in 2021 and further climbing to 25.30% by 2022.
- This steady rise over the years indicates a growing adoption of wearable technology among adults in the United States.
(Source: Statista)
Fitness Tracker Devices Sales Statistics
Global Smartwatch Unit Sales
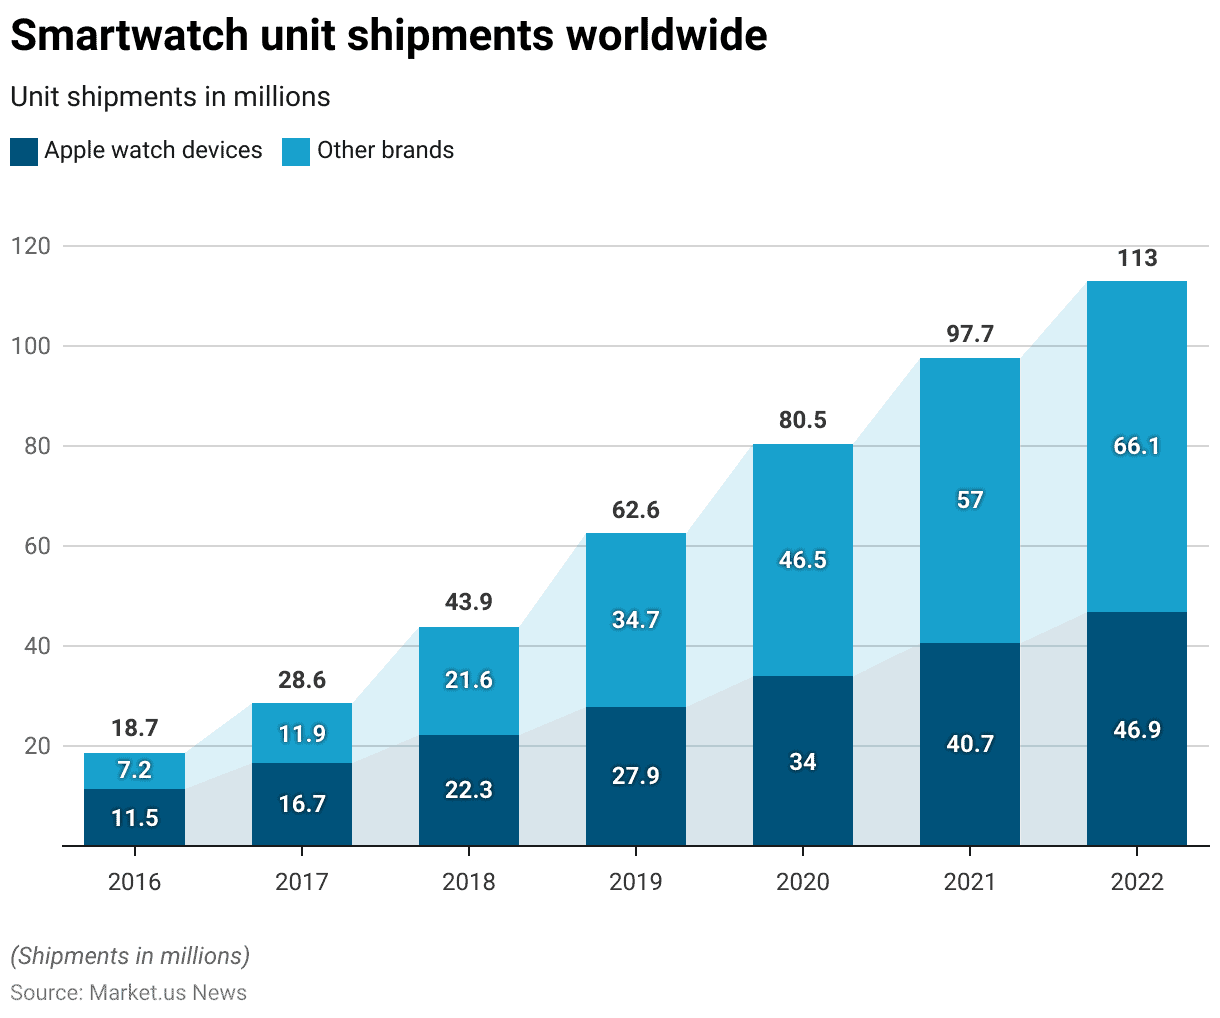
- Global smartwatch unit sales from 2016 to 2022 show significant growth in shipments for both Apple Watch devices and other brands.
- In 2016, Apple Watch shipments stood at 11.5 million units, with other brands at 7.2 million.
- By 2017, Apple Watch sales increased to 16.7 million, and other brands rose to 11.9 million.
- The gap between Apple Watch and other brands narrowed by 2018, with Apple shipping 22.3 million units and other brands shipping 21.6 million.
- By 2019, other brands surpassed Apple Watch sales, reaching 34.7 million units compared to Apple’s 27.9 million.
- This trend continued into 2020 and beyond, with other brands extending their lead to 46.5 million units versus Apple’s 34 million in 2020 and further to 57 million versus Apple’s 40.7 million in 2021.
- In 2022, Apple Watch sales reached 46.9 million, while other brands achieved 66.1 million units, indicating a robust competitive landscape in the global smartwatch market.
(Source: Statista)
Apple Watch Unit Sales Worldwide
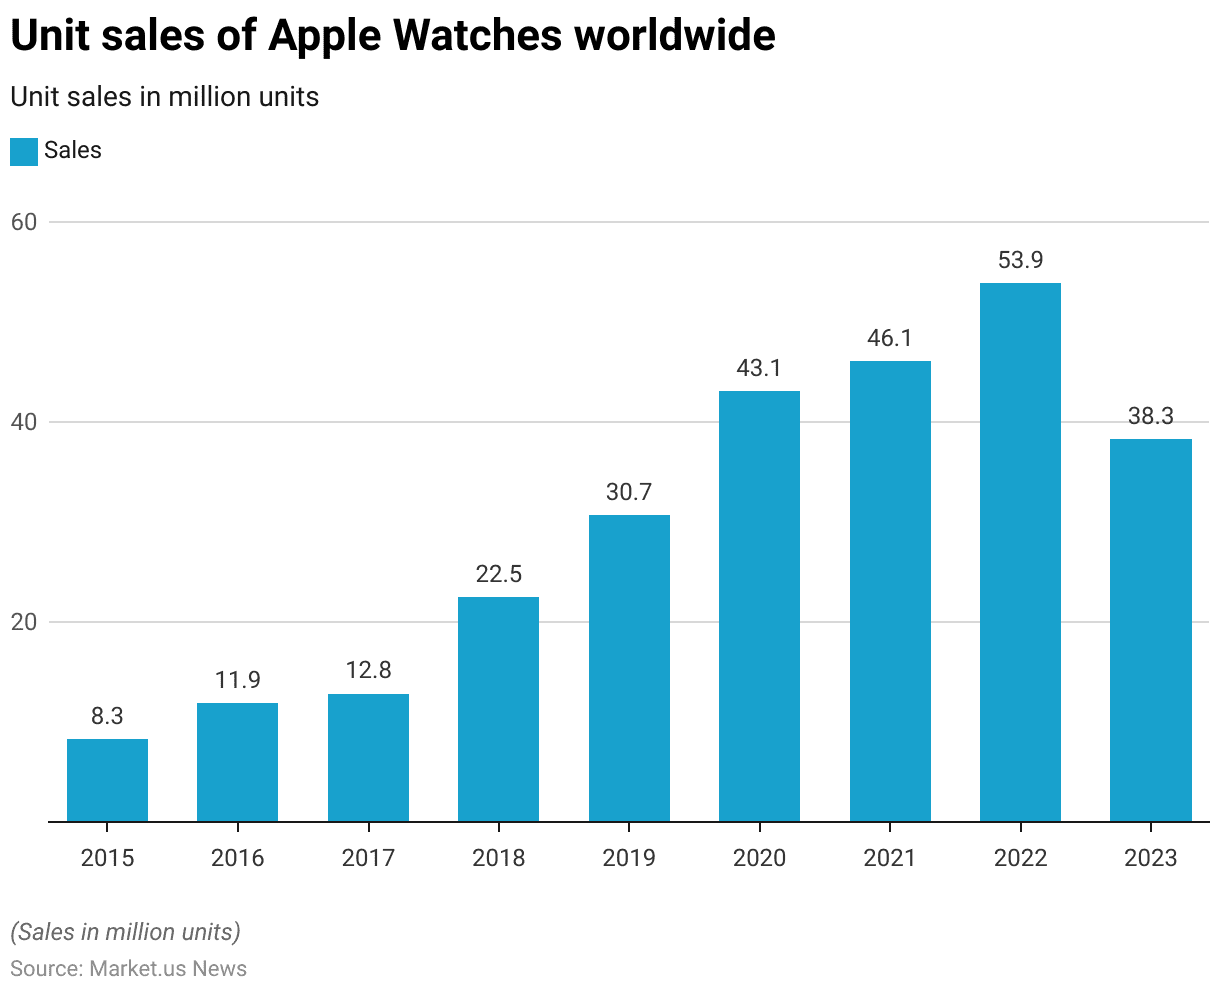
- The unit sales of Apple Watches worldwide from 2015 to 2023 have shown significant fluctuations and growth over the years.
- Starting in 2015, sales were at 8.3 million units.
- The following year, 2016, saw an increase to 11.9 million units, with a slight rise to 12.8 million in 2017.
- A more substantial jump occurred in 2018, with sales doubling to 22.5 million units.
- The growth trajectory continued, reaching 30.7 million in 2019 and further escalating to 43.1 million units in 2020.
- Sales slightly increased to 46.1 million in 2021 and peaked at 53.9 million in 2022.
- However, a notable decline was observed in 2023, with sales dropping to 38.3 million units.
- This pattern indicates a dynamic market presence with variable annual performances.
(Source: Statista)
Fitbit Unit Sales Worldwide
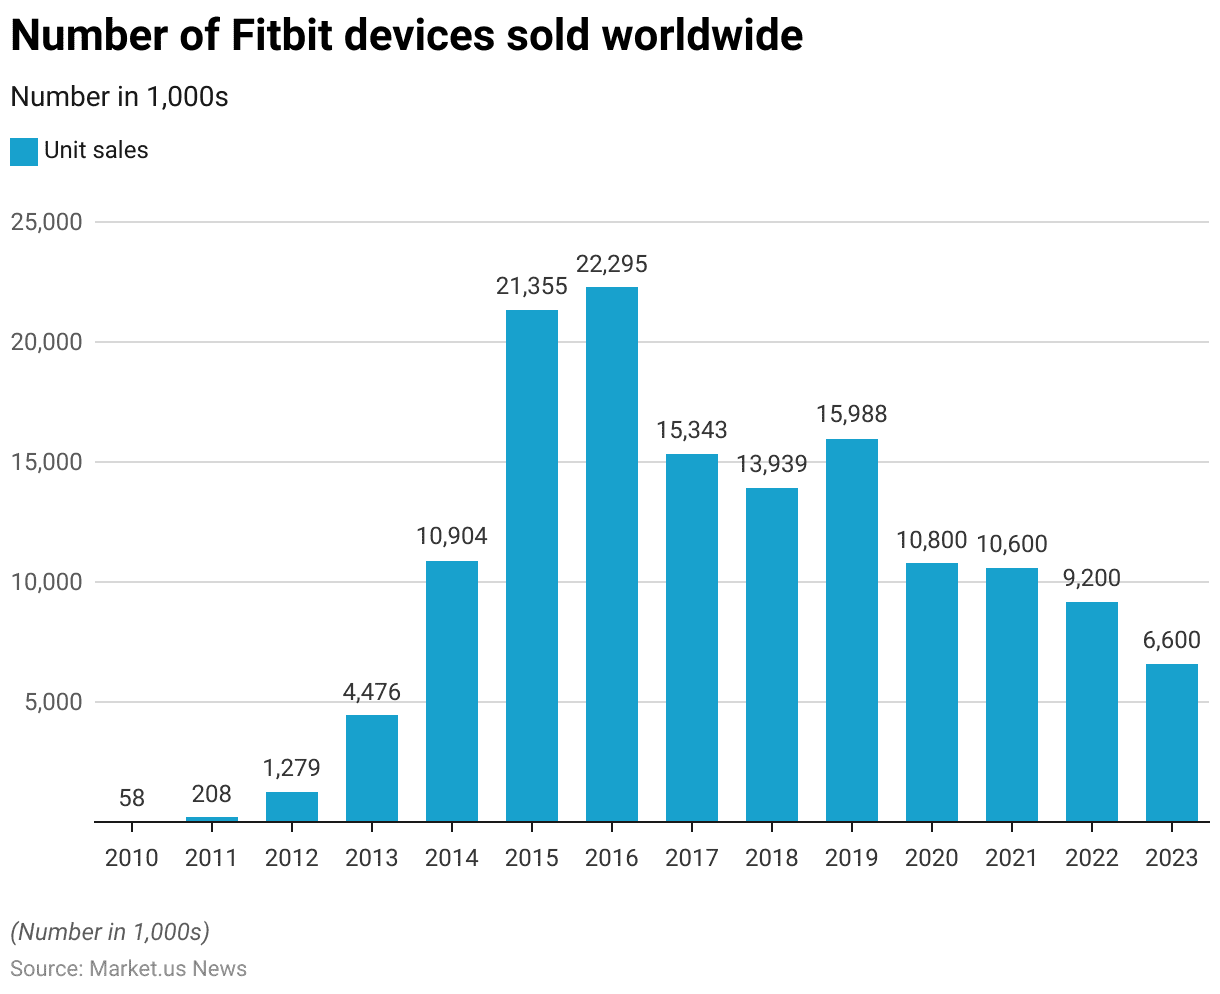
- The number of Fitbit devices sold worldwide from 2010 to 2023 has seen both substantial growth and notable declines over the years.
- The sales began modestly at 58,000 units in 2010, increasing to 208,000 in 2011.
- A significant jump occurred in 2012, with sales reaching 1.279 million units, followed by a further rise to 4.476 million in 2013.
- The growth continued with a sharp increase to 10.904 million units in 2014.
- The peak was reached in 2016 with 22.295 million units sold, after a substantial rise to 21.355 million in 2015.
- However, sales began to decline after the peak, dropping to 15.343 million in 2017 and 13.939 million in 2018, and they experienced a slight recovery to 15.988 million in 2019.
- The downward trend resumed in 2020, with sales at 10.800 million, slightly decreasing to 10.600 million in 2021, 9.200 million in 2022, and further to 6.600 million in 2023.
- This fluctuating pattern highlights the dynamic nature of the market and changing consumer preferences regarding Fitbit devices over thirteen years.
(Source: Statista)
Fitness Tracker Devices Brands Statistics
Most Used eHealth Tracker / Smart Watches – By Brand
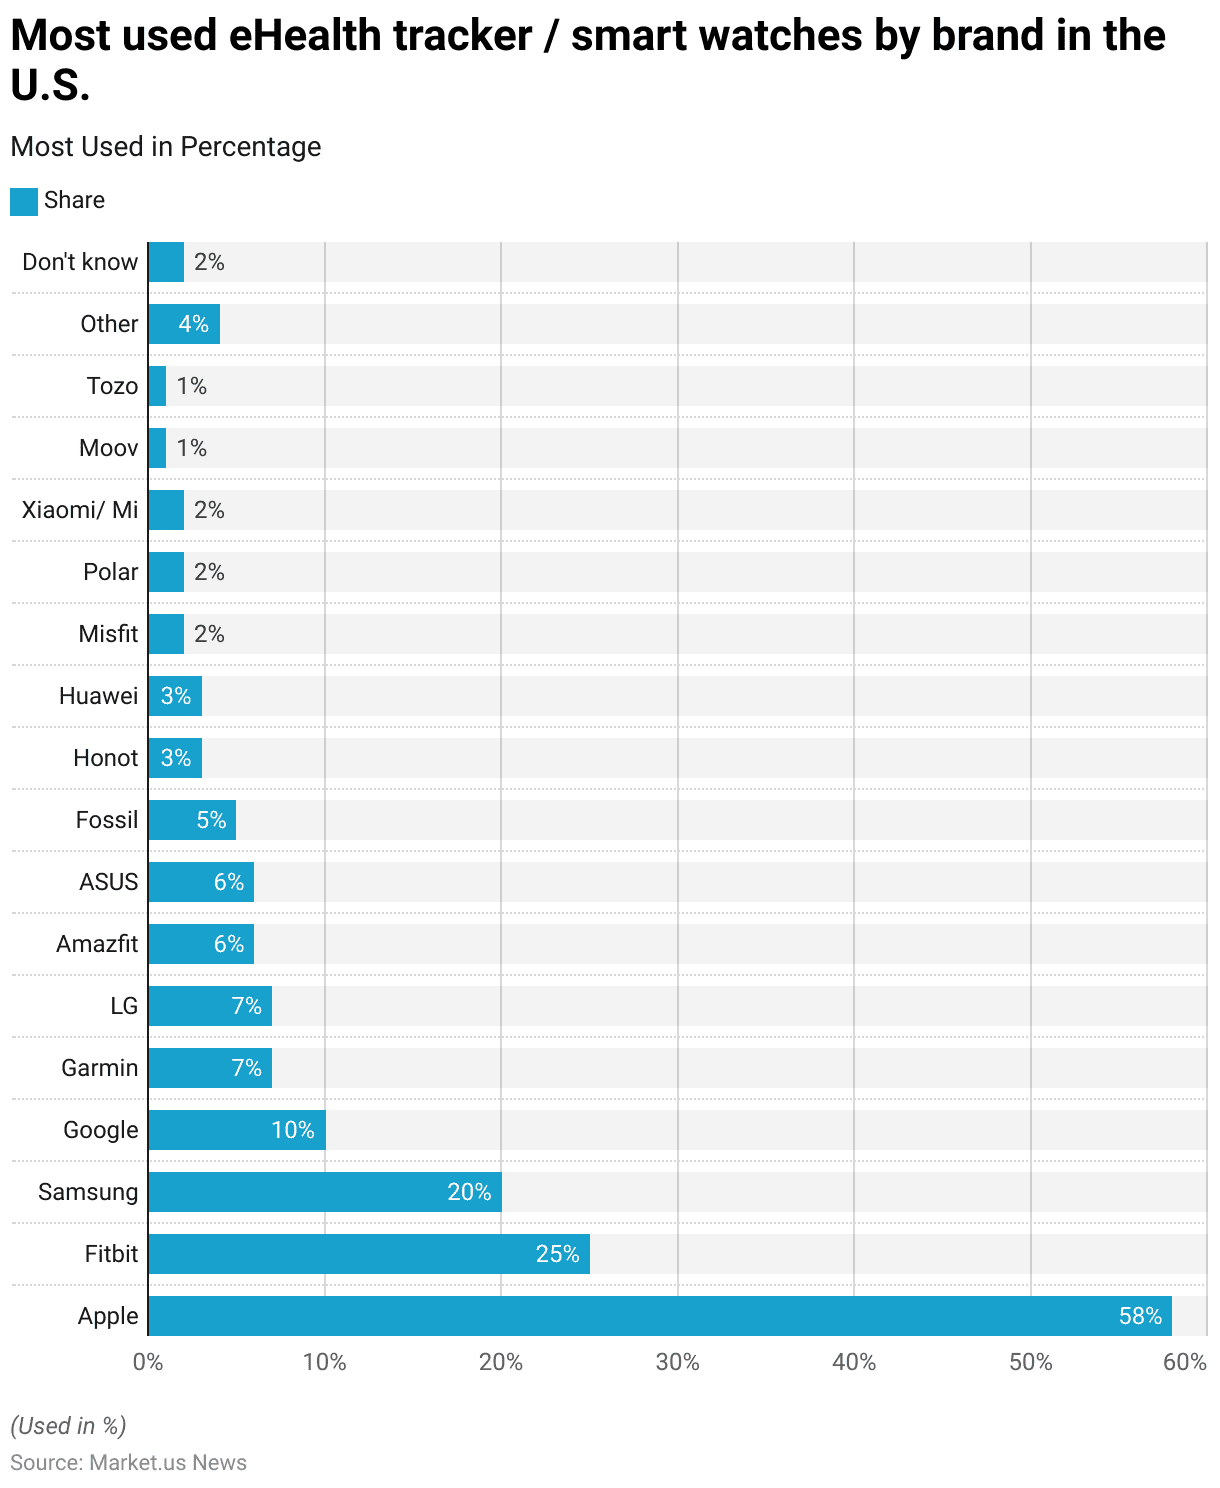
- As of June 2024, the distribution of the most used eHealth trackers and smartwatches by Brands in the U.S. showcases a dominant preference for Apple, capturing 58% of respondent shares.
- Fitbit follows with a significant 25% share, while Samsung holds 20% of the market among users.
- Google, Garmin, and L.G. each have smaller shares at 10%, 7%, and 7% respectively.
- Other brands, such as Amazfit and ASUS, both hold 6% of the user base, and Fossil has a 5% share.
- Lower percentages are seen for brands like Honot and Huawei, each at 3%, and Misfit, Polar, and Xiaomi/Mi, each at 2%.
- Brands like Moov and Tozo are at the lower end with 1% each.
- The category labelled ‘Other’ encompasses 4% of the market, and 2% of respondents are unsure of their device brand.
- This data highlights the varying levels of market penetration by different brands within the U.S. smartwatch and eHealth tracker market as of mid-2024.
(Source: Statista)
Smartwatch or Wearable Fitness/Activity Trackers Brands Owned
- As of September 2022, the preferences for smartwatch and wearable fitness/activity tracker brands among users in South Korea showed a strong dominance by Samsung, commanding a significant 61.11% share of respondents.
- Apple Watch was the second most popular, capturing 25.29% of the market.
- Xiaomi also held a notable portion, with 10.83% of users opting for their devices.
- Other brands, such as Fitbit and L.G., had smaller shares, with 3.95% and 3.07% respectively.
- Garmin, Huawei, and ASUS also had a presence in the market, with shares of 2.12%, 1.92%, and 1.18%, respectively.
- The ‘Others’ category, encompassing various smaller brands, accounted for 4.46% of the market.
- This distribution highlights the strong market positions of Samsung and Apple within the South Korean smartwatch and wearable sector.
(Source: Statista)
Leading Shared Fitness Tracker Brands – By Brand Awareness Statistics
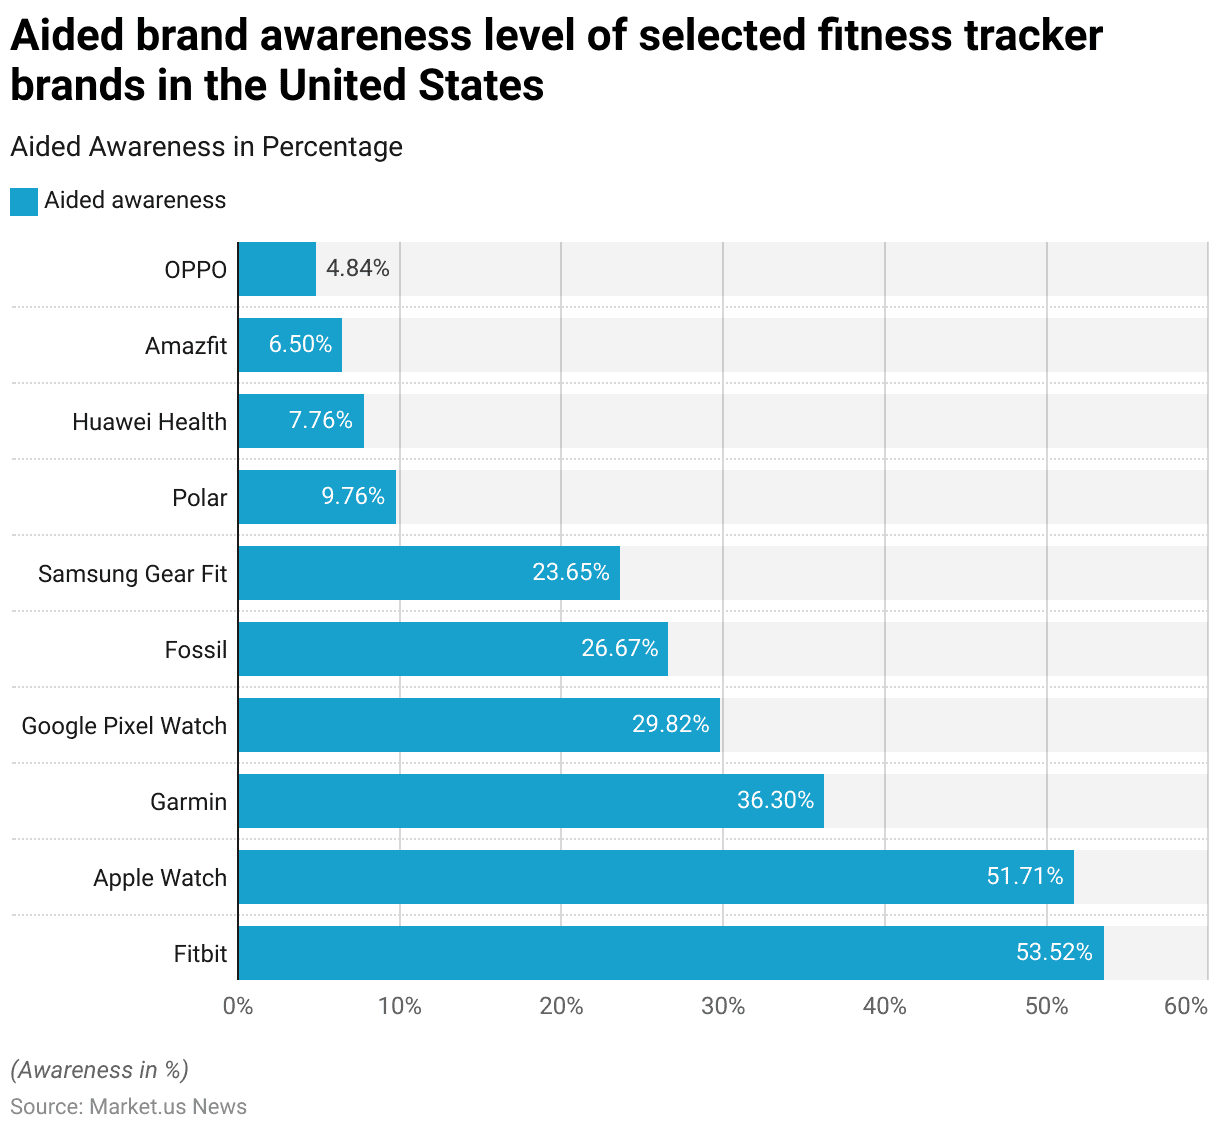
- In 2023, the aided brand awareness levels for selected fitness tracker brands in the United States varied notably.
- Fitbit led with an awareness level of 53.52%, closely followed by Apple Watch at 51.71%.
- Garmin was also well recognized, with a 36.30% awareness rate.
- Google Pixel Watch and Fossil had significant awareness levels as well, standing at 29.82% and 26.67%, respectively.
- Samsung Gear Fit was known to 23.65% of respondents.
- Other brands, such as Polar and Huawei Health, were less recognized, with awareness levels at 9.76% and 7.76% respectively.
- Amazfit and OPPO rounded out the list with 6.50% and 4.84% awareness levels.
- This spread underscores the competitive landscape in the U.S. fitness tracker market, highlighting a range of familiarity across different brands.
(Source: Statista)
Consumer Demographics
By Age
Share of People Worldwide Who Used Technology to Track Their Fitness- By Age
- In 2016, the usage of mobile apps or fitness-tracking devices to monitor health varied across different age groups globally. Overall, 33% of respondents across all ages utilized these technologies.
- Usage was highest among those aged 30-39 years, with 41% employing health tracking tools, followed closely by those in the 20-29 years age group at 39%.
- In contrast, younger individuals aged 15-19 years showed a lower usage rate of 26%.
- Adults in the 40-49 years age bracket reported a 28% usage rate, which further declined among older populations, with 25% of those aged 50-59 years and 21% of those 60 years and older using health tracking apps or devices.
- This data reflects a clear trend of higher engagement with health monitoring technologies among younger to middle-aged adults compared to teenagers and seniors.
(Source: Statista)
Use of Wearable Fitness Technologies- By Age
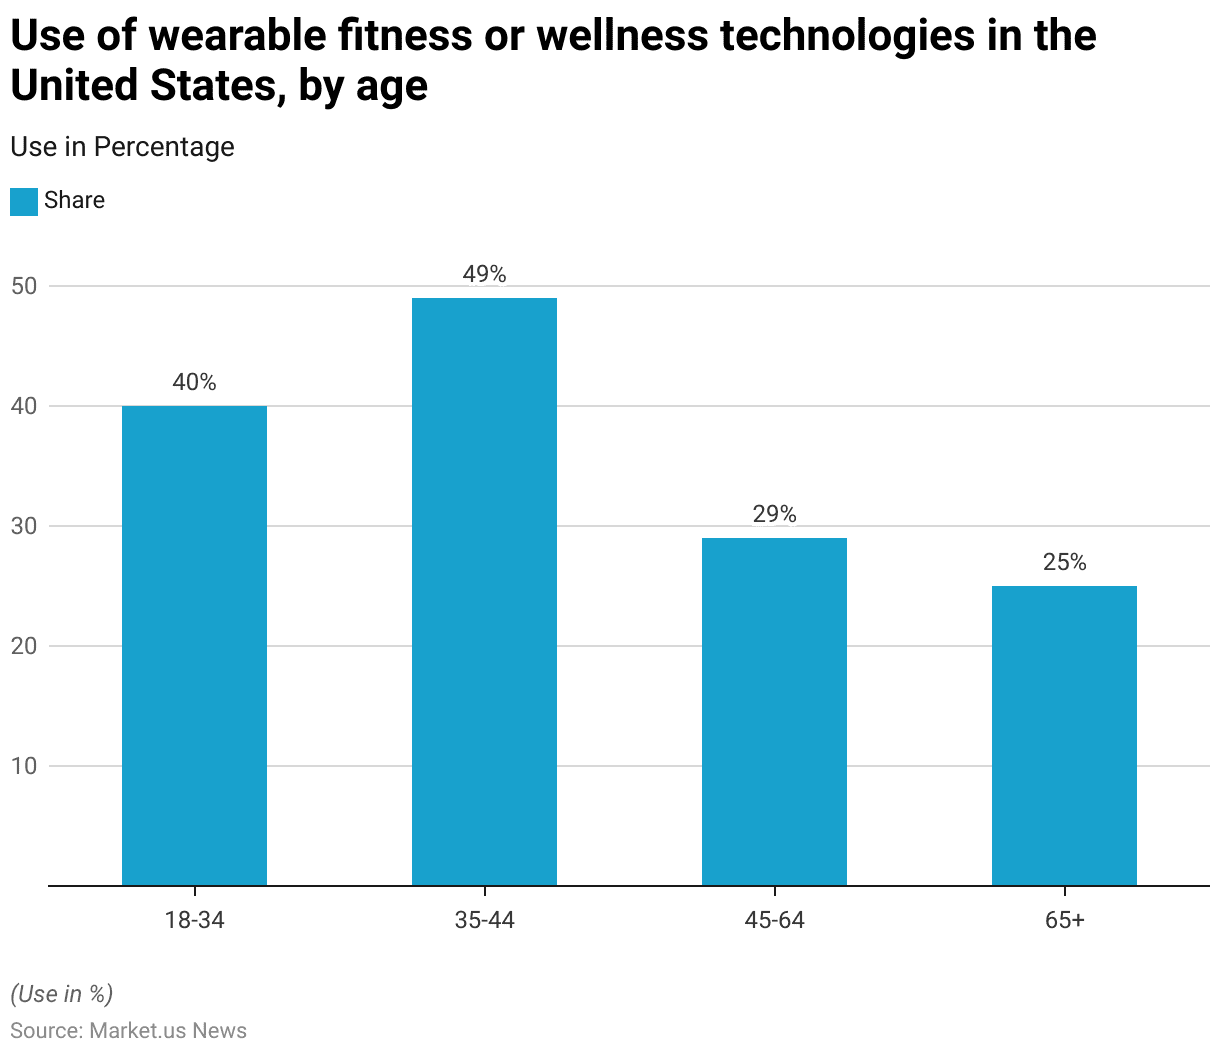
- In 2023, the use of wearable fitness or wellness technologies in the United States varied significantly across different age groups.
- Respondents aged 35-44 showed the highest adoption rate at 49%, indicating a strong engagement with these technologies among this demographic.
- This was followed by the 18-34 age group, which had a 40% usage rate.
- The adoption rates decreased with age; those in the 45-64 age bracket reported a 29% usage rate, and the lowest adoption rate was seen among those aged 65 and older, at 25%.
- This data highlights a trend where younger to middle-aged adults are more inclined to use wearable fitness or wellness technologies compared to the older population.
(Source: Statista)
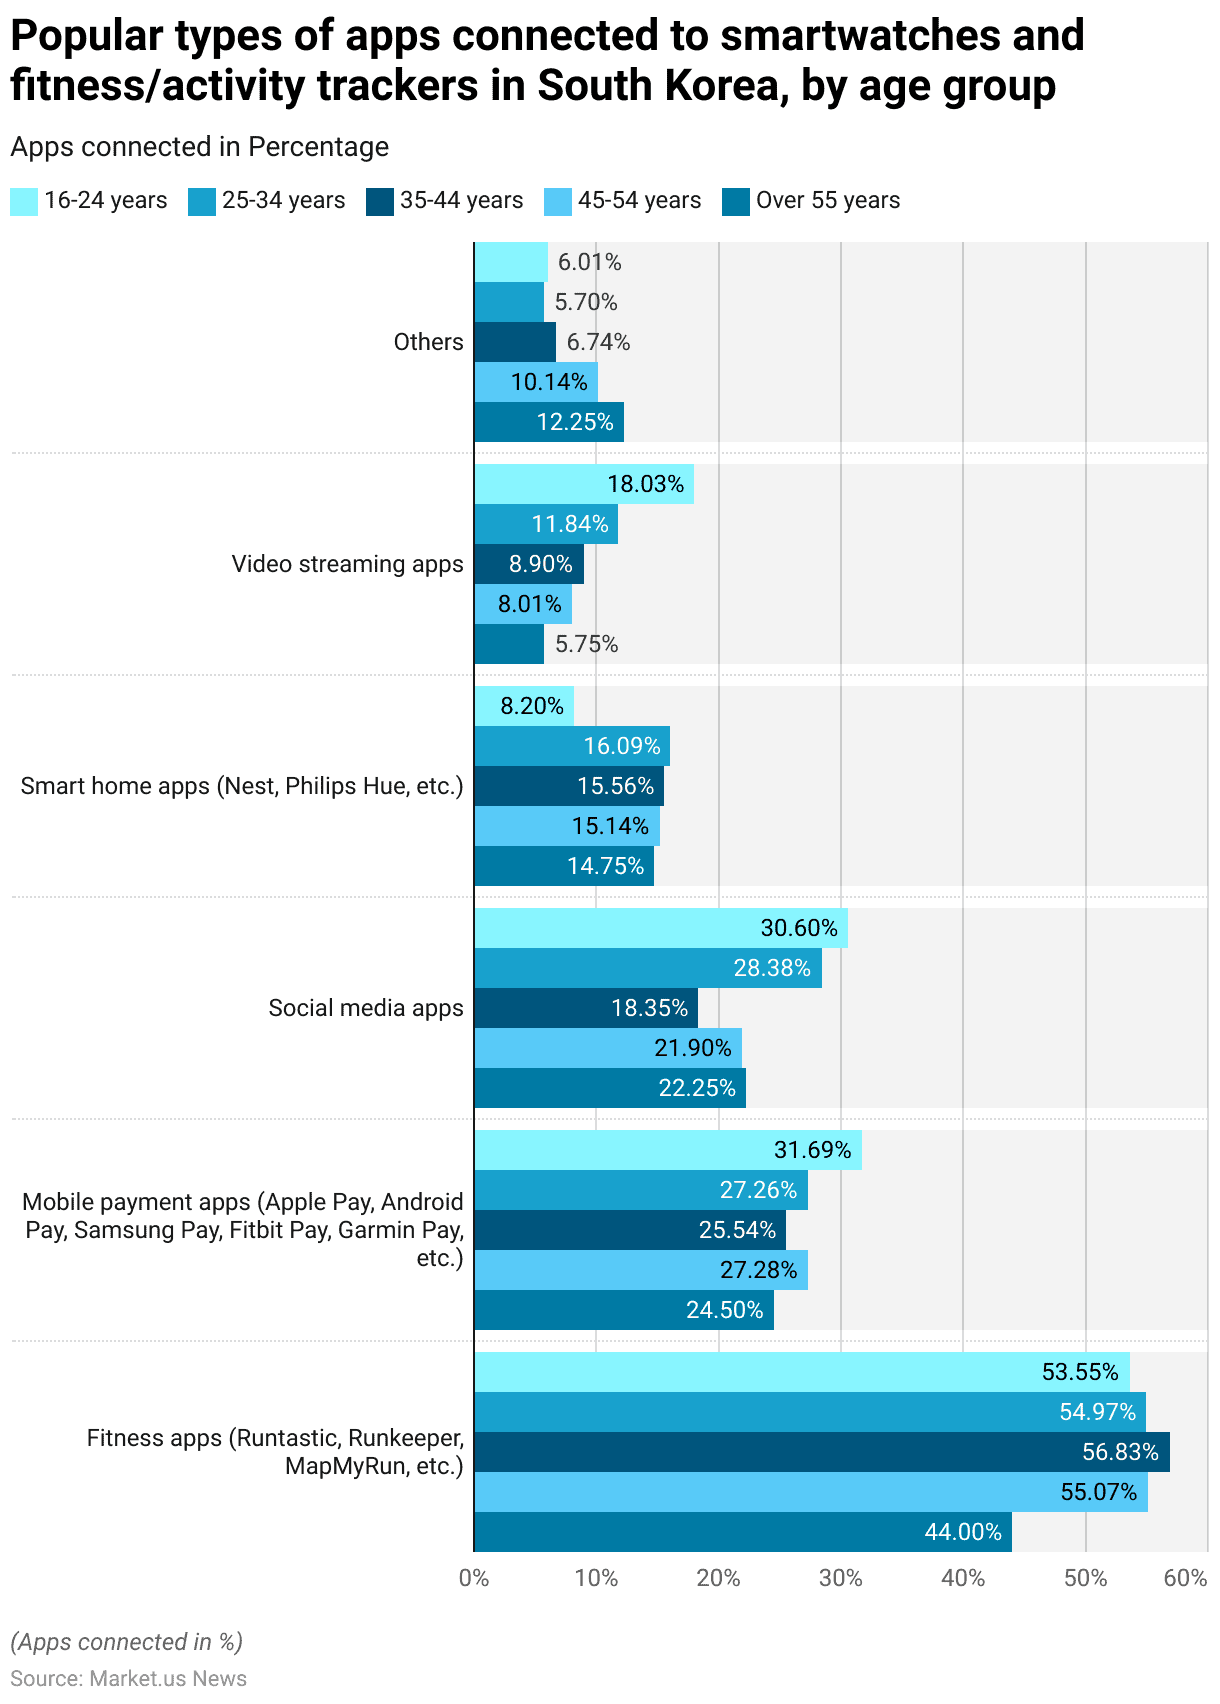
Apps Connected to Smartwatches and Fitness Tracker – By Age Group Statistics
- As of September 2022 in South Korea, the popularity of apps connected to smartwatches and fitness/activity trackers varied across different age groups.
- Fitness apps such as Runtastic, Runkeeper, and MapMyRun were the most favored, with the highest usage reported in the 35-44 age group at 56.83%, followed by 55.07% in the 45-54 age group, 54.97% among the 25-34 year-olds, 53.55% in the 16-24 age group, and 44% in those over 55 years.
- Mobile payment apps like Apple Pay and Samsung Pay also saw significant use, with the highest adoption in the 16-24 age group at 31.69% and the least in the 35-44 age group at 25.54%.
- Social media app usage was most prevalent among the younger demographics, peaking at 30.60% in the 16-24 age group and gradually decreasing with age.
- Smart home apps maintained moderate popularity across all ages, ranging from 8.20% in the youngest group to 16.09% in the 25-34 age group.
- Video streaming apps saw a decline in usage with increasing age, starting at 18.03% among 16-24-year-olds and dropping to 5.75% among those over 55.
- The category labeled ‘Others’ saw an increase in popularity with age, starting at 6.01% in the youngest group and peaking at 12.25% in those over 55.
- This data illustrates the diverse application usage connected to wearable devices, reflecting varied interests and needs across different age groups in South Korea.
(Source: Statista)
By Gender
Use of Wearable Fitness or Wellness Technologies- By Gender
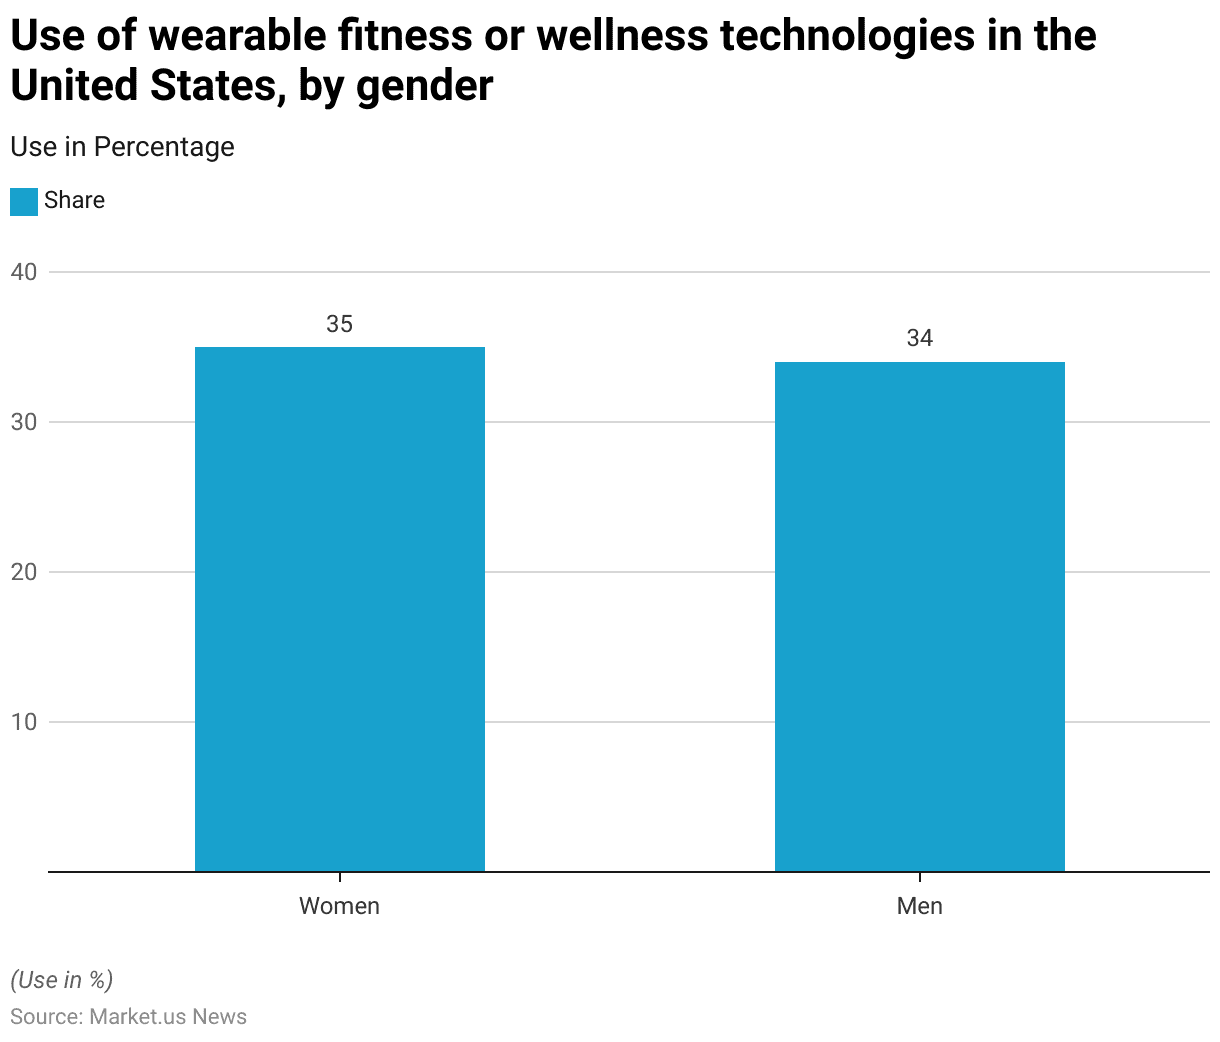
- In the United States, as of 2023, the use of wearable fitness or wellness technologies showed a fairly balanced distribution between genders.
- Women had a slightly higher usage rate at 35% compared to men, who had a usage rate of 34%.
- This near parity in the statistics indicates that both genders are almost equally engaged in utilizing wearable technologies to monitor and enhance their health and wellness, reflecting a broad acceptance and integration of these devices across different demographic groups.
(Source: Statista)
Health or Fitness Monitoring Device Users – By Gender
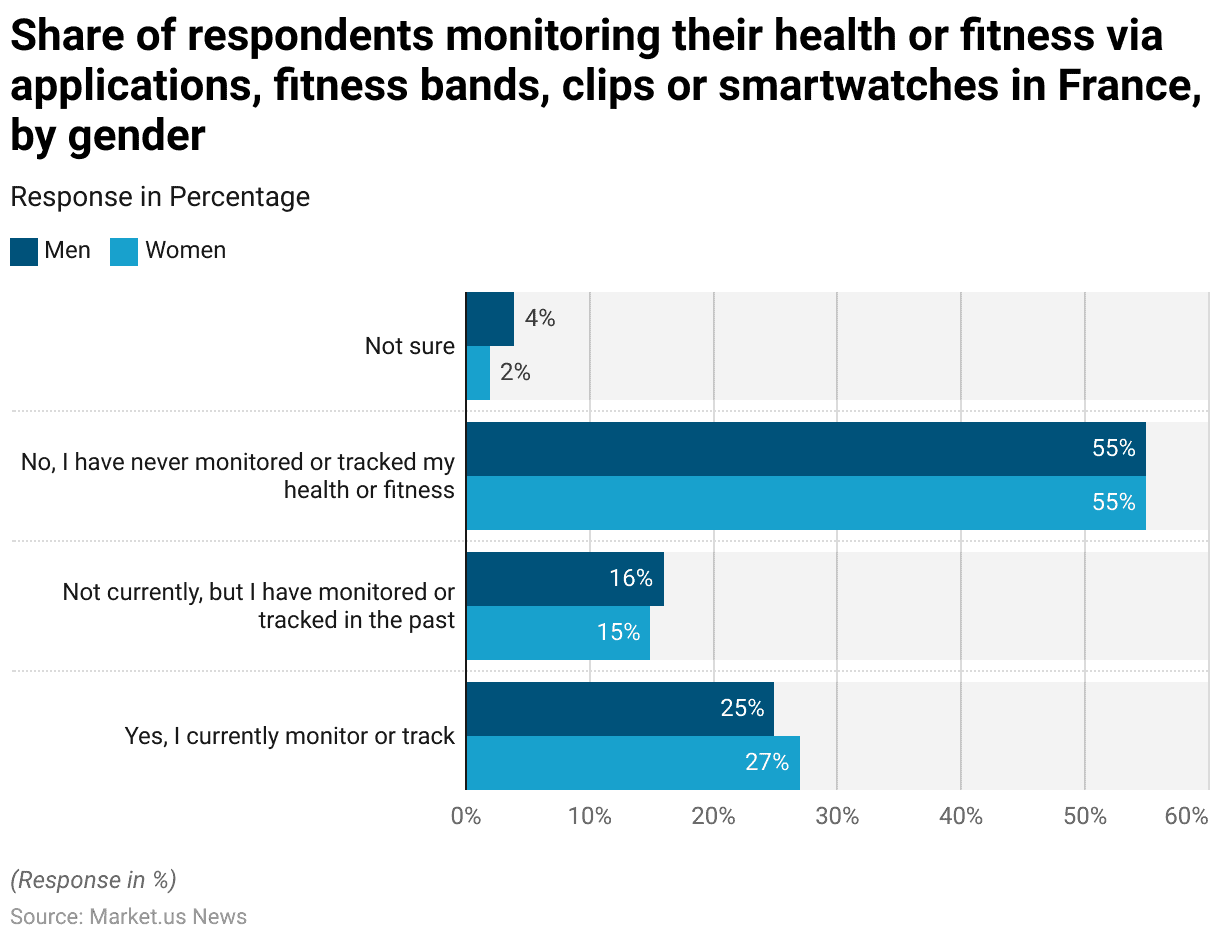
- In France in 2016, the utilization of applications, fitness bands, clips, or smart watches for monitoring health or fitness showed a slight variation between genders.
- Among men, 25% reported that they currently monitor or track their health or fitness, slightly lower than the 27% of women who reported the same.
- Those who had monitored or tracked their health or fitness in the past but were not currently doing so comprised 16% of men and 15% of women.
- A majority of both genders, 55% of men and 55% of women stated that they had never monitored or tracked their health or fitness.
- Uncertainty about whether they had ever monitored or tracked their health was expressed by 4% of men and 2% of women.
- This data indicates a relatively equal engagement with health and fitness monitoring technologies between men and women in France during this period, with a significant portion of the population not participating in such activities.
(Source: Statista)
Apps Connected to Smartwatches and Fitness Tracker – By Gender Statistics
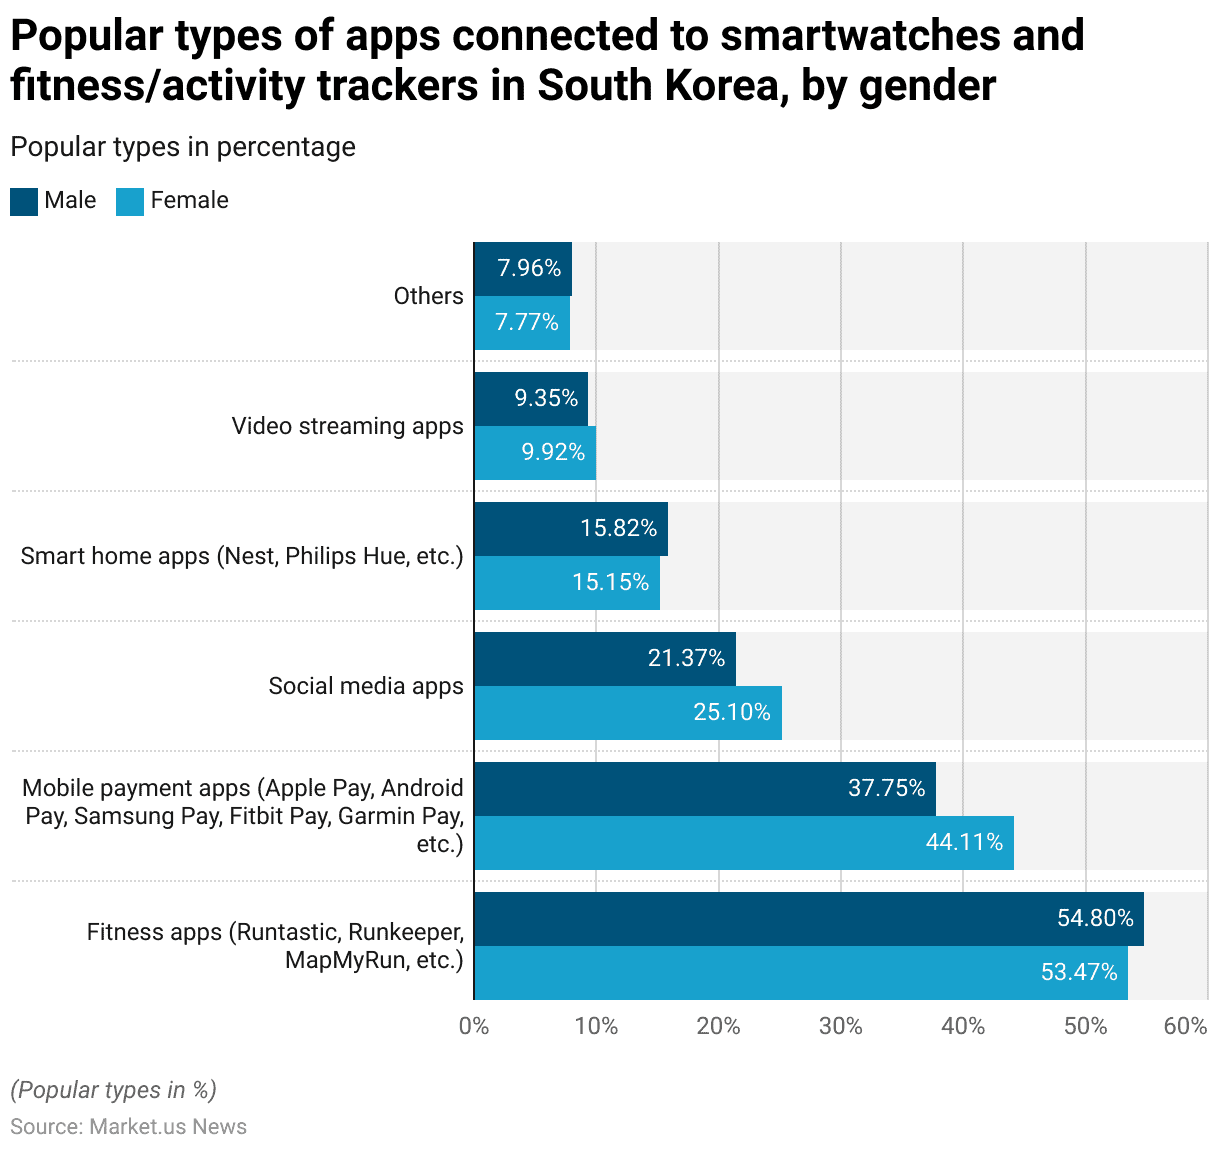
- In South Korea, as of September 2022, the popularity of various types of apps connected to smartwatches and fitness/activity trackers differed slightly between genders.
- Fitness apps such as Runtastic, Runkeeper, and MapMyRun were the most popular among both genders, with 54.80% of males and 53.47% of females using these applications.
- Mobile payment apps like Apple Pay and Samsung Pay were more favoured by females, with 44.11% usage compared to 37.75% among males.
- Social media apps also saw higher usage among females at 25.10% versus 21.37% for males.
- The use of smart home apps like Nest and Philips Hue was almost even, with 15.82% of males and 15.15% of females engaging with these technologies.
- Video streaming apps were slightly more popular among females at 9.92%, compared to 9.35% among males.
- Other types of apps held similar interest levels, with 7.96% of males and 7.77% of females using them.
- This data illustrates nuanced differences in app preferences connected to wearable devices across genders in South Korea.
(Source: Statista)
Regional Insights
Health & Fitness Tracker Global Unit Sales – By Region
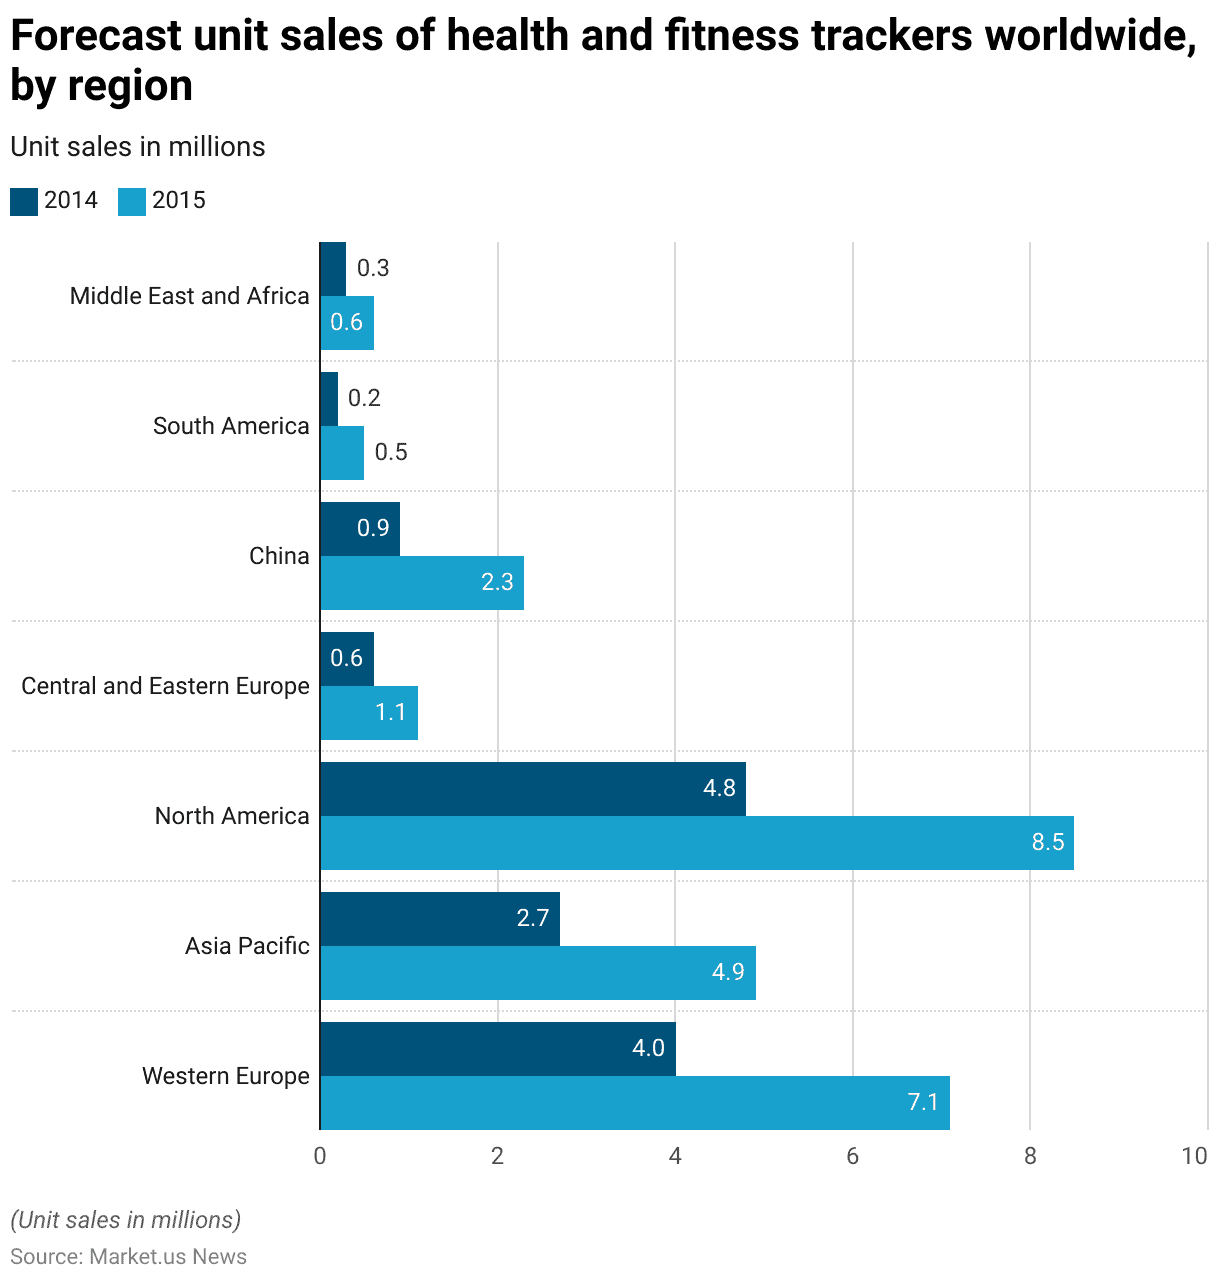
- The forecast for unit sales of health and fitness trackers worldwide from 2014 to 2015 reveals substantial growth across various regions.
- In 2014, Western Europe reported sales of 4 million units, which significantly increased to 7.1 million by 2015.
- The Asia Pacific region also saw a notable rise from 2.7 million units in 2014 to 4.9 million in 2015.
- North America experienced a considerable increase in sales, from 4.8 million units in 2014 to 8.5 million units in 2015.
- Central and Eastern Europe, though smaller in volume, showed growth from 0.6 million units in 2014 to 1.1 million in 2015.
- China’s market nearly tripled, with sales growing from 0.9 million units to 2.3 million units over the same period.
- South America, the Middle East, and Africa, though smaller markets, also displayed growth; South America’s sales rose from 0.2 million to 0.5 million units, and the Middle East and Africa increased from 0.3 million to 0.6 million units.
- This data underscores a global upward trend in the adoption of health and fitness trackers, reflecting a growing consumer interest in personal health monitoring technologies.
(Source: Statista)
Market Shares of Leading Fitness Tracking Wristwear Brands in APAC
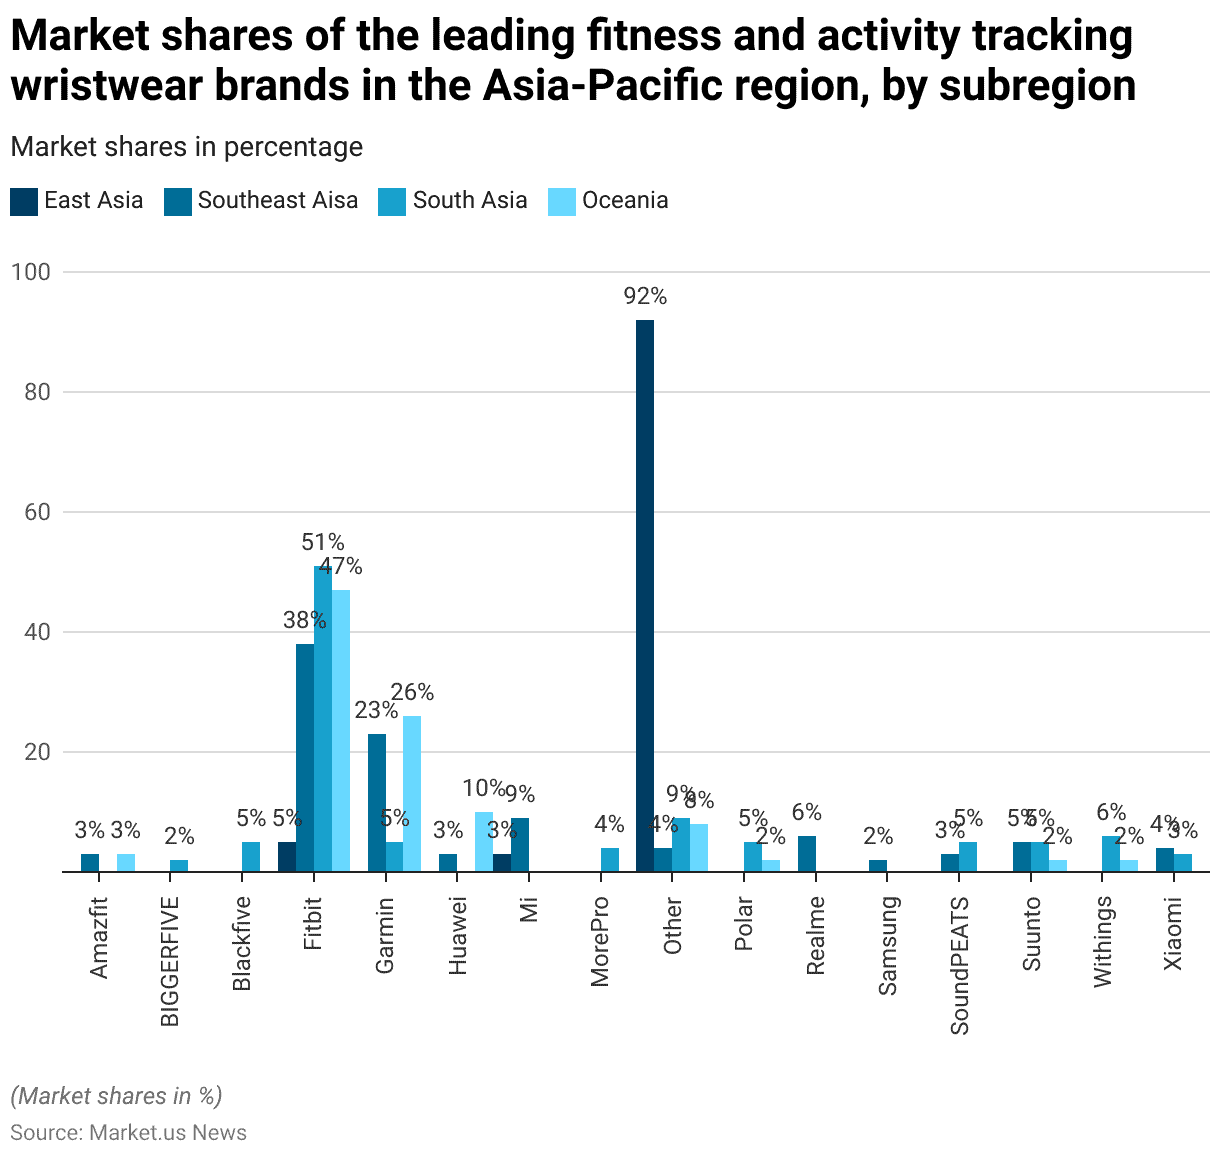
- In 2022, the market shares for fitness and activity-tracking wristwear brands in the Asia-Pacific region displayed significant diversity across subregions.
- In East Asia, the brand “Other” held a dominant share at 92%, followed by Garmin at 23%, and both Mi and Amazfit captured 3% each.
- Fitbit, while only securing 5% in East Asia, had a commanding presence in Southeast Asia with 38%, South Asia with 51%, and Oceania with 47%.
- In Southeast Asia, other notable contributions included Mi, with 9%, and both Realme and Xiaomi, with 6% and 4%, respectively.
- Garmin also marked its presence with a 5% market share in South Asia and an impressive 26% in Oceania, where it trailed only behind Fitbit.
- Lesser-known brands like SoundPEATS and Suunto each captured 5% in Southeast Asia, with Suunto maintaining the same in South Asia. Huawei managed a share of 10% in Oceania.
- Withings and MorePro were other brands with minor shares, accounting for 6% and 4% in South Asia, respectively.
- This distribution illustrates a varied preference for brands across the Asia-Pacific region, indicating a segmented and competitive market environment.
(Source: Statista)
Consumer Preferences and Trends
Wearable Device Usage for Fitness
- As of January 2022, a global survey revealed that 53.70% of respondents reported using a wearable device to monitor their fitness activity, indicating a majority uptake in the use of technology for health monitoring.
- Conversely, 46.30% of the participants stated they do not use any wearable devices for such purposes.
- This data highlights the significant penetration of wearable fitness technologies into everyday health management for over half of the surveyed population while also pointing out that a substantial minority has yet to adopt such devices.
(Source: Statista)
Purchase Intention of Smartwatch and Fitness Tracker Worldwide
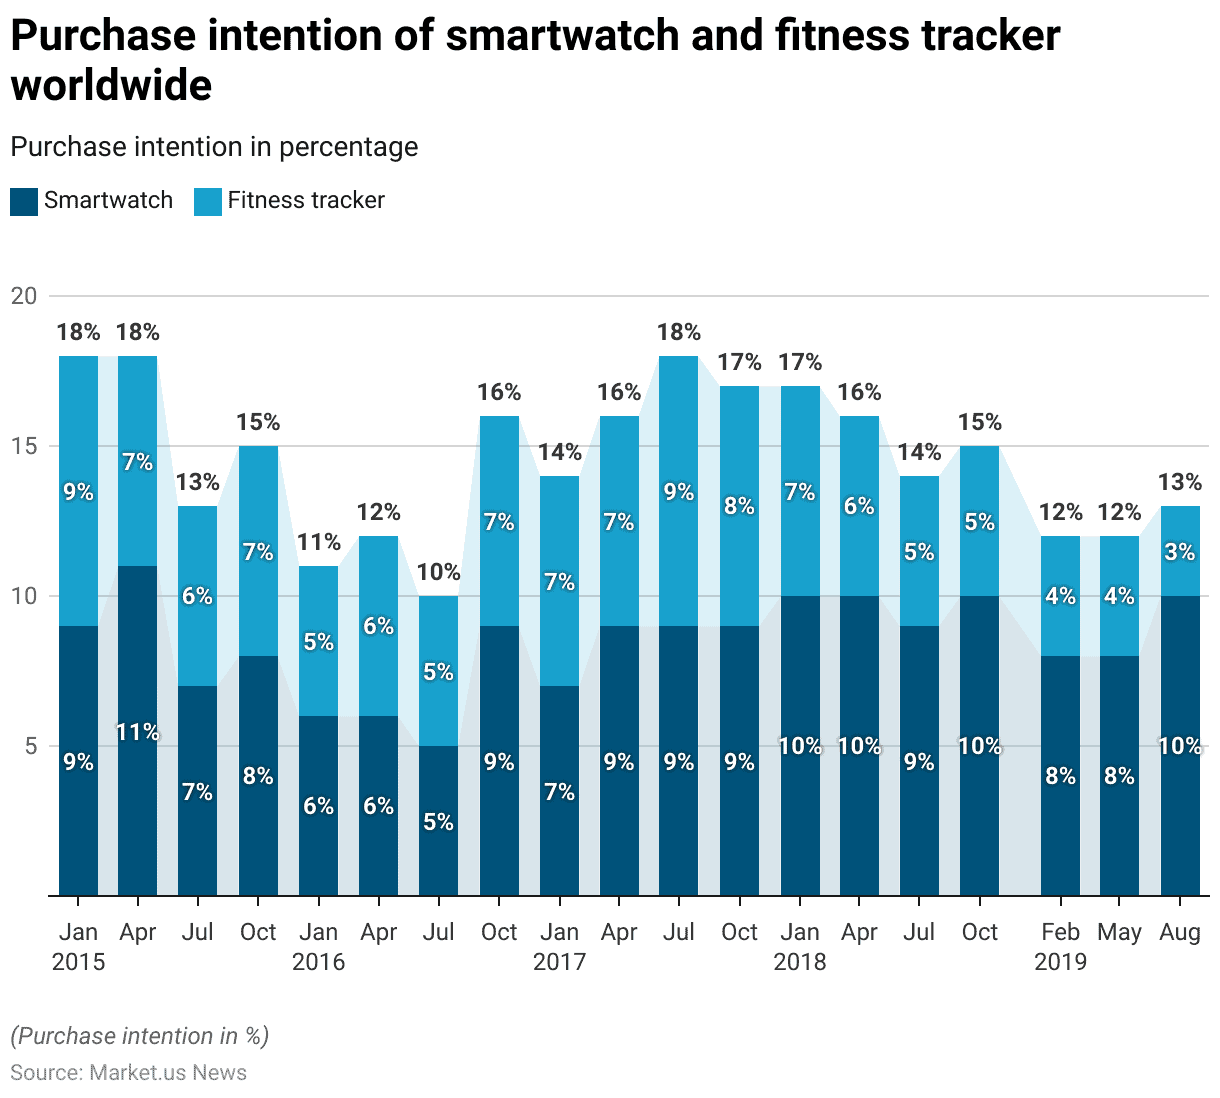
- The worldwide purchase intention data for smartwatches and fitness trackers from January 2015 to August 2019 reveals fluctuating consumer interest in these devices over the years.
- In January 2015, both smartwatches and fitness trackers had a purchase intention rate of 9%. This interest peaked for smartwatches in April 2015 at 11%, while fitness trackers saw a decrease to 7%.
- Through 2016, the purchase intention for both device types stabilized, generally oscillating between 5% and 7%.
- In 2017, a noticeable increase was observed in the intent to purchase smartwatches, consistently reaching 9% from April to October and matching fitness trackers at 9% in July.
- By January 2018, smartwatches hit a high of 10%, a figure that was maintained through October 2018, while fitness trackers saw a decline to 5% during the same period.
- In 2019, there was a downward trend, with smartwatches dipping to 8% in February and May and then slightly rebounding to 10% in August, whereas fitness trackers continued to decline, hitting a low of 3% in August 2019.
- This data suggests a growing disparity in consumer interest between these two types of wearable technology, with smartwatches gaining a higher purchase intent over fitness trackers as the period progressed.
(Source: Statista)
Acceptability of Sharing Fitness Tracker User Data With Medical Researchers
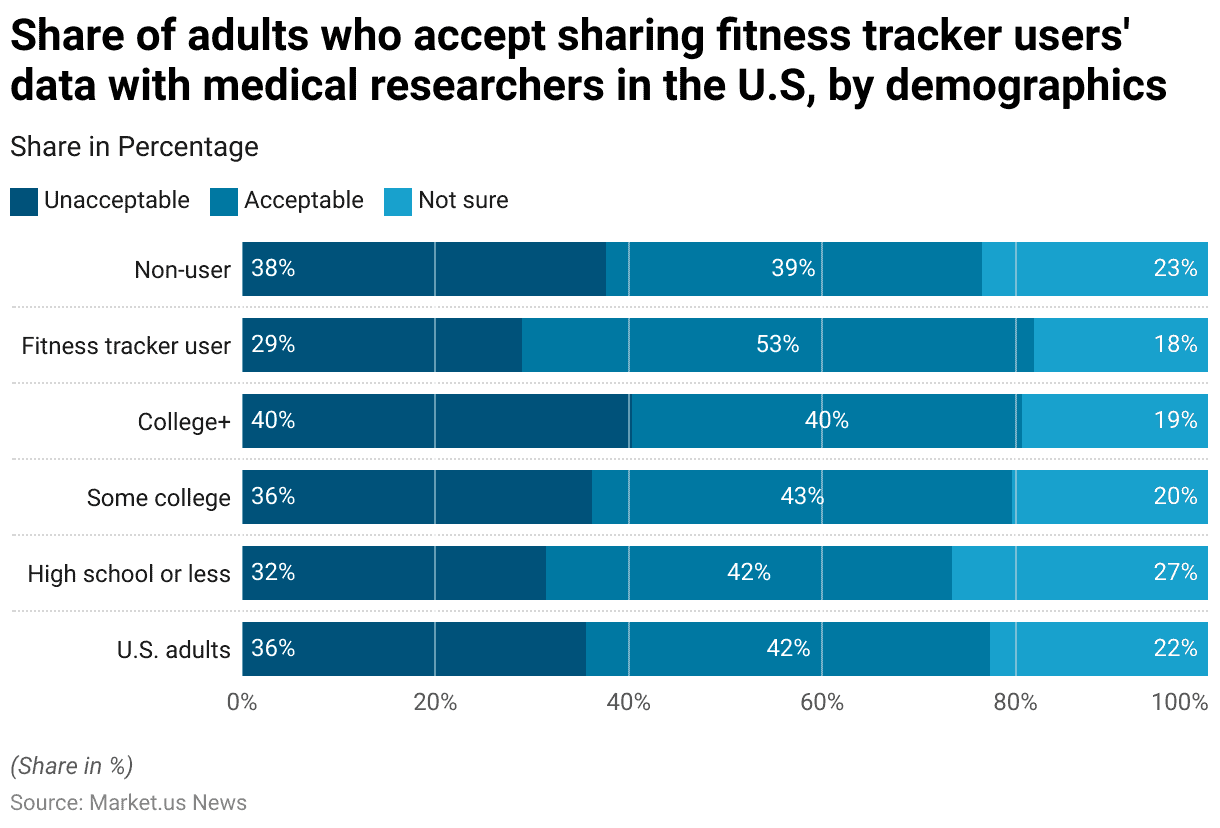
- In the United States in 2019, opinions varied on the acceptability of sharing fitness tracker users’ data with medical researchers, as reflected across different demographic groups.
- Overall, 41% of U.S. adults found it acceptable, 35% deemed it unacceptable, and 22% were unsure.
- Among those with a high school education or less, 41% were in favour, 31% opposed, and 26% undecided.
- Individuals with some college education showed a slightly more favourable attitude, with 43% finding it acceptable, 36% finding it unacceptable, and 20% uncertain.
- Those with a college degree or higher presented a balanced viewpoint, with 40% on each side of acceptability and unacceptability and 19% unsure.
- Fitness tracker users were more open to the idea, with 53% approving the data sharing, 29% disapproving, and 18% undecided.
- Conversely, non-users were more hesitant, with only 38% finding it acceptable, 37% finding it unacceptable, and 23% uncertain.
- This data illustrates varied perceptions of privacy and data sharing with medical researchers, influenced significantly by educational background and personal use of fitness tracking devices.
(Source: Statista)
Concerns and Challenges
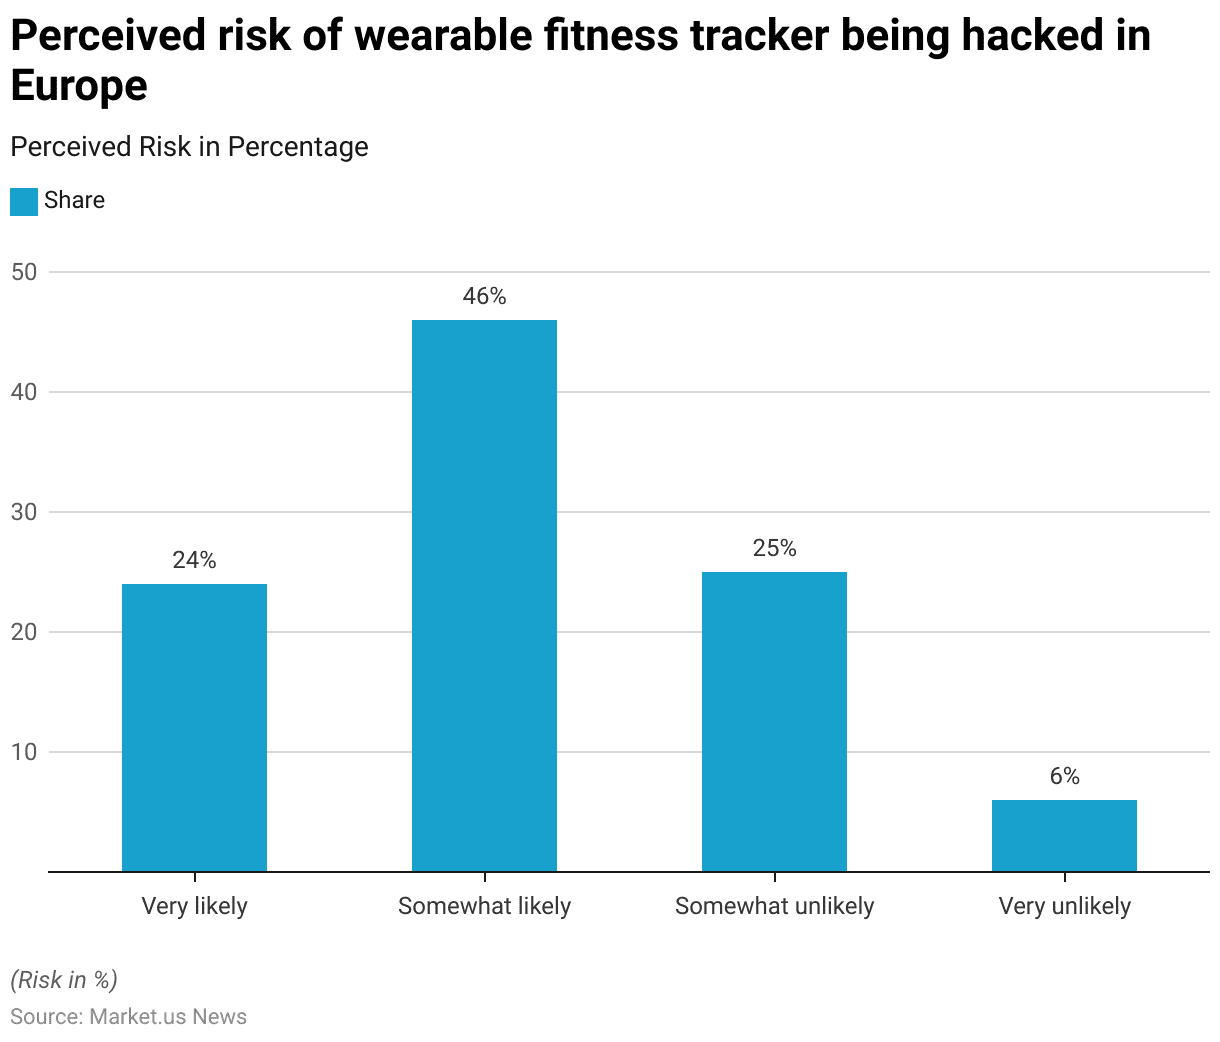
- In 2015, a survey conducted in Europe explored the perceived risk of wearable fitness trackers being hacked, specifically by an employee of an on-demand video streaming media company.
- The results indicated a considerable concern among respondents, with 24% considering it very likely and 46% viewing it as somewhat likely that such a breach could occur.
- Conversely, 25% of those surveyed felt it was somewhat unlikely, and a smaller segment, 6%, regarded it as very unlikely.
- Overall, a significant majority (70%) perceived a potential risk (ranging from moderate to high) of hacking incidents involving their wearable fitness trackers, highlighting a general apprehension about the security of these devices.
(Source: Statista)
Innovations in Fitness Tracking Devices
- In 2024, the wearable fitness technology landscape is witnessing a surge in innovation, primarily driven by advancements in sensor technology and A.I. integration.
- Enhanced sensors now track a broad spectrum of health metrics with greater precision, including blood pressure, blood oxygen levels, and stress levels, allowing for a deeper understanding of one’s physical state and enabling more informed health and fitness decisions.
- AI has been pivotal in transforming these devices from simple trackers to smart health advisors by analyzing personal health data in real-time and offering customized guidance on diet, exercise, and recovery.
- Moreover, companies are focusing on specific health issues with new wearable features like blood pressure monitoring and sleep apnea detection, although these features are still navigating regulatory approvals to ensure accuracy and safety.
- The market is also seeing the introduction of devices designed to cater to mental health, with functionalities that assist in stress management and sleep quality, reflecting a holistic approach to health.
- Product-wise, there’s been a notable diversification. For instance, Casio’s G-Shock Rangeman GPR-H1000 integrates conventional fitness tracking with outdoor navigational tools, making it a robust option for adventure enthusiasts.
- Smart rings, such as the Amazfit Helio, are also gaining popularity due to their discreet form factor and specialized health monitoring capabilities, which are challenging traditional wrist-worn devices.
- These innovations are setting the stage for significant market growth, with an expected robust annual growth rate, as these devices become integral to consumer health management and lifestyle.
- As companies continue to innovate and expand their product offerings, the competition within the wearable fitness technology market is becoming increasingly intense, compelling companies to continuously improve and differentiate their products to sustain and grow their market presence.
(Sources: Logics Technology Solutions Inc, Wareable, TechRadar, FMIBlog)
Recent Developments
Acquisition by Google:
- Google completed its acquisition of Fitbit for $2.1 billion in early 2021. This strategic move aims to integrate Fitbit’s health-tracking technology with Google’s broader AI and health initiatives.
New Product Launches:
- Amazfit Active Smartwatch: In February 2024, Zepp Health launched the Amazfit Active Smartwatch, offering advanced features such as stress tracking, heart rate monitoring, and sleep analysis.
- Apple Watch OS 10: In mid-2024, Apple introduced Watch OS 10, which focuses on enhanced health features, including mental health tools and advanced sleep tracking.
- Xiaomi Band 7: Xiaomi released its latest fitness tracker, the Band 7, globally in 2022. This device features an AMOLED display and offers over 100 sports modes
Strategic Collaborations:
- Samsung and Google Partnership: Samsung launched a unified smartwatch platform in collaboration with Google, improving user experiences with wearable devices such as the Galaxy Watch.
Conclusion
Fitness Tracker Statistics – The fitness tracker market has grown robustly, driven by increased health awareness and technological advancements in wearable devices.
This market is diversifying into segments like smart bands, smartwatches, and smart scales, each offering unique functionalities for health monitoring.
Consumer preferences have evolved towards devices that integrate broader smart functionalities such as mobile payments and social media connectivity.
Continuous technological enhancements have improved device accuracy, user-friendliness, and integration with other technologies, making them essential tools for proactive health management.
Further, despite challenges like data privacy concerns, the industry faces significant opportunities for innovation, particularly through potential partnerships with healthcare providers and advancements in health monitoring technologies.
As these devices become integral to daily health management, their development is likely to continue adapting to the dynamic technological landscape and consumer health needs.
FAQs
A fitness tracker is a wearable device that monitors and records various types of physical activity and health-related metrics such as steps taken, heart rate, sleep patterns, and calorie consumption.
Fitness trackers use sensors like accelerometers and gyroscopes to measure motion. These devices often include heart rate sensors and GPS to provide more detailed insights into the user’s health and activity levels. Data collected is then processed to track and interpret daily physical activities and health metrics.
Yes, fitness trackers can potentially improve health by providing data that helps users become more aware of their daily activity levels and health metrics. This awareness can motivate users to increase physical activity, monitor sleep patterns, and manage stress, contributing to overall better health.
While fitness trackers are generally good at providing ballpark figures for steps and basic activity, their accuracy can vary, especially in activities that are non-step-based or involve complex motions. Heart rate monitoring is relatively reliable, but it may not always be as accurate as medical-grade devices.
Many modern fitness trackers are water-resistant and specifically designed to track swimming, recording metrics like laps, swim distance, and pace. Ensure the device is rated for water resistance at an appropriate depth for swimming activities.


