Table of Contents
- Introduction
- Editor’s Choice
- Global Food Packaging Market Overview
- Food Service Packaging Market Value Worldwide
- Frozen Food Packaging Market Value Worldwide Statistics
- Metallocene Polypropylene (mPP) Food Packaging Market Value Statistics
- Food Storage Container Statistics
- Food Packaging Material Statistics
- Production of Food Packaging Material Statistics
- Consumer Preferences and Trends
- Concerns and Challenges
- Food Packaging Regulations
- Recent Developments
- Conclusion
- FAQs
Introduction
Food Packaging Statistics: Food packaging is essential for protecting and preserving food, ensuring safety, and providing critical information.
It includes various types, such as primary (direct contact with food), secondary (grouping of primary packages), and tertiary (bulk handling).
Materials commonly used are glass, plastic, metal, and paper, each offering distinct benefits. Techniques like vacuum packaging and modified atmosphere packaging extend shelf life, while regulatory standards ensure safety and accurate labeling.
With growing concerns about sustainability, there is a push towards recyclable, biodegradable, and minimalistic packaging solutions.
Moreover, emerging trends include smart packaging with technology and active packaging that enhances preservation.
Editor’s Choice
- The global food packaging market revenue is projected to reach USD 592.8 billion by 2032.
- The presence of several key players characterizes the global food packaging market, each holding a significant market share. Constantia Flexibles leads the market with a 15% share.
- The global food packaging market exhibits varying levels of market share across different regions. The Asia-Pacific (APAC) region leads the market, accounting for 34.8% of the total share.
- By 2030, the global food service packaging market is expected to achieve a revenue of USD 186 billion, underscoring the consistent expansion of this sector.
- The global frozen food packaging market revenue is anticipated to reach USD 56.2 billion by 2028.
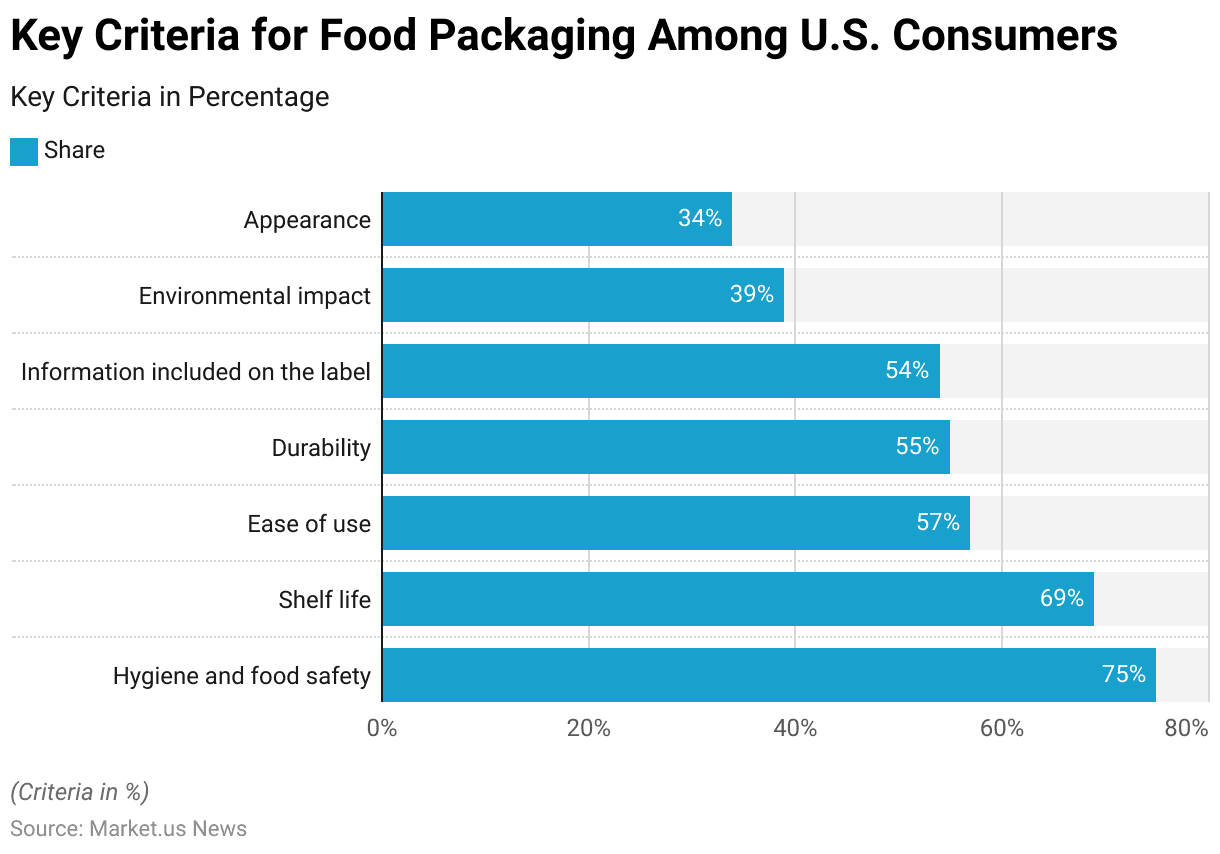
- As of March 2023, U.S. consumers identified several important criteria when evaluating food packaging. The foremost concern was hygiene and food safety, which was prioritized by 75% of respondents.
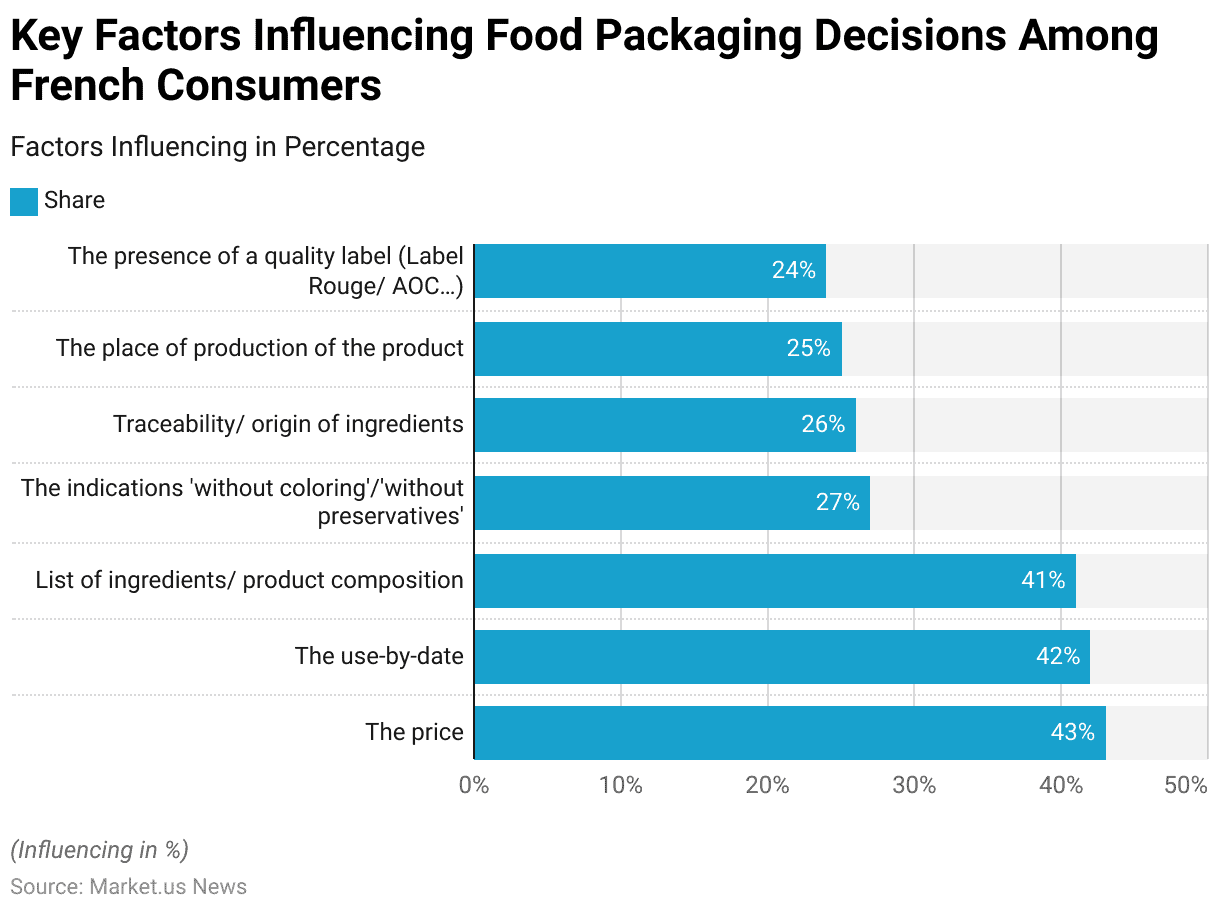
- In 2018, several elements of food packaging significantly influenced the purchasing decisions of French consumers. The most important factor was the price, which 43% of respondents cited as the primary consideration.
Global Food Packaging Market Overview
Global Food Packaging Market Size Statistics
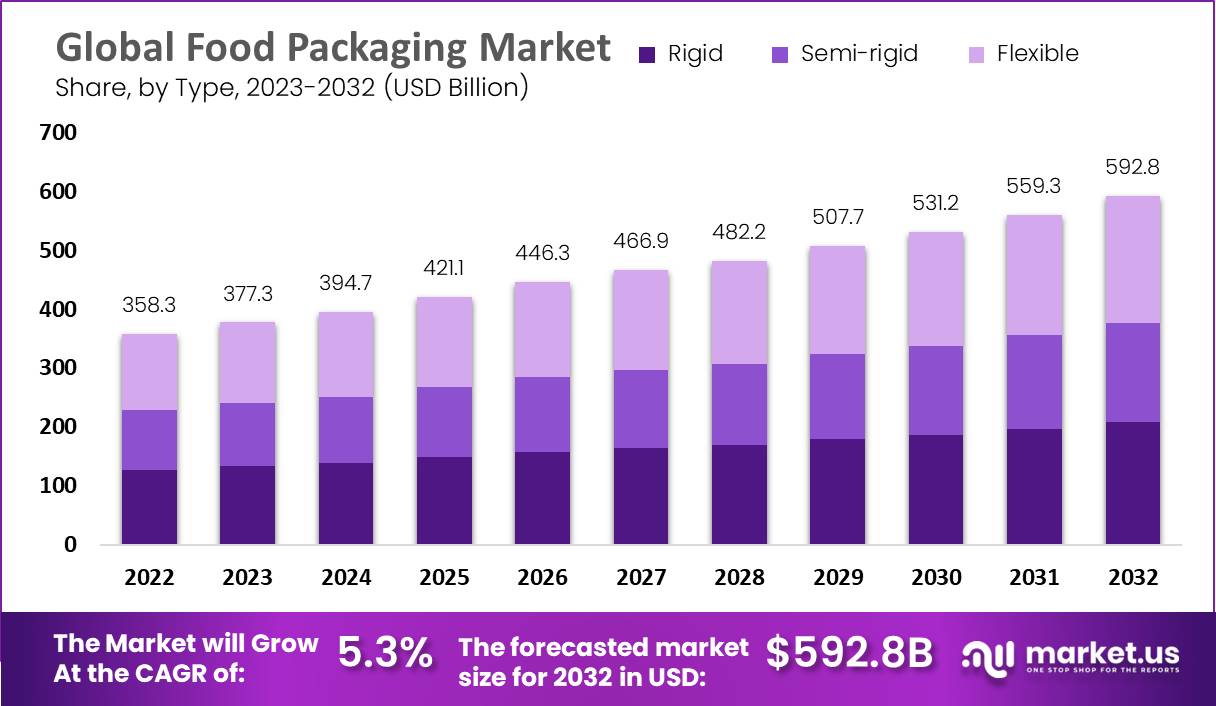
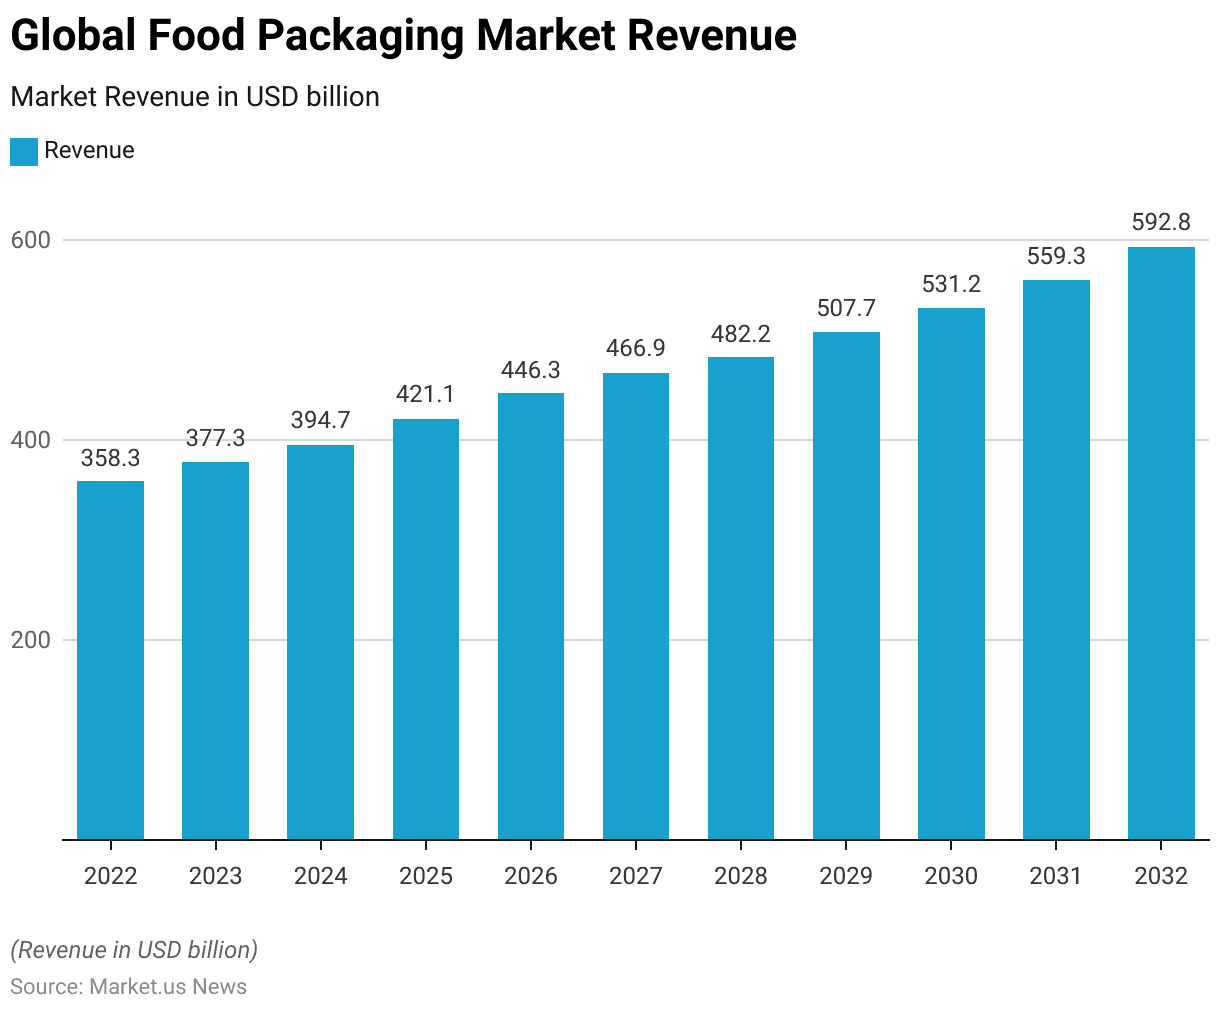
- The global food packaging market is projected to experience consistent growth over the coming years at a CAGR of 5.30%.
- Starting from a revenue of USD 358.3 billion in 2022, the market is expected to reach USD 377.3 billion by 2023.
- This upward trajectory continues, with the market anticipated to generate USD 394.7 billion in 2024 and further rising to USD 421.1 billion by 2025.
- By 2026, the market is expected to grow to USD 446.3 billion, and by 2027. It will likely reach USD 466.9 billion.
- The trend of steady growth is projected to persist, with the market estimated to reach USD 482.2 billion in 2028, USD 507.7 billion in 2029, and USD 531.2 billion by 2030.
- Looking further ahead, the market is expected to achieve revenues of USD 559.3 billion by 2031 and approximately USD 592.8 billion by 2032.
(Source: market.us)
Competitive Landscape of Global Food Packaging Market Statistics
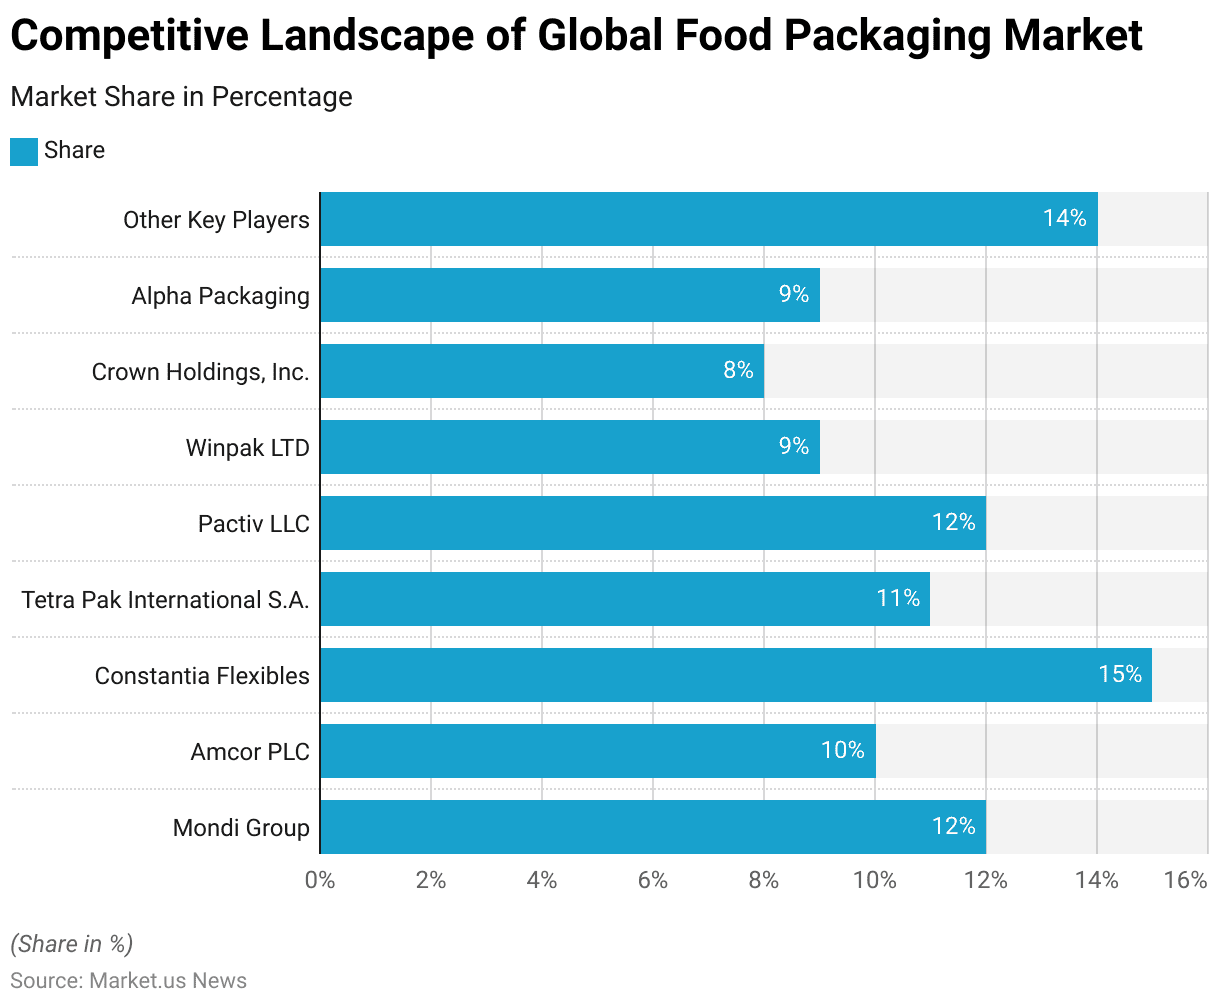
- The presence of several key players characterizes the global food packaging market, each holding a significant market share.
- Constantia Flexibles leads the market with a 15% share, followed by Mondi Group and Pactiv LLC, each holding a 12% share.
- Tetra Pak International S.A. commands an 11% share, while Amcor PLC holds 10% of the market.
- Both Winpak LTD and Alpha Packaging have a 9% share each, and Crown Holdings, Inc. holds an 8% share.
- Additionally, other key players collectively account for 14% of the market. Indicating a competitive landscape with a variety of influential companies.
(Source: market.us)
Regional Analysis of the Global Food Packaging Market Statistics
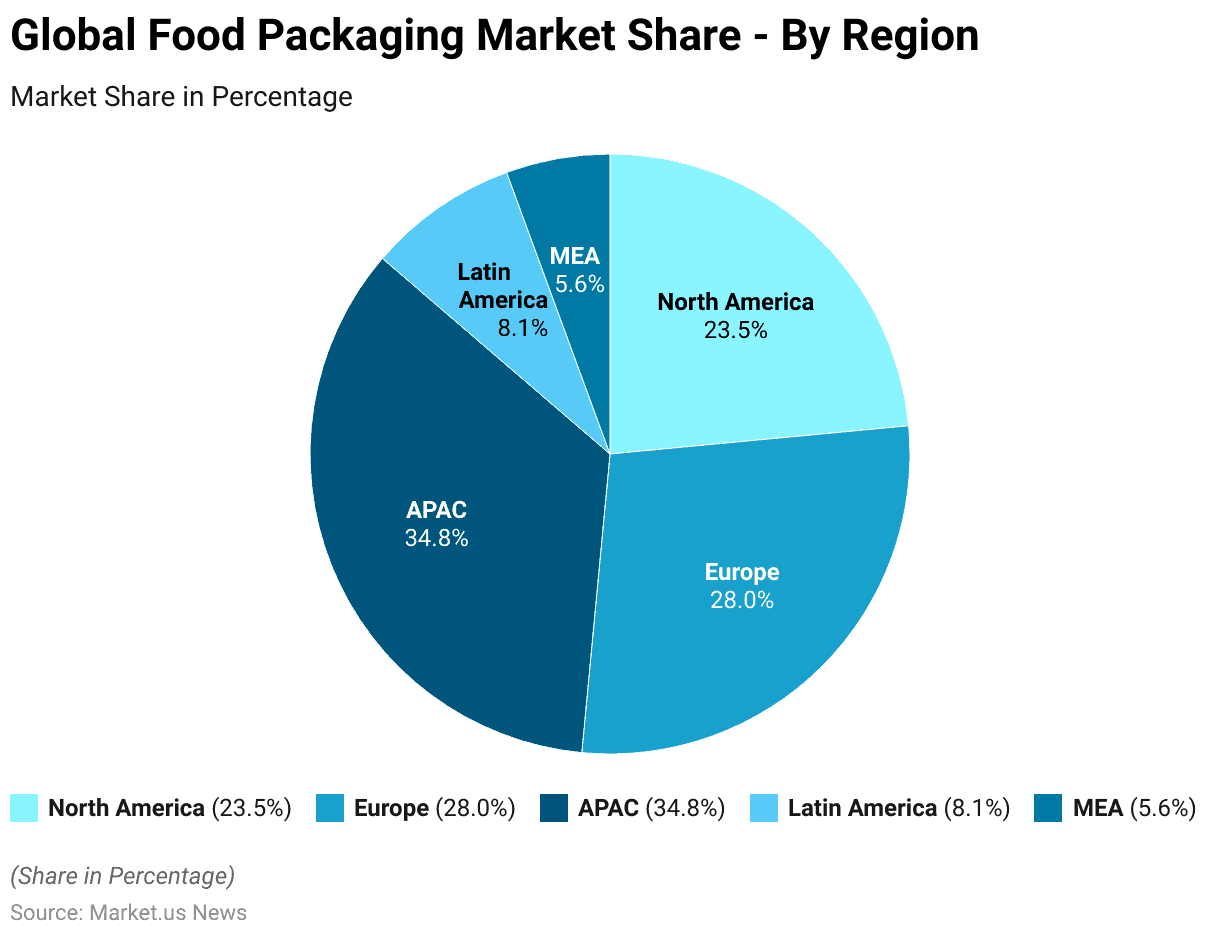
- The global food packaging market exhibits varying levels of market share across different regions.
- The Asia-Pacific (APAC) region leads the market, accounting for 34.8% of the total share.
- Europe follows with a significant 28.0% market share.
- North America also holds a considerable portion of the market, with a 23.5% share.
- Latin America contributes 8.1% to the global market. While the Middle East and Africa (MEA) region accounts for 5.6% of the total market share.
- This distribution highlights the dominance of the APAC region in the food packaging industry, followed closely by Europe and North America.
(Source: market.us)
Food Service Packaging Market Value Worldwide
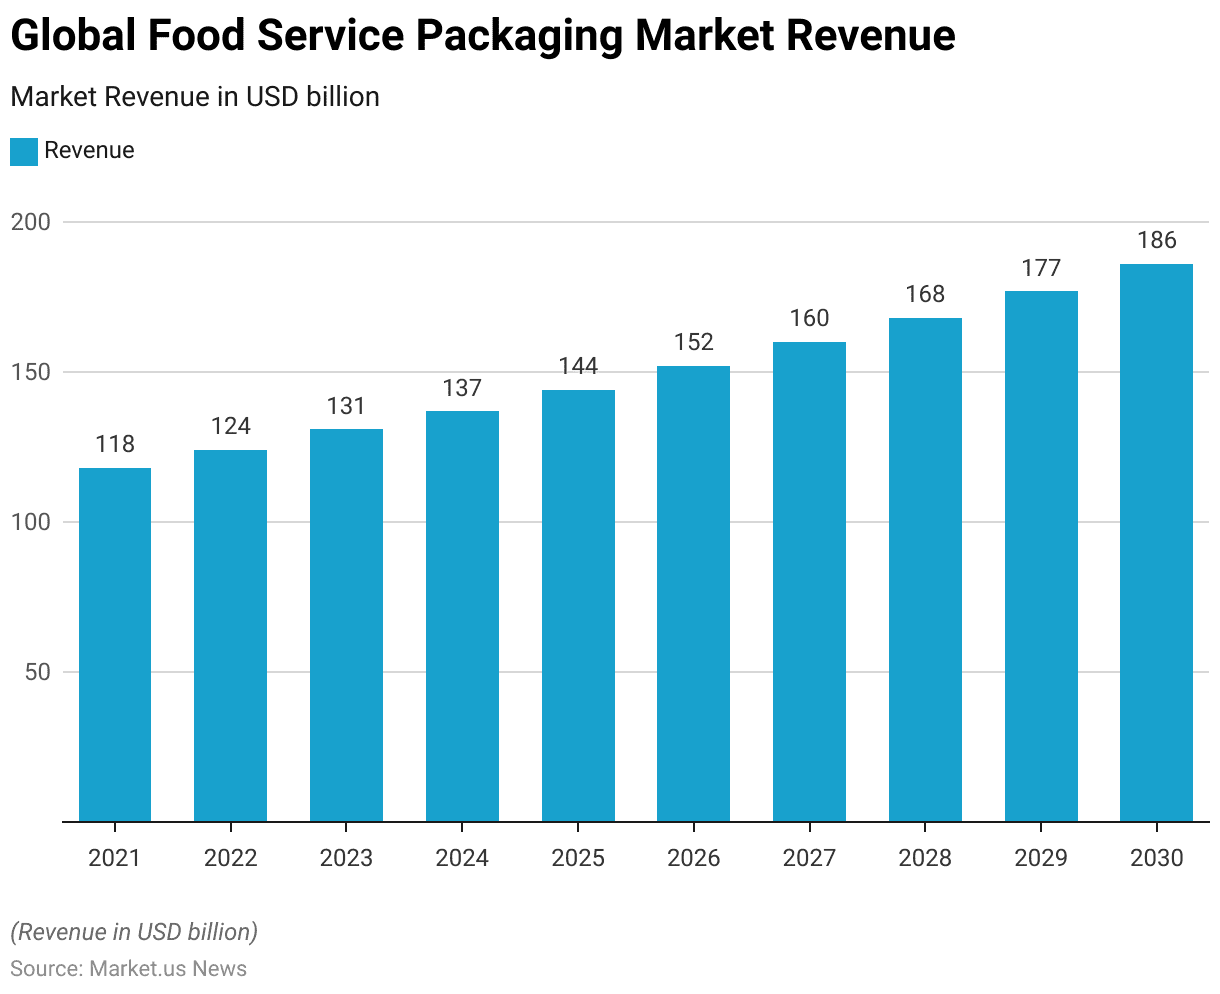
- The global food service packaging market has been experiencing steady growth and is projected to continue on this trajectory.
- In 2021, the market revenue was recorded at USD 118 billion.
- This figure increased to USD 124 billion in 2022 and is expected to rise further to USD 131 billion in 2023.
- The market is anticipated to reach USD 137 billion by 2024 and continue to grow. Reaching USD 144 billion in 2025 and USD 152 billion in 2026.
- The upward trend is expected to persist, with market revenues projected to reach USD 160 billion by 2027, USD 168 billion by 2028, and USD 177 billion by 2029.
- By 2030, the global food service packaging market is expected to achieve a revenue of USD 186 billion, underscoring the consistent expansion of this sector.
(Source: Statista)
Frozen Food Packaging Market Value Worldwide Statistics
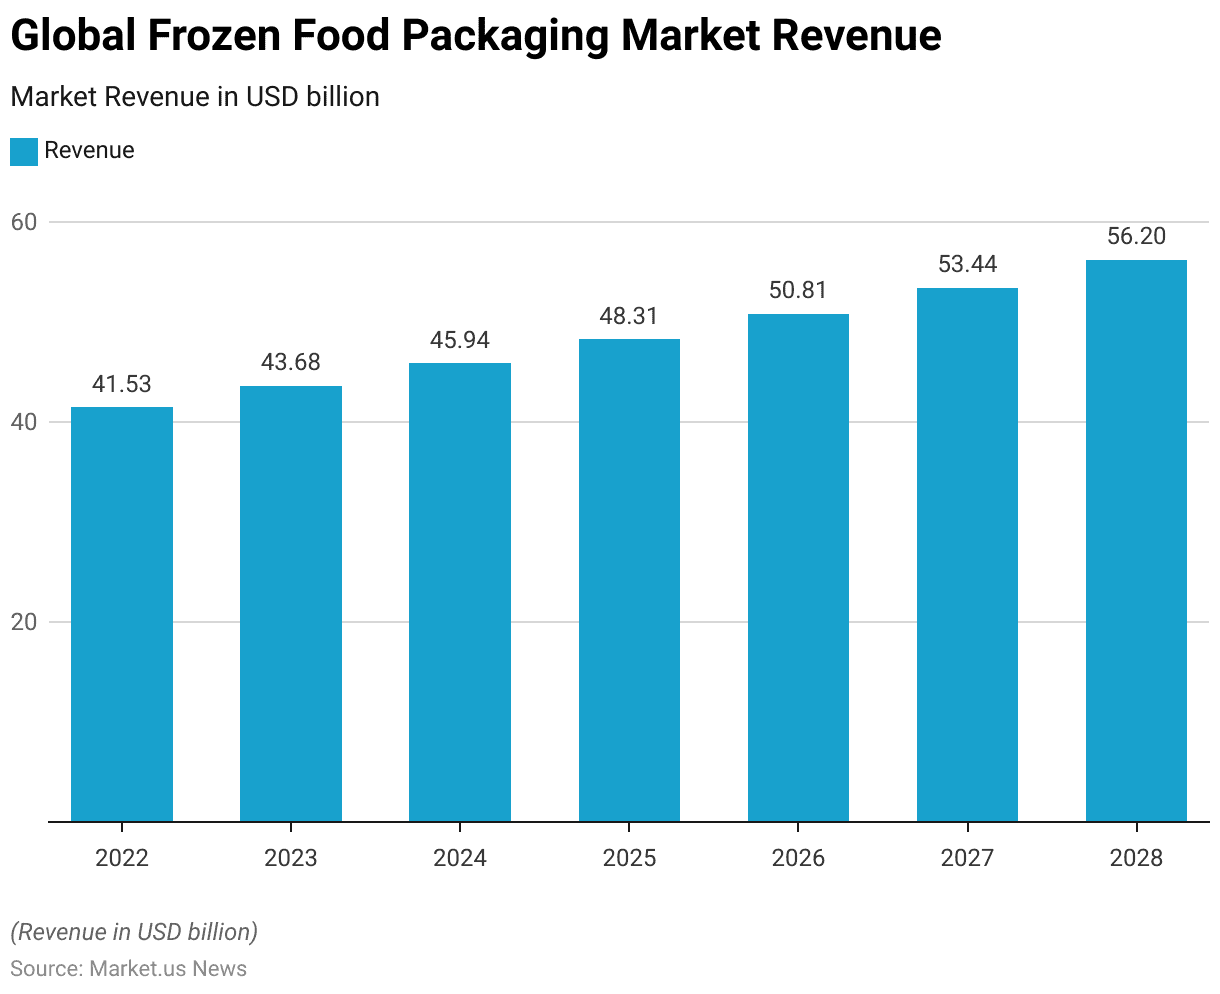
- The global frozen food packaging market is expected to witness steady growth over the coming years.
- In 2022, the market revenue was USD 41.53 billion.
- This figure is projected to increase to USD 43.68 billion in 2023 and further to USD 45.94 billion in 2024.
- The market is expected to continue expanding, reaching USD 48.31 billion by 2025.
- By 2026, the market revenue is anticipated to rise to USD 50.81 billion, followed by USD 53.44 billion in 2027.
- The growth trend is projected to continue into 2028, with the market expected to reach USD 56.2 billion.
- This consistent increase reflects the growing demand for frozen food packaging globally.
(Source: Statista)
Metallocene Polypropylene (mPP) Food Packaging Market Value Statistics
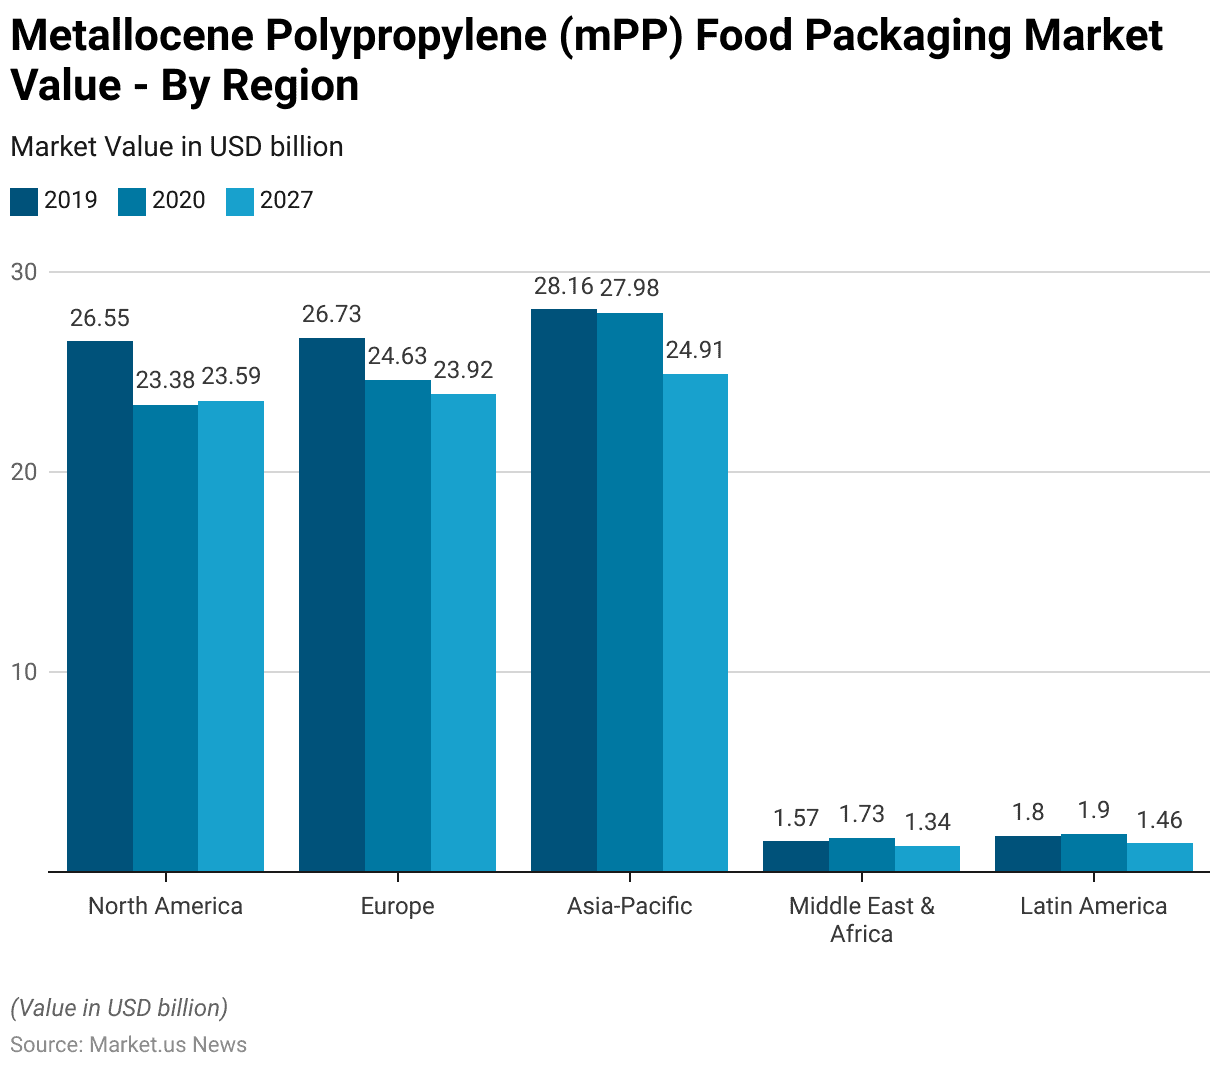
- The global market revenue for metallocene polypropylene (mPP) food packaging has shown regional variations from 2019 to 2027.
- In 2019, the Asia-Pacific region led the market with a revenue of $28.16 million. Followed by Europe at $26.73 million and North America at $26.55 million.
- The Middle East & Africa and Latin America regions had significantly lower revenues. With $1.57 million and $1.8 million, respectively.
- In 2020, a slight decline was observed across most regions, with the Asia-Pacific market generating $27.98 million, Europe $24.63 million, and North America $23.38 million.
- The Middle East & Africa saw a minor increase to $1.73 million. While Latin America’s revenue grew to $1.9 million.
- Looking ahead to 2027, the market is projected to continue declining in most regions. The Asia-Pacific region is expected to generate $24.91 million, maintaining its lead, although with a reduced margin.
- Europe and North America are projected to earn $23.92 million and $23.59 million, respectively.
- The Middle East & Africa and Latin America are anticipated to see further reductions. With revenues of $1.34 million and $1.46 million, respectively.
- This data highlights a trend of declining revenues for mPP food packaging across all regions, particularly in the Asia-Pacific, Europe, and North America. At the same time, the Middle East & Africa, and Latin America remain smaller markets with minor fluctuations.
(Source: Statista)
Food Storage Container Statistics
Usage of Disposable Food Storage Containers
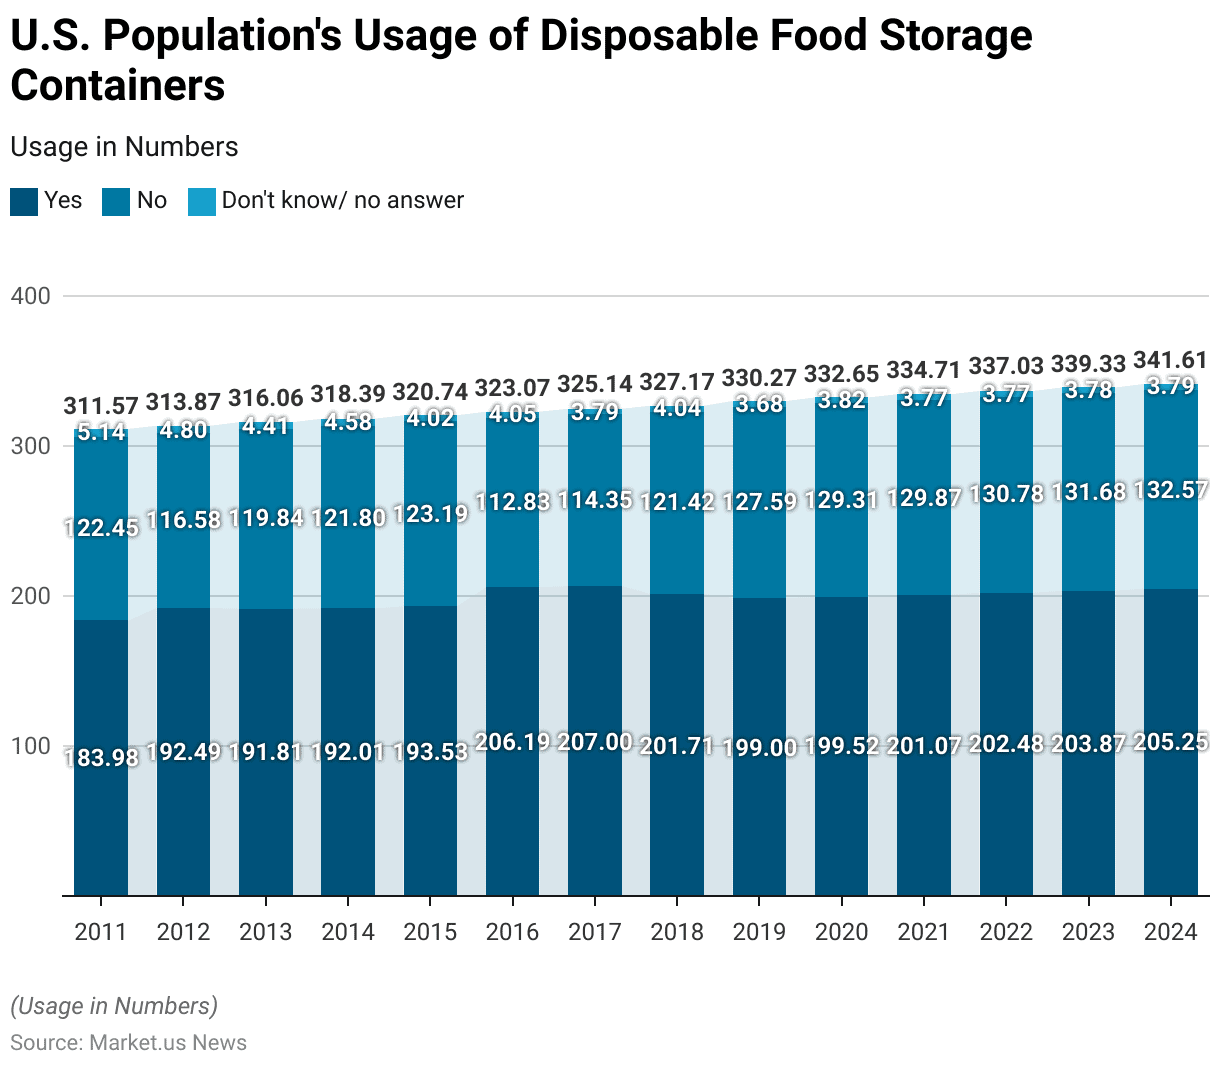
- The usage of disposable food storage containers among the U.S. population has exhibited fluctuating trends from 2011 to 2024.
- In 2011, approximately 183.98 million people reported using disposable food storage containers. While 122.45 million indicated they did not use them, and 5.14 million were uncertain or did not provide an answer.
- Over the years, the number of users steadily increased, reaching 192.49 million in 2012 and 191.81 million in 2013. A slight increase was observed in 2014, with 192.01 million users, followed by a continued rise to 193.53 million in 2015.
- Further, a significant jump occurred in 2016, with the number of users reaching 206.19 million. Moreover, this coincided with a notable decrease in the non-user group, which dropped to 112.83 million. This upward trend continued, with 207 million users in 2017.
- However, from 2018 to 2020, the number of users slightly decreased, with 201.71 million in 2018 and 199 million in 2019, though it rebounded to 199.52 million in 2020.
- From 2021 onwards, the number of users gradually increased again. Reaching 201.07 million in 2021 and continuing to rise to 202.48 million in 2022. The trend is expected to continue, with projections of 203.87 million users in 2023 and 205.25 million in 2024.
- Meanwhile, the number of non-users has gradually increased from 129.31 million in 2020 to 132.57 million in 2024. The group of respondents who were uncertain or provided no answer remained relatively stable. Fluctuating slightly between 3.68 million and 5.14 million throughout the years.
- These trends indicate a growing preference for disposable food storage containers among the U.S. population despite a small but stable segment of non-users and uncertain respondents.
(Source: Statista)
Preferred Brands of Food Storage Containers
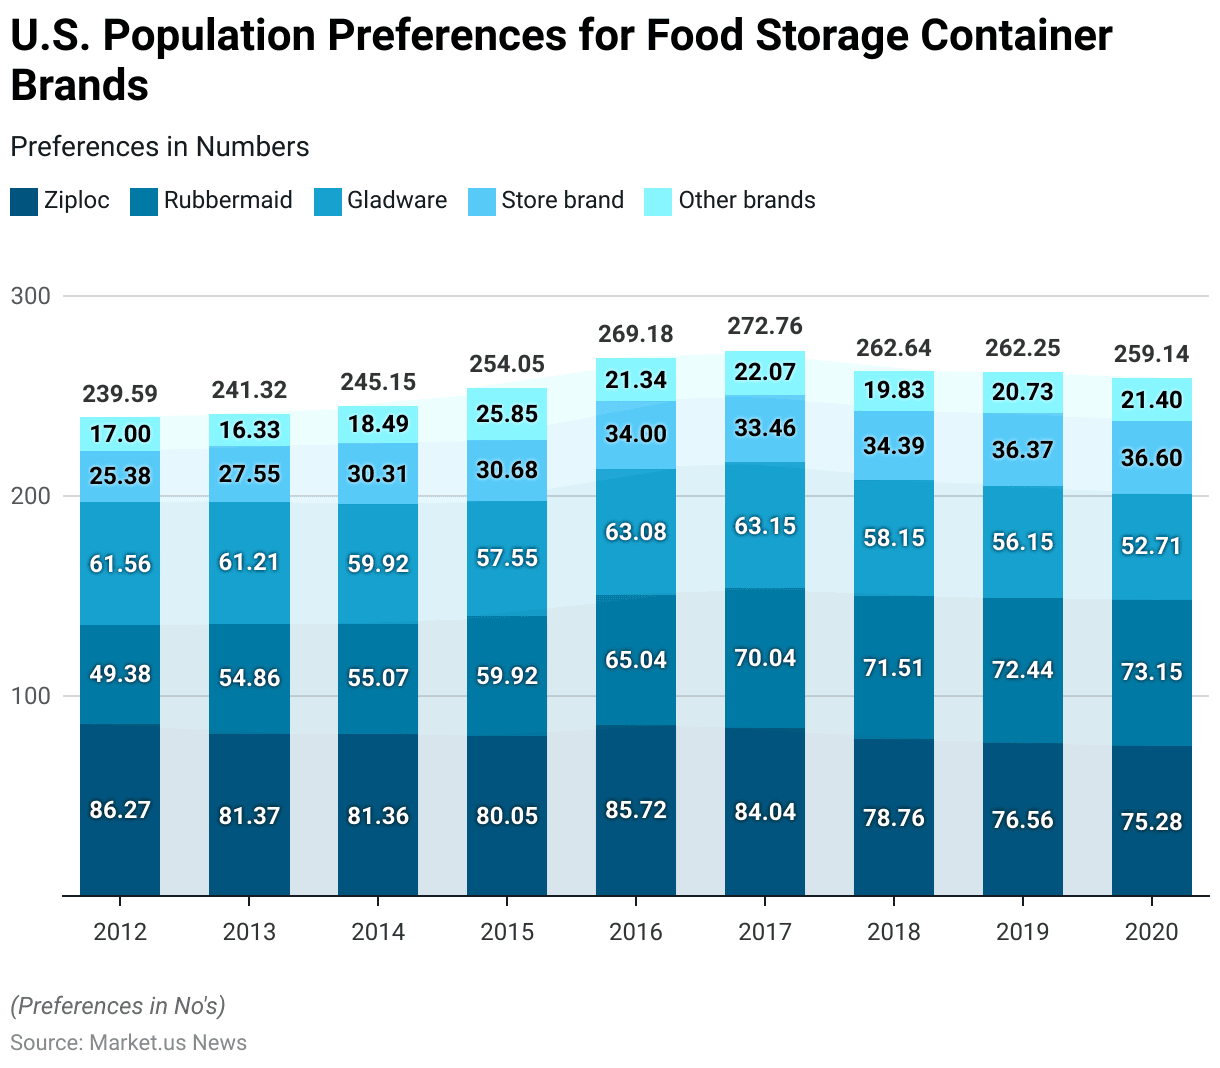
- From 2012 to 2020, the U.S. population exhibited distinct preferences for various brands of food storage containers, with notable fluctuations over the years.
- In 2012, Ziploc was the most preferred brand, with 86.27 million users. Followed by Gladware at 61.56 million and Rubbermaid at 49.38 million. Store brands and other brands were less popular, with 25.38 million and 17 million users, respectively.
- Over the years, Ziploc maintained its leadership position, though its user base decreased slightly, reaching 75.28 million in 2020.
- Rubbermaid saw a significant increase from 49.38 million users in 2012 to a peak of 73.15 million in 2020.
- Gladware’s user base fluctuated, peaking at 63.15 million in 2017 before decreasing to 52.71 million in 2020.
- Store brands showed a consistent, though smaller, user base, peaking at 36.6 million in 2020.
- The “Other brands” category experienced varying levels of popularity. The highest number of users was recorded at 25.85 million in 2015 before declining to 21.4 million in 2020.
- This data reflects the U.S. population’s consistent preference for major brands like Ziploc, Rubbermaid, and Gladware. In contrast, store brands and other brands have captured a smaller, yet significant, portion of the market.
(Source: Statista)
Most Popular Materials for Food Containers
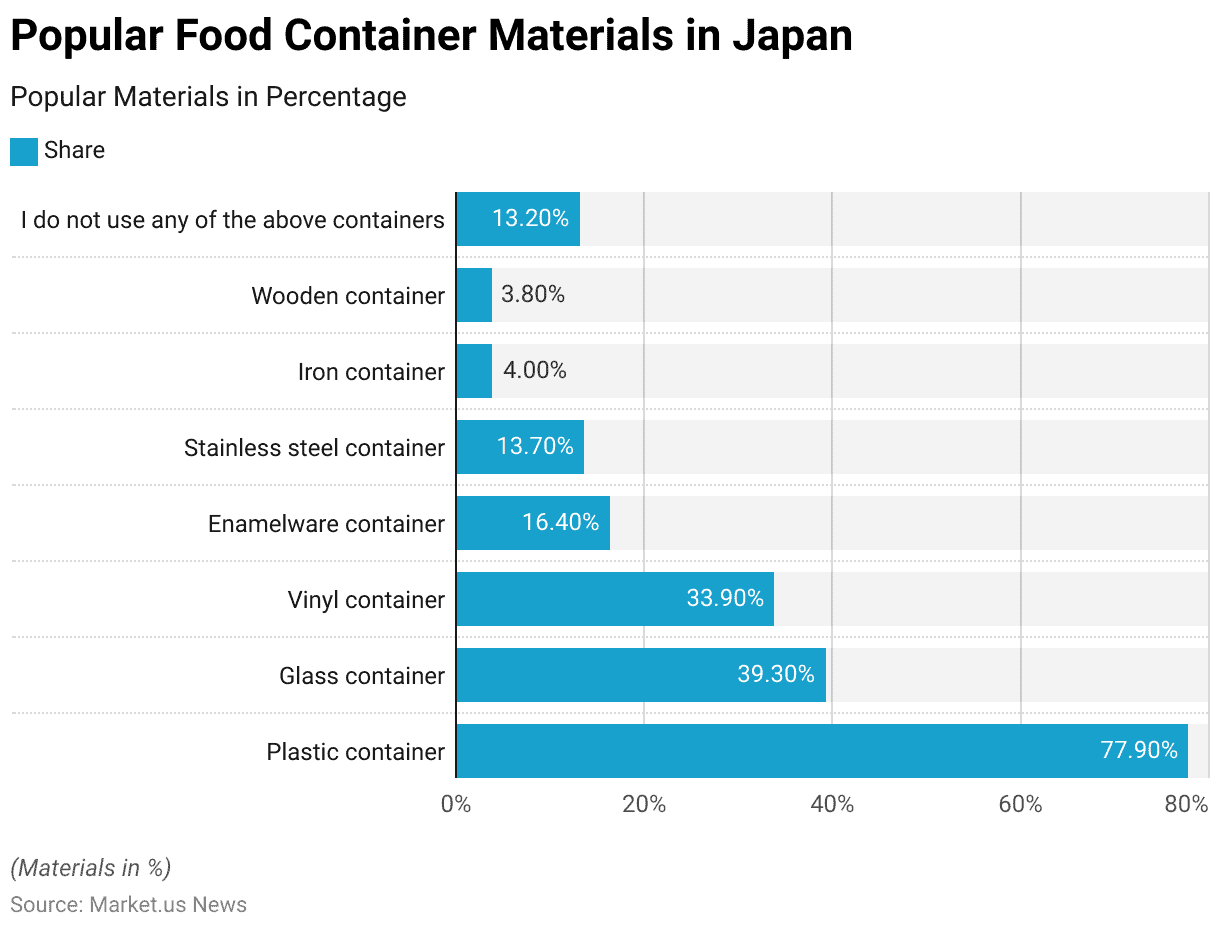
- As of February 2024, plastic containers emerged as the most popular choice for food storage in Japan, with 77.9% of respondents indicating their preference for this material.
- Glass containers also held a significant share, used by 39.3% of the population. While vinyl containers were chosen by 33.9% of respondents.
- Enamelware containers were used by 16.4% of the respondents, and stainless steel containers by 13.7%, highlighting their niche appeal.
- Less commonly used materials included iron containers, which were preferred by 4% of respondents, and wooden containers, used by 3.8% of the population.
- Notably, 13.2% of respondents indicated that they do not use any of the listed container materials. Suggesting a minority that either uses alternative materials or opts out of using containers altogether.
- This data underscores the dominance of plastic containers in the Japanese market. Glass and vinyl also play substantial roles in food storage preferences.
(Source: Statista)
Important Factors When Buying Food Containers
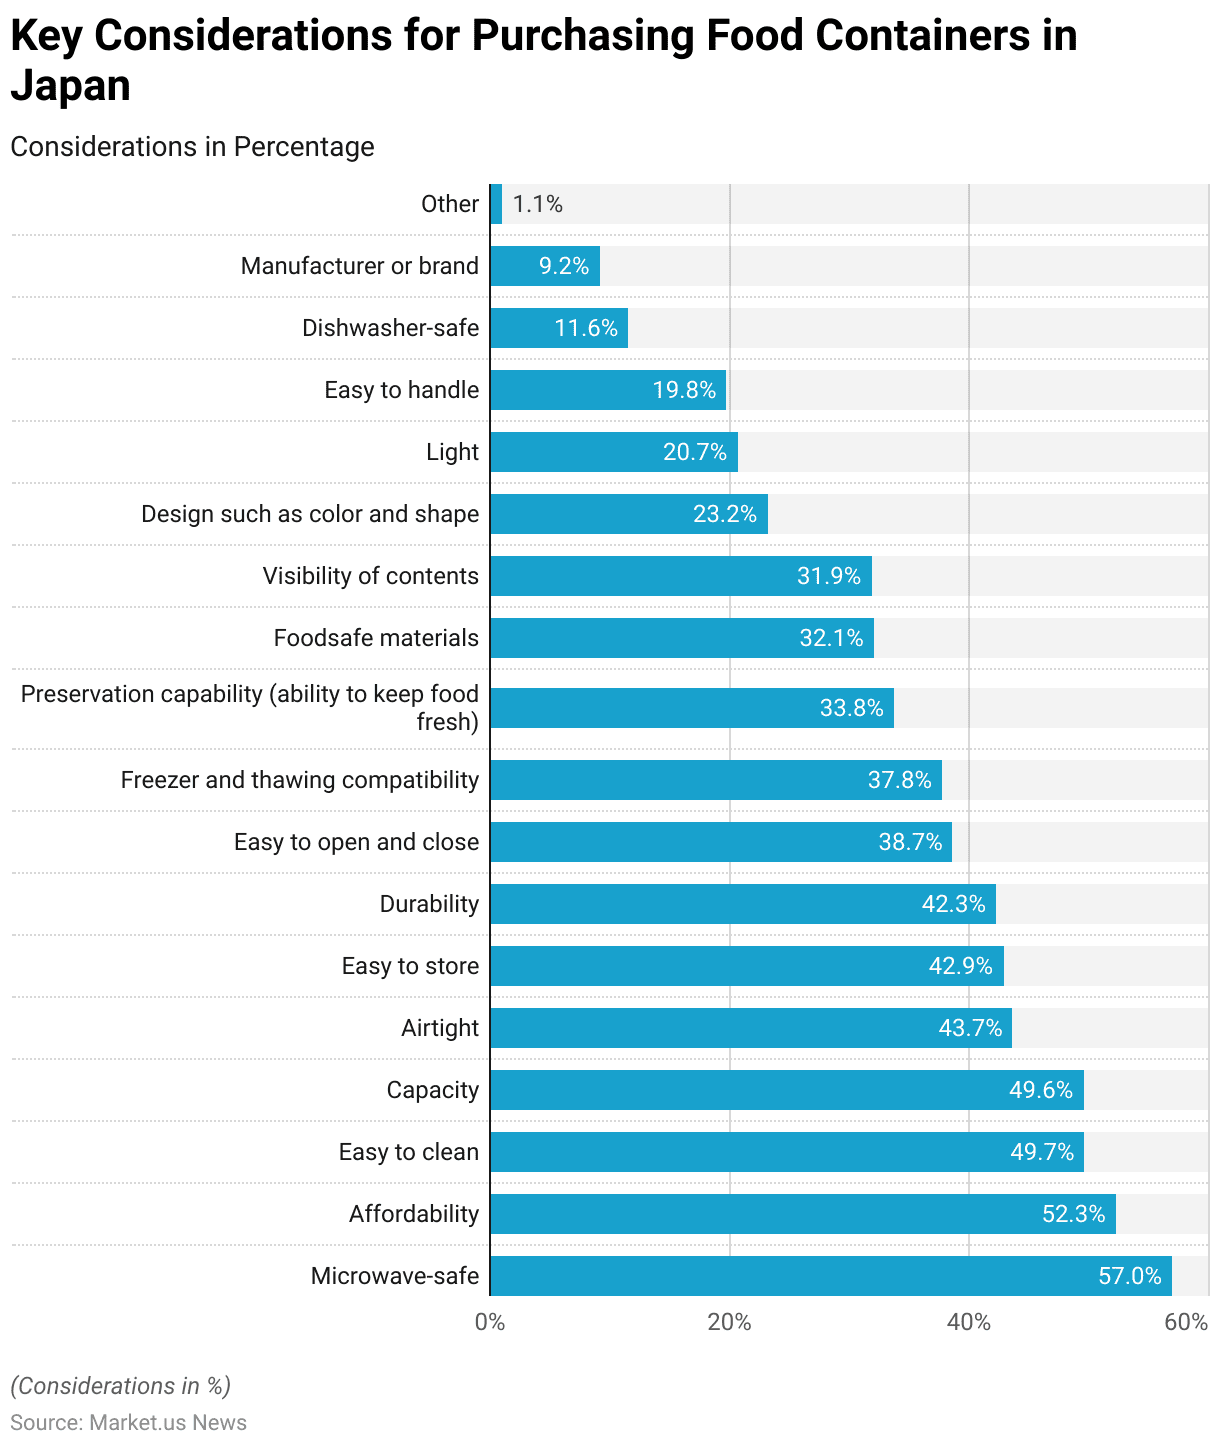
- As of February 2024, Japanese consumers prioritize several key factors when purchasing food containers.
- The most important consideration is that the container is microwave-safe, with 57% of respondents emphasizing this feature.
- Affordability follows closely, valued by 52.3% of consumers. While ease of cleaning and capacity are important to 49.7% and 49.6% of respondents, respectively. Airtightness is also a significant factor, with 43.7% of respondents considering it crucial.
- Additional factors include ease of storage (42.9%), durability (42.3%), and ease of opening and closing (38.7%). Freezer and thawing compatibility is important to 37.8% of consumers, while 33.8% prioritize the container’s ability to preserve food freshness.
- The use of food-safe materials is significant to 32.1% of respondents, and the visibility of contents within the container matters to 31.9%.
- Design aspects such as color and shape influence the purchasing decisions of 23.2% of consumers while being lightweight is a priority for 20.7%. Other considerations include ease of handling (19.8%), dishwasher safety (11.6%), and the manufacturer or brand (9.2%).
- Only 1.1% of respondents mentioned other factors, indicating a high level of consistency in consumer priorities.
- This data highlights the diverse range of features that Japanese consumers consider important when selecting food containers, with a strong emphasis on practicality and safety.
(Source: Statista)
Main Shopping Channels for Food Containers
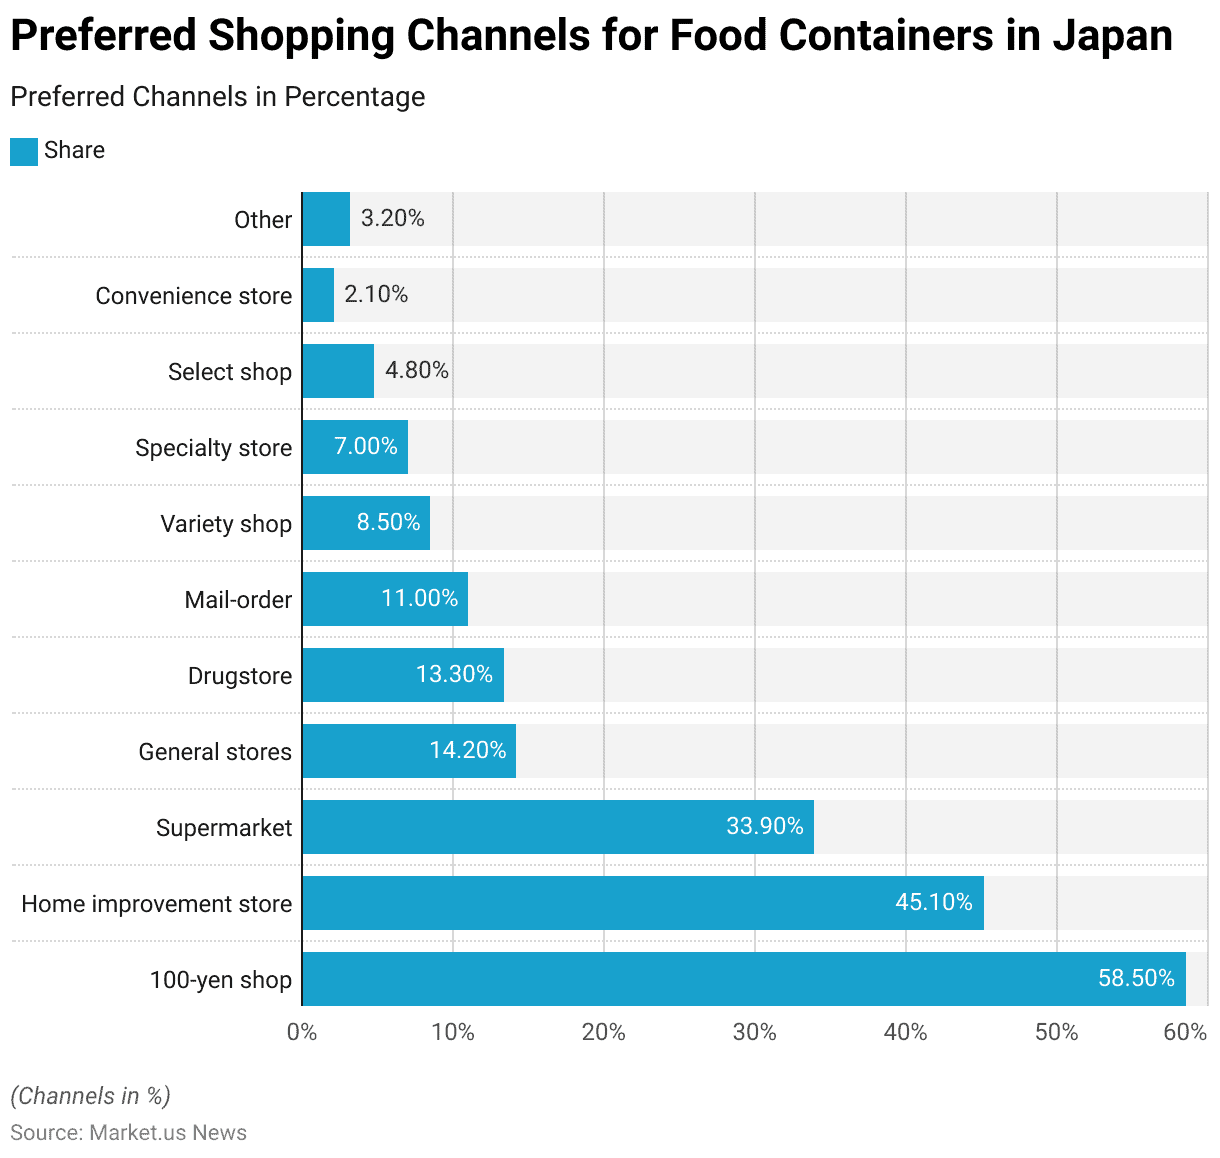
- As of February 2024, Japanese consumers show a clear preference for purchasing food containers from specific shopping channels.
- The most popular option is the 100-yen shop, utilized by 58.5% of respondents. Making it the leading shopping channel for this product category.
- Home improvement stores are also highly favored, with 45.1% of consumers purchasing food containers from these outlets. Supermarkets follow with a 33.9% share of respondents shopping for food containers there.
- Other notable channels include general stores, preferred by 14.2% of respondents, and drugstores, which attract 13.3% of consumers for their food container needs.
- Mail-order services account for 11.0% of the market, highlighting the growing trend of online shopping. Variety shops are used by 8.5% of respondents, while specialty stores are the choice for 7.0% of consumers.
- Select shops have a smaller share, with 4.8% of respondents purchasing food containers from these locations, and convenience stores are the least favored, used by only 2.1% of respondents. Additionally, 3.2% of respondents indicated other shopping channels as their preferred option.
- These findings illustrate the dominance of affordable and accessible shopping channels, such as 100-yen shops and home improvement stores, in the Japanese market for food containers.
(Source: Statista)
Food Packaging Material Statistics
Global Food Packaging Material Market Value – By Region Statistics
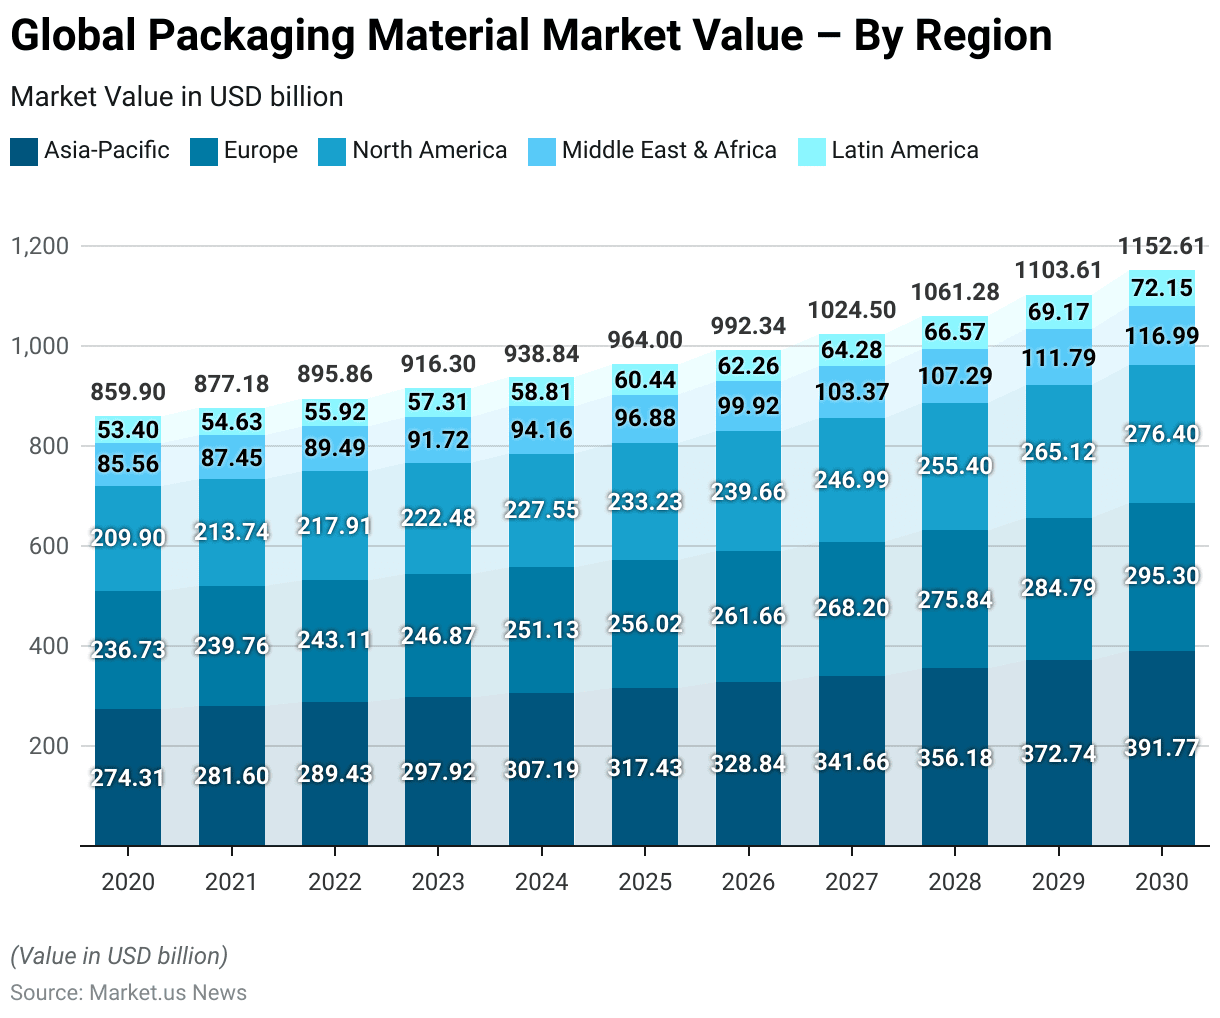
- The global market value of packaging materials has demonstrated steady growth across all regions from 2020, with projections extending through 2030.
- In 2020, the Asia-Pacific region led the market with a value of $274.31 billion. Followed by Europe at $236.73 billion and North America at $209.9 billion. The Middle East & Africa and Latin America were smaller markets, valued at $85.56 billion and $53.4 billion, respectively.
- By 2021, the market values had increased across all regions, with Asia-Pacific rising to $281.6 billion. Europe to $239.76 billion, and North America to $213.74 billion. The Middle East & Africa grew to $87.45 billion, while Latin America reached $54.63 billion.
- This upward trend continued in 2022, with the Asia-Pacific market reaching $289.43 billion, and Europe at $243.11 billion. North America at $217.91 billion, the Middle East & Africa at $89.49 billion, and Latin America at $55.92 billion.
- Looking ahead, the market is forecasted to continue growing through 2030. By 2023, the Asia-Pacific region is expected to reach $297.92 billion, Europe $246.87 billion, and North America $222.48 billion. The Middle East & Africa and Latin America are projected to grow to $91.72 billion and $57.31 billion, respectively.
More Insights
- By 2025, the Asia-Pacific market is forecasted to reach $317.43 billion. With Europe at $256.02 billion and North America at $233.23 billion. The Middle East & Africa and Latin America are expected to grow to $96.88 billion and $60.44 billion, respectively.
- Further growth is anticipated, with the Asia-Pacific market reaching $341.66 billion by 2027. Europe at $268.2 billion, and North America at $246.99 billion. The Middle East & Africa and Latin America are projected to grow to $103.37 billion and $64.28 billion, respectively.
- By 2030, the Asia-Pacific region is expected to dominate the market with a value of $391.77 billion, followed by Europe at $295.3 billion and North America at $276.4 billion. The Middle East & Africa and Latin America are expected to reach $116.99 billion and $72.15 billion, respectively.
- This data underscores the sustained expansion of the packaging materials market globally, with significant contributions from all regions, particularly Asia-Pacific, Europe, and North America, which are projected to remain the largest markets through 2030.
(Source: Statista)
Distribution of Food Packaging Demand Worldwide Statistics
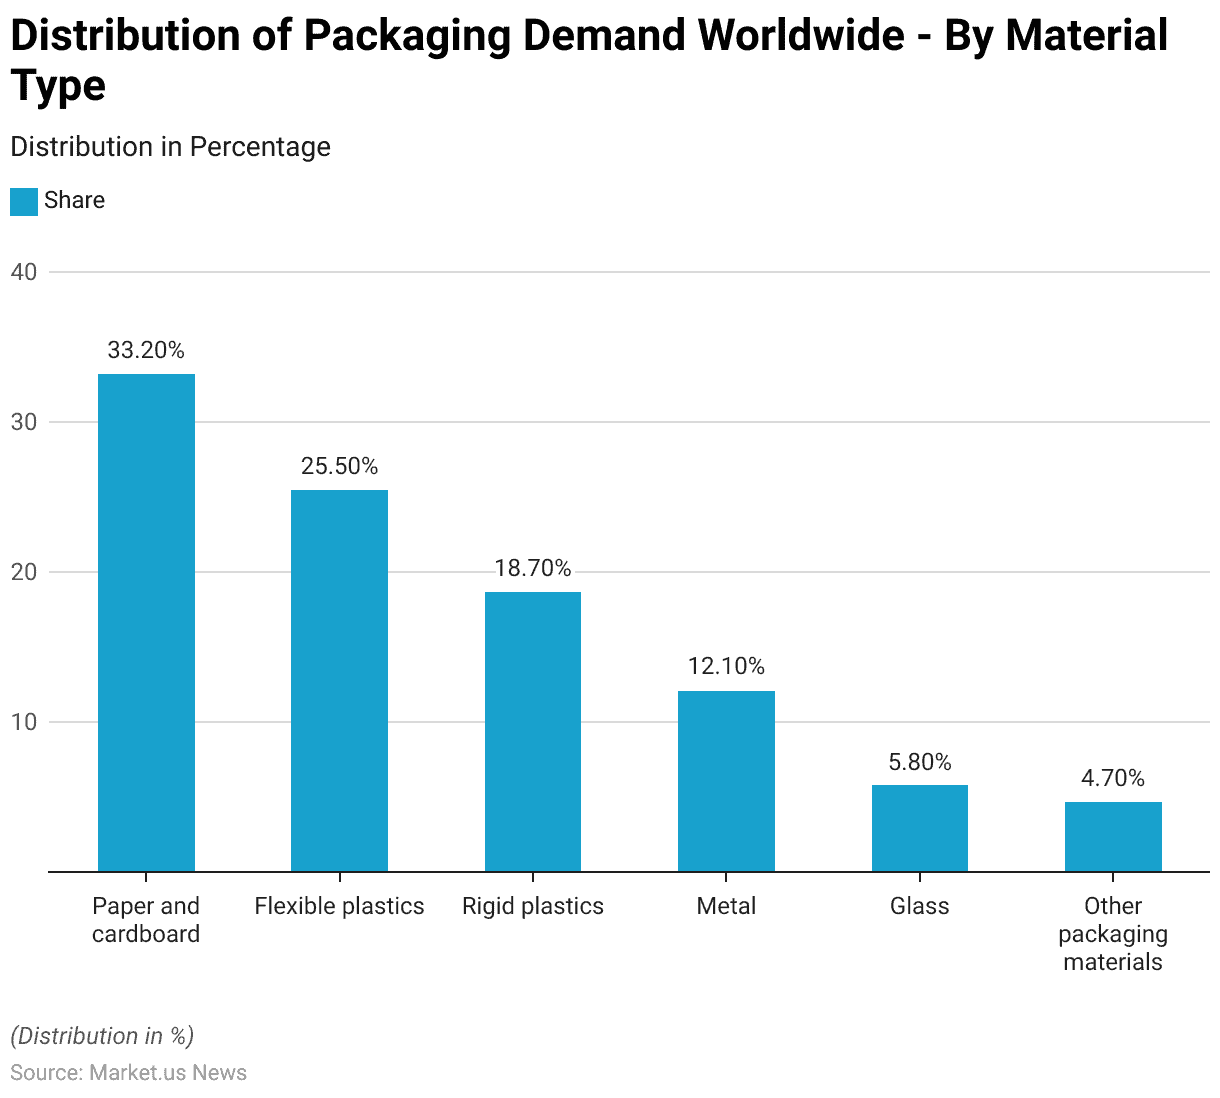
- In 2019, the global demand for packaging materials was dominated by paper and cardboard, which accounted for 33.2% of the market share.
- Flexible plastics followed, making up 25.5% of the demand, reflecting their widespread use in various packaging applications.
- Rigid plastics also held a significant portion of the market, contributing 18.7% to the global demand.
- Metal packaging materials comprised 12.1% of the market, while glass accounted for 5.8%.
- Other packaging materials made up the remaining 4.7% of the global demand.
- This distribution highlights the prominence of paper, cardboard, and plastics in the packaging industry, driven by their versatility and broad application across different sectors.
(Source: Statista)
Global Plastic Film Food Packaging Market Size Statistics
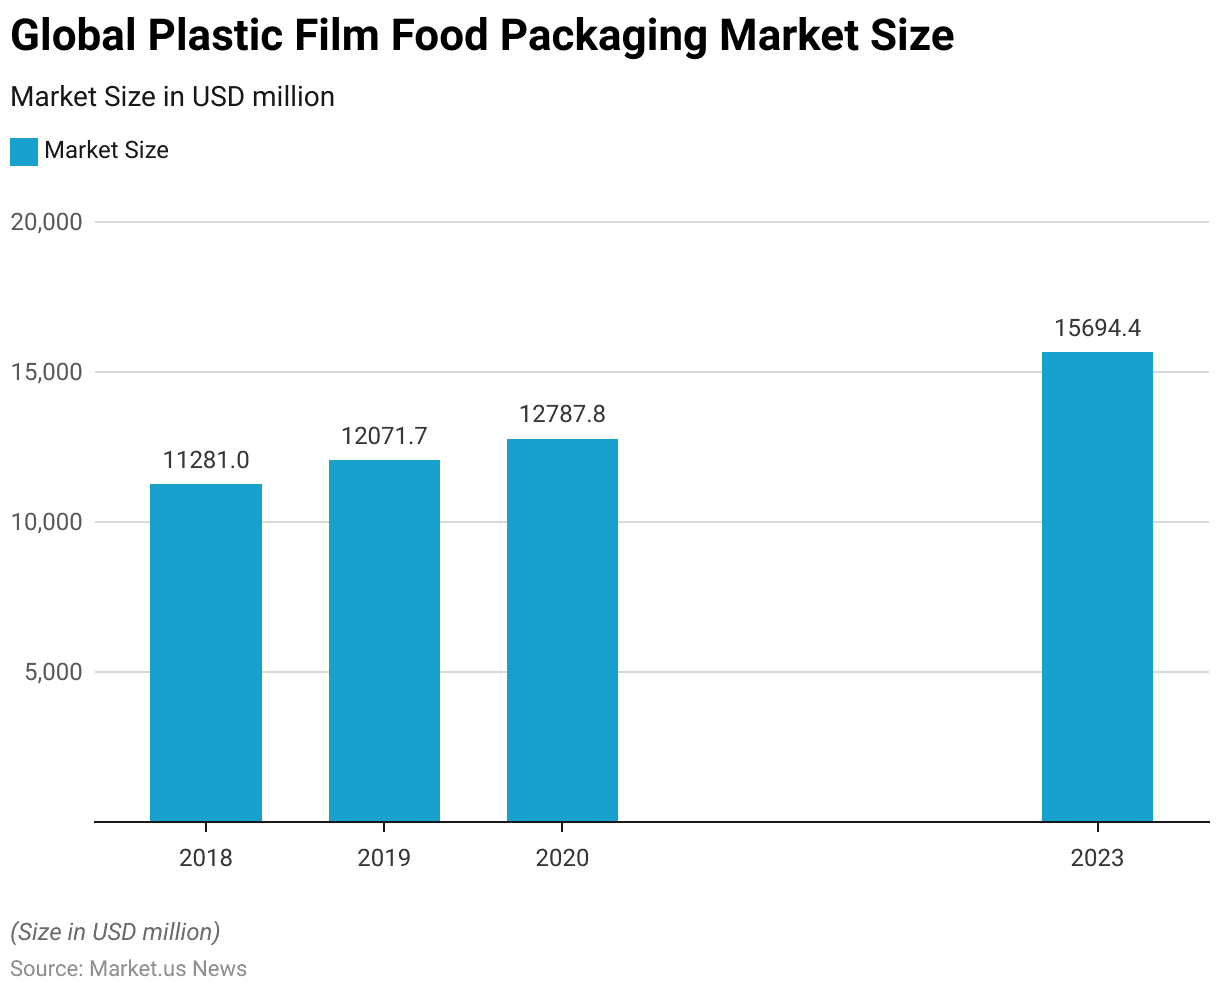
- The global plastic film food packaging market has experienced significant growth between 2018 and 2023.
- In 2018, the market size was valued at USD 11,281.0 million.
- This figure increased to USD 12,071.7 million in 2019 and continued to rise in 2020, reaching USD 12,787.8 million.
- By 2023, the market saw substantial growth, with the size expanding to USD 15,694.4 million.
- This upward trend underscores the increasing demand for plastic film packaging in the food industry, driven by factors such as convenience, preservation needs, and the growing global food supply chain.
(Source: Statista)
Growth in Food & Beverage Products with Paper Packaging Globally Statistics
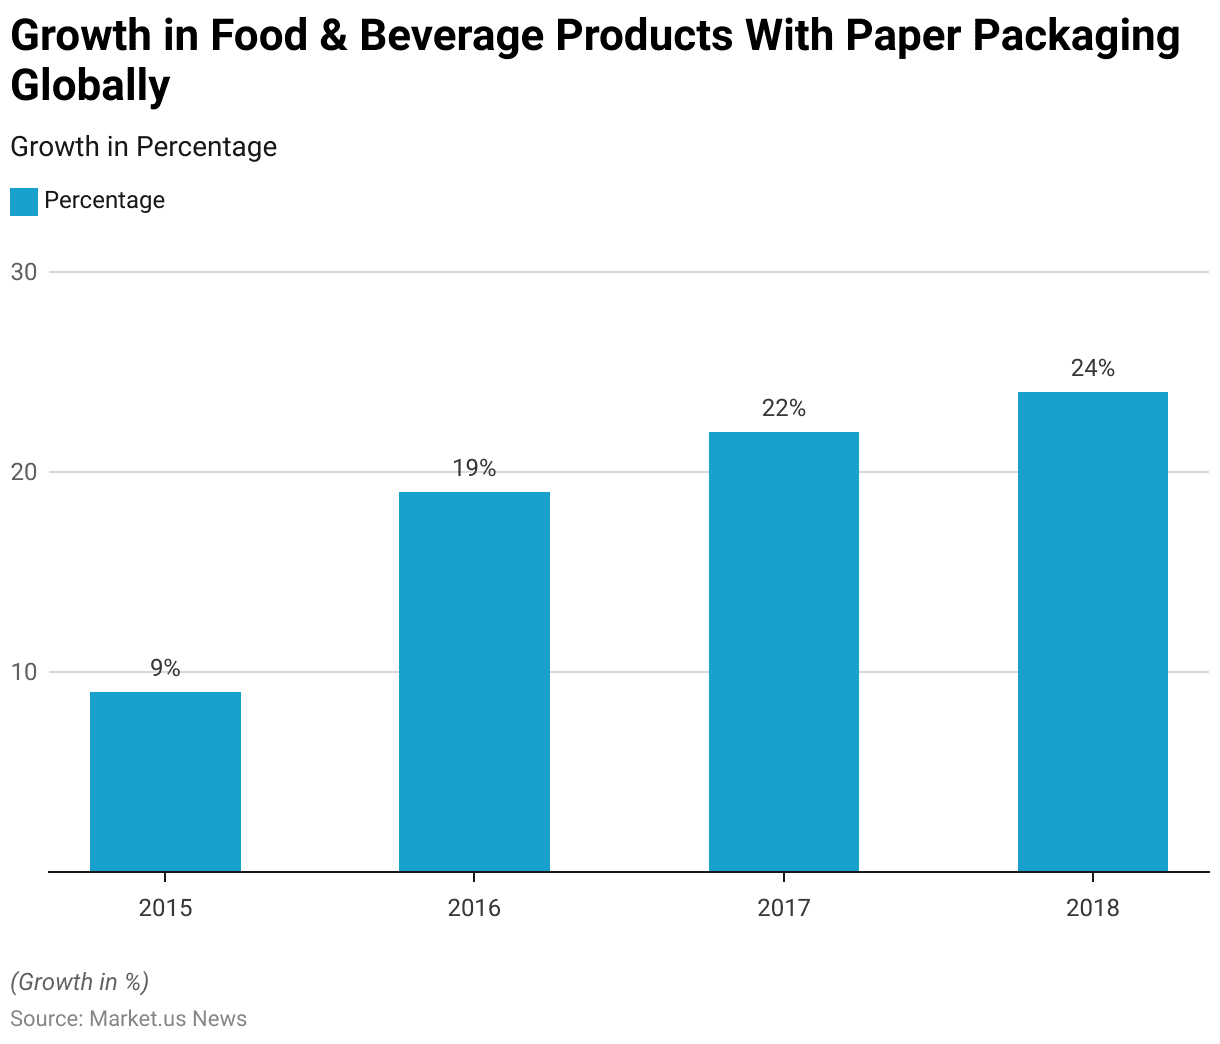
- Between 2015 and 2018, there was a significant increase in the global number of food and beverage product launches featuring paper packaging.
- In 2015, the growth rate for such product launches was recorded at 9%.
- This rate more than doubled in 2016, reaching 19%.
- The upward trend continued in the following years, with a 22% growth rate in 2017 and further increasing to 24% in 2018.
- This steady rise reflects the growing preference for sustainable packaging solutions in the food and beverage industry, driven by increasing consumer awareness and demand for environmentally friendly products.
(Source: Statista)
Global Market Share of Antimicrobial Food Packaging Statistics
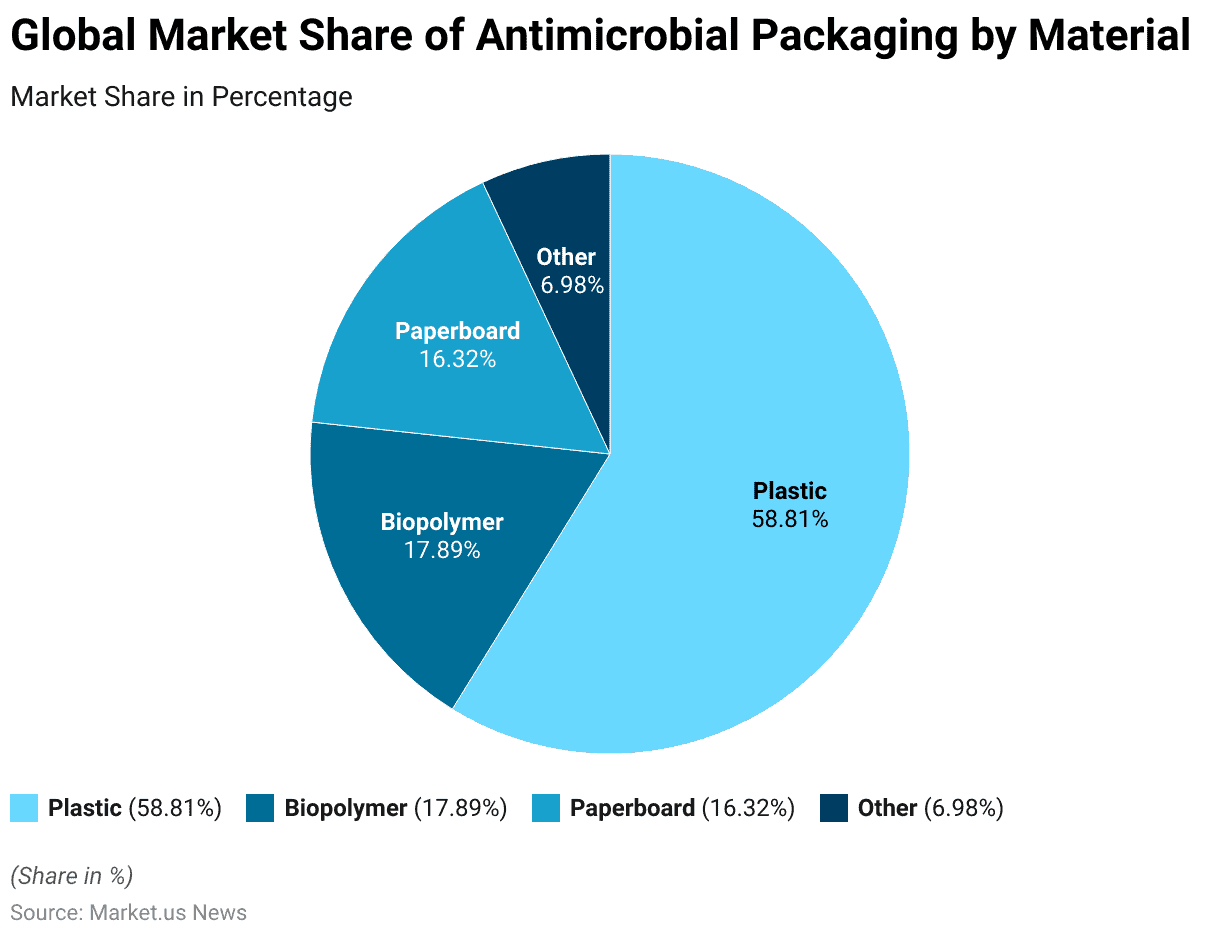
- In 2015, plastic was the dominant material used in antimicrobial packaging worldwide, accounting for 58.81% of the market share.
- Biopolymers, known for their environmentally friendly properties, held the second-largest share at 17.89%.
- Paperboard, another sustainable option, represented 16.32% of the market.
- The remaining 6.98% of the market was comprised of other materials.
- This distribution highlights the prevalence of plastic in antimicrobial packaging during that period despite growing interest in more sustainable alternatives like biopolymers and paperboard.
(Source: Statista)
Production of Food Packaging Material Statistics
Plastic Material Production – By Region
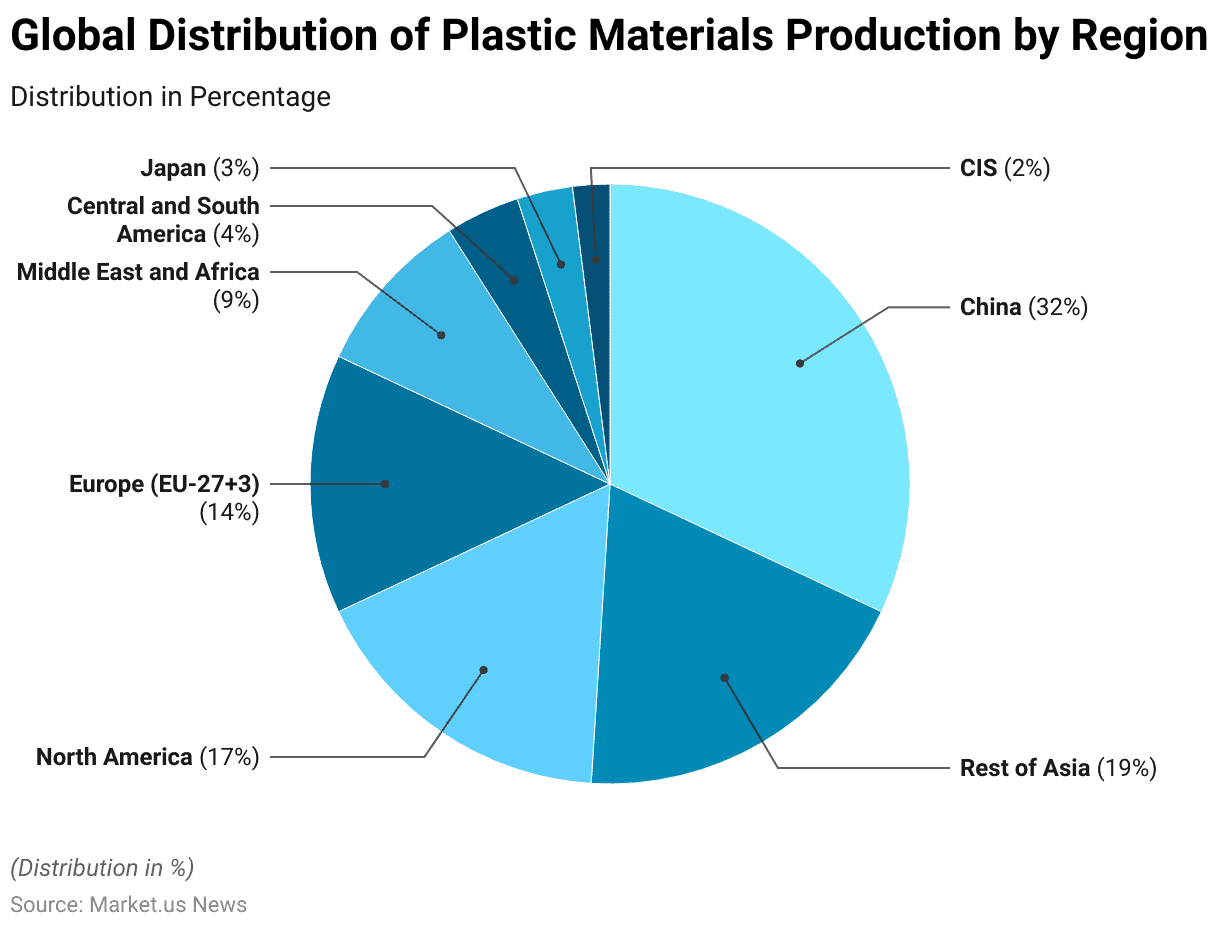
- In 2022, the global production of plastic materials was heavily concentrated in specific regions, with China leading the market, accounting for 32% of the total production.
- The rest of Asia contributed 19% to global production, highlighting the region’s significant role in the industry.
- North America followed, producing 17% of the world’s plastic materials, while Europe (including the EU-27+3) accounted for 14%.
- The Middle East and Africa together contributed 9% of the production, with Central and South America adding 4%.
- Japan’s share stood at 3%, and the Commonwealth of Independent States (CIS) region contributed 2% to global plastic materials production.
- This distribution underscores the dominant role of Asia, particularly China, in the global plastics industry.
(Source: Statista)
Production of Paperboard and Packaging Paper – By Country
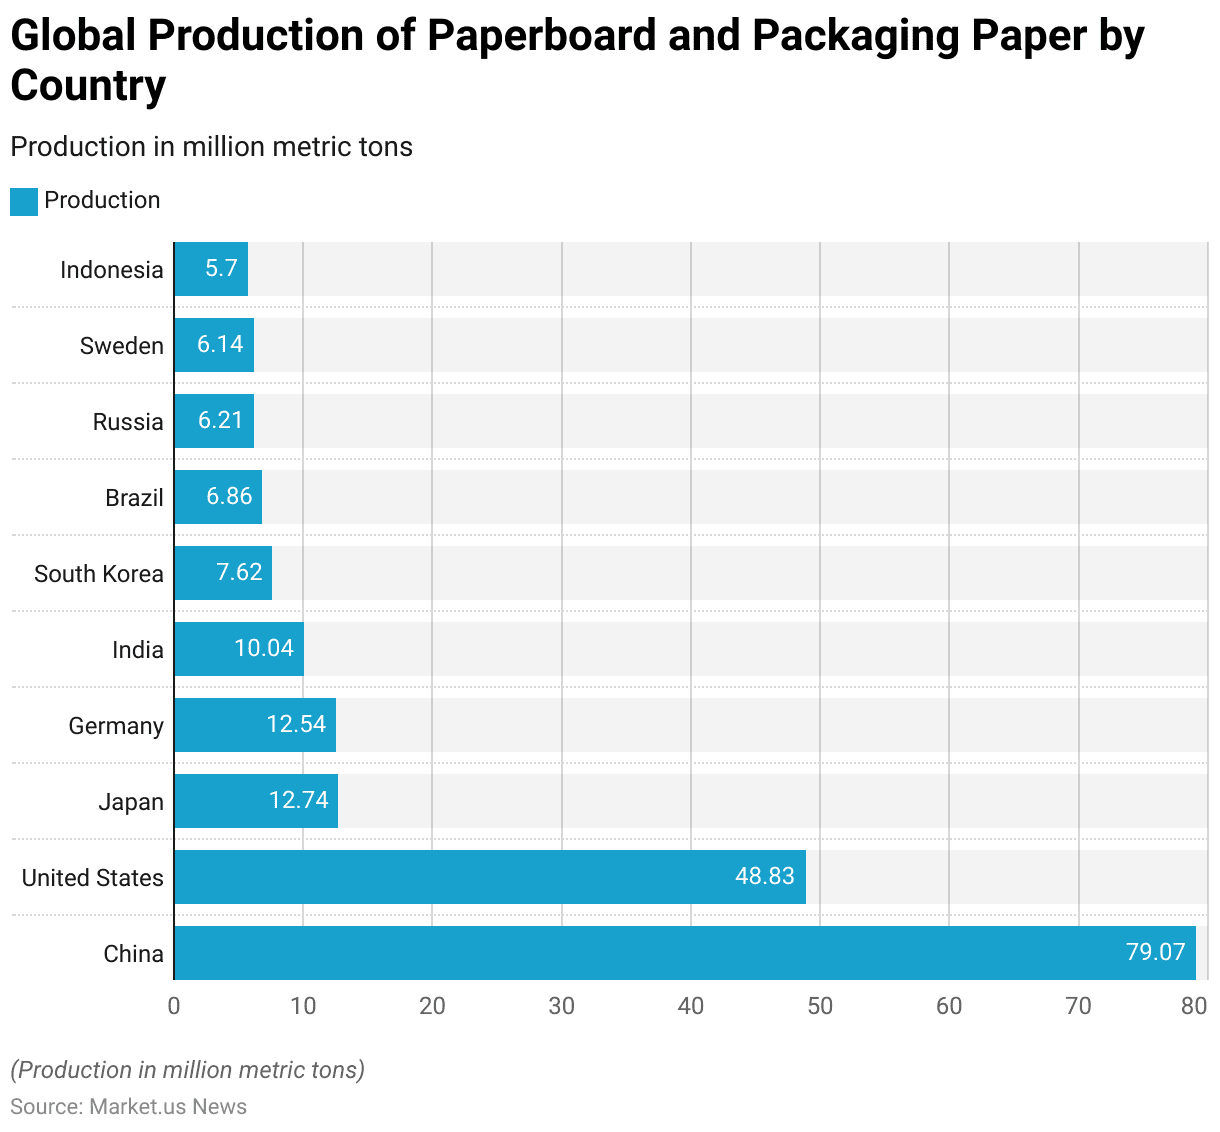
- In 2022, China led the global production of paperboard and packaging paper, producing 79.07 million metric tons, the highest volume among all countries.
- The United States followed as the second-largest producer, with 48.83 million metric tons.
- Japan and Germany were nearly on par, producing 12.74 million metric tons and 12.54 million metric tons, respectively.
- India contributed 10.04 million metric tons to global production, while South Korea produced 7.62 million metric tons.
- Other notable producers included Brazil with 6.86 million metric tons, Russia with 6.21 million metric tons, and Sweden with 6.14 million metric tons.
- Indonesia also played a significant role, producing 5.7 million metric tons of paperboard and packaging paper.
- These figures highlight the significant contributions of these countries to the global paperboard and packaging paper industry, with China and the United States being the dominant producers.
(Source: Statista)
Global Production Volume of Glass Containers and Bottles
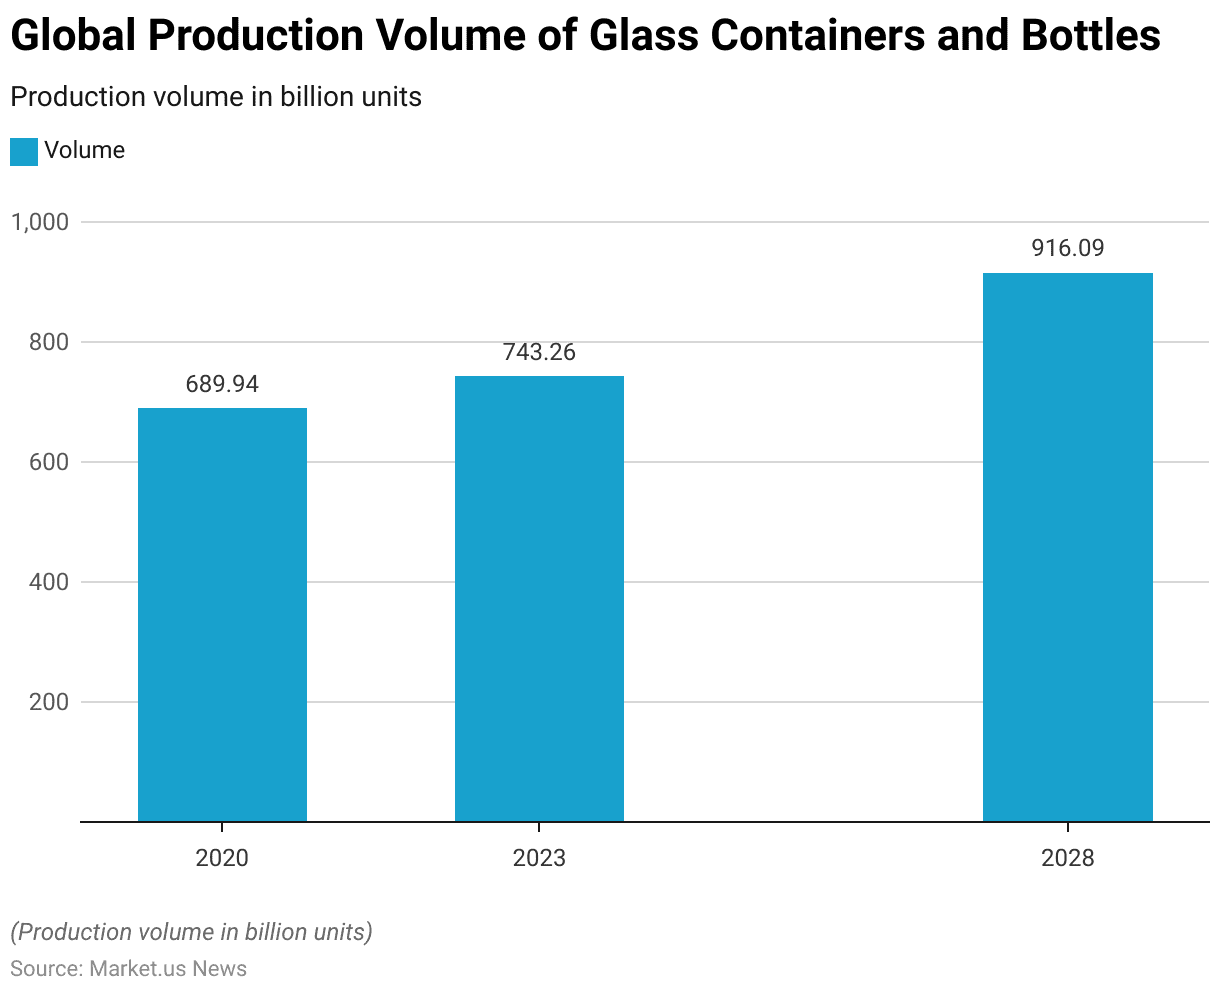
- The global production volume of glass containers and bottles has been steadily increasing and is expected to continue this growth trend.
- In 2020, the production volume was recorded at 689.94 billion units.
- By 2023, this figure rose to 743.26 billion units, reflecting a growing demand for glass packaging.
- Looking ahead, the production volume is forecasted to reach 916.09 billion units by 2028.
- This significant increase highlights the expanding use of glass containers and bottles worldwide, driven by factors such as sustainability concerns and the rising preference for glass over plastic in various industries.
(Source: Statista)
Global Alumina Production Volume
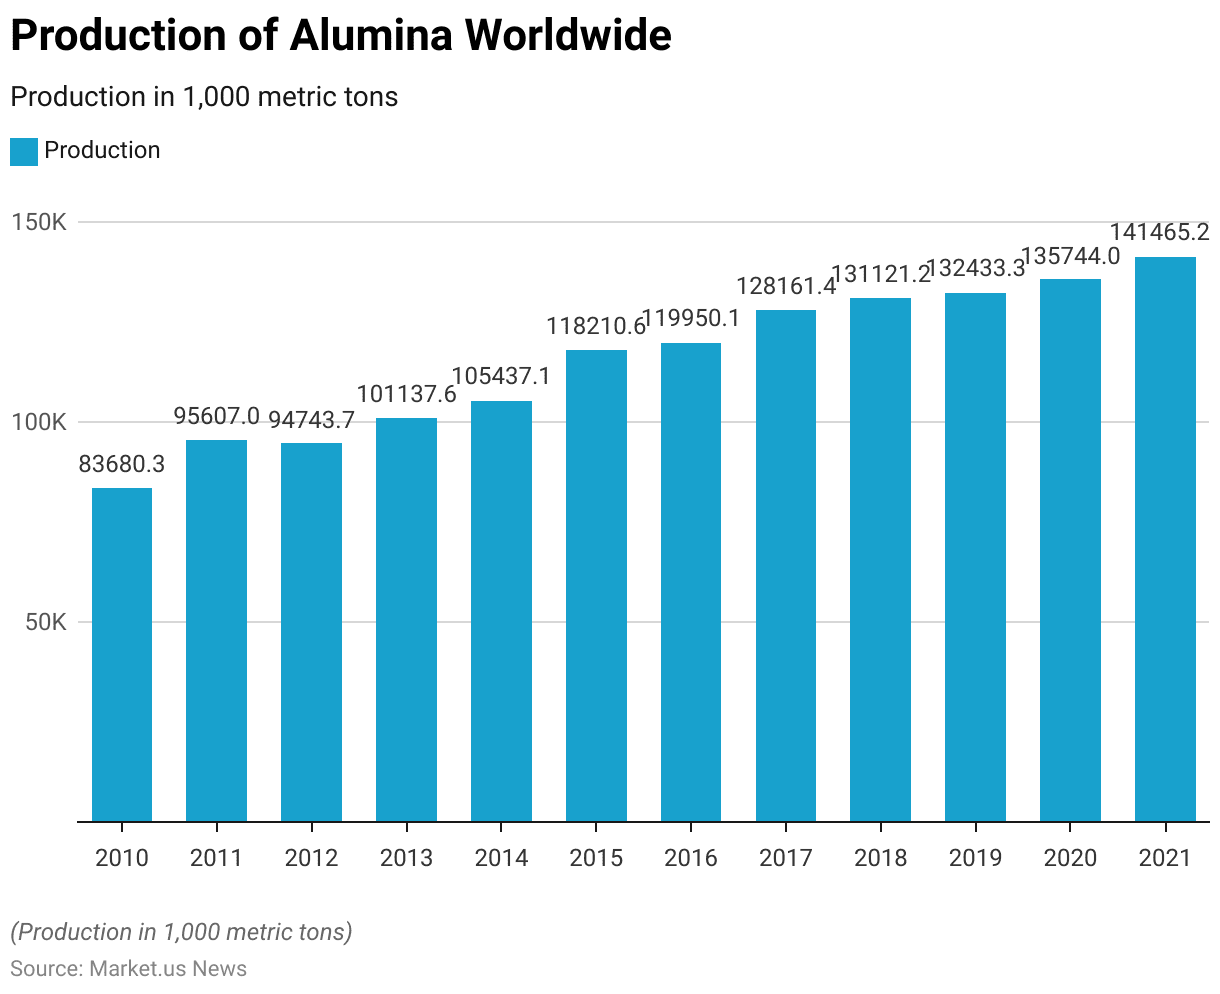
- Between 2010 and 2021, the global production of alumina experienced substantial growth.
- In 2010, the production volume was 83,680.3 thousand metric tons.
- This figure increased significantly in 2011, reaching 95,607.0 thousand metric tons, followed by a slight decrease in 2012 to 94,743.7 thousand metric tons.
- However, production resumed its upward trajectory in 2013, surpassing the 100,000 mark to reach 101,137.6 thousand metric tons.
- The growth continued steadily over the following years, with production volumes increasing to 105,437.1 thousand metric tons in 2014 and 118,210.6 thousand metric tons in 2015.
- In 2016, production further increased to 119,950.1 thousand metric tons, followed by 128,161.4 thousand metric tons in 2017.
- By 2018, global alumina production reached 131,121.2 thousand metric tons.
- The upward trend persisted, with production rising to 132,433.3 thousand metric tons in 2019, 135,744.0 thousand metric tons in 2020, and culminating at 141,465.2 thousand metric tons in 2021.
- This steady increase over the years reflects the growing demand for alumina in various industrial applications, including the production of aluminum and other uses in manufacturing and construction.
(Source: Statista)
Consumer Preferences and Trends
Leading Food Packaging Criteria Among Consumers Statistics
- As of March 2023, U.S. consumers identified several important criteria when evaluating food packaging.
- The foremost concern was hygiene and food safety, which was prioritized by 75% of respondents.
- This was followed by shelf life, which 69% of consumers considered crucial, reflecting the importance of packaging that maintains the freshness of food.
- Ease of use was another significant factor, valued by 57% of respondents, highlighting the demand for packaging that is convenient to handle.
- Durability was important to 55% of consumers, ensuring that packaging can withstand handling and protect the contents.
- Additionally, 54% of respondents emphasized the importance of the information included on the label, such as nutritional facts and ingredients.
- Environmental impact was a consideration for 39% of consumers, indicating growing awareness and concern about sustainable packaging.
- Lastly, 34% of respondents regarded the appearance of packaging as an important criterion, pointing to the role of aesthetics in consumer choices.
- This data underscores the multifaceted expectations of U.S. consumers regarding food packaging, with safety and practicality being the most critical factors.
(Source: Statista)
Consumer Preferences for Food Packaging Statistics
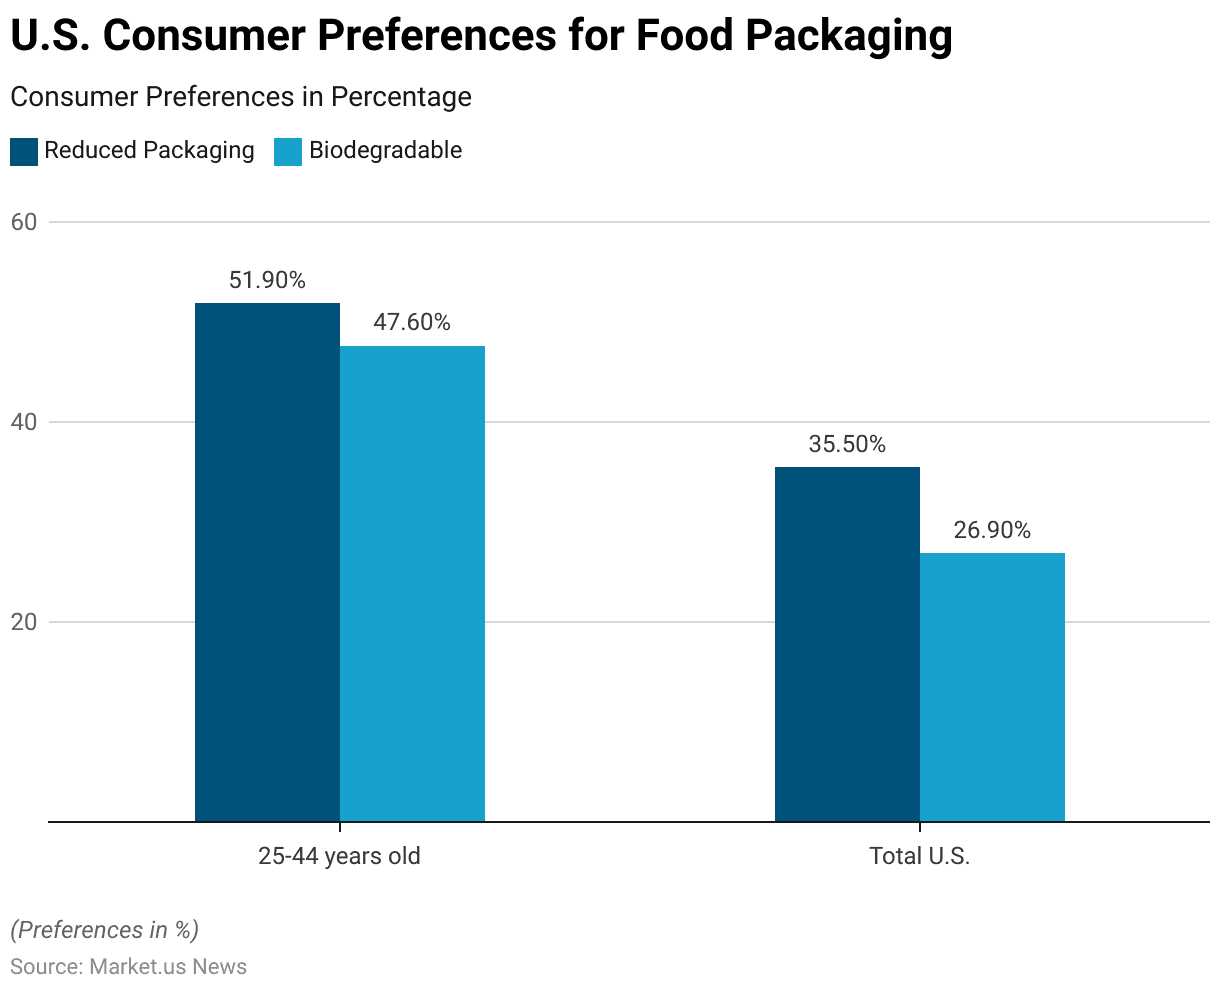
- In 2017, consumer preferences for food packaging in the United States varied significantly by age group.
- Among consumers aged 25-44 years, 51.9% expressed a preference for reduced packaging, indicating a strong inclination towards minimizing packaging waste.
- This preference was notably higher than the overall U.S. population, where 35.5% of consumers favored reduced packaging.
- Similarly, biodegradable packaging was preferred by 47.6% of the 25-44 age group, compared to 26.9% of the total U.S. population.
- These figures suggest that younger consumers are more environmentally conscious, prioritizing sustainability in their food packaging choices more than the general population.
(Source: Statista)
Influence of Food Packaging Information on a Consumer’s Buying Behavior Statistics
- In 2018, several elements of food packaging significantly influenced the purchasing decisions of French consumers.
- The most important factor was the price, which 43% of respondents cited as the primary consideration.
- Close behind, 42% of consumers were influenced by the use-by date, underscoring the importance of product freshness and safety.
- The list of ingredients or product composition was also crucial, affecting the decisions of 41% of respondents, reflecting a strong interest in understanding what the product contains.
- Additionally, 27% of consumers were swayed by labels indicating the absence of colorings or preservatives, highlighting a preference for cleaner, more natural products.
- Traceability and the origin of ingredients were important to 26% of respondents, indicating a concern for the source and quality of the ingredients used.
- The place of production influenced 25% of consumers, emphasizing the importance of local or specific geographic origins.
- Lastly, 24% of respondents considered the presence of a quality label, such as Label Rouge or AOC, as an important factor in their purchasing decisions.
- This data illustrates the diverse range of packaging information that French consumers value when making food purchasing decisions.
(Source: Statista)
Preferred Types of Environmentally Friendly Food Packaging Statistics
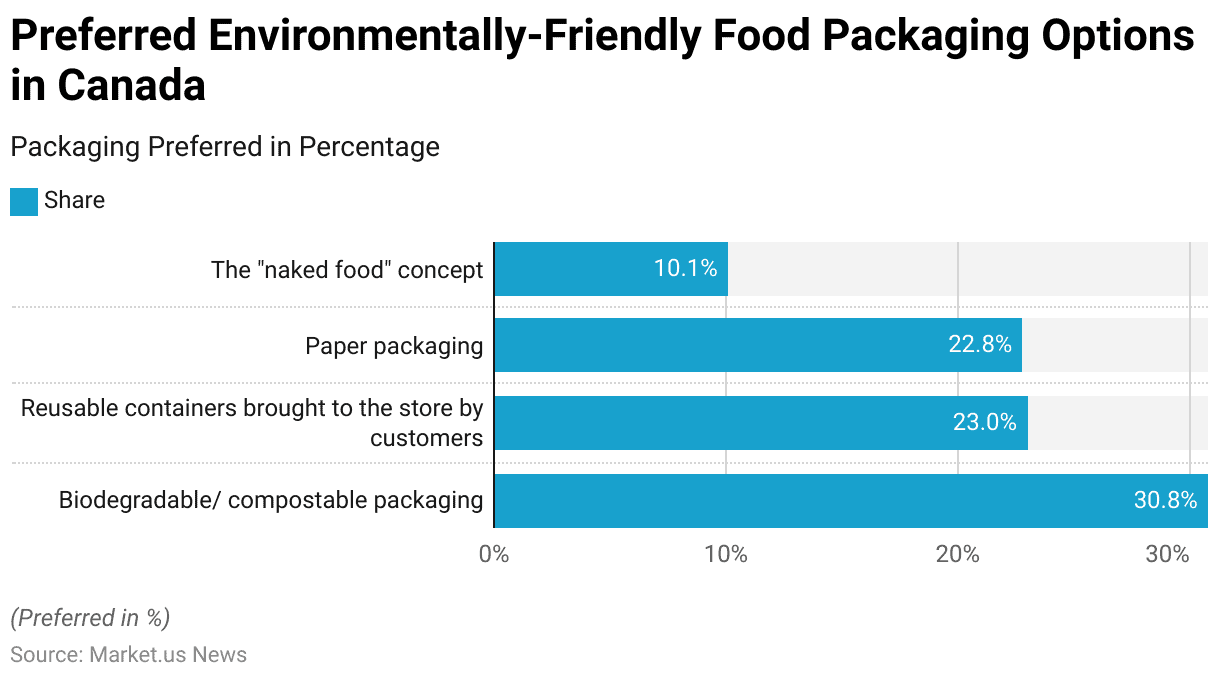
- In May 2019, Canadian consumers demonstrated a clear preference for various types of environmentally friendly food packaging.
- The most favored option was biodegradable or compostable packaging, which was preferred by 30.8% of respondents. This reflects a strong interest in sustainable packaging solutions that minimize environmental impact.
- Reusable containers, which customers bring to the store, were also popular, with 23% of respondents favoring this option, highlighting a commitment to reducing single-use packaging.
- Paper packaging was preferred by 22.8% of respondents, indicating its continued relevance as an eco-friendly alternative to plastic.
- The “naked food” concept, which involves selling food without any packaging, appealed to 10.1% of consumers. This option, though less popular, represents a growing interest in reducing packaging waste entirely.
- Overall, these preferences suggest that Canadian consumers are increasingly prioritizing sustainability in their food packaging choices.
(Source: Statista)
Customer Willingness to Pay for Sustainable Fresh Food Packaging Statistics
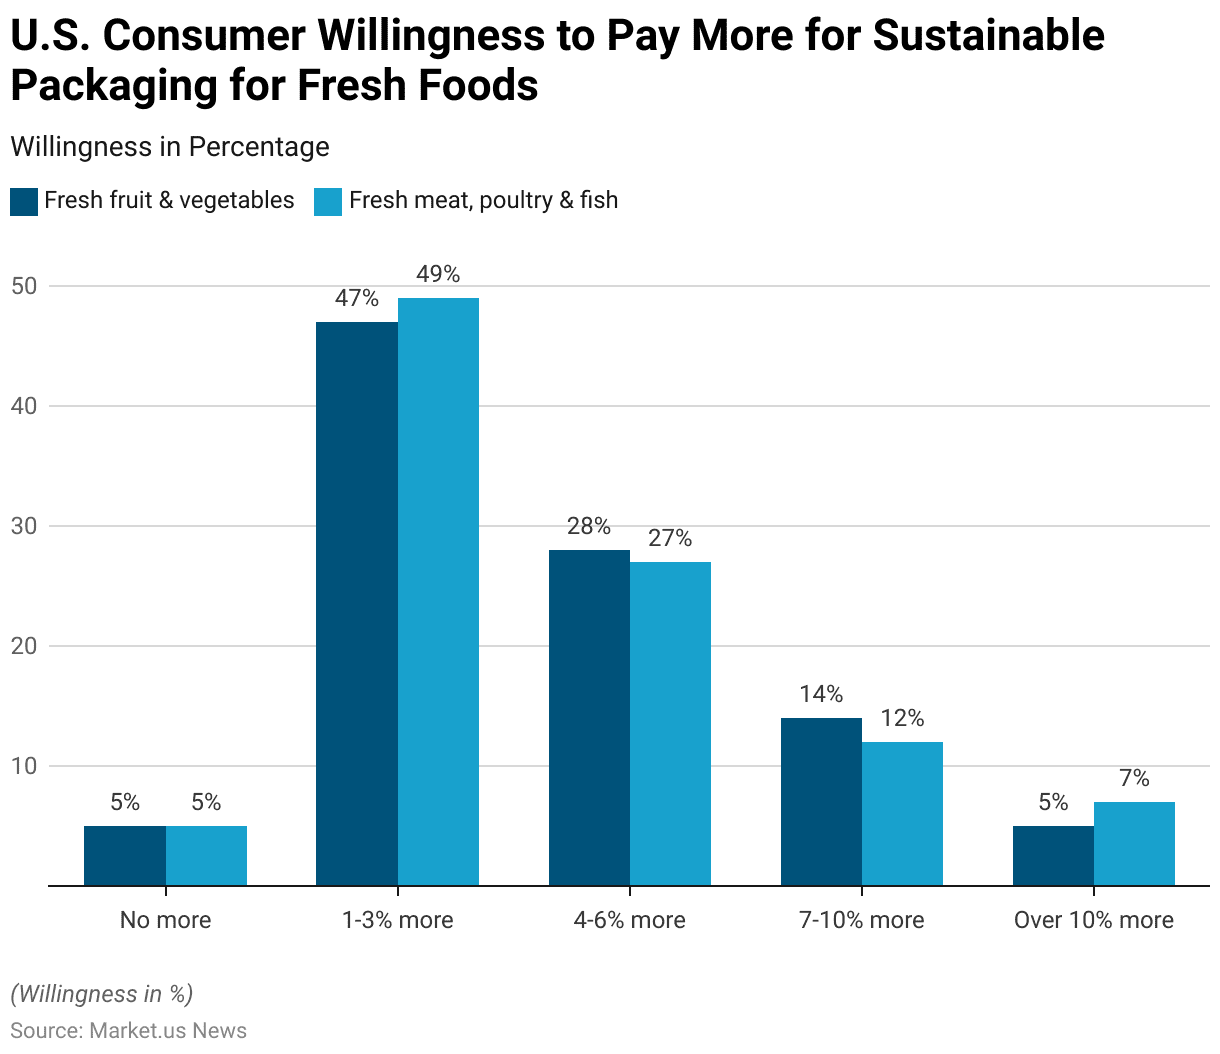
- In 2023, U.S. consumers expressed varying degrees of willingness to pay more for sustainable packaging when purchasing fresh foods.
- For fresh fruits and vegetables, 47% of consumers were willing to pay 1-3% more, while 28% were prepared to pay 4-6% more.
- A smaller segment, 14%, indicated a willingness to pay 7-10% more, and 5% were open to paying over 10% more.
- Notably, only 5% of respondents were unwilling to pay any extra for sustainable packaging.
- Similarly, when it came to fresh meat, poultry, and fish, 49% of consumers were willing to pay 1-3% more, with 27% willing to pay 4-6% more.
- A smaller portion, 12%, indicated they would pay 7-10% more, while 7% were willing to pay over 10% more for sustainable packaging.
- Again, only 5% of respondents were unwilling to pay any additional amount.
- These findings highlight a strong consumer preference in the U.S. for sustainable packaging, with a majority willing to accept a modest price increase to support environmentally friendly options, particularly in the fresh food categories.
(Source: Statista)
Consumers’ Opinions on Sustainable Food Packaging Statistics
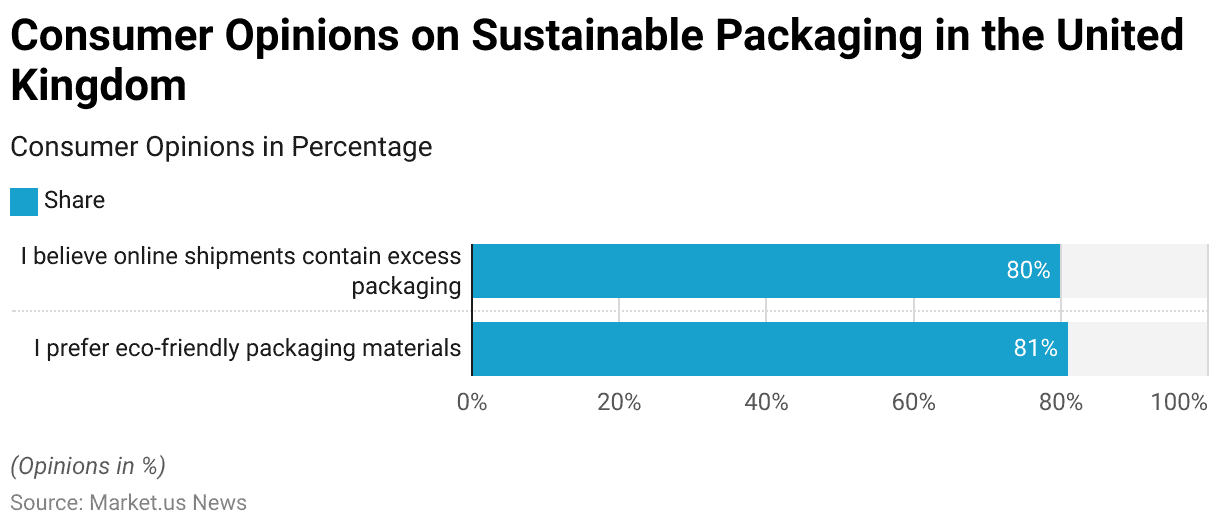
- In 2022, a significant majority of consumers in the United Kingdom expressed a strong preference for sustainable packaging options.
- Specifically, 81% of respondents indicated a preference for eco-friendly packaging materials, reflecting a widespread commitment to environmental sustainability.
- Additionally, 80% of consumers believed that online shipments often contain excess packaging, highlighting a growing concern about the environmental impact of packaging waste in e-commerce.
- These opinions suggest a robust consumer demand for more sustainable and efficient packaging practices in the U.K.
(Source: Statista)
Consumer Willingness to Pay More for Sustainable Packaging for Food Statistics
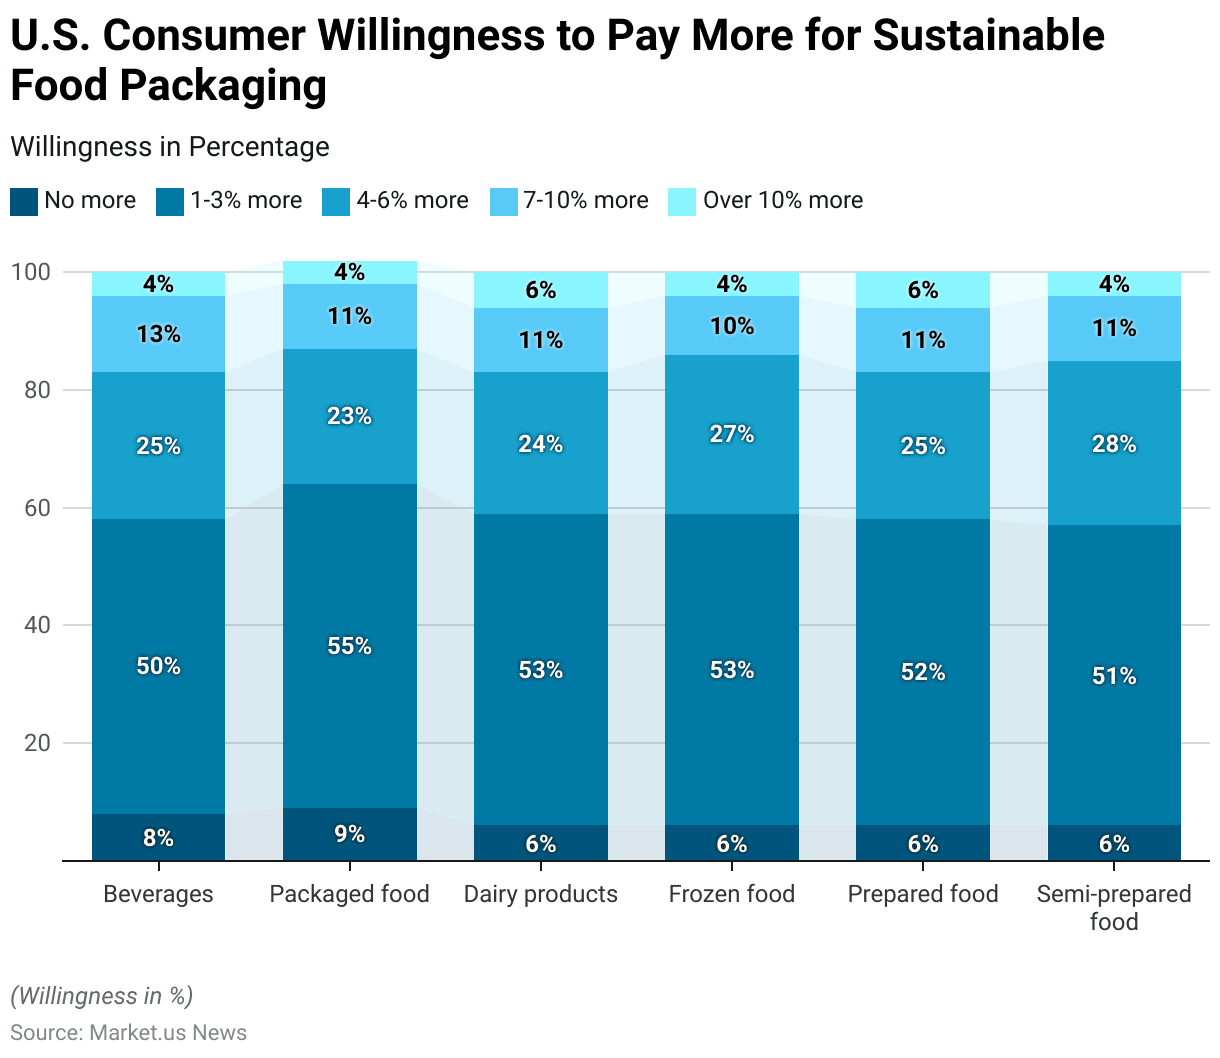
- In 2023, U.S. consumers demonstrated varying levels of willingness to pay more for sustainable packaging across different food categories.
- For beverages, 50% of consumers were willing to pay 1-3% more, while 25% were open to paying 4-6% more. A smaller portion, 13%, would pay 7-10% more, and 4% were willing to pay over 10% more. Only 8% of respondents were unwilling to pay any extra for sustainable packaging in this category.
- When it comes to packaged food, 55% of consumers were willing to pay 1-3% more, with 23% willing to pay 4-6% more, 11% open to paying 7-10% more, and 4% willing to pay over 10% more.
- Similarly, for dairy products, 53% were willing to pay 1-3% more, 24% were open to paying 4-6% more, 11% were willing to pay 7-10% more, and 6% would pay over 10% more.
More Insights
- In the frozen food category, 53% of consumers were willing to pay 1-3% more, with 27% willing to pay 4-6% more, 10% open to paying 7-10% more, and 4% willing to pay over 10% more.
- For prepared food, 52% of respondents were willing to pay 1-3% more, while 25% were willing to pay 4-6% more, 11% were open to paying 7-10% more, and 6% were willing to pay over 10% more.
- Lastly, for semi-prepared food, 51% of consumers were willing to pay 1-3% more, 28% were open to paying 4-6% more, 11% were willing to pay 7-10% more, and 4% would pay over 10% more.
- Across all categories, a minority of 4-9% of respondents were not willing to pay any extra for sustainable packaging.
- This data highlights a broad willingness among U.S. consumers to pay a modest premium for sustainable packaging, particularly within the range of 1-6% across various food categories.
(Source: Statista)
Concerns and Challenges
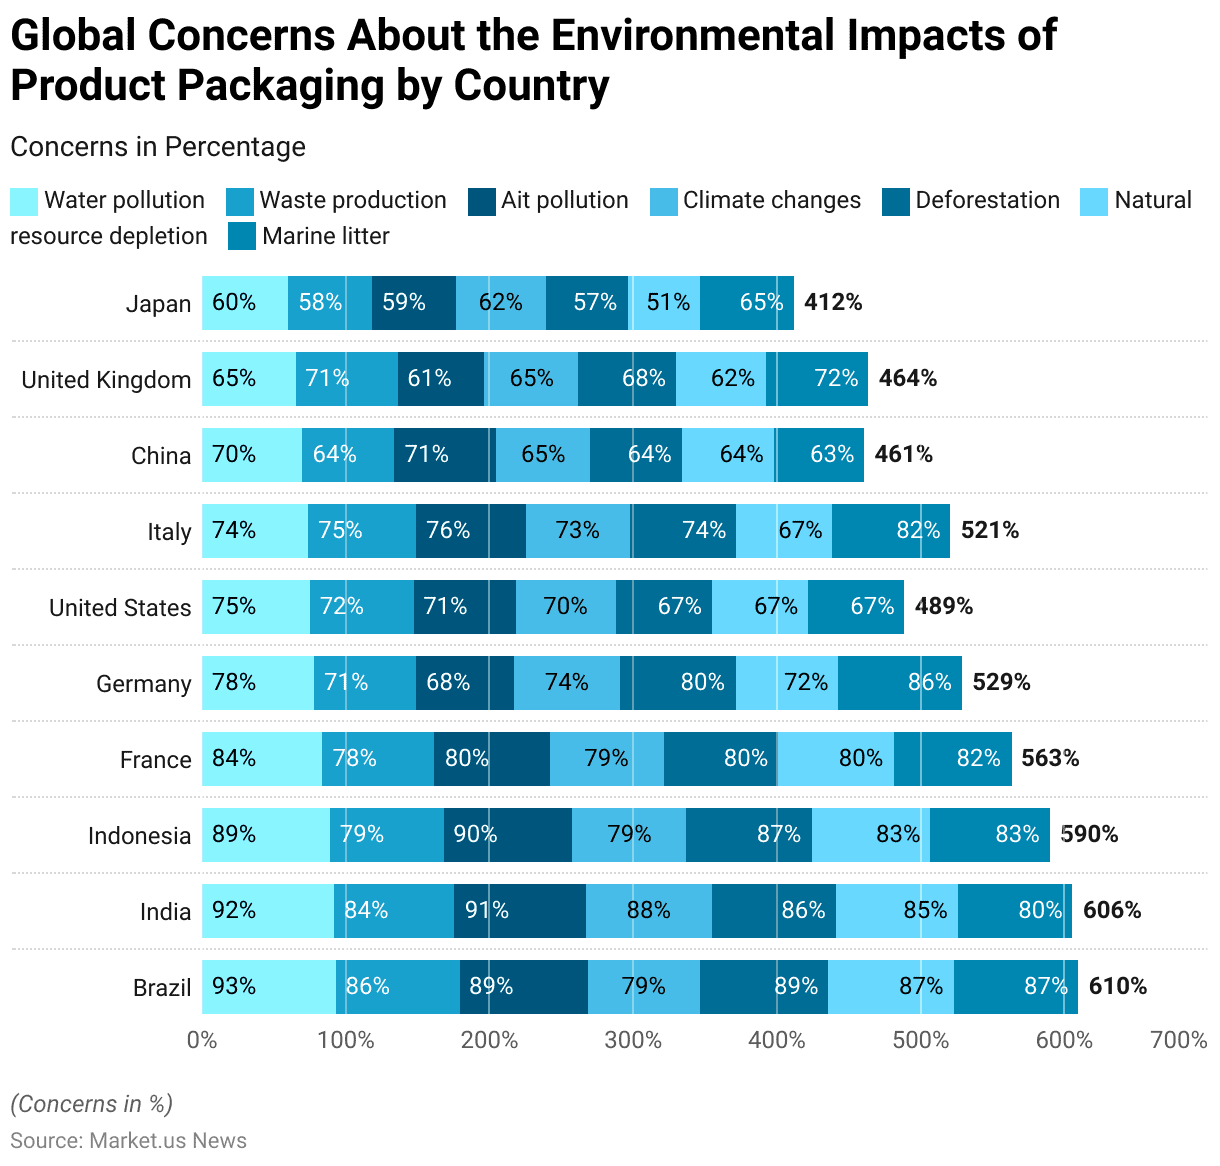
- In 2020, concerns about the environmental impacts of product packaging varied significantly across different countries.
- Brazilian consumers were the most concerned, with 93% expressing worry about water pollution, 86% about waste production, and 89% about air pollution. Similarly, 89% were concerned about deforestation, 87% about natural resource depletion, and marine litter.
- Indian respondents showed comparable levels of concern, with 92% worried about water pollution, 84% about waste production, and 91% about air pollution. Additionally, 88% were concerned about climate change, 86% about deforestation, and 85% about natural resource depletion.
- In Indonesia, 89% of respondents expressed concern about water pollution, while 79% were worried about waste production and 90% about air pollution. Concern for deforestation and marine litter stood at 87% and 83%, respectively.
- French respondents also showed significant concern, with 84% worried about water pollution and 79% about both climate change and deforestation. Germany displayed moderate levels of concern, with 78% of respondents concerned about water pollution and 74% about climate change.
- In the United States, 75% of respondents were concerned about water pollution, while concern for waste production and air pollution stood at 72% and 71%, respectively. Italian respondents showed similar levels of concern, with 74% worried about water pollution and 75% about waste production.
- China and the United Kingdom showed relatively lower concern levels, with 70% of Chinese respondents concerned about water pollution and 71% of British respondents worried about waste production.
- Japan exhibited the lowest concern across the measured categories, with 60% worried about water pollution and 58% about waste production.
- These variations highlight the differing levels of environmental awareness and concern about the impact of packaging across the world, with countries like Brazil, India, and Indonesia showing the highest levels of concern. At the same time, Japan and China reported the lowest.
(Source: Statista)
Food Packaging Regulations
- Food packaging regulations are increasingly stringent and vary significantly by country, reflecting global concerns over environmental impact and food safety.
- In the United States, the FDA governs food packaging under the Food Contact Notification (FCN) program, focusing on the safety of materials used and their potential migration into food.
- The E.U.‘s regulatory framework, particularly the Plastics Regulation, harmonizes safety standards across member states, requiring specific migration limits for substances in food contact materials.
- In Asia, China has implemented a comprehensive ban on single-use plastics, while India has introduced stringent rules under the Plastic Waste Management Amendment.
- Additionally, countries like France and Italy are advancing regulations to phase out single-use plastics and enforce mandatory environmental labeling.
- These regulations underscore the growing global trend towards sustainable and safe food packaging. Moreover, businesses need to adapt to complex and evolving legal landscapes to ensure compliance and reduce environmental impact.
(Sources: Food Compliance International, UPM Papers, Packaging Law)
Recent Developments
Acquisitions and Mergers:
- Amcor acquires Bemis Company: In 2023, Amcor, a global leader in packaging, completed its acquisition of Bemis Company for $6.8 billion. This acquisition strengthens Amcor’s position in flexible packaging and expands its presence in the North American market, focusing on sustainable packaging solutions.
- Smurfit Kappa merges with WestRock: In late 2023, Smurfit Kappa and WestRock, both leading companies in paper-based packaging, announced a merger valued at $11 billion. This merger is expected to create one of the world’s largest sustainable packaging companies, focusing on innovative and eco-friendly food packaging solutions.
New Product Launches:
- Tetra Pak introduces paper-based straws: In 2024, Tetra Pak launched its new paper-based straw solution for carton packages, aimed at reducing plastic waste. This new product aligns with Tetra Pak’s commitment to using renewable materials and promoting sustainability in food packaging.
- Nestlé launches recyclable paper packaging for snacks: In 2023, Nestlé introduced recyclable paper packaging for its snack products, replacing plastic wrappers. This launch is part of Nestlé’s broader goal to make 100% of its packaging recyclable or reusable by 2025.
Funding:
- Notpla raises $50 million in Series B funding: In 2023, Notpla, a sustainable packaging startup specializing in biodegradable seaweed-based materials, raised $50 million in funding. The funds will be used to scale its production of eco-friendly food packaging solutions, particularly for single-use applications.
- Huhtamaki secures €200 million green loan: In early 2024, Finnish packaging company Huhtamaki secured a €200 million green loan to fund sustainable packaging innovations. Further, the loan will help Huhtamaki develop new renewable materials and expand its sustainable food packaging portfolio.
Technological Advancements:
- Smart Packaging with IoT Integration: Smart packaging, which uses IoT sensors to monitor the freshness and quality of food, is becoming increasingly popular. By 2025, it is estimated that 25% of food packaging will incorporate smart technology. Enabling real-time tracking of food safety and extending shelf life.
- Edible Packaging Innovations: Edible packaging, made from materials like seaweed and rice, is gaining traction in the market. By 2026, the edible packaging market is expected to grow by 15%, driven by consumer demand for waste-free, sustainable packaging solutions.
Market Dynamics:
- Growth in the Food Packaging Market: The market is driven by increasing consumer demand for convenience, sustainability, and innovative packaging solutions that extend product shelf life.
- Sustainable Packaging Demand: The demand for sustainable packaging continues to rise, with more companies committing to eco-friendly solutions. By 2025, 60% of food packaging is expected to be recyclable, biodegradable, or reusable, reflecting a significant shift towards sustainability in the industry.
Conclusion
The global food packaging industry is rapidly evolving, driven by growing consumer awareness of environmental issues and the demand for sustainable materials.
Consumers increasingly prefer eco-friendly options like biodegradable, compostable, and reusable packaging.
This shift reflects a broader trend towards sustainability, with a focus on minimizing environmental impact while maintaining food safety and convenience.
As the market expands, especially in regions like Asia-Pacific and North America, companies must innovate to meet these changing preferences.
The future of food packaging lies in balancing functionality, safety, and sustainability to align with consumer demand and environmental standards.
FAQs
Food packaging serves several key purposes: protecting food from contamination, extending shelf life, providing information about the product, and offering convenience to consumers. It also plays a role in marketing by making products more attractive to buyers.
Common materials include plastic, glass, metal, paperboard, and biopolymers. Each material is chosen based on its properties, such as durability, flexibility, and ability to preserve food.
Sustainable packaging options include biodegradable and compostable materials, paper-based packaging, and reusable containers. These options are designed to minimize environmental impact by reducing waste and utilizing renewable resources.
Food packaging can contribute to environmental issues such as waste production, pollution, and resource depletion. Non-recyclable materials and excessive packaging are significant concerns. Sustainable packaging aims to address these issues by reducing waste and using eco-friendly materials.
Packaging plays a crucial role in keeping food safe by preventing contamination from bacteria, chemicals, and physical damage. It also helps maintain the freshness and quality of food during transportation and storage.


