Table of Contents
- Introduction
- Editor’s Choice
- Forklift Market Statistics
- Forklift Truck Market Statistics
- Forklift Sales Statistics
- Forklift Suppliers Statistics
- Forklift Export Statistics
- Forklift Import Statistics
- Forklift Shipments Statistics
- Forklift Production Trends Statistics
- Challenges and Concerns
- Regulations for Forklift Statistics
- Recent Developments
- Conclusion
- FAQs
Introduction
Forklift Statistics: Forklifts are crucial for material handling in various industries and are designed to lift, carry, and stack heavy loads efficiently.
Common types include counterbalance forklifts, reach trucks, pallet jacks, order pickers, and telescopic handlers, each suited for different applications.
Key components include the mast, forks, carriage, lift cylinder, and counterweight. Proper operation requires adherence to load capacity, safety measures, and regular maintenance.
Moreover, forklifts can be powered by electricity, gasoline, diesel, or propane, and operators must be certified by local regulations. Regular inspections ensure compliance with safety standards.
Editor’s Choice
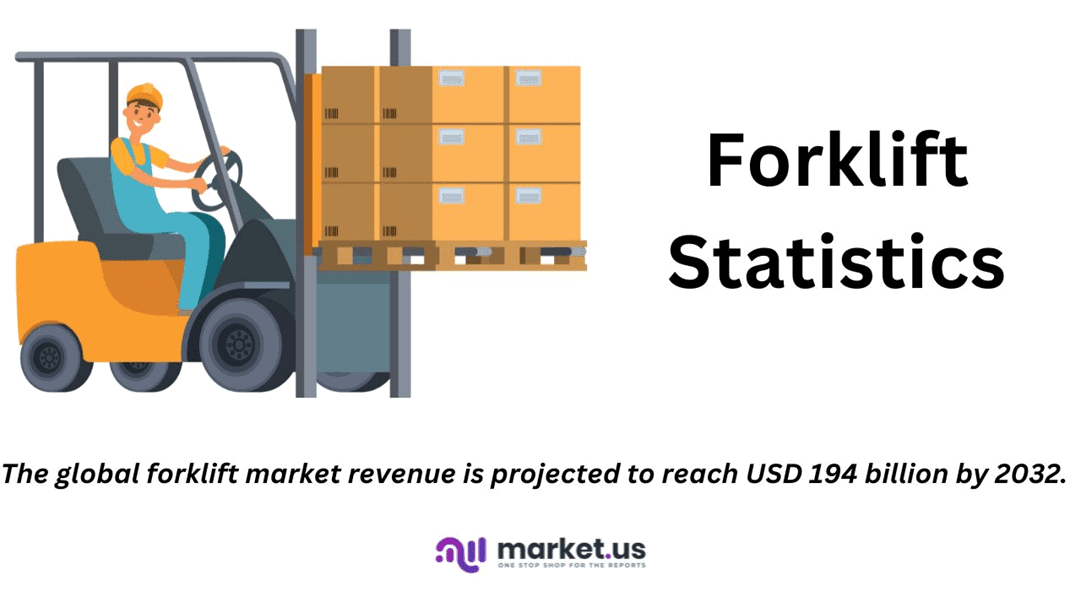
- The global forklift market has demonstrated significant growth over the past decade. With revenue increasing from USD 60 billion in 2022 to an estimated USD 194 billion by 2032.
- The forklift market is predominantly driven by electric power sources, which account for 66% of the market share.
- The forklift market is characterized by a diverse array of key players. Hyundai Heavy Industries Ltd leading the market with a 15% share.
- The regional distribution of the forklift market reveals a significant concentration in the Asia-Pacific (APAC) region, which holds the largest market share at 37.1%.
- In 2021, the sales for Class 4-5 forklifts were recorded at 793,276 units.
- In 2021, the global lift truck market was dominated by several key suppliers. Toyota Industries Corporation (Japan) leads the market with a substantial 28.44% share.
- In 2022, the export value of forklift trucks and other trucks fitted with lifting or handling equipment was led by China, which exported goods worth USD 6,199.9 million.
- In 2022, the United States led the world in imports of forklift trucks and other trucks fitted with lifting or handling equipment, with a total import value of USD 4,487.8 million. Canada followed with imports valued at USD 1,453.5 million, while Germany imported equipment worth USD 1,266.4 million.
Forklift Market Statistics
Global Forklift Market Size Statistics
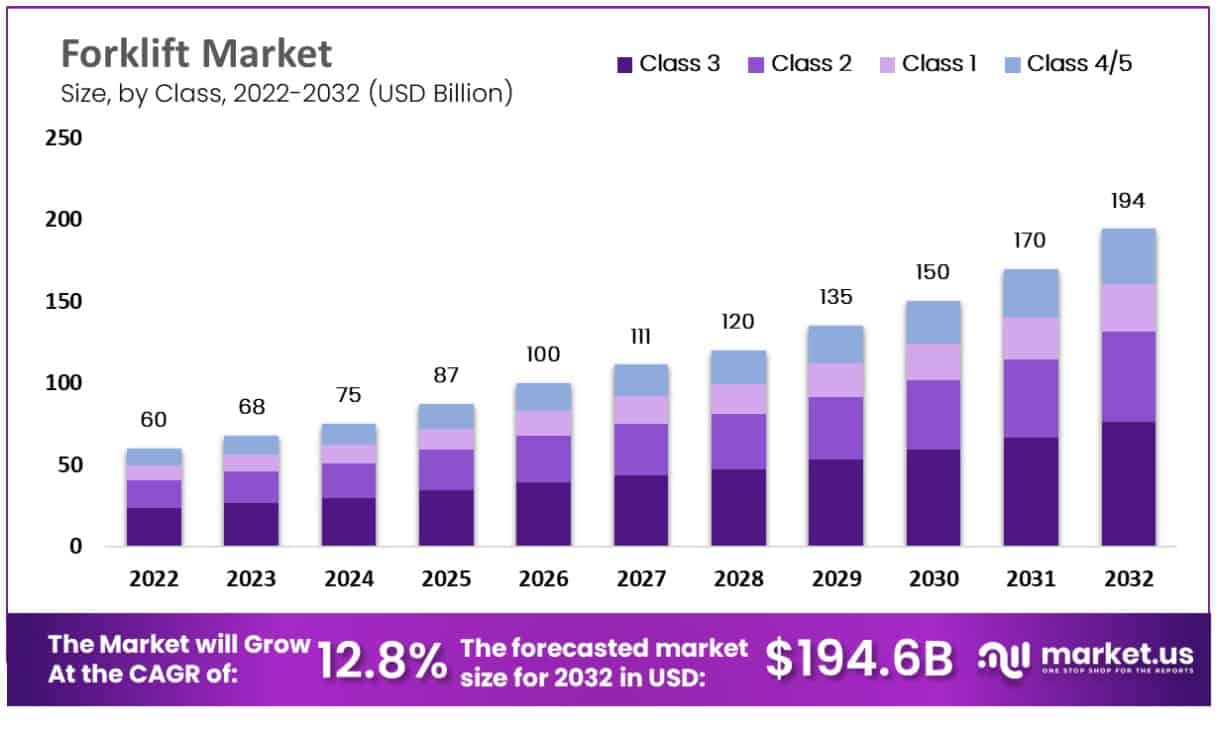
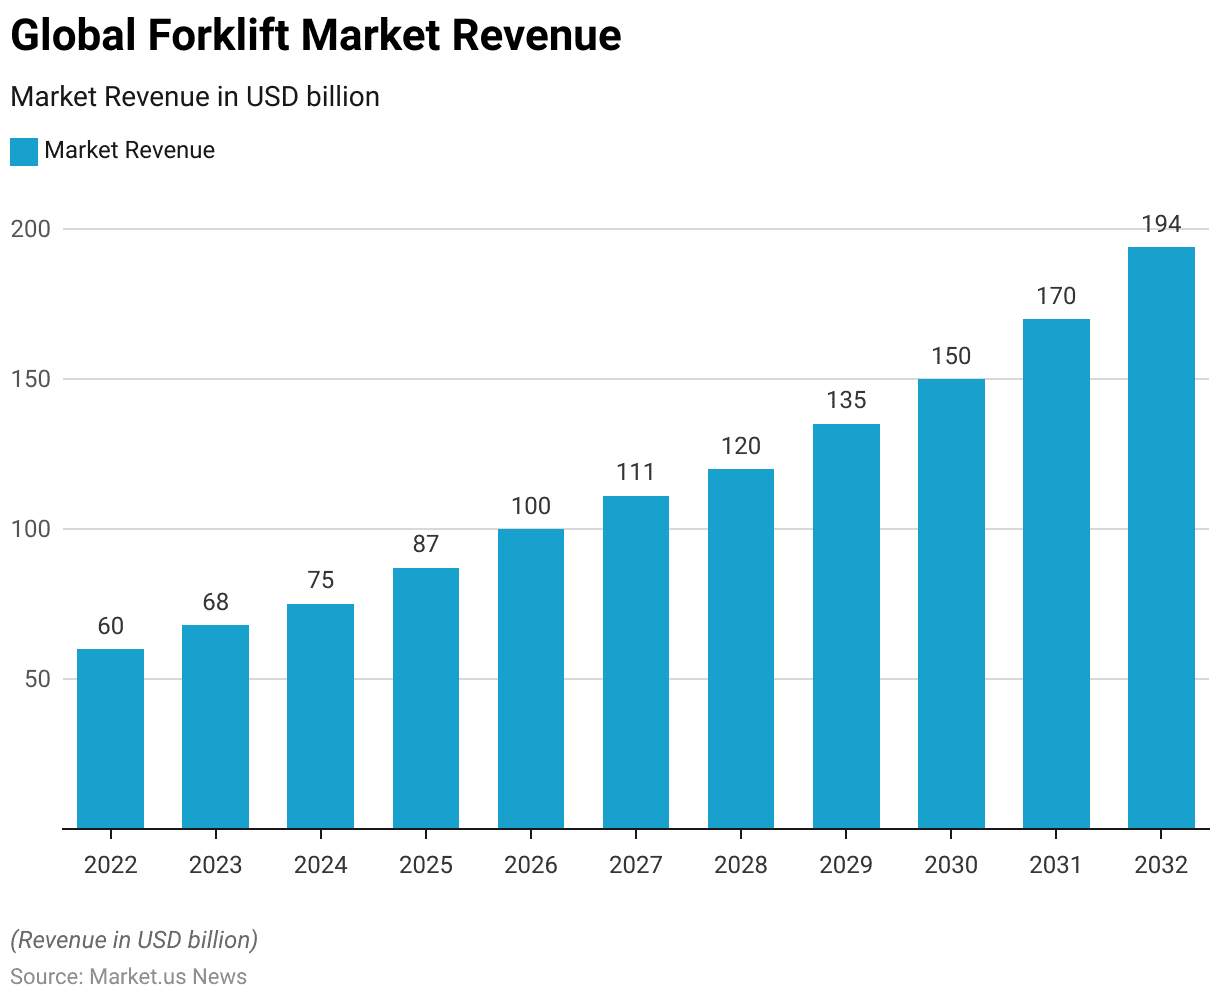
- The global forklift market has demonstrated significant growth over the past decade. With revenue increasing from USD 60 billion in 2022 to an estimated USD 194 billion by 2032.
- This upward trajectory reflects a compound annual growth rate (CAGR) of 12.8%, indicative of robust market expansion.
- In 2023, the market reached USD 68 billion and continued its ascent to USD 75 billion in 2024.
- The growth rate accelerated in subsequent years. With revenues of USD 87 billion in 2025, USD 100 billion in 2026, and USD 111 billion in 2027.
- By 2028, the market achieved USD 120 billion. Followed by USD 135 billion in 2029 and USD 150 billion in 2030.
- The market is projected to reach USD 170 billion in 2031 and culminate at USD 194 billion in 2032.
- This sustained growth can be attributed to factors such as increasing industrialization. Advancements in automation, and the rising demand for efficient material handling solutions across various industries.
(Source: market.us)
Global Forklift Market Share – By Power Source Statistics
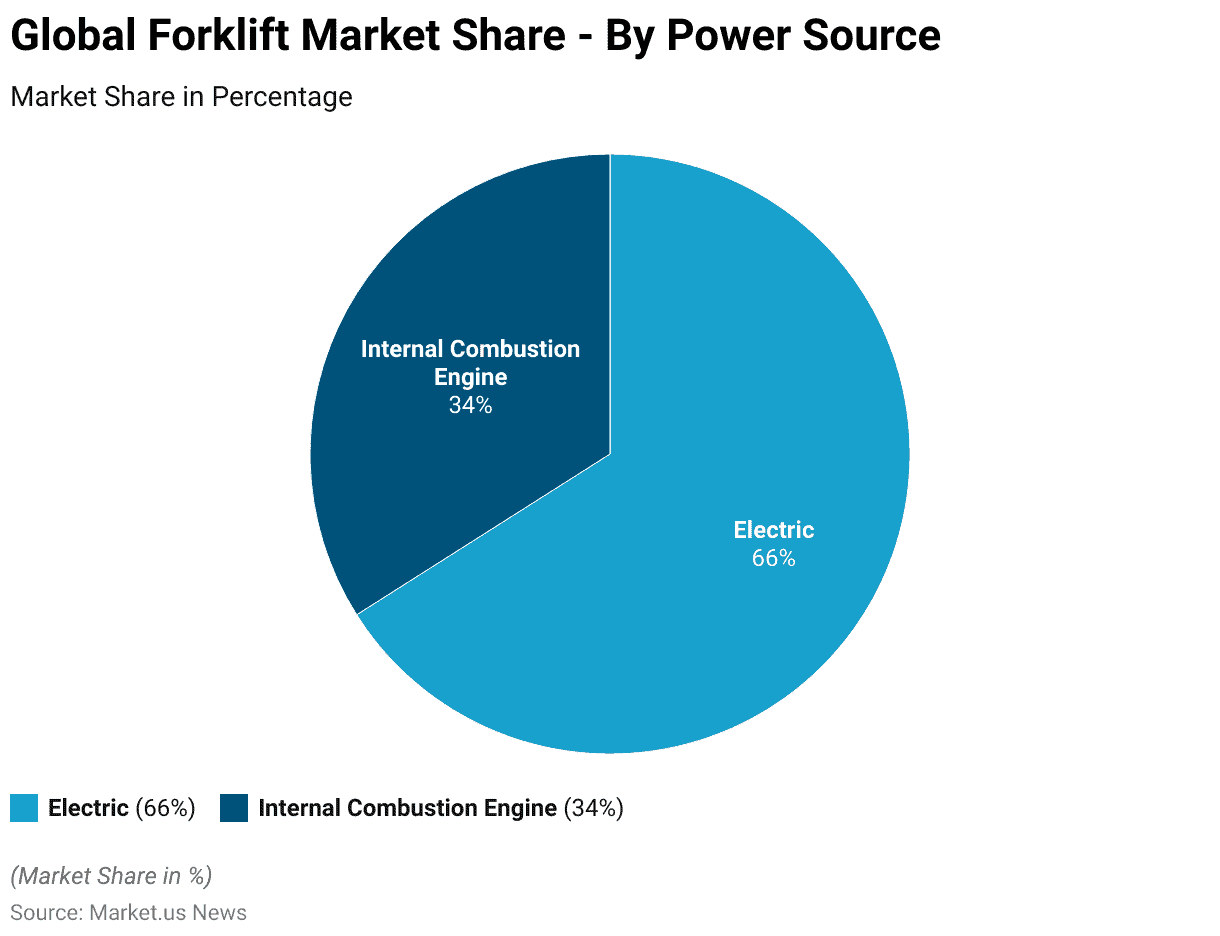
- The forklift market is predominantly driven by electric power sources, which account for 66% of the market share.
- This significant majority reflects the growing preference for environmentally friendly and energy-efficient solutions within the industry.
- In contrast, forklifts powered by internal combustion engines constitute 34% of the market.
- This distribution highlights a clear trend towards electric forklifts, driven by advancements in battery technology. Stricter emissions regulations, and the increasing emphasis on sustainability and reduced operational costs.
(Source: market.us)
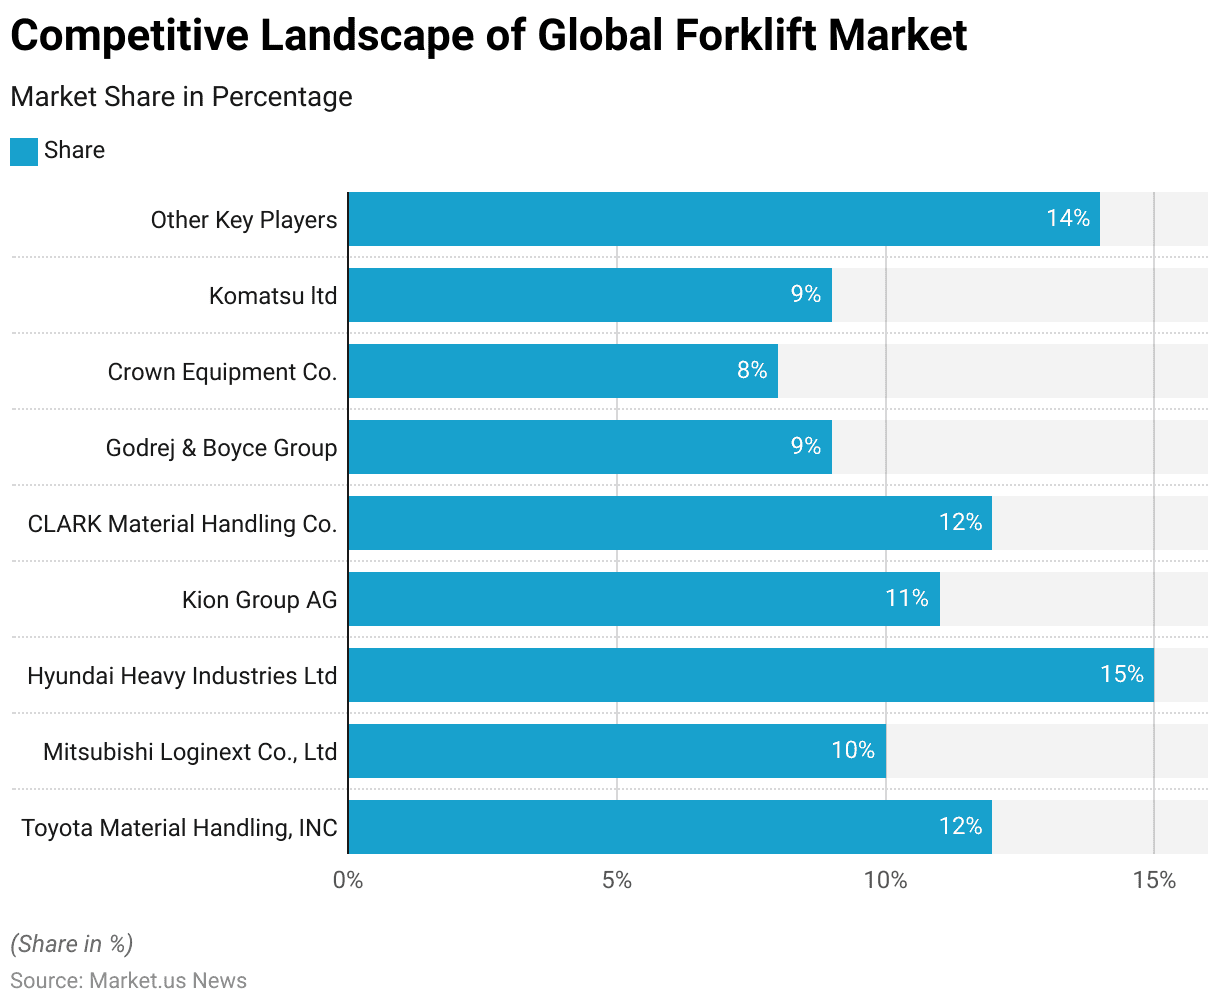
Competitive Landscape of the Global Forklift Market Statistics
- The forklift market is characterized by a diverse array of key players. Hyundai Heavy Industries Ltd leading the market with a 15% share.
- Toyota Material Handling, Inc. and CLARK Material Handling Co. each hold a 12% market share, showcasing their significant presence in the industry.
- Kion Group AG follows closely with an 11% share.
- Mitsubishi Loginext Co., Ltd captures 10% of the market, while both Godrej & Boyce Group and Komatsu Ltd hold 9% each.
- Crown Equipment Co. commands an 8% share.
- The remaining 14% of the market is comprised of other key players, illustrating a competitive and fragmented market landscape.
- This distribution underscores the competitive nature of the forklift market, driven by innovation, strategic mergers, and the continuous pursuit of efficiency and performance improvements by these leading companies.
(Source: market.us)
Regional Analysis of Global Forklift Market Statistics
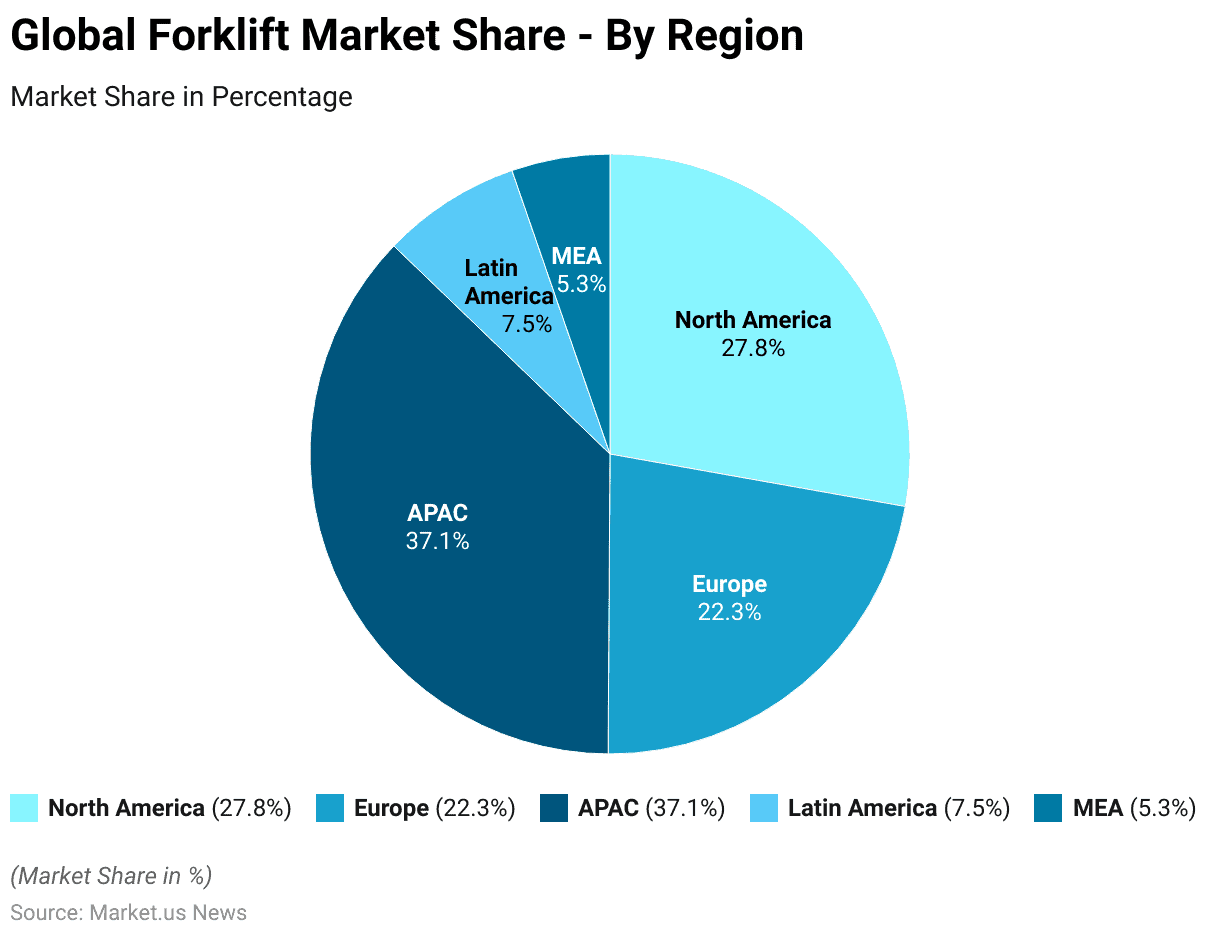
- The regional distribution of the forklift market reveals a significant concentration in the Asia-Pacific (APAC) region, which holds the largest market share at 37.1%.
- North America follows with a substantial 27.8% share. Indicating its strong industrial base and high demand for material-handling equipment.
- Europe accounts for 22.3% of the market, reflecting its advanced manufacturing sector and robust logistics infrastructure.
- Latin America and the Middle East & Africa (MEA) regions hold smaller shares, at 7.5% and 5.3%, respectively. Highlighting emerging opportunities and growth potential in these areas.
- This distribution underscores the global nature of the forklift market and the varying levels of demand and market maturity across different regions.
(Source: market.us)
Forklift Truck Market Statistics
Global Forklift Truck Market Size Statistics
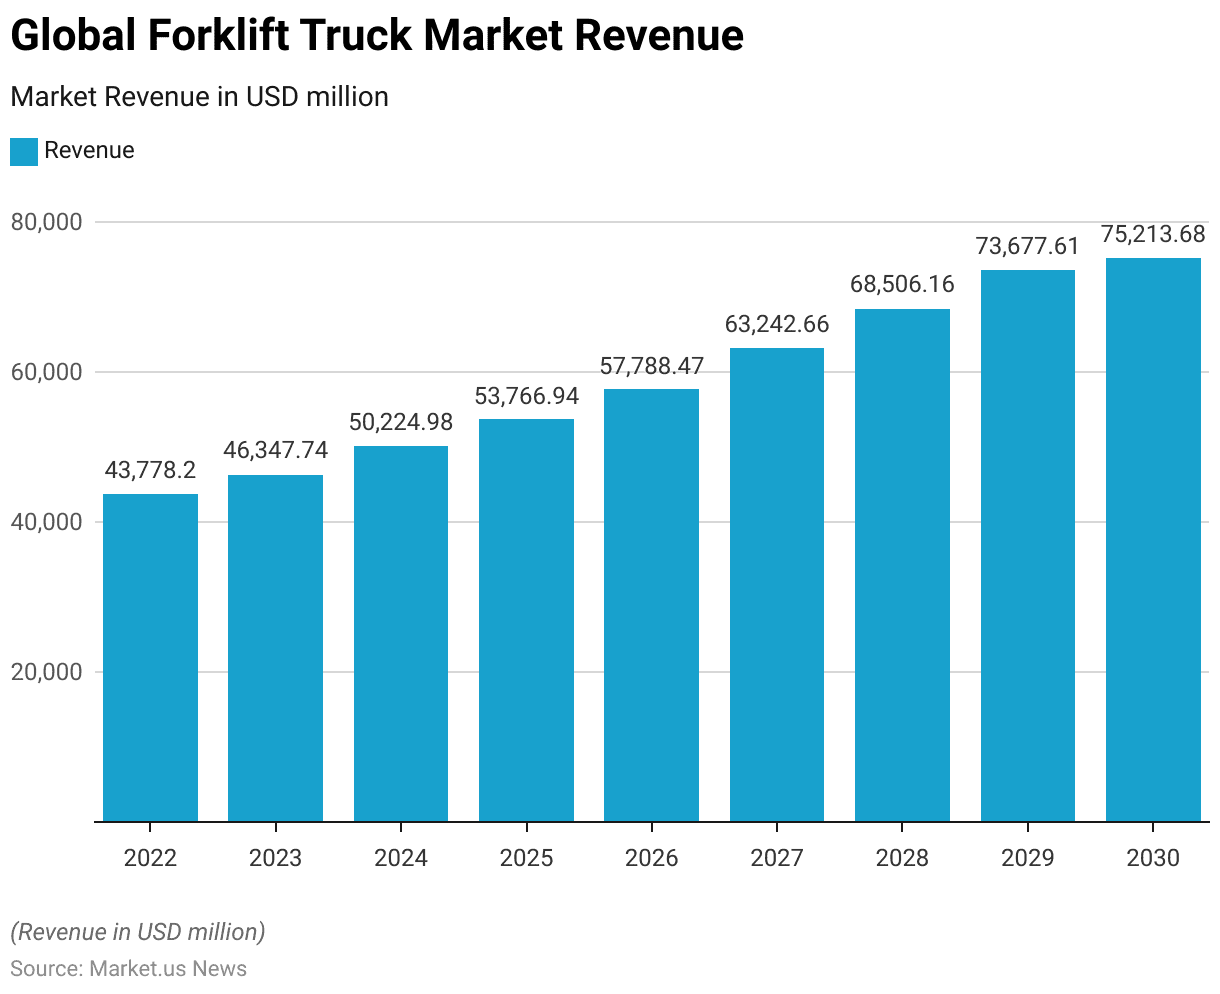
- The global forklift truck market has exhibited consistent growth, with revenue increasing from USD 43,778.20 million in 2022 to a projected USD 75,213.68 million by 2030.
- In 2023, the market revenue rose to USD 46,347.74 million, followed by an increase to USD 50,224.98 million in 2024.
- The upward trend continued in 2025, with revenues reaching USD 53,766.94 million and further escalating to USD 57,788.47 million in 2026.
- By 2027, the market achieved a revenue of USD 63,242.66 million, which increased to USD 68,506.16 million in 2028.
- In 2029, the market revenue grew to USD 73,677.61 million, culminating at USD 75,213.68 million in 2030.
- This steady growth trajectory underscores the expanding demand for forklift trucks. Driven by increased industrial activities, advancements in logistics and supply chain management, and the ongoing shift towards automation in material handling processes.
(Source: Statista)
Global Forklift Truck Market Volume Statistics
2018- 2025
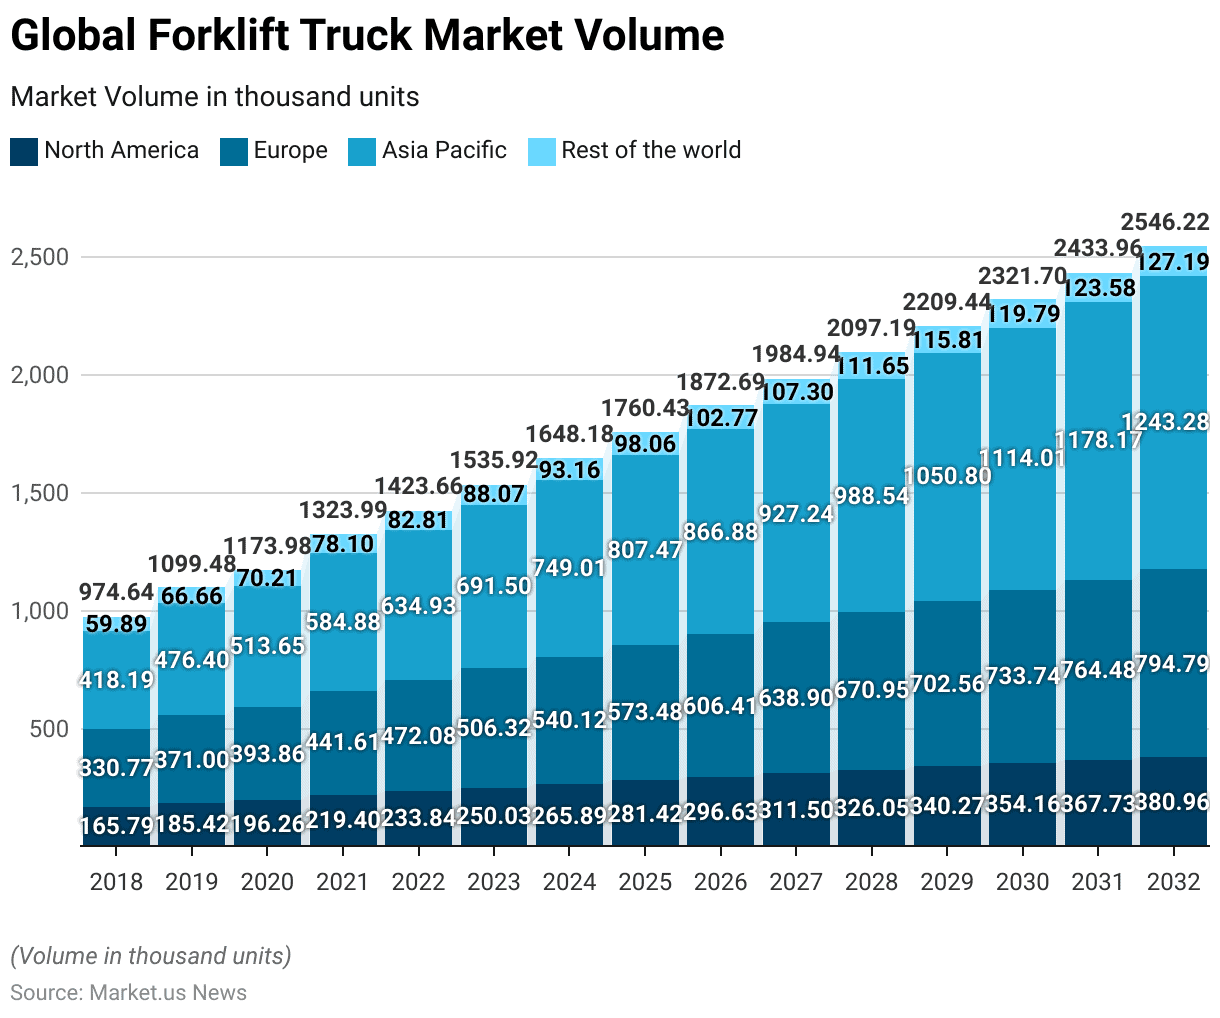
- In 2018, the market volume in North America stood at 165.79 thousand units, and in Europe at 330.77 thousand units. Asia Pacific at 418.19 thousand units, and the Rest of the world at 59.89 thousand units.
- By 2019, these figures had increased to 185.42 thousand units in North America, 371 thousand units in Europe, 476.4 thousand units in Asia Pacific, and 66.66 thousand units in the Rest of the world.
- The upward trend persisted in 2020, with North America reaching 196.26 thousand units, Europe 393.86 thousand units, Asia Pacific 513.65 thousand units, and the Rest of the world 70.21 thousand units.
- The year 2021 saw further growth, with North America at 219.4 thousand units. Europe at 441.61 thousand units, Asia Pacific at 584.88 thousand units, and the Rest of the world at 78.1 thousand units.
- By 2022, the market volume had increased to 233.84 thousand units in North America, 472.08 thousand units in Europe, 634.93 thousand units in Asia Pacific, and 82.81 thousand units in the Rest of the world.
- Projections for the coming years suggest sustained growth. In 2023, the market is expected to reach 250.03 thousand units in North America, 506.32 thousand units in Europe, 691.5 thousand units in Asia Pacific, and 88.07 thousand units in the Rest of the world.
- By 2024, these figures are projected to rise to 265.89 thousand units in North America, 540.12 thousand units in Europe, 749.01 thousand units in Asia Pacific, and 93.16 thousand units in the Rest of the world.
- The market is anticipated to continue this trajectory, with North America reaching 281.42 thousand units, and Europe 573.48 thousand units. Asia Pacific has 807.47 thousand units, and the rest of the world 98.06 thousand units by 2025.
2026-2032
- By 2026, the market volume is expected to increase to 296.63 thousand units in North America, 606.41 thousand units in Europe, 866.88 thousand units in Asia Pacific, and 102.77 thousand units in the Rest of the world.
- In 2027, the figures are projected to be 311.5 thousand units in North America, 638.9 thousand units in Europe, 927.24 thousand units in Asia Pacific, and 107.3 thousand units in the Rest of the world.
- Looking further ahead, the market volume in 2028 is forecasted to reach 326.05 thousand units in North America, 670.95 thousand units in Europe, 988.54 thousand units in Asia Pacific, and 111.65 thousand units in the Rest of the world.
- By 2029, these numbers are expected to rise to 340.27 thousand units in North America, 702.56 thousand units in Europe, 1,050.80 thousand units in Asia Pacific, and 115.81 thousand units in the Rest of the world.
- In 2030, the market is projected to attain 354.16 thousand units in North America, 733.74 thousand units in Europe, 1,114.01 thousand units in Asia Pacific, and 119.79 thousand units in the Rest of the world.
- The forecast for 2031 anticipates further growth, with North America reaching 367.73 thousand units, Europe 764.48 thousand units, Asia Pacific 1,178.17 thousand units, and the Rest of the world 123.58 thousand units.
- By 2032, the market volume is expected to peak at 380.96 thousand units in North America, 794.79 thousand units in Europe, 1,243.28 thousand units in Asia Pacific, and 127.19 thousand units in the Rest of the world.
- This consistent growth trajectory highlights the expanding demand for forklift trucks globally, driven by increased industrial activities and advancements in material handling technologies.
(Source: Statista)
Global Forklift Truck End User Market Volume Statistics
2018-2022
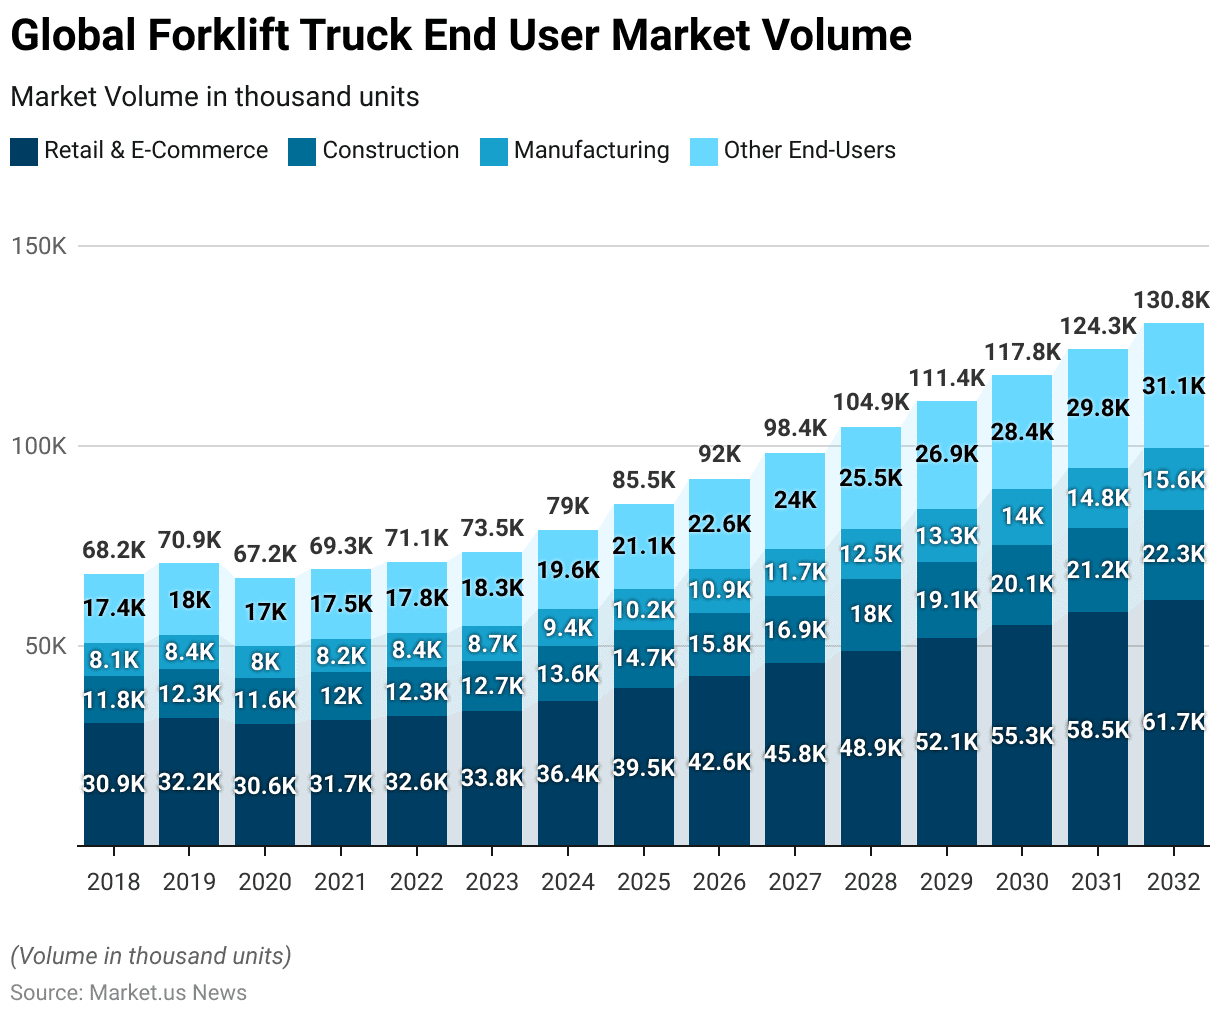
- The global forklift truck end-user market has shown substantial growth from 2018 to 2022, with forecasts predicting continued expansion until 2032.
- In 2018, the retail and e-commerce sector utilized 30,862.28 thousand units, the construction sector used 11,824.17 thousand units, manufacturing accounted for 8,089.62 thousand units and other end-users comprised 17,414.05 thousand units.
- By 2019, these numbers had increased to 32,164.80 thousand units for retail and e-commerce, 12,271.25 thousand units for construction, 8,407.55 thousand units for manufacturing, and 18,006.57 thousand units for other end-users.
- The year 2020 saw a slight decline in retail and e-commerce to 30,605.85 thousand units and manufacturing to 7,997.85 thousand units, while construction and other end-users also saw reductions to 11,627.37 thousand and 16,999.14 thousand units, respectively.
- However, in 2021, the market rebounded, with retail and e-commerce reaching 31,672.31 thousand units, construction at 11,982.00 thousand units, manufacturing at 8,233.00 thousand units, and other end-users at 17,452.94 thousand units.
- By 2022, the market continued its upward trend, with retail and e-commerce utilizing 32,570.61 thousand units, construction 12,270.18 thousand units, manufacturing 8,443.16 thousand units, and other end-users 17,806.34 thousand units.
2023-2032
- The forecast for 2023 predicts further growth, with retail and e-commerce expected to reach 33,790.86 thousand units, construction 12,676.63 thousand units, manufacturing 8,735.40 thousand units, and other end-users 18,327.43 thousand units.
- Looking ahead, the market is projected to continue expanding, with retail and e-commerce anticipated to grow to 36,423.78 thousand units by 2024, 39,523.33 thousand units by 2025, and 61,724.13 thousand units by 2032.
- Construction is expected to follow a similar trend, increasing to 13,607.31 thousand units in 2024, 14,703.71 thousand units in 2025, and 22,306.07 thousand units by 2032. Manufacturing is projected to grow to 9,390.25 thousand units by 2024, 10,161.51 thousand units by 2025, and 15,572.41 thousand units by 2032.
- Other end-users are expected to increase to 19,599.03 thousand units by 2024, 21,098.11 thousand units by 2025, and 31,148.08 thousand units by 2032.
- This growth trajectory highlights the increasing demand for forklifts across various sectors, driven by the expansion of retail and e-commerce, construction activities, manufacturing needs, and diverse applications in other industries.
(Source: Statista)
Global Forklift Truck Retail and E-Commerce End User Market Volume – By Region Statistics
2019-2023
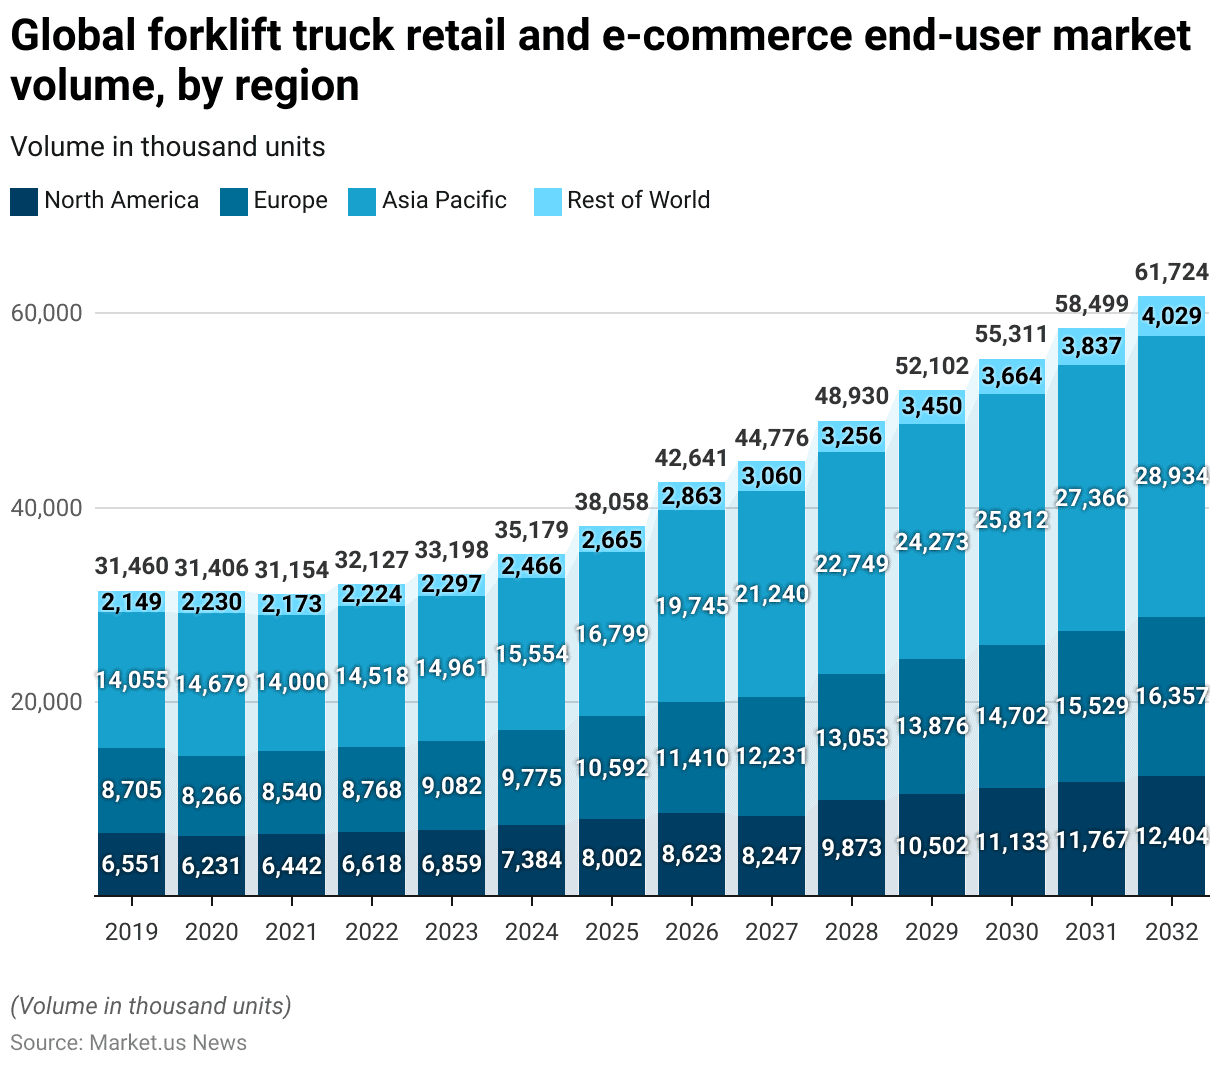
- The global forklift truck market for the retail and e-commerce sector has experienced significant growth across various regions from 2019 to 2023.
- In 2019, North America recorded a market volume of 6,550.5 thousand units, Europe reached 8,705.3 thousand units, Asia Pacific led with 14,055.1 thousand units, and the Rest of the World accounted for 2,149.4 thousand units.
- By 2020, North America saw a slight decrease to 6,230.9 thousand units, while Europe also saw a decline to 8,265.9 thousand units. However, the Asia Pacific region grew to 14,678.8 thousand units, and the Rest of the World increased to 2,230.3 thousand units.
- In 2021, the market rebounded, with North America increasing to 6,441.5 thousand units and Europe to 8,540.1 thousand units. The Asia Pacific region saw a slight decline to 13,999.9 thousand units, while the Rest of the World recorded 2,172.8 thousand units.
- By 2022, North America reached 6,617.9 thousand units, Europe 8,767.7 thousand units, Asia Pacific 14,518.0 thousand units, and the Rest of the World 2,223.8 thousand units.
- Forecasts indicate continuous growth in the coming years. In 2023, North America is expected to reach 6,858.9 thousand units, Europe 9,081.5 thousand units, Asia Pacific 14,961.2 thousand units, and the Rest of the World 2,296.5 thousand units.
2024-2032
- By 2024, these numbers are projected to increase to 7,383.9 thousand units in North America, 9,775.1 thousand units in Europe, 15,554.0 thousand units in Asia Pacific, and 2,465.5 thousand units in the Rest of the World.
- The trend continues, with North America anticipated to grow to 8,002.1 thousand units by 2025, Europe to 10,591.8 thousand units, Asia Pacific to 16,799.3 thousand units, and the Rest of the World to 2,664.5 thousand units.
- In 2026, North America is projected to reach 8,623.0 thousand units, Europe 11,410.3 thousand units, Asia Pacific 19,745.1 thousand units, and the Rest of the World 2,862.5 thousand units.
- By 2027, the market is expected to expand further, with North America reaching 8,246.5 thousand units, Europe 12,230.5 thousand units, Asia Pacific 21,239.9 thousand units, and the Rest of the World 3,059.5 thousand units.
- The upward trajectory is projected to continue through 2032, with North America anticipated to reach 12,404.1 thousand units, Europe 16,357.3 thousand units, Asia Pacific 28,934.2 thousand units, and the Rest of the World 4,028.5 thousand units.
- This consistent growth across all regions highlights the increasing demand for forklifts in the retail and e-commerce sector, driven by the expansion of these industries and the need for efficient material handling solutions.
(Source: Statista)
Forklift Sales Statistics
Forklift Sales – By-Class Statistics
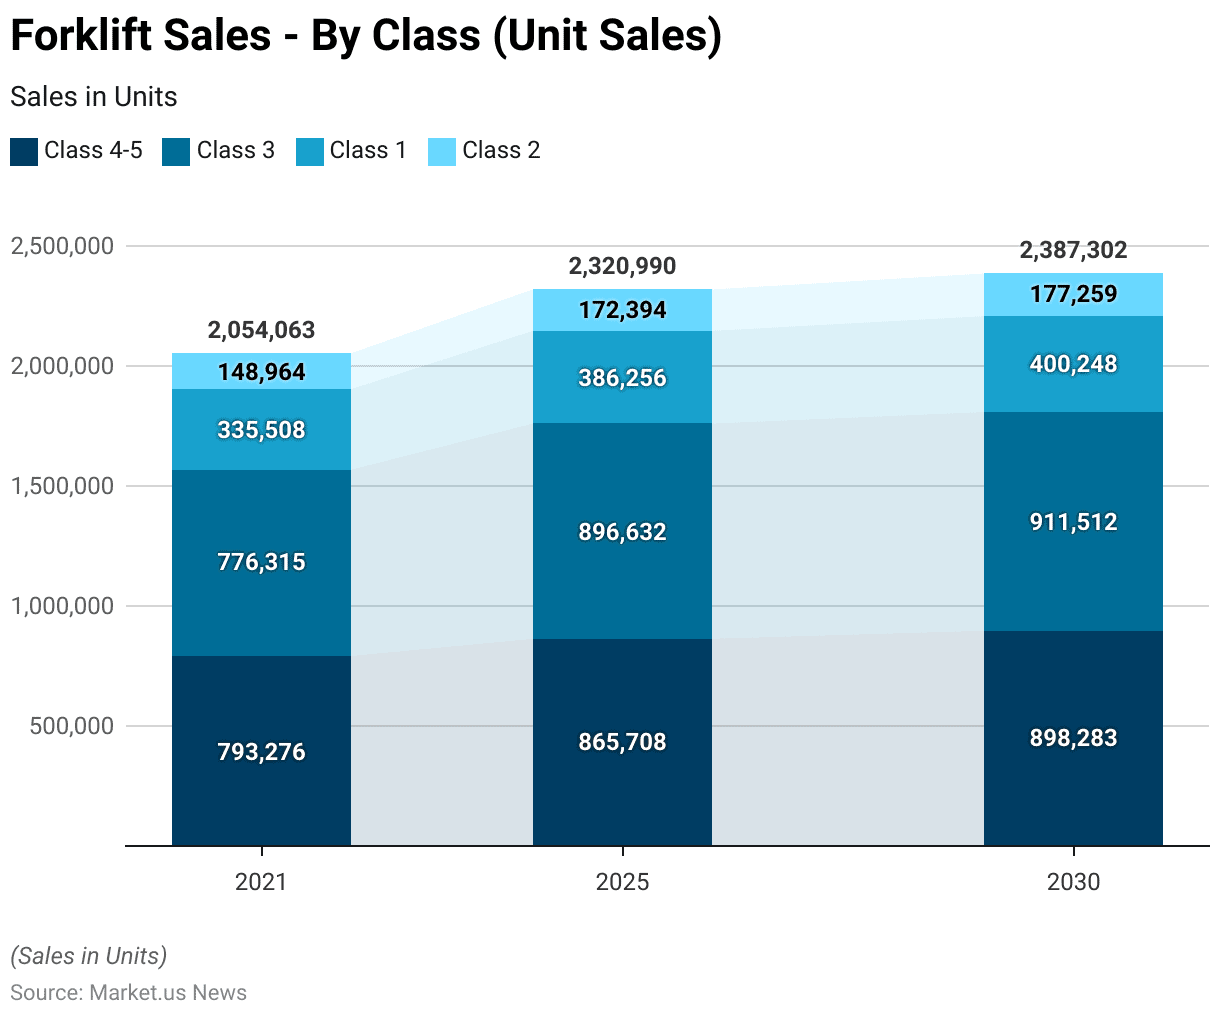
- The forklift sales by class have shown a notable upward trend from 2021 to 2030.
- In 2021, the sales for Class 4-5 forklifts were recorded at 793,276 units.
- This category is expected to see growth, reaching 865,708 units in 2025 and further increasing to 898,283 units by 2030.
- Class 3 forklifts also exhibited significant sales, with 776,315 units sold in 2021.
- The sales are projected to rise to 896,632 units in 2025 and 911,512 units by 2030.
- Class 1 forklifts had sales of 335,508 units in 2021, with expected growth to 386,256 units in 2025 and 400,248 units in 2030.
- Lastly, Class 2 forklifts recorded sales of 148,964 units in 2021, projected to increase to 172,394 units in 2025 and 177,259 units by 2030.
- This data indicates a steady demand across all forklift classes, reflecting the broader market’s growth and the increasing need for material handling equipment in various industries.
(Source: Statista)
Sales – By Forklift Propulsion Type Statistics
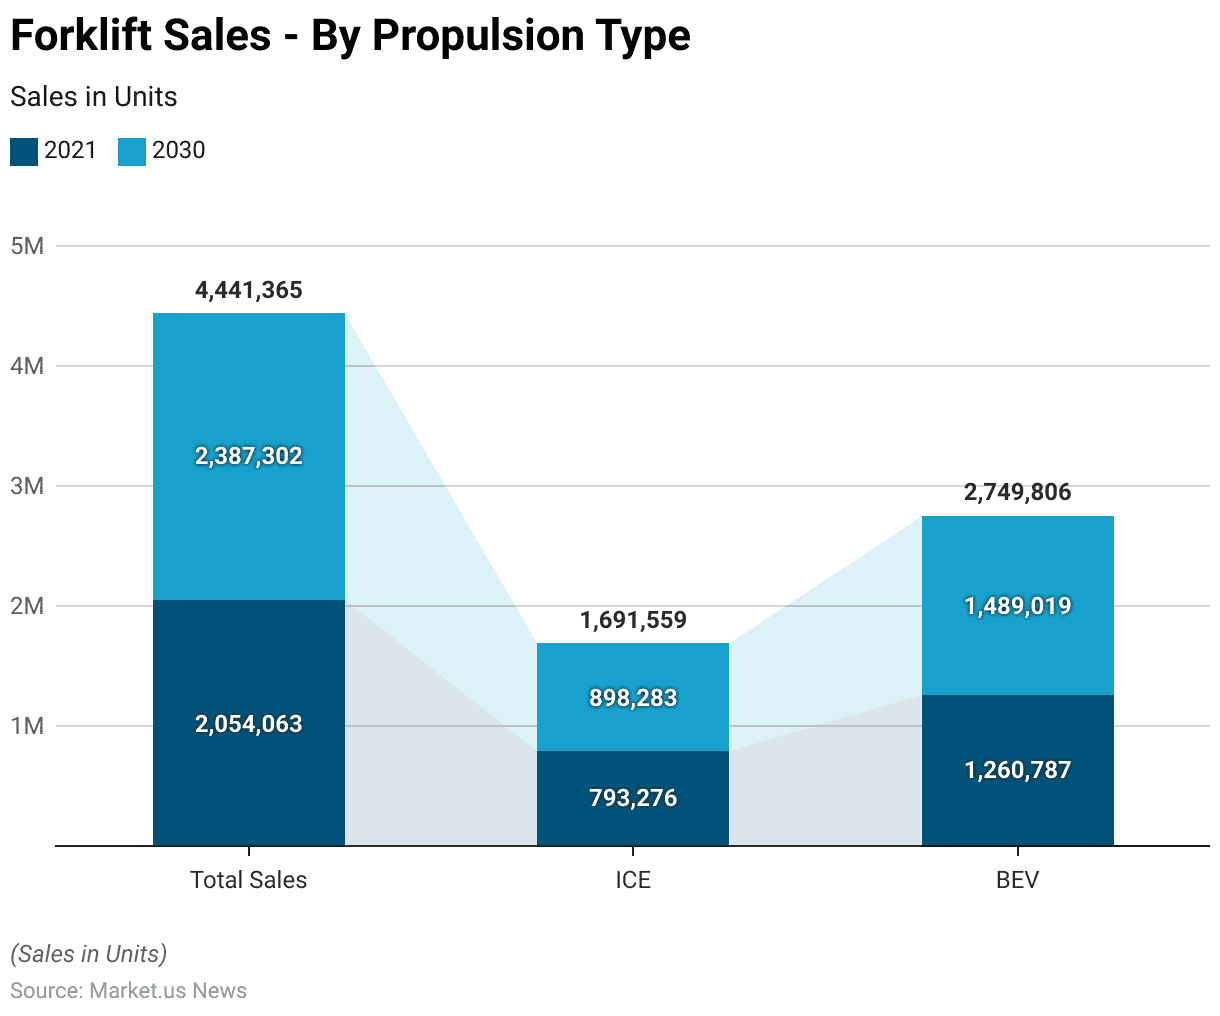
- The forklift market has shown substantial growth in terms of unit sales by propulsion type from 2021 to 2030.
- In 2021, the total forklift sales amounted to 2,054,063 units.
- Within this total, forklifts powered by internal combustion engines (ICE) accounted for 793,276 units, while battery electric vehicles (BEV) comprised a larger share with 1,260,787 units.
- By 2030, the market is projected to expand further, with total sales reaching 2,387,302 units.
- Sales of ICE forklifts are expected to increase to 898,283 units.
- BEV forklifts will continue to dominate the market, with projected sales rising to 1,489,019 units.
- This growth reflects the increasing adoption of electric forklifts due to their environmental benefits and operational efficiencies, alongside steady demand for ICE forklifts in specific applications.
Forklift Suppliers Statistics
Market Share of Leading Lift Truck Suppliers
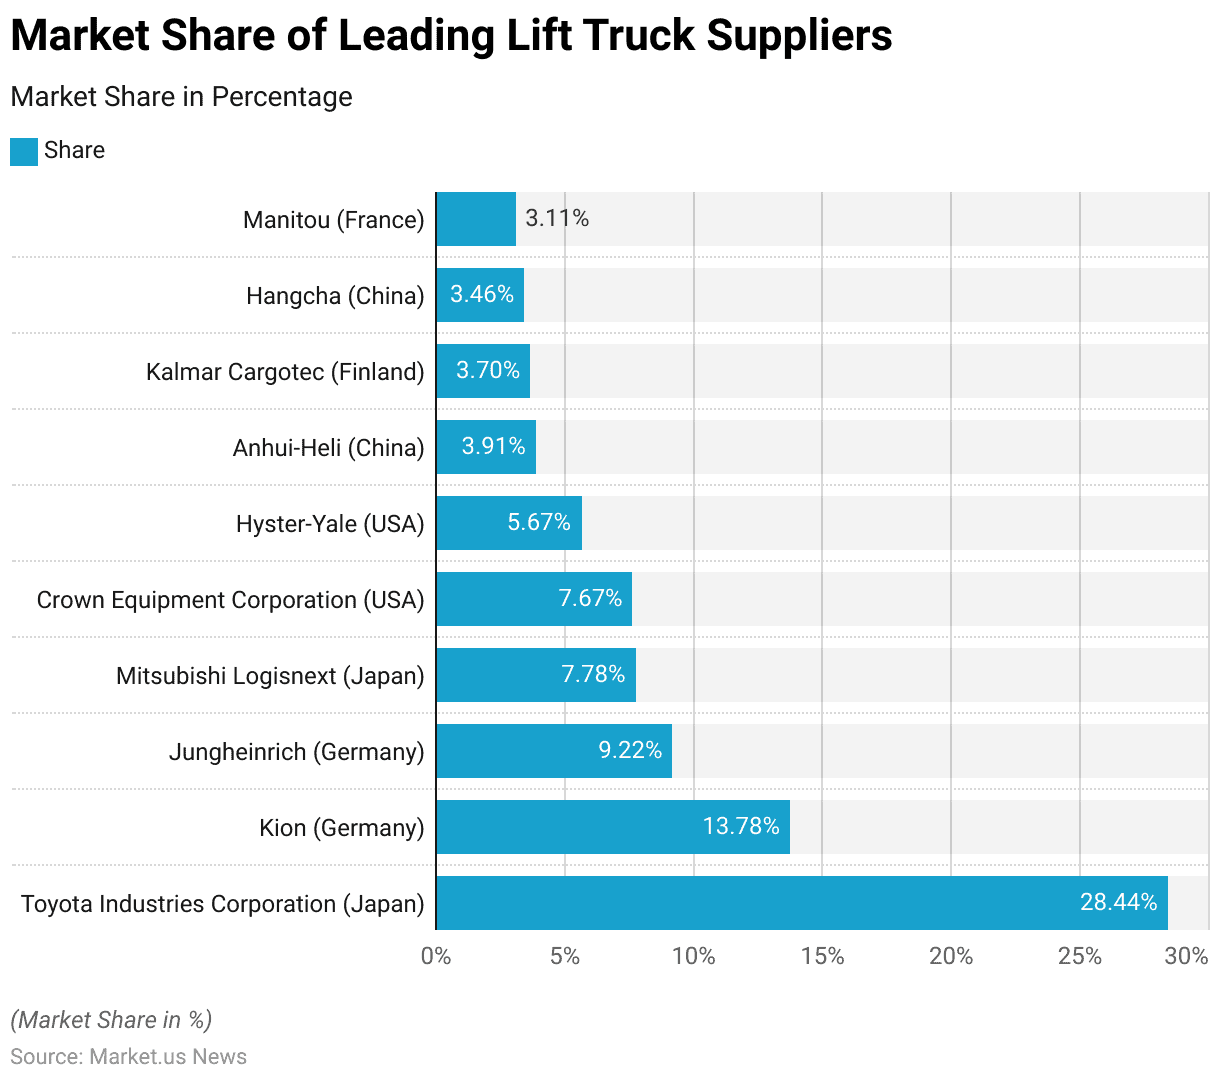
- In 2021, the global lift truck market was dominated by several key suppliers, with Toyota Industries Corporation (Japan) leading the market with a substantial 28.44% share.
- Kion Group (Germany) followed as the second-largest supplier, holding 13.78% of the market.
- Jungheinrich (Germany) captured a 9.22% share, making it a significant player in the industry.
- Mitsubishi Logisnext (Japan) held a 7.78% market share, while Crown Equipment Corporation (USA) closely followed with a 7.67% share.
- Other notable suppliers included Hyster-Yale (USA) with a 5.67% market share, Anhui-Heli (China) at 3.91%, and Kalmar Cargotec (Finland) with 3.7%.
- Hangcha (China) and Manitou (France) rounded out the list with market shares of 3.46% and 3.11%, respectively.
- This distribution highlights the competitive landscape of the lift truck market, with a mix of leading players from different regions contributing to the overall market dynamics.
Lift Truck Suppliers – By Revenue
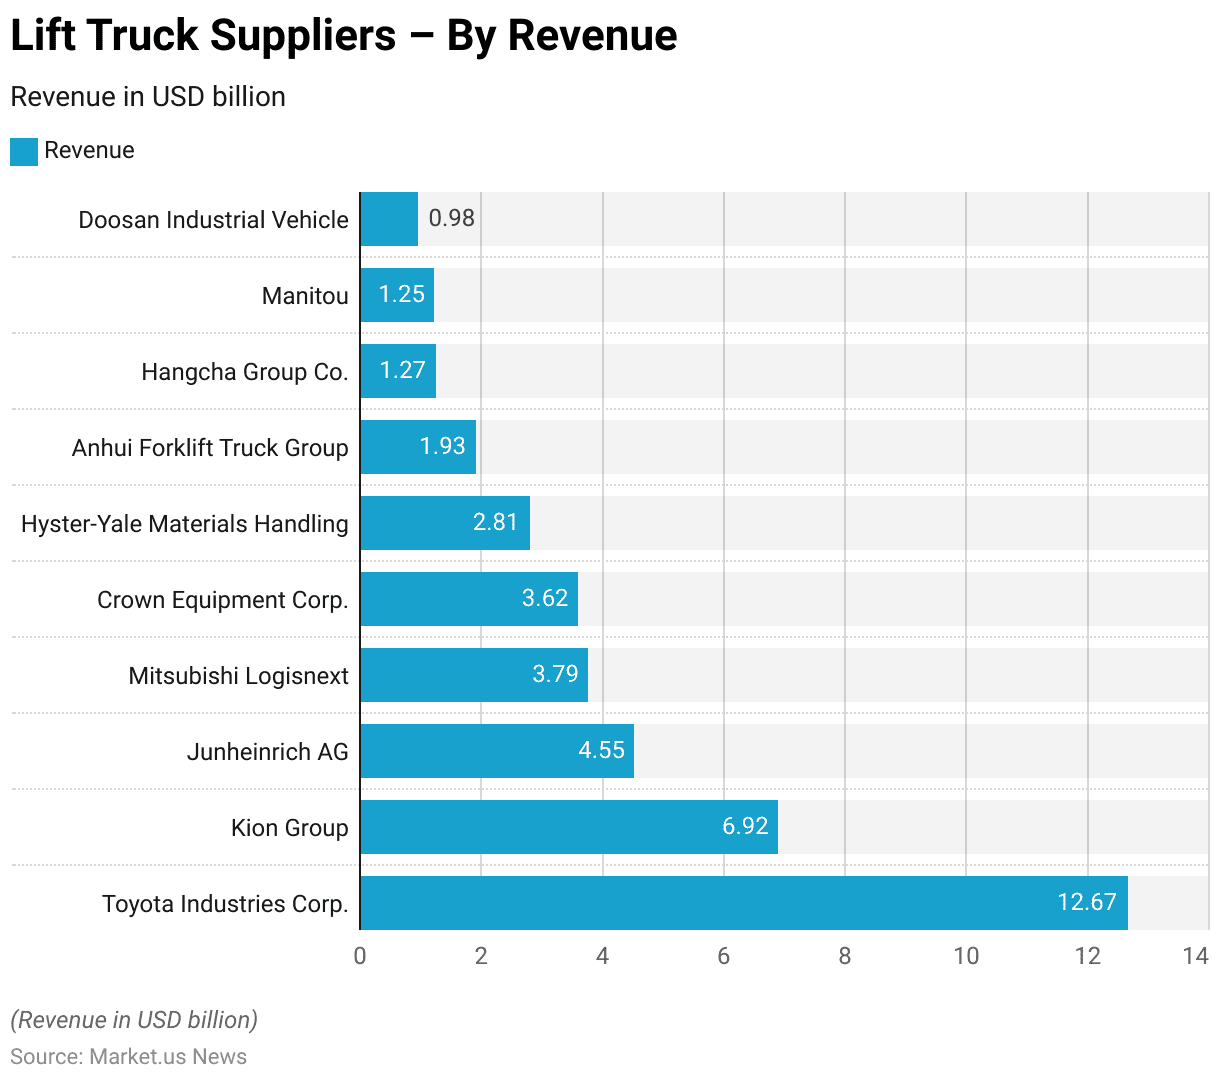
- In fiscal year 2020, Toyota Industries Corporation emerged as the world’s leading lift truck supplier based on revenue, generating USD 12.67 billion.
- Kion Group followed as the second-largest supplier, with a revenue of USD 6.92 billion. Junheinrich AG secured the third position with revenues amounting to USD 4.55 billion.
- Mitsubishi Logisnext and Crown Equipment Corporation also featured prominently among the top suppliers, with revenues of USD 3.79 billion and USD 3.62 billion, respectively.
- Hyster-Yale Materials Handling recorded revenues of USD 2.81 billion, placing it among the significant players in the market.
- Anhui Forklift Truck Group generated USD 1.93 billion in revenue, while Hangcha Group Co. and Manitou reported revenues of USD 1.27 billion and USD 1.25 billion, respectively.
- Doosan Industrial Vehicle, with a revenue of USD 0.98 billion, also ranked among the leading lift truck suppliers globally.
- This financial performance underscores the competitive landscape and the substantial market presence of these companies in the lift truck industry.
(Source: Statista)
Forklift Export Statistics
Forklift Exports- By Country Statistics
Major Exporters
- In 2022, the export value of forklift trucks and other trucks fitted with lifting or handling equipment was led by China, which exported goods worth USD 6,199.9 million.
- Germany followed as the second-largest exporter with USD 3,921.7 million, while the United States ranked third with exports valued at USD 2,381.7 million.
- Italy and France also featured prominently, exporting USD 1,860.6 million and USD 1,423.5 million worth of equipment, respectively.
- The United Kingdom and Japan were notable exporters as well, with values of USD 1,206.1 million and USD 1,055.7 million.
- The Netherlands and Sweden exported goods worth USD 1,044.7 million and USD 1,023.3 million, respectively. South Korea’s exports stood at USD 951.4 million, while Canada and Ireland exported USD 778.6 million and USD 579.7 million worth of forklift trucks and related equipment.
- Other significant exporters included Belgium (USD 560.9 million), Mexico (USD 410.9 million), and Poland (USD 327.1 million).
- Czechia exported USD 317.2 million worth of equipment, and Spain’s exports were valued at USD 245 million.
- Austria and Finland had export values of USD 196.8 million and USD 177.9 million, respectively.
- Vietnam (USD 136.5 million), Denmark (USD 86.3 million), and the United Arab Emirates (USD 84.7 million) were also notable exporters. India’s export value was USD 67.7 million, and Taiwan’s was USD 63 million.
Minor Exporters
- Malaysia and Thailand exported USD 49 million and USD 43.7 million worth of equipment, respectively.
- Singapore (USD 42.1 million), Turkey (USD 34.1 million), and Brazil (USD 33.7 million) also contributed to the global market.
- South Africa exported USD 29.9 million worth of goods, and Hungary’s exports stood at USD 25.9 million. Australia exported USD 25.1 million, and Bulgaria had an export value of USD 21.4 million.
- Kazakhstan (USD 16.4 million), Norway (USD 15.7 million), and Switzerland (USD 15.7 million) were also part of the market.
- Romania exported goods worth USD 14.1 million, while Portugal and Lithuania had export values of USD 11.5 million and USD 11 million, respectively.
- Croatia’s exports were valued at USD 10.9 million, and Latvia’s at USD 9.3 million. Indonesia (USD 6.8 million), Hong Kong (USD 6.4 million), and Slovenia (USD 6.1 million) were other exporters. Luxembourg also exported goods worth USD 6.1 million.
- Smaller exporters included Slovakia (USD 5.4 million), Estonia (USD 4.5 million), and Ukraine (USD 3.4 million).
- Chile exported goods worth USD 3.3 million, while New Zealand, Saudi Arabia, and Bahrain each had an export value of USD 2.6 million.
- Serbia exported goods worth USD 2.5 million, and Panama and Iran each exported USD 2.3 million worth of equipment.
- Russia’s exports were valued at USD 2.2 million, and Angola’s at USD 2 million.
(Source: Statista)

Forklift Import Statistics
Forklift Imports- By Country Statistics
Major Importers
- In 2022, the United States led the world in imports of forklift trucks and other trucks fitted with lifting or handling equipment, with a total import value of USD 4,487.8 million. Canada followed with imports valued at USD 1,453.5 million, while Germany imported equipment worth USD 1,266.4 million.
- The United Kingdom and France also had significant import values of USD 1,177.9 million and USD 1,167.3 million, respectively. The Netherlands imported USD 1,131.4 million worth of equipment, and Italy’s imports stood at USD 1,037.8 million.
- Other notable importers included Australia (USD 853.7 million), Belgium (USD 789.1 million), and Poland (USD 600.1 million). Spain and Mexico followed with import values of USD 561.1 million and USD 525.4 million, respectively.
- Russia imported USD 505.8 million worth of forklift trucks, while Brazil’s imports amounted to USD 490.5 million. Turkey had an import value of USD 448.9 million, and South Korea’s imports stood at USD 327.8 million.
- Thailand and Argentina imported equipment worth USD 258 million and USD 254.1 million, respectively. South Africa’s imports were valued at USD 253.8 million, and Czechia’s at USD 251.1 million.
- Chile and Austria had import values of USD 245.2 million and USD 218.1 million, respectively. Taiwan and Indonesia both imported around USD 216.7 million worth of equipment, while Switzerland imported USD 216.4 million.
More Insights
- China’s imports were valued at USD 214.1 million, and Malaysia’s at USD 213.9 million. Hungary and Sweden followed with import values of USD 208.7 million and USD 207.9 million, respectively. Israel imported USD 207.6 million worth of equipment, and Denmark’s imports stood at USD 205.3 million. Norway and Vietnam had import values of USD 194 million and USD 180.6 million, respectively.
- New Zealand imported USD 176.7 million worth of forklift trucks, while Romania’s imports were valued at USD 174.7 million. The United Arab Emirates imported USD 164.4 million worth of equipment, and Saudi Arabia’s imports stood at USD 156.7 million. India’s imports were valued at USD 153.7 million, while Singapore’s imported equipment was worth USD 131.8 million.
- Other notable importers included Slovakia (USD 102.2 million), Portugal (USD 101.9 million), and Finland (USD 99.9 million). Ireland imported USD 95.1 million worth of equipment, and Nigeria’s imports were valued at USD 88.3 million. Ukraine imported USD 84.7 million worth of forklift trucks, and Bulgaria’s imports stood at USD 78.1 million.
- The Philippines had an import value of USD 76.8 million, while Lithuania imported USD 71.9 million worth of equipment. Colombia’s imports were valued at USD 69.1 million, and Peru’s at USD 68.2 million. Greece imported equipment worth USD 57.1 million, and Croatia’s imports stood at USD 56.6 million.
Minor Importers
- Kazakhstan imported USD 53.4 million worth of forklift trucks, while Morocco and Qatar imported equipment valued at USD 51.4 million and USD 51.2 million, respectively. Slovenia’s imports were worth USD 50.5 million, and Latvia’s stood at USD 46.5 million. Serbia imported equipment worth USD 45.7 million, and Japan’s imports were valued at USD 36.9 million.
- Hong Kong and Ecuador had import values of USD 35.4 million and USD 33.1 million, respectively. Egypt imported USD 31.9 million worth of equipment, while Iraq’s imports stood at USD 30.9 million. Luxembourg imported USD 30.8 million worth of forklift trucks, and the Democratic Republic of Congo’s imports were valued at USD 30 million.
- Costa Rica and Estonia had import values of USD 29.6 million and USD 29 million, respectively. Angola imported equipment worth USD 27.7 million, and Tunisia’s imports stood at USD 27.2 million. Uzbekistan and Bangladesh imported forklift trucks worth USD 25.8 million and USD 24.3 million, respectively.
- Algeria’s imports were valued at USD 23.8 million, while Iceland imported equipment worth USD 23.5 million. Uruguay’s imports stood at USD 21.9 million, and Iran imported forklift trucks worth USD 20.4 million. Pakistan and Ghana had import values of USD 19.6 million and USD 17.8 million, respectively.
More Insights
- Kuwait imported USD 17.4 million worth of equipment, while Kenya and Oman each imported equipment valued at USD 17.3 million and USD 17.2 million, respectively. Honduras also had an import value of USD 17.2 million. Panama’s imports were worth USD 16.8 million, and Papua New Guinea imported equipment valued at USD 15.9 million.
- Belarus and Tanzania had import values of USD 15.7 million and USD 15.5 million, respectively. The Dominican Republic imported equipment worth USD 14.3 million, and Bosnia and Herzegovina imported forklift trucks valued at USD 13.8 million. El Salvador’s imports stood at USD 13.6 million, and Cambodia’s at USD 13.3 million.
- Guatemala and Paraguay had import values of USD 13.2 million and USD 13.1 million, respectively. Senegal imported equipment worth USD 12.7 million, and Zimbabwe’s imports were valued at USD 12.4 million. Moldova imported USD 12.1 million worth of forklift trucks, and Azerbaijan’s imports stood at USD 11.7 million.
- Finally, Mozambique imported equipment worth USD 11.3 million, reflecting a broad global demand for forklift trucks and other material handling equipment across various countries and regions.
(Source: Statista)

Forklift Shipments Statistics
Lift Truck Shipment Trends
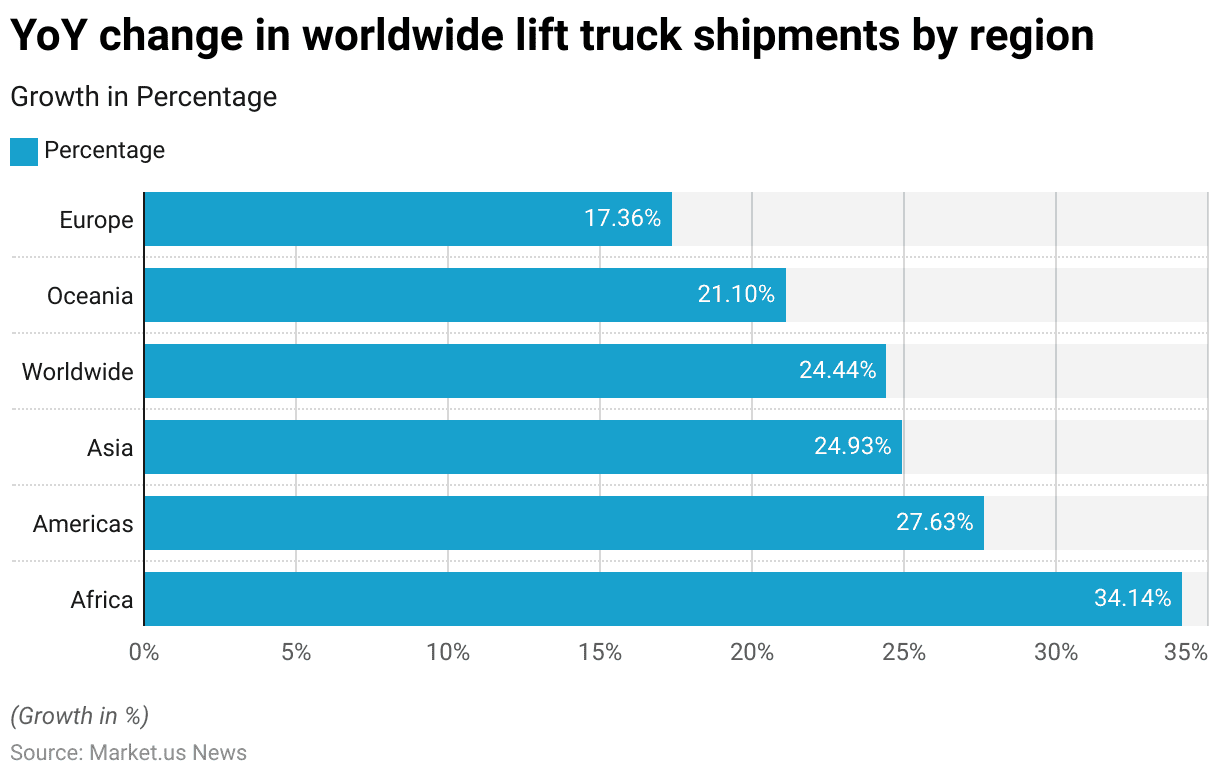
- In 2021, the global lift truck market experienced varying degrees of year-on-year growth across different regions.
- Africa led the market with a substantial percentage increase of 34.14%. Highlighting the region’s significant expansion in lift truck shipments.
- The Americas followed with a notable growth rate of 27.63%. Indicating strong market performance in North, Central, and South America.
- Asia also showed considerable growth, with a year-on-year increase of 24.93%. Reflecting the region’s robust industrial activities and increasing demand for material-handling equipment.
- On a worldwide scale, lift truck shipments grew by 24.44%, underscoring the overall global market expansion.
- Oceania experienced a 21.1% increase in lift truck shipments, demonstrating steady growth in this region.
- Europe had the lowest percentage growth among the regions listed, with a 17.36% increase. Yet it still indicated positive market momentum in the European market.
- This diverse growth pattern across regions highlights the global demand for lift trucks and the varying rates of market development worldwide.
(Source: Statista)
Forklift Production Trends Statistics
Volume for Forklift Production Statistics
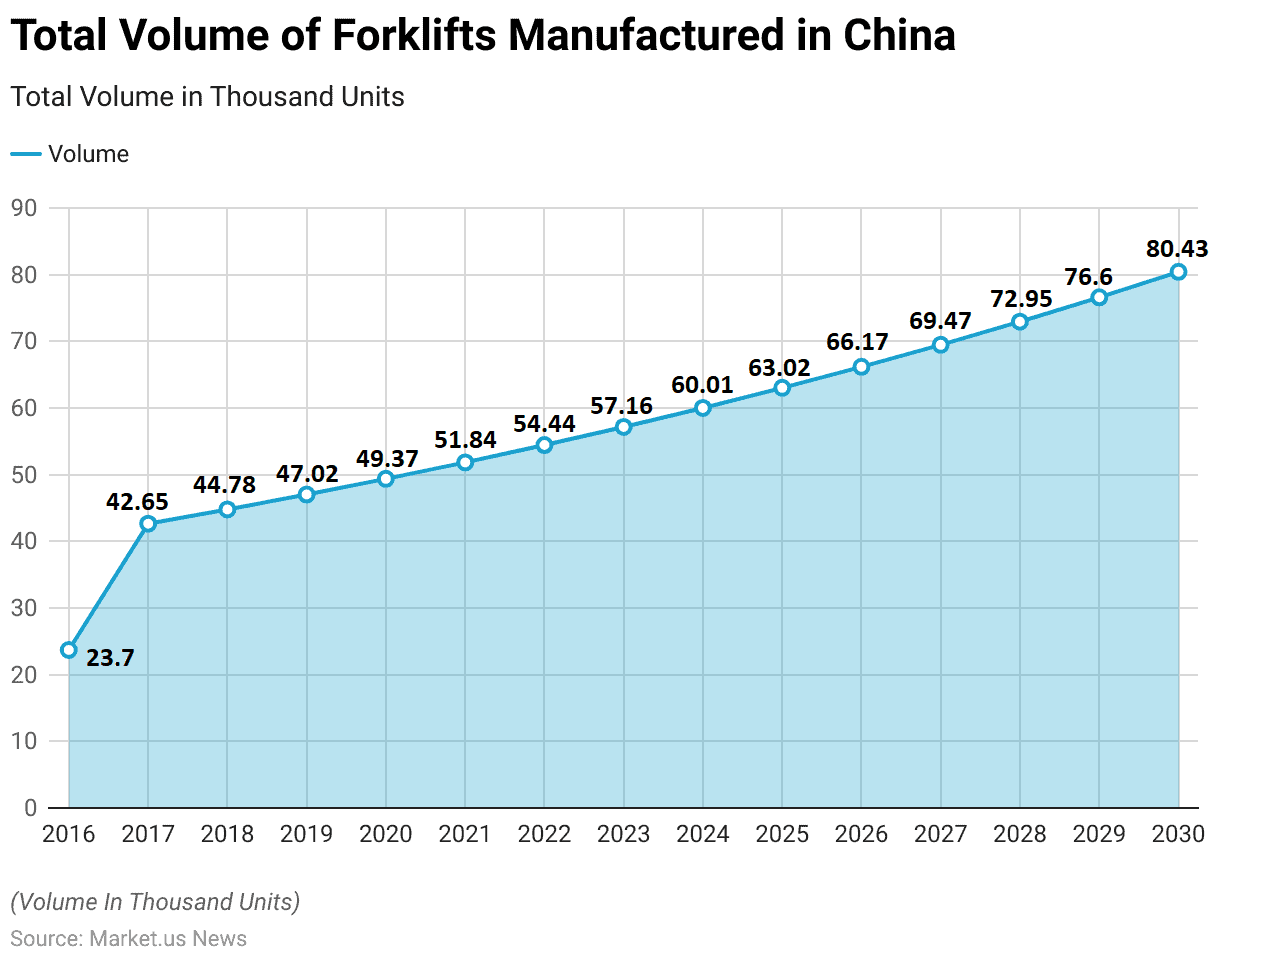
- The total volume of forklifts manufactured in China has seen a significant upward trend from 2016 to 2030.
- In 2016, the production volume was 23,700 units, which more than doubled to 42,650 units by 2017.
- This growth continued steadily, with 44,780 units produced in 2018 and 47,020 units in 2019.
- The year 2020 saw production increase to 49,370 units.
- By 2021, the production volume had risen to 51,840 units, further increasing to 54,440 units in 2022.
- The upward trajectory persisted, with 57,160 units manufactured in 2023 and 60,010 units in 2024.
- The production volume reached 63,020 units in 2025 and 66,170 units in 2026.
- The following years continued to reflect this growth trend, with 69,470 units produced in 2027, 72,950 units in 2028, and 76,600 units in 2029.
- By 2030, the production volume is projected to reach 80,430 units.
- This continuous increase in forklift manufacturing underscores China’s expanding industrial capabilities and the growing demand for material-handling equipment both domestically and globally.
(Source: Statista)
Challenges and Concerns
Injury Crashes
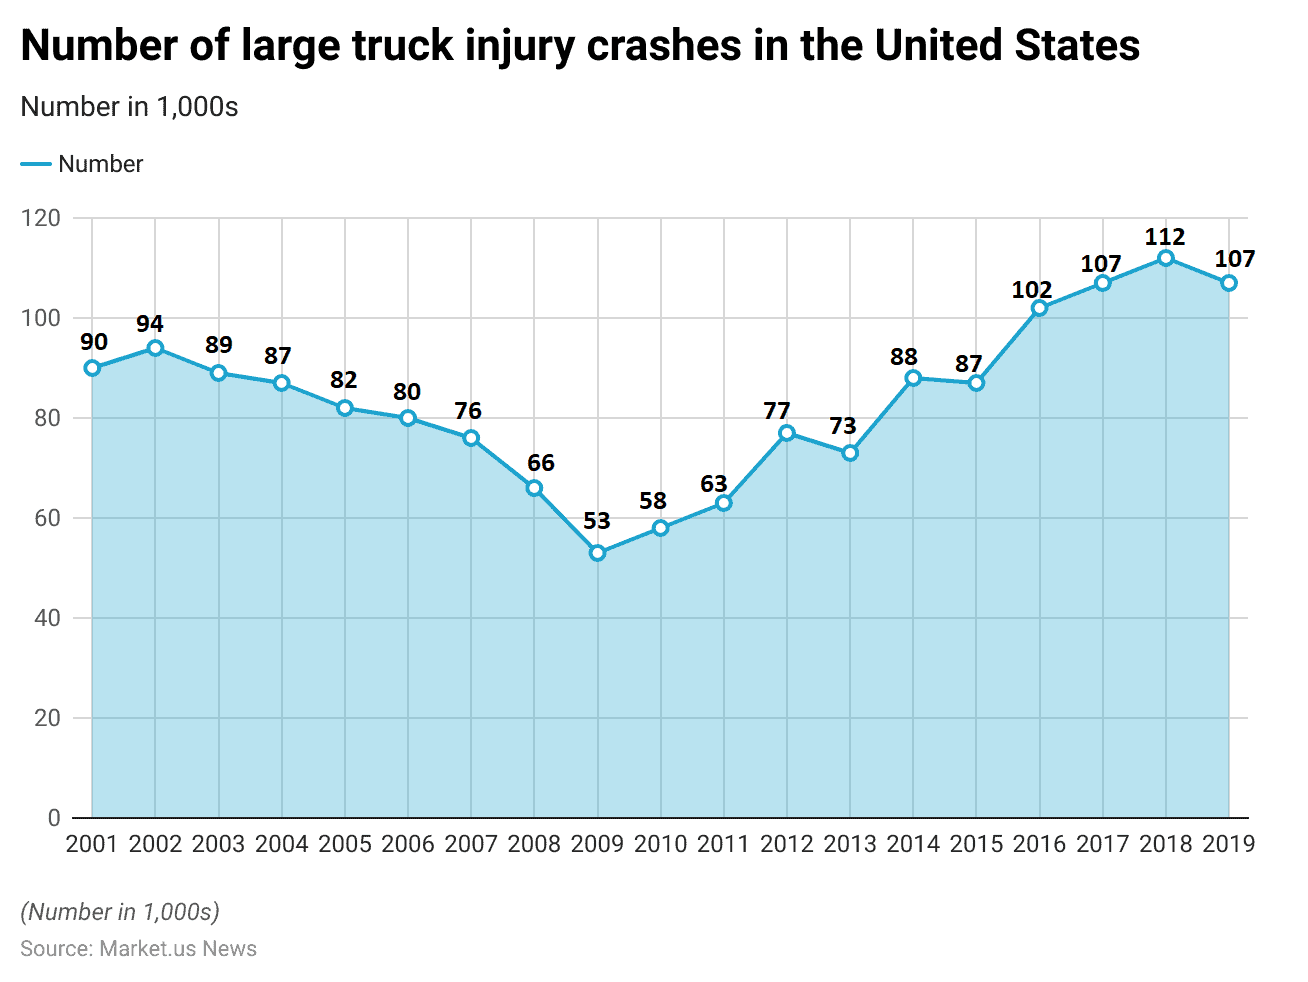
- The number of large truck injury crashes in the United States has shown fluctuations from 2001 to 2019.
- In 2001, 90,000 reported injury crashes involving large trucks.
- This number increased to 94,000 in 2002 but slightly decreased to 89,000 in 2003.
- The number continued to decline gradually, reaching 87,000 in 2004 and 82,000 in 2005.
- By 2006, the number of large truck injury crashes further decreased to 80,000 and continued this downward trend, dropping to 76,000 in 2007 and 66,000 in 2008.
- The lowest point was in 2009, with 53,000 reported injury crashes.
- However, there was a slight increase in 2010 to 58,000 and further to 63,000 in 2011.
- The trend reversed in 2012, with an increase to 77,000 injury crashes, followed by a decrease to 73,000 in 2013.
- In 2014, the number rose again to 88,000, then slightly declined to 87,000 in 2015.
- The subsequent years saw a significant increase, with 102,000 crashes in 2016 and 107,000 in 2017.
- The peak was in 2018, with 112,000 large truck injury crashes, before a slight decline to 107,000 in 2019.
- This data indicates a variable trend in large truck injury crashes over the years, with notable increases in the latter part of the decade.
(Source: Statista)
Regulations for Forklift Statistics
- Forklift regulations vary significantly across countries to ensure safety and compliance in industrial operations.
- In the United States, the Occupational Safety and Health Administration (OSHA) enforces standards such as 29 CFR 1910.178. Mandating comprehensive training and regular safety checks for forklift operators.
- The United Kingdom adheres to the Health and Safety at Work Act, along with the Lifting Operations and Lifting Equipment Regulations (LOLER) and Provision and Use of Work Equipment Regulations (PUWER), which emphasize proper training and equipment maintenance.
- In Canada, similar safety protocols are outlined in the Occupational Safety and Health Act and Regulation 851, requiring competent training and regular inspections.
- Australia categorizes forklift operations as high-risk work, necessitating specific licenses for different types of forklifts (LF and LO licenses).
- Compliance with these regulations is essential for minimizing workplace accidents and legal penalties.
(Sources: Forklift License Guide, TCM, US Department of Labor – Occupational Safety and Health Administration, AAA Forklifts)
Recent Developments
Acquisitions and Mergers:
- Toyota Industries acquires Vanderlande: In early 2023, Toyota Industries acquired Vanderlande, a leading provider of material handling solutions, for $1.2 billion. This acquisition aims to enhance Toyota’s forklift and automation solutions by integrating Vanderlande’s advanced warehousing technologies.
- Hyster-Yale acquires Maximal Forklift: Hyster-Yale completed its acquisition of Maximal Forklift for $400 million in mid-2023. This merger is expected to expand Hyster Yale’s product portfolio and strengthen its market presence in the global forklift industry.
New Product Launches:
- Toyota’s Lithium-Ion Forklifts: In early 2024, Toyota launched a new line of lithium-ion forklifts designed for improved efficiency and lower emissions. These forklifts offer longer battery life, faster charging times, and enhanced performance, catering to environmentally conscious consumers.
- Crown Equipment’s V-Force Forklifts: Crown Equipment introduced the V-Force series in mid-2023, featuring advanced energy storage systems and real-time performance monitoring. This product line aims to enhance productivity and reduce operating costs in material handling operations.
Funding:
- KION Group secures $500 million: In 2023, KION Group, a leading manufacturer of industrial trucks and supply chain solutions. Raised $500 million to invest in R&D, expand its product line, and enhance its global distribution network.
- Jungheinrich raises $300 million: Jungheinrich, a prominent forklift manufacturer, secured $300 million in early 2024 to develop new technologies. Improve automation capabilities, and expand its market reach in Europe and North America.
Technological Advancements:
- Autonomous Forklifts: Advances in automation are being integrated into forklifts to develop autonomous forklifts capable of navigating warehouses. Loading and unloading goods, and performing tasks without human intervention. These innovations aim to improve efficiency and safety in material handling.
- Telematics and IoT Integration: The development of telematics and IoT technologies is enhancing forklift operations by enabling real-time data collection, remote monitoring, and predictive maintenance. These advancements help reduce downtime and optimize fleet management.
Market Dynamics:
- Growth in Forklift Market: The global forklift market is projected to grow at a CAGR of 6.7% from 2023 to 2028. Driven by increasing demand for efficient material handling solutions, advancements in automation, and the growth of e-commerce and logistics industries.
- Rising Demand for Electric Forklifts: There is a significant increase in demand for electric forklifts due to their lower operating costs, reduced emissions, and compliance with environmental regulations. This trend is contributing to the overall growth of the forklift market.
Regulatory and Strategic Developments:
- EU Emissions Standards: The European Union updated its emissions standards for industrial vehicles, including forklifts. In early 2024 to promote the use of cleaner energy sources and reduce environmental impact. These regulations encourage manufacturers to develop more sustainable forklift solutions.
- US OSHA Safety Guidelines: The US Occupational Safety and Health Administration (OSHA) issued new safety guidelines in 2023 to improve the safe operation of forklifts, focusing on operator training, equipment maintenance, and workplace safety protocols.
Research and Development:
- Advanced Battery Technologies: R&D efforts are focusing on developing advanced battery technologies. Such as solid-state batteries and fast-charging systems, to enhance the performance and efficiency of electric forklifts. These innovations aim to extend battery life and reduce charging times.
- Human-Machine Collaboration: Researchers are exploring human-machine collaboration in material handling. Developing systems that enable forklifts to work alongside human operators more effectively, improving safety and productivity in warehouses.
Conclusion
Forklift Statistics – The global forklift market has shown consistent growth. Driven by increasing demand for efficient material handling solutions across various industries.
From 2018 to 2032, both production and market volume have risen significantly. With key players like Toyota Industries Corporation and Kion Group leading the market.
The retail and e-commerce sector, particularly in Asia Pacific, North America, and Europe, has been a major contributor to this growth.
The adoption of electric forklifts has also increased due to their environmental benefits. Overall, the forklift market is set to continue expanding, supported by technological advancements and the rise of e-commerce.
FAQs
A forklift is a powered industrial truck used to lift and move materials over short distances. It is commonly used in warehouses, manufacturing plants, and construction sites.
The main types of forklifts include counterbalance forklifts, reach trucks, pallet jacks, rough terrain forklifts, and order pickers. Each type is designed for specific applications and environments.
Batteries power electric forklifts and are ideal for indoor use due to their zero emissions and lower noise levels. Internal combustion engine forklifts, powered by diesel, gasoline, or propane, are typically used outdoors or in well-ventilated areas due to their higher power and emissions.
Key factors to consider include the type of load, lifting height, indoor or outdoor use, power source (electric or internal combustion), maneuverability, and safety features.
Regular maintenance is crucial for safety and efficiency. It is recommended that daily checks be performed. Preventive maintenance should be scheduled every 250 hours of operation, and thorough inspections should be conducted annually.


