Table of Contents
- Introduction
- Editor’s Choice
- Gaming Consoles Market Overview
- Console and PC Gaming Content Market Statistics
- Gaming Console Sales Statistics
- Gaming Console Production Statistics
- Revenue Generation Through Gaming Consoles
- Gaming Console Price Statistics
- Demographics of Gaming Console Users Statistics
- Video Gaming Penetration Statistics
- Gaming Console Usage Statistics
- Consumer Preferences and Trends
- Media Activities Undertaken While Playing Videogames
- Regulations and Laws for Gaming Console Statistics
- Recent Developments
- Conclusion
- FAQs
Introduction
Gaming Console Statistics: A gaming console is a specialized device designed for playing video games, available in several types.
Such as home consoles (e.g., PlayStation, Xbox), handheld consoles (e.g., Nintendo Switch), hybrid consoles (e.g., Nintendo Switch in handheld mode), and emerging cloud gaming devices.
Key components include the processor (CPU), graphics processing unit (GPU), memory (RAM), and storage, which together determine the console’s performance and capacity.
Consoles feature input devices like controllers, support various display and output options, and often include networking capabilities for online gaming.
Additional features may include backward compatibility, multimedia functions, VR support, and subscription services.
The gaming industry continually evolves, incorporating advancements in technology and integrating with other media and entertainment forms.
Editor’s Choice
- The global gaming console market revenue is projected to reach USD 26.7 billion by 2029.
- By 2026, online sales are anticipated to constitute 53.5% of the market. This will increase to 54.6% in 2027, while offline sales are projected to decline to 46.5% and 45.4% in the respective years.
- The global gaming console market is predominantly driven by the residential sector. Which accounts for 67% of the market share.
- The global gaming console market exhibits significant revenue contributions from various countries, with the United States leading at USD 7,848 million.
- As of February 2024, the lifetime sales of video game consoles worldwide reveal significant milestones achieved by various brands. The PlayStation 2 leads with a remarkable 158.7 million units sold.
- As of November 2023, console gaming penetration in the United Kingdom exhibits significant variation across different age groups. The highest penetration is observed among the 16-24 age group, with 47% of respondents engaging in console gaming.
- Several factors significantly influence the decision to purchase a PlayStation, with varying degrees of importance attributed to consumers. The availability of specific games on PlayStation is a critical factor. Deemed very important by 57% of respondents and quite important by 31%, while only 10% consider it not at all important.
Gaming Consoles Market Overview
Global Gaming Console Market Size Statistics
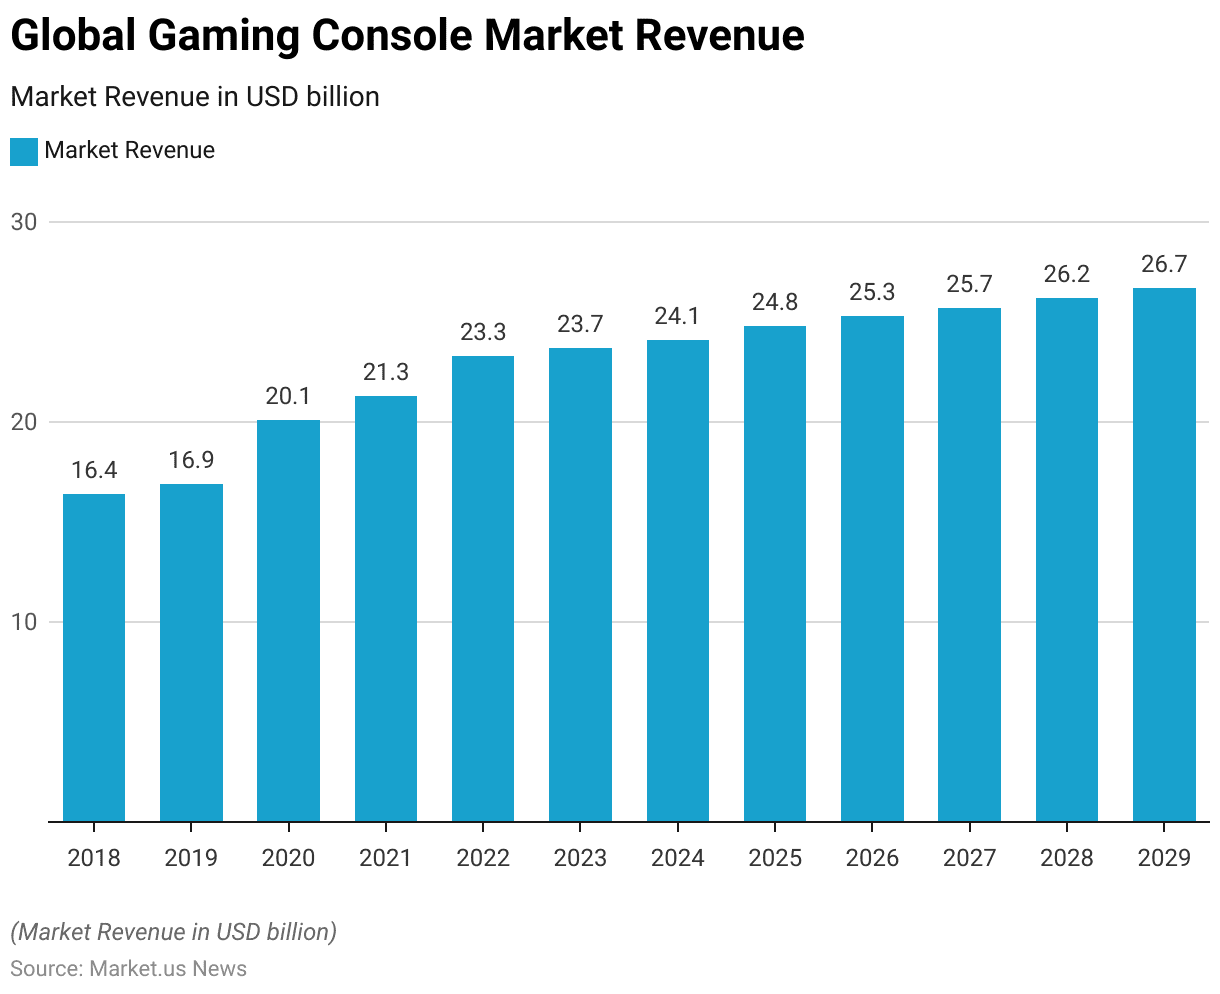
- The global gaming console market has exhibited a steady upward trend in revenue over the past decade at a CAGR of 2.05%.
- In 2018, the market revenue was recorded at USD 16.4 billion, which increased to USD 16.9 billion in 2019.
- A significant jump was observed in 2020, with revenue reaching USD 20.1 billion. Followed by continued growth to USD 21.3 billion in 2021.
- By 2022, the market expanded further to USD 23.3 billion, and in 2023, it reached USD 23.7 billion.
- Projections for the forthcoming years indicate a consistent rise. The market is anticipated to achieve USD 24.1 billion in 2024 and USD 24.8 billion in 2025.
- This growth trajectory is expected to continue, with revenues forecasted to hit USD 25.3 billion in 2026, USD 25.7 billion in 2027, USD 26.2 billion in 2028, and ultimately USD 26.7 billion by 2029.
(Source: Statista)
Global Gaming Console Market Revenue Growth Statistics
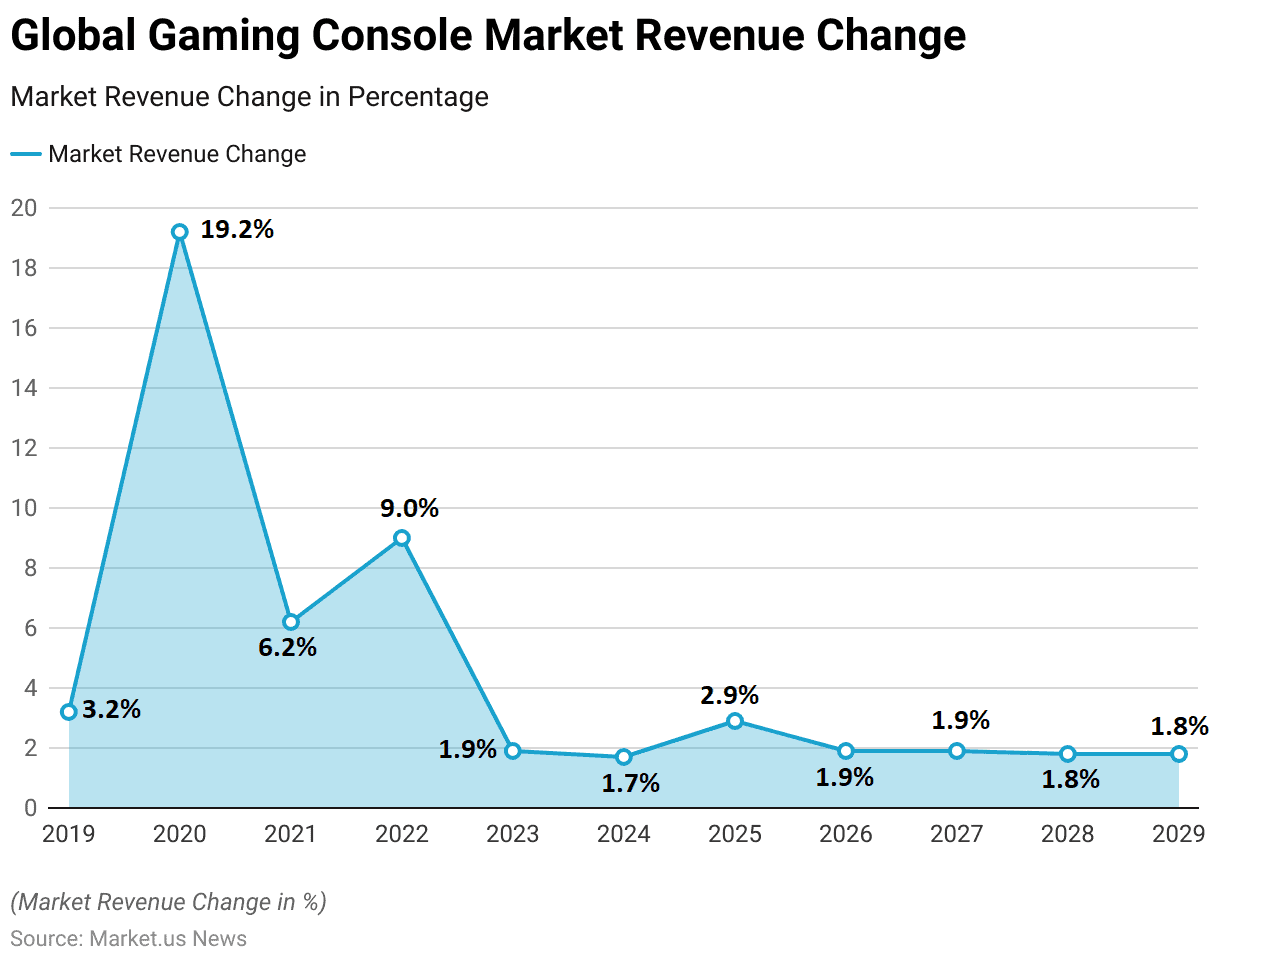
- The global gaming console market has experienced varying rates of revenue growth from 2019 to 2029.
- In 2019, the market saw a moderate increase of 3.2%.
- A substantial surge occurred in 2020, with a remarkable growth rate of 19.2%. Reflecting the heightened demand during that period.
- The growth rate then moderated to 6.2% in 2021 and further to 9.0% in 2022.
- In 2023, the market growth slowed to 1.9%, followed by a slight decrease to 1.7% in 2024.
- The projected growth rates for the following years show a more stable trend. With 2.9% in 2025 and consistent growth rates of 1.9% for both 2026 and 2027.
- The growth rate is expected to slightly taper off to 1.8% for both 2028 and 2029.
(Source: Statista)
Gaming Console Market Revenue – By Type (USD Billion) Statistics
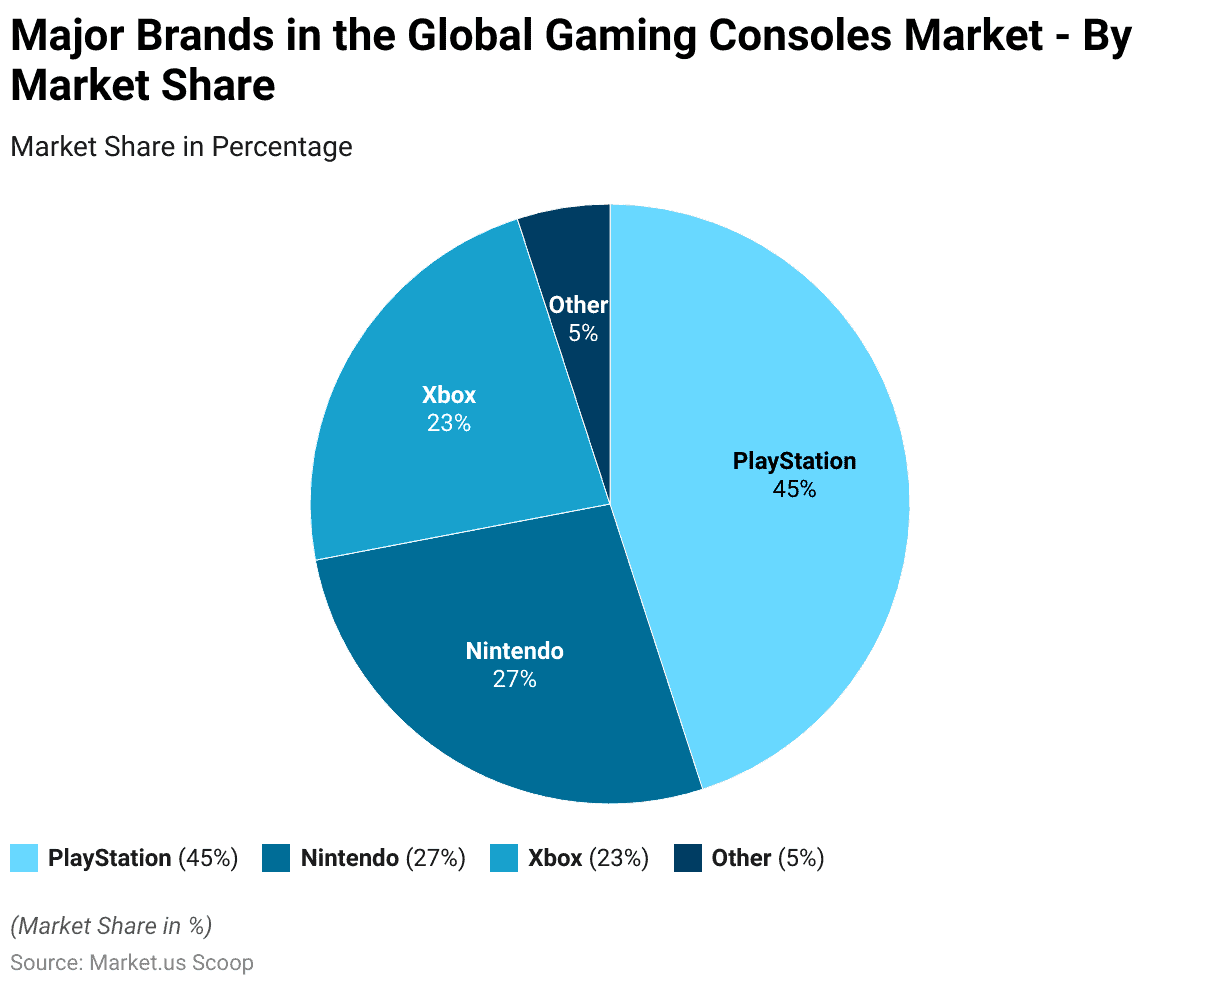
- The global gaming console market revenue by type from 2023 to 2025 demonstrates various trends in different segments.
- In 2023, the revenue from physical hardware is USD 19 billion. Which is expected to decrease slightly to USD 18 billion in 2024 before returning to USD 19 billion in 2025.
- Revenue from physical software is USD 8 billion in 2023 but is projected to decline to USD 6 billion in both 2024 and 2025.
- The digital full-game segment remains stable, with a consistent revenue of USD 8 billion annually from 2023 to 2025.
- Add-on content shows significant growth, with revenues increasing from USD 15 billion in 2023 to USD 17 billion in 2024 and reaching USD 19 billion in 2025.
- The subscription segment also sees steady growth. Starting at USD 10 billion in 2023 and rising to USD 11 billion in both 2024 and 2025.
- These figures highlight a trend towards increasing revenues in digital and subscription-based gaming content. While physical software sales are expected to decline and physical hardware sales remain relatively stable.
(Source: Statista)
Global Gaming Consoles Market Share – By Sales Channel Statistics
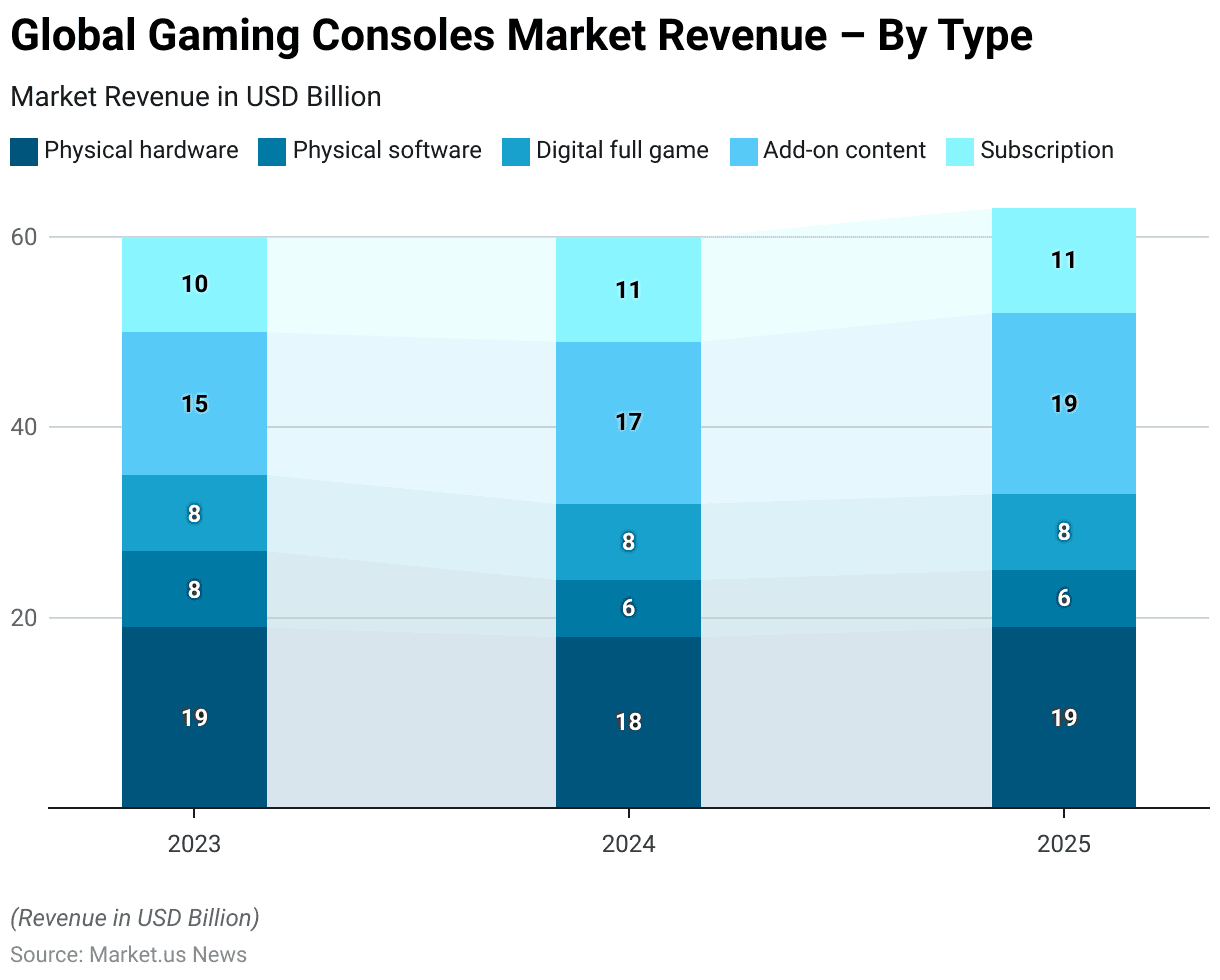
- The global gaming console market has undergone a significant shift in its sales channels from 2018 to 2027.
- In 2018, offline sales dominated the market with a share of 73.6%, while online sales accounted for 26.4%.
- This trend began to change in 2019, as offline sales decreased to 68.9% and online sales increased to 31.1%.
- By 2020, the share of online sales had grown substantially to 38.0%, with offline sales dropping to 62.0%.
- A pivotal moment occurred in 2021 when online sales surpassed offline sales for the first time. Capturing 50.6% of the market compared to 49.4% for offline sales.
- In 2022, the balance shifted slightly back, with offline sales at 56.7% and online sales at 43.3%.
- However, the trend towards online sales continued. As 2023 saw online sales rise to 44.6% and offline sales fall to 55.4%.
- Projections indicate that this shift will persist, with online sales expected to account for 48.4% of the market in 2024. Overtaking offline sales by 2025 at 52.7% online versus 47.3% offline.
- By 2026, online sales are anticipated to constitute 53.5% of the market. This will increase to 54.6% in 2027, while offline sales are projected to decline to 46.5% and 45.4% in the respective years.
(Source: Statista)
Global Gaming Consoles Market Share – By End-user Statistics
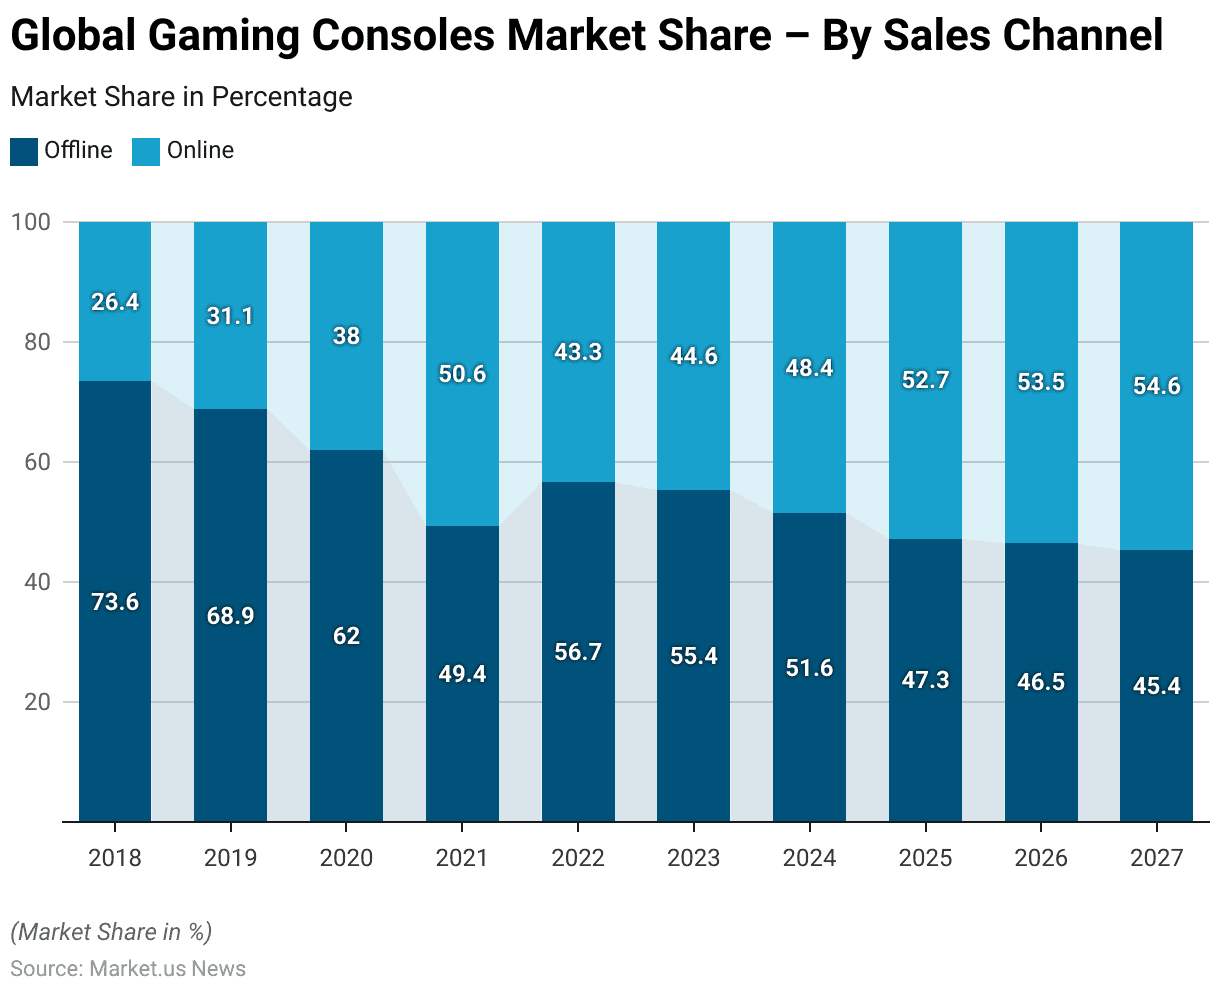
- The global gaming console market is predominantly driven by the residential sector. Which accounts for 67% of the market share.
- The commercial sector, comprising businesses and public establishments, holds the remaining 33% of the market share.
- This distribution highlights the significant demand for gaming consoles among individual consumers for personal use compared to their use in commercial settings.
(Source: market.us)
Key Players in the Global Gaming Consoles Market Statistics
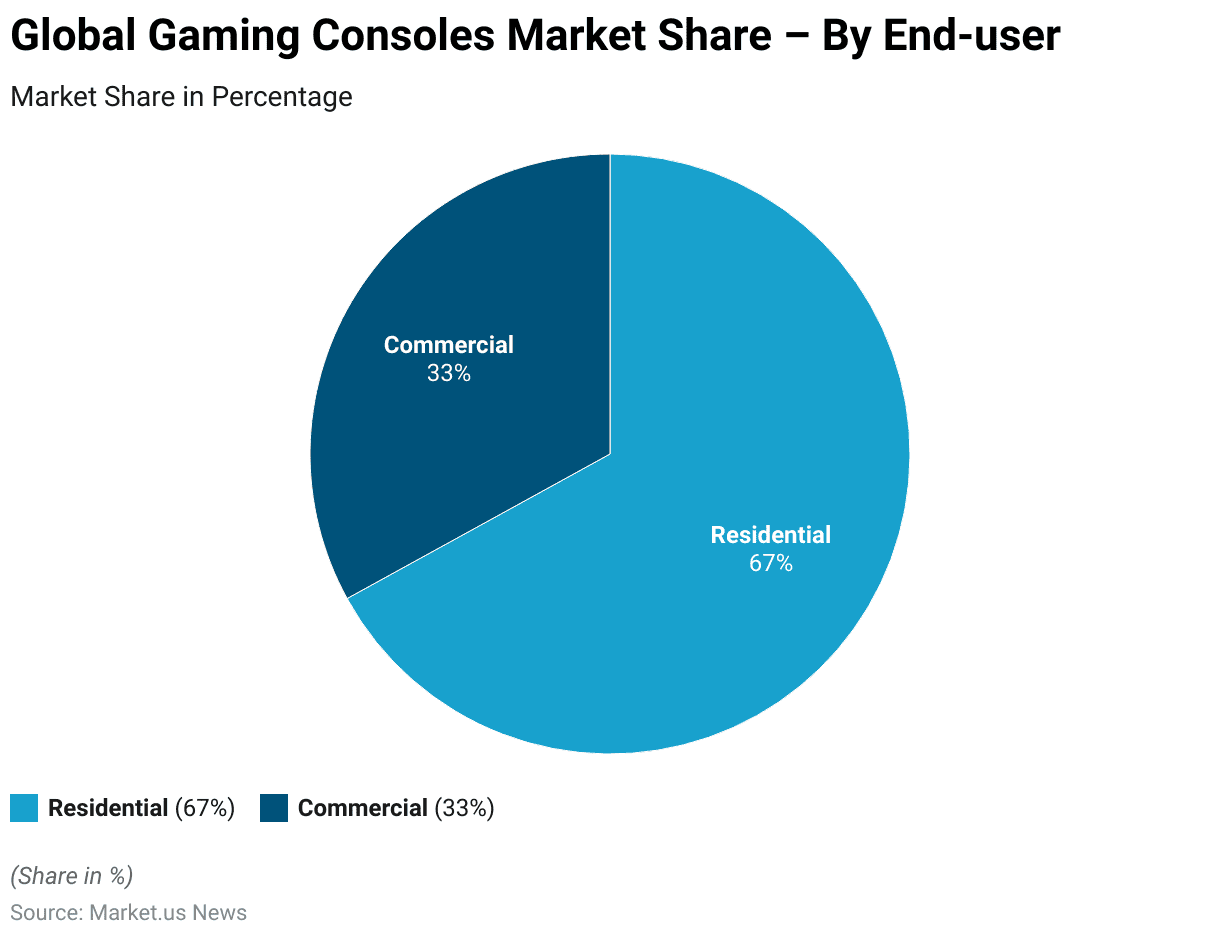
- Three major brands primarily dominate the global gaming console market.
- PlayStation holds the largest market share at 45%, underscoring its strong position and popularity among consumers.
- Nintendo follows with a significant share of 27%, reflecting its enduring appeal and innovative offerings.
- Xbox captures 23% of the market, indicating a solid presence and loyal customer base.
- Other brands collectively account for the remaining 5% of the market. Highlighting the competitive landscape within the gaming console industry.
(Source: Statista)
Regional Analysis of Global Gaming Consoles Market Statistics
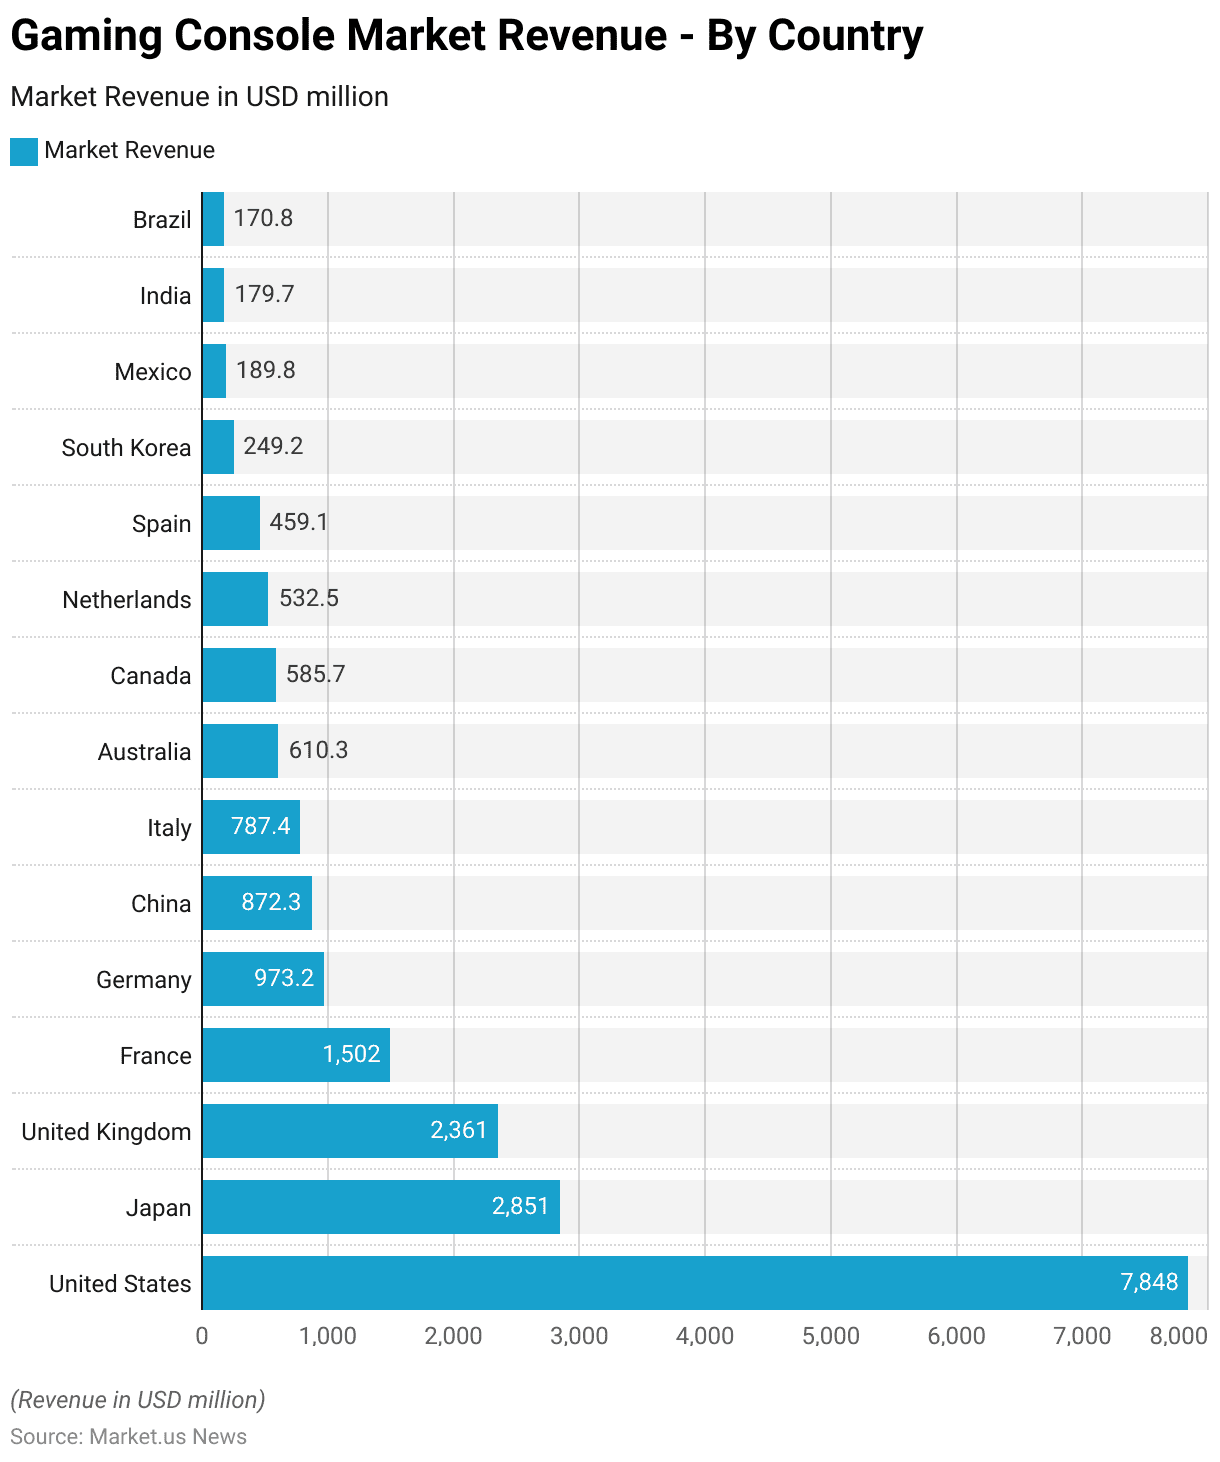
- The global gaming console market exhibits significant revenue contributions from various countries, with the United States leading at USD 7,848 million.
- Japan follows as the second-largest market, generating USD 2,851 million in revenue.
- The United Kingdom holds a strong position with USD 2,361 million. While France and Germany contribute USD 1,502 million and USD 973.2 million, respectively.
- China and Italy also show substantial market revenue, with USD 872.3 million and USD 787.4 million, respectively.
- Australia and Canada contribute USD 610.3 million and USD 585.7 million.
- The Netherlands adds USD 532.5 million to the market, followed by Spain with USD 459.1 million.
- South Korea, Mexico, India, and Brazil represent smaller but notable markets, with revenues of USD 249.2 million, USD 189.8 million, USD 179.7 million, and USD 170.8 million, respectively.
(Source: Statista)
Console and PC Gaming Content Market Statistics
Console & PC Gaming Consumer Market Value Worldwide – By Distribution Statistics
2011-2017
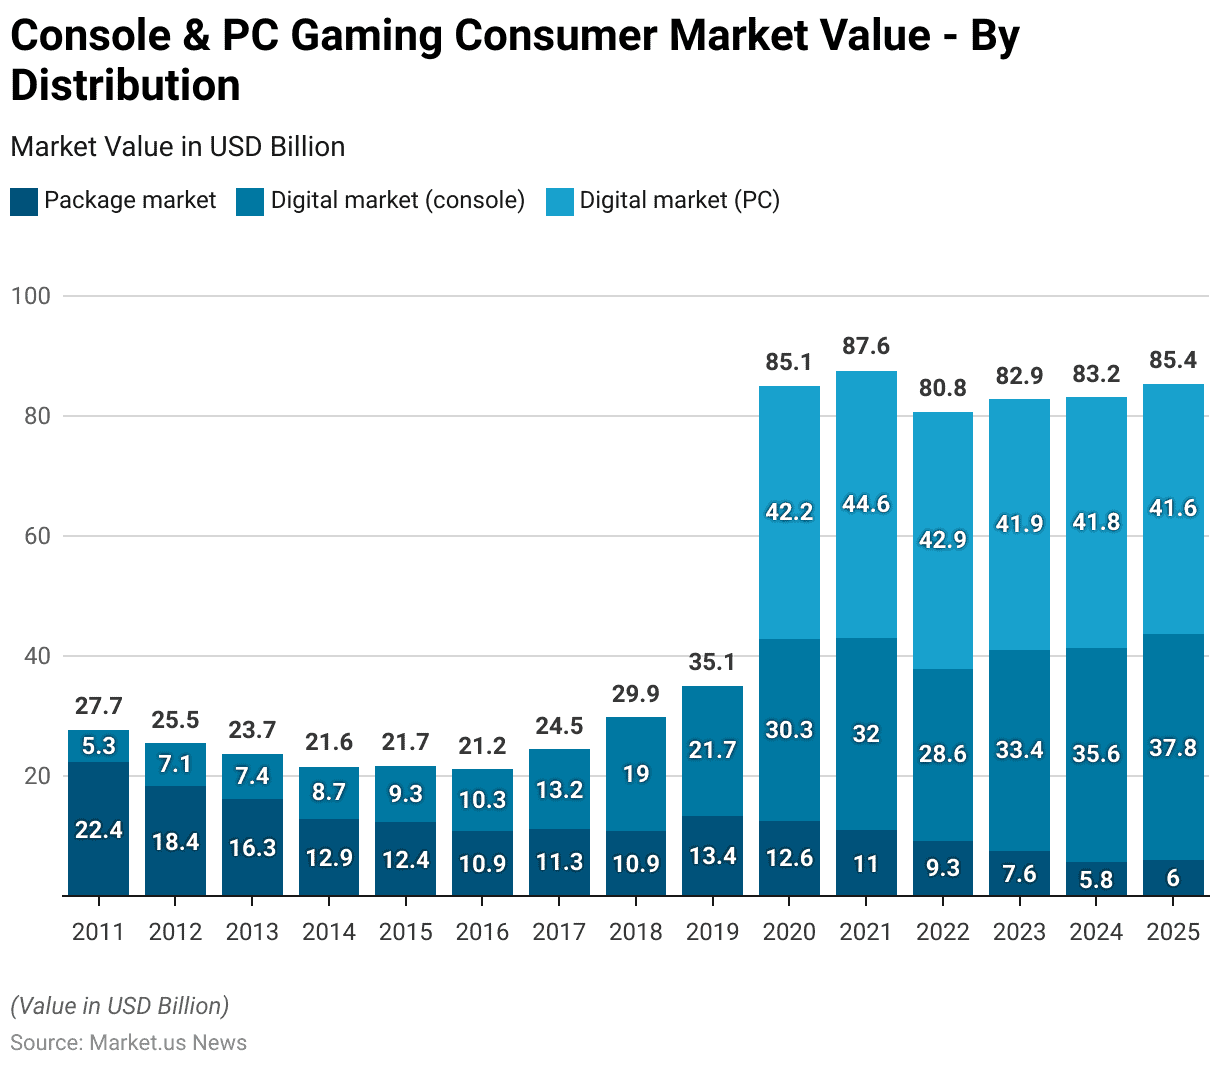
- From 2011 to 2017, the console and PC gaming content market has seen significant shifts in value across different distribution types.
- In 2011, the packaging market was led by a value of USD 22.4 billion. While the digital market for consoles and PCs stood at USD 5.3 billion.
- By 2012, the package market value decreased to USD 18.4 billion. As the digital market for consoles rose to USD 7.1 billion.
- This trend continued in 2013, with package market value further declining to USD 16.3 billion and the digital console market reaching USD 7.4 billion.
- The package market saw a substantial drop in 2014 to USD 12.9 billion. While the digital console market increased to USD 8.7 billion.
- This shift continued through 2015 and 2016, with the package market values falling to USD 12.4 billion and USD 10.9 billion, respectively. While the digital console market grew to USD 9.3 billion and USD 10.3 billion.
- In 2017, the packaging market stabilized at USD 11.3 billion, whereas the digital console market jumped to USD 13.2 billion.
2018-2025
- By 2018, the packaging market had decreased slightly to USD 10.9 billion. However, the digital console market saw significant growth to USD 19 billion.
- The year 2019 marked an increase in the packaging market to USD 13.4 billion and a continued rise in the digital console market to USD 21.7 billion.
- However, in 2020, the package market value dropped to USD 12.6 billion. The digital console and PC markets saw a substantial surge to USD 30.3 billion and USD 42.2 billion, respectively.
- This trend of digital market dominance continued in 2021, with the packaging market declining to USD 11 billion and digital console and PC markets growing to USD 32 billion and USD 44.6 billion.
- In 2022, the packaging market further declined to USD 9.3 billion. Whereas the digital console market experienced a slight decrease to USD 28.6 billion, and the digital PC market decreased to USD 42.9 billion.
- The package market continued its downward trend in 2023 to USD 7.6 billion. With the digital console market increasing to USD 33.4 billion and the digital PC market slightly decreasing to USD 41.9 billion.
- Projections for 2024 and 2025 indicate a continued decline in the packaging market to USD 5.8 billion and USD 6 billion, respectively.
- In contrast, the digital console market is expected to rise to USD 35.6 billion in 2024 and USD 37.8 billion in 2025. The digital PC market is projected to maintain its value at USD 41.8 billion and USD 41.6 billion, respectively.
- This data underscores the ongoing transition from physical to digital distribution in the gaming content market.
(Source: Statista)
Gaming Console Sales Statistics
Lifetime Sales of Video Game Console Statistics
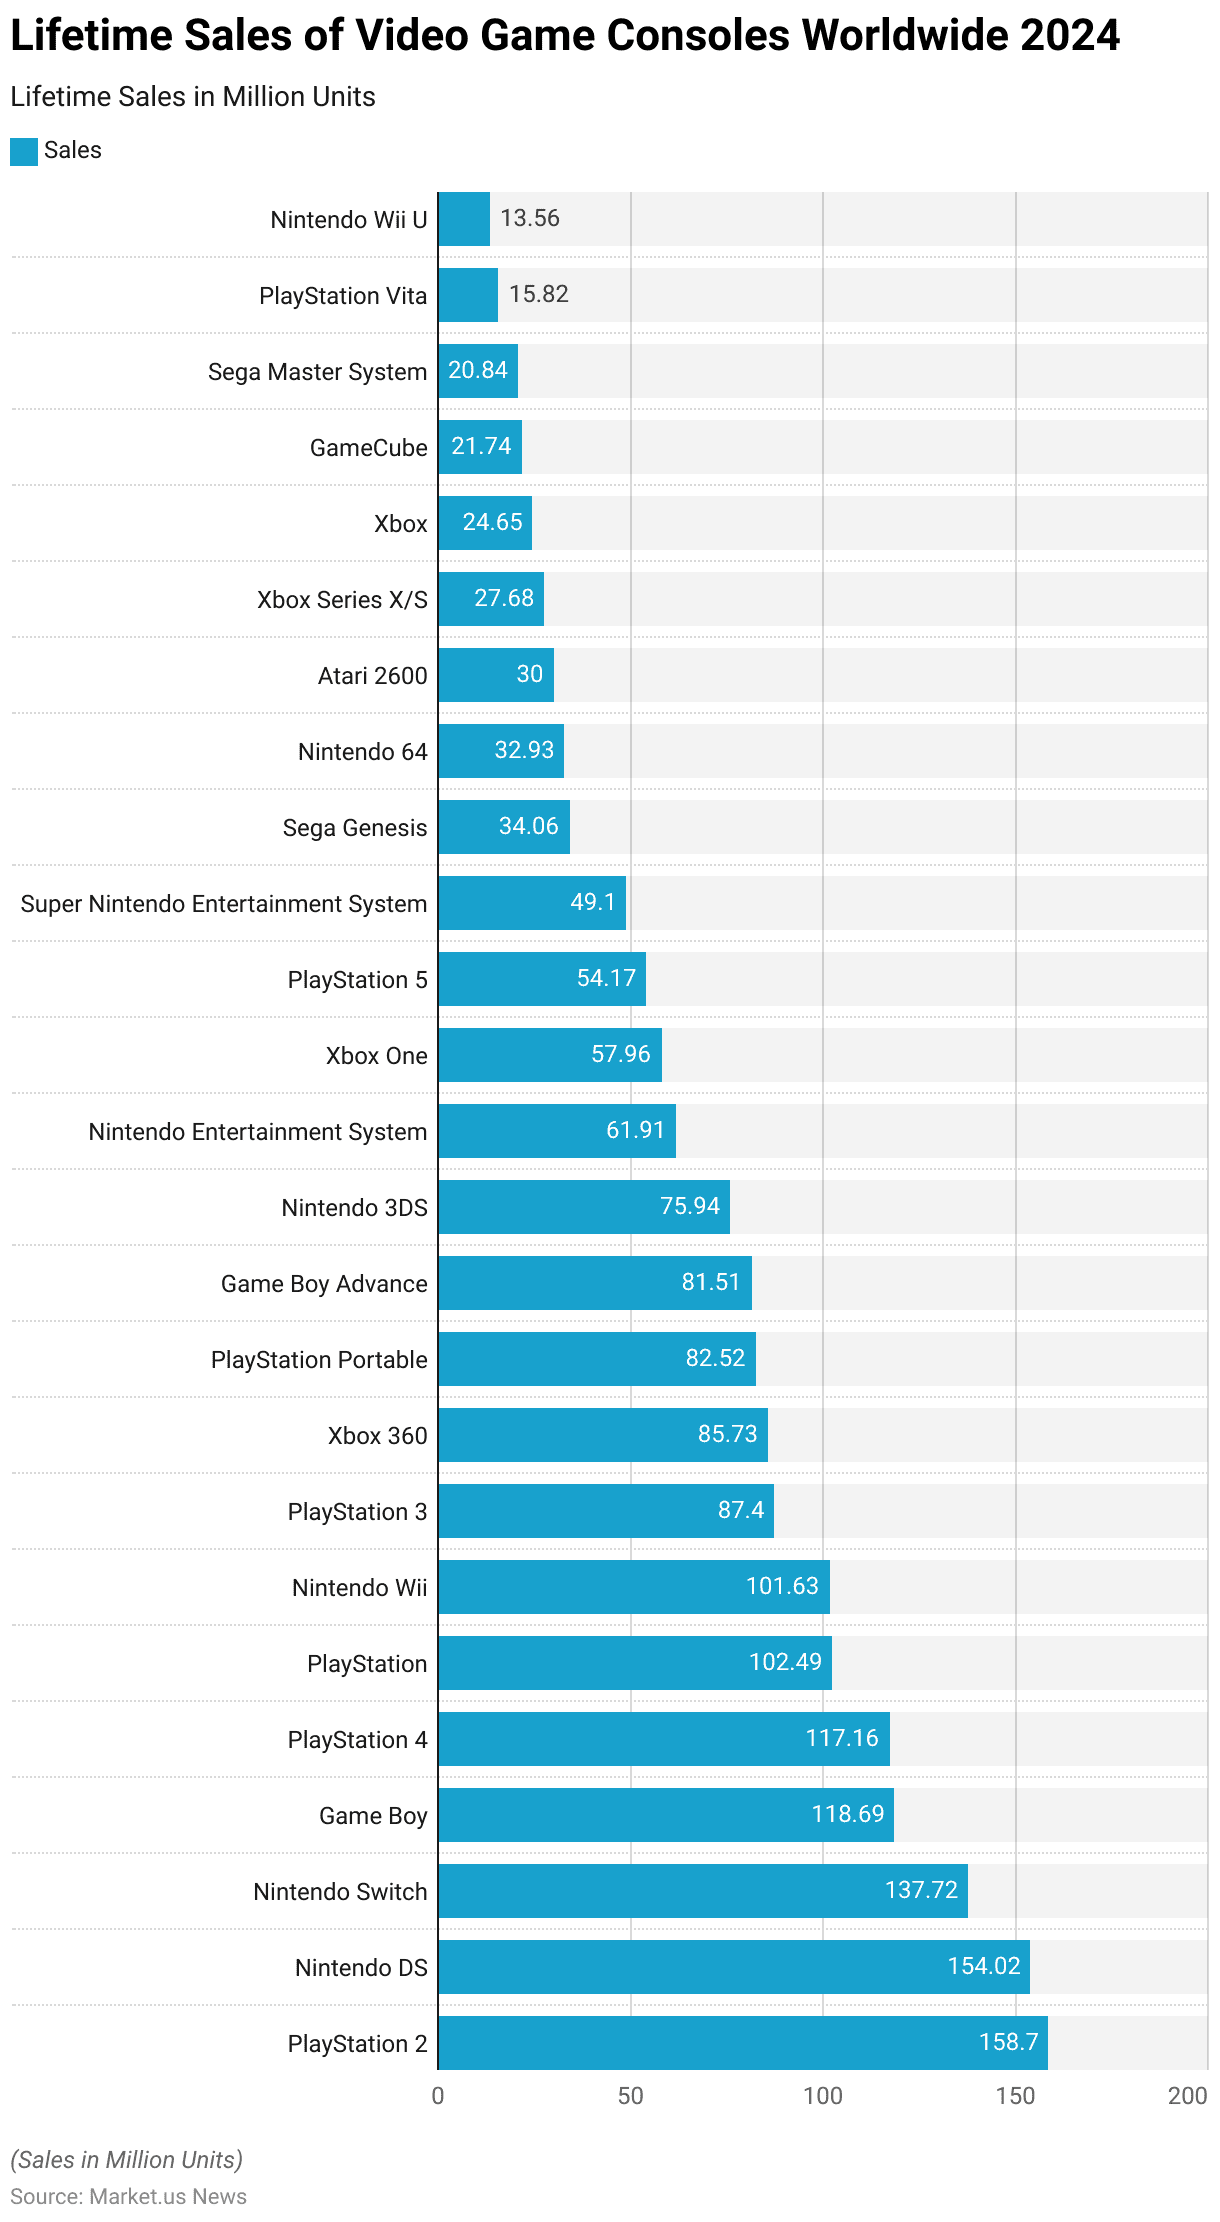
- As of February 2024, the lifetime sales of video game consoles worldwide reveal significant milestones achieved by various brands.
- The PlayStation 2 leads with a remarkable 158.7 million units sold. Followed closely by the Nintendo DS at 154.02 million units.
- The Nintendo Switch has achieved substantial success, with 137.72 million units sold.
- The Game Boy and PlayStation 4 also demonstrate strong sales, with 118.69 million and 117.16 million units, respectively.
- The original PlayStation and Nintendo Wii have each surpassed the 100 million mark, with 102.49 million and 101.63 million units sold, respectively.
- Other notable consoles include the PlayStation 3 with 87.4 million units. Xbox 360 with 85.73 million units, and PlayStation Portable with 82.52 million units.
- The Game Boy Advance and Nintendo 3DS have sold 81.51 million and 75.94 million units, respectively.
- Classic consoles like the Nintendo Entertainment System (61.91 million units) and the Super Nintendo Entertainment System (49.1 million units) maintain a significant presence.
- The Xbox One and PlayStation 5 have reached 57.96 million and 54.17 million units, respectively.
- The Sega Genesis and Nintendo 64 have sold 34.06 million and 32.93 million units.
- Other notable mentions include the Atari 2600 (30 million units), Xbox Series X/S (27.68 million units), and the original Xbox (24.65 million units).
- The GameCube and Sega Master System have sold 21.74 million and 20.84 million units. While the PlayStation Vita and Nintendo Wii U have achieved 15.82 million and 13.56 million units in lifetime sales, respectively.
(Source: Statista)
Gaming Consoles Sales – By Console Type Statistics
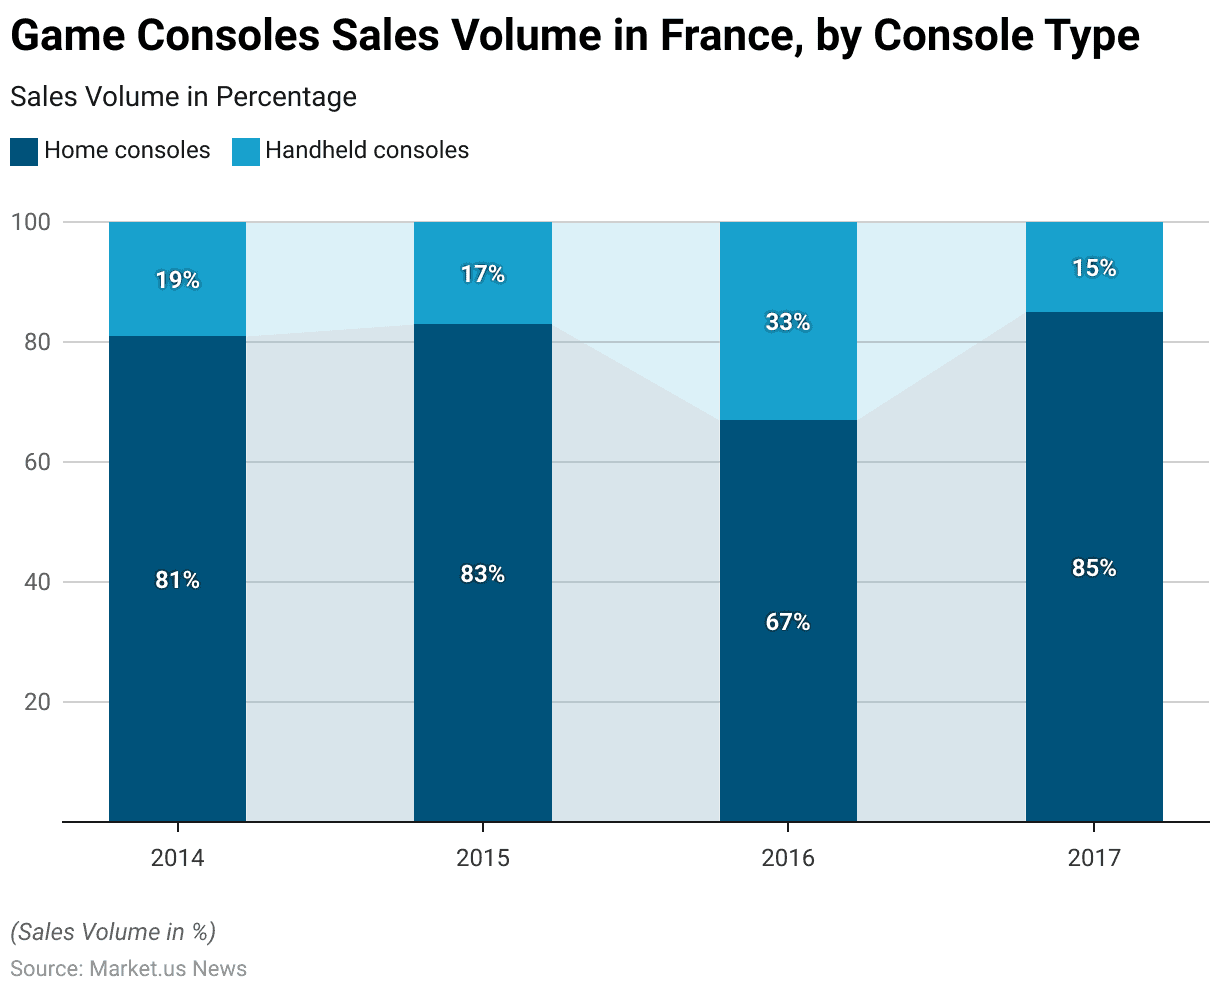
- Between 2014 and 2017, the distribution of video game consoles sold in France exhibited notable trends in the preferences for home consoles versus handheld consoles.
- In 2014, home consoles dominated the market with an 81% share, while handheld consoles accounted for 19%.
- This preference for home consoles increased slightly in 2015, reaching 83%, with handheld consoles comprising 17% of sales.
- However, a significant shift occurred in 2016 when the share of home consoles decreased to 67%, and handheld consoles surged to 33%. Indicating a rising interest in portable gaming devices.
- By 2017, the market had reverted to a stronger preference for home consoles. Which captured 85% of sales, whereas handheld consoles represented 15%.
- This data highlights the fluctuating dynamics in consumer preferences for different types of gaming consoles over the four years.
(Source: Statista)
Gaming Console Production Statistics
Production Volume
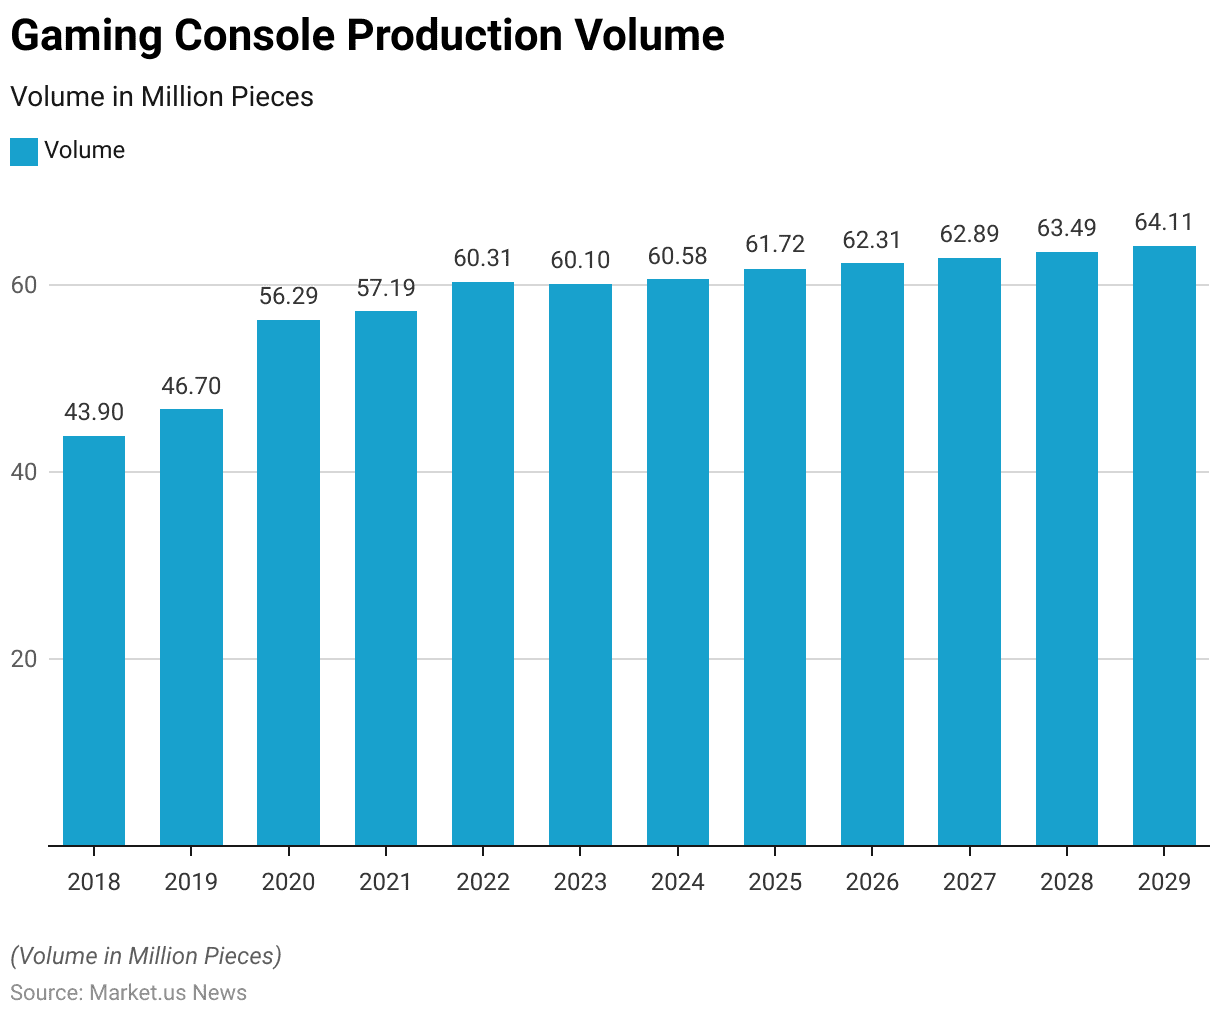
- The production volume of gaming consoles has demonstrated a consistent upward trend from 2018 to 2029.
- In 2018, the production volume was 43.90 million pieces, which increased to 46.70 million pieces in 2019.
- A notable surge occurred in 2020, with production rising to 56.29 million pieces. Followed by a slight increase to 57.19 million pieces in 2021.
- The growth continued in 2022, reaching 60.31 million pieces.
- Although there was a minor decrease to 60.10 million pieces in 2023. Production is projected to rise again to 60.58 million pieces in 2024.
- This upward trend is expected to persist, with production volumes forecasted to reach 61.72 million pieces in 2025, 62.31 million pieces in 2026, and 62.89 million pieces in 2027.
- Further projections indicate continued growth, with 63.49 million pieces expected in 2028 and 64.11 million pieces by 2029.
(Source: Statista)
Change in Production Volume
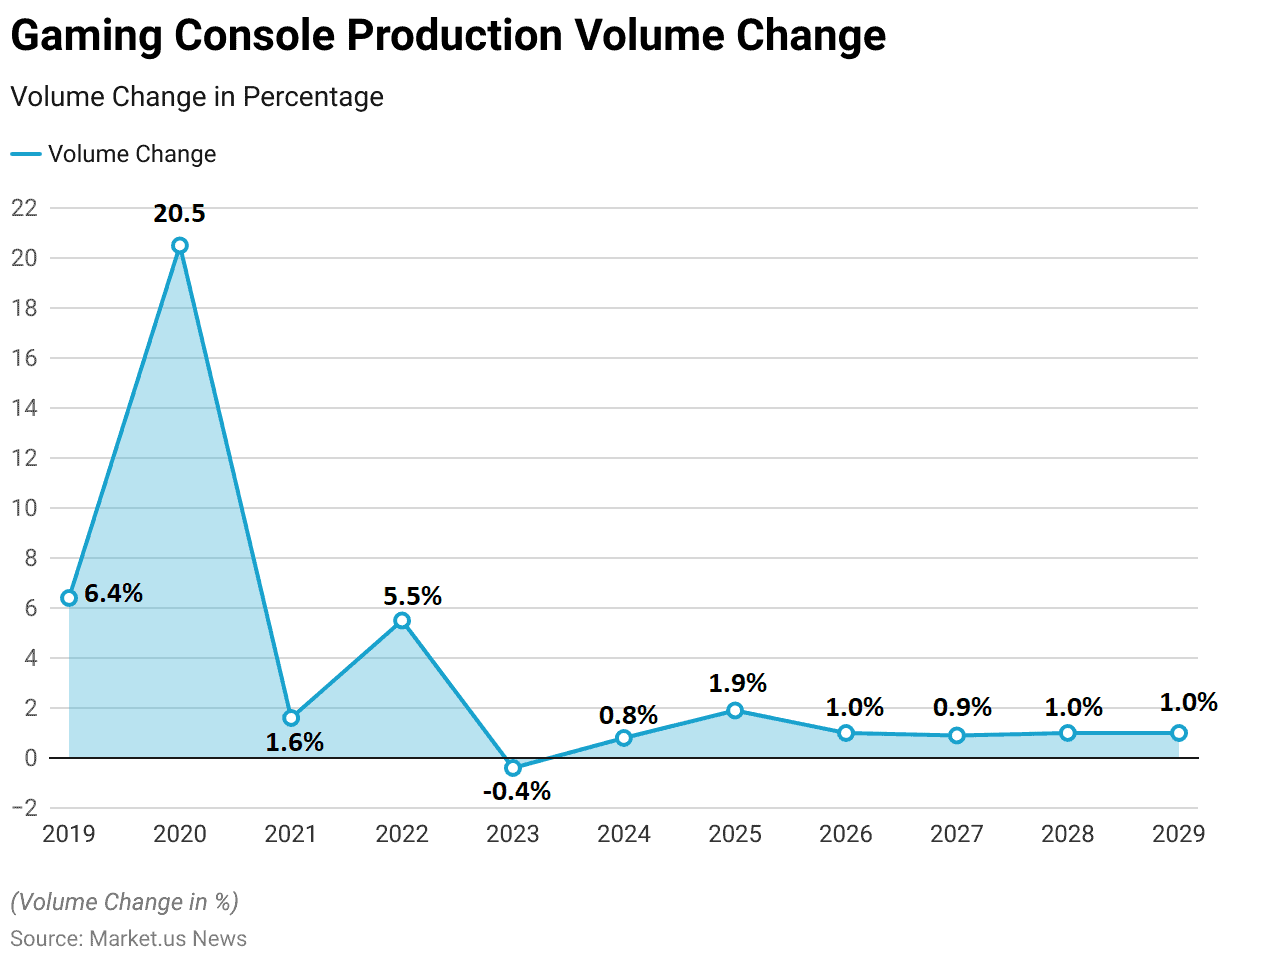
- The gaming console production volume has experienced varying rates of change from 2019 to 2029.
- In 2019, production volume increased by 6.4%. Followed by a substantial growth of 20.5% in 2020, reflecting a significant boost in production.
- However, the growth rate slowed to 1.6% in 2021.
- In 2022, production volume saw a modest increase of 5.5%.
- A slight decline of 0.4% occurred in 2023, marking a temporary reduction in production.
- The following years indicate a return to positive growth. With a minor increase of 0.8% in 2024 and a 1.9% rise in 2025.
- From 2026 onwards, the growth rate stabilizes. With incremental increases of 1.0% in 2026, 0.9% in 2027, and 1.0% in both 2028 and 2029.
- This data highlights the fluctuations in production volume changes, with periods of significant growth followed by stabilization and modest increases.
(Source: Statista)
Revenue Generation Through Gaming Consoles
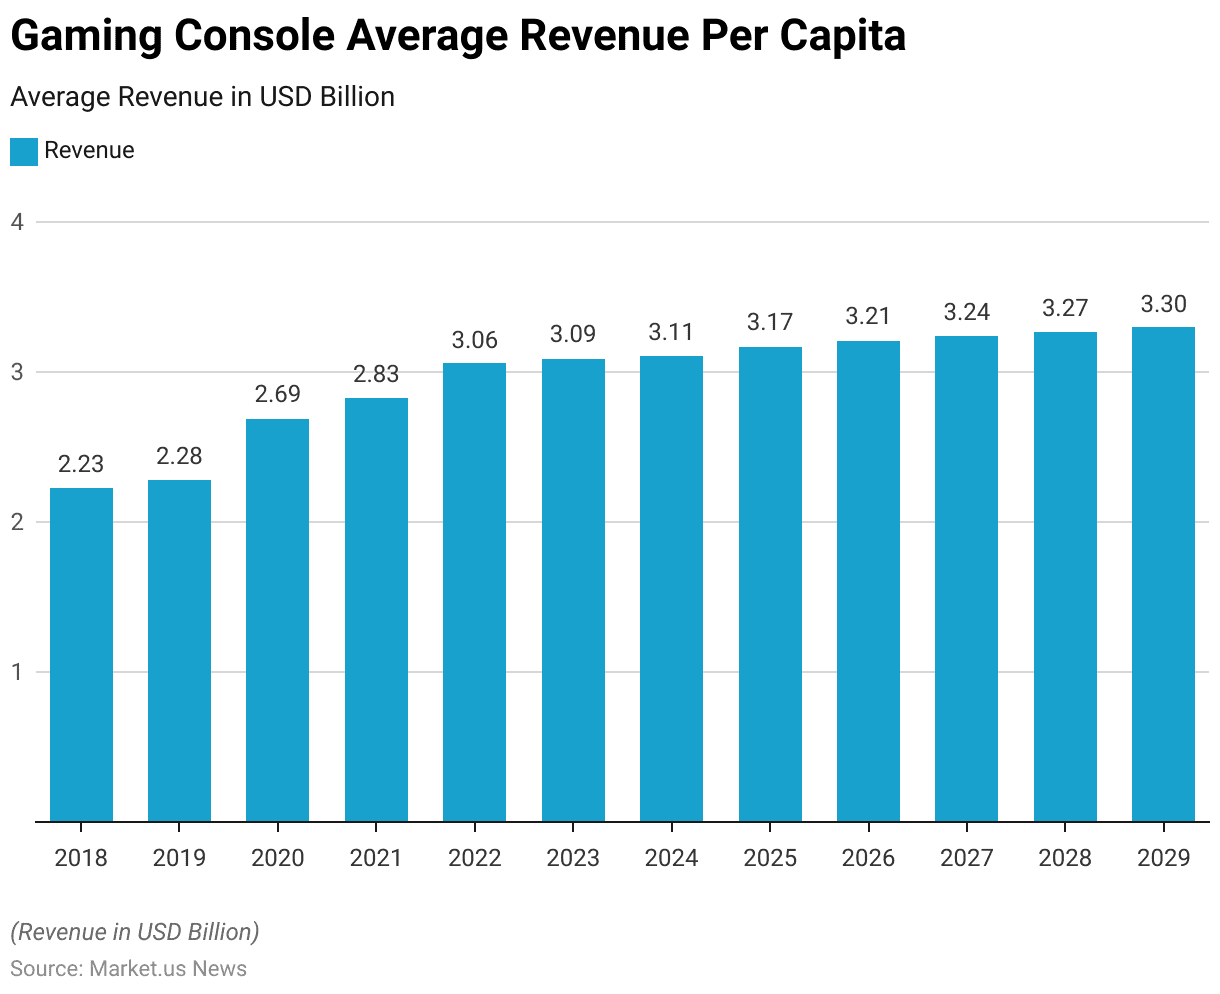
- The average revenue per capita for gaming consoles has shown a consistent upward trend from 2018 to 2029.
- In 2018, the average revenue per capita was USD 2.23, which increased slightly to USD 2.28 in 2019.
- A notable rise occurred in 2020, with the average revenue reaching USD 2.69, followed by an increase to USD 2.83 in 2021.
- The growth continued in 2022, with the average revenue per capita climbing to USD 3.06.
- In 2023, this figure edged up to USD 3.09.
- Projections for the subsequent years indicate a steady increase, with the average revenue per capita expected to be USD 3.11 in 2024, USD 3.17 in 2025, and USD 3.21 in 2026.
- The trend is anticipated to persist, with average revenues per capita forecasted to reach USD 3.24 in 2027, USD 3.27 in 2028, and ultimately USD 3.30 by 2029.
- This data underscores the growing financial engagement per individual in the gaming console market over the specified period.
(Source: Statista)
Gaming Console Price Statistics
2005-2012
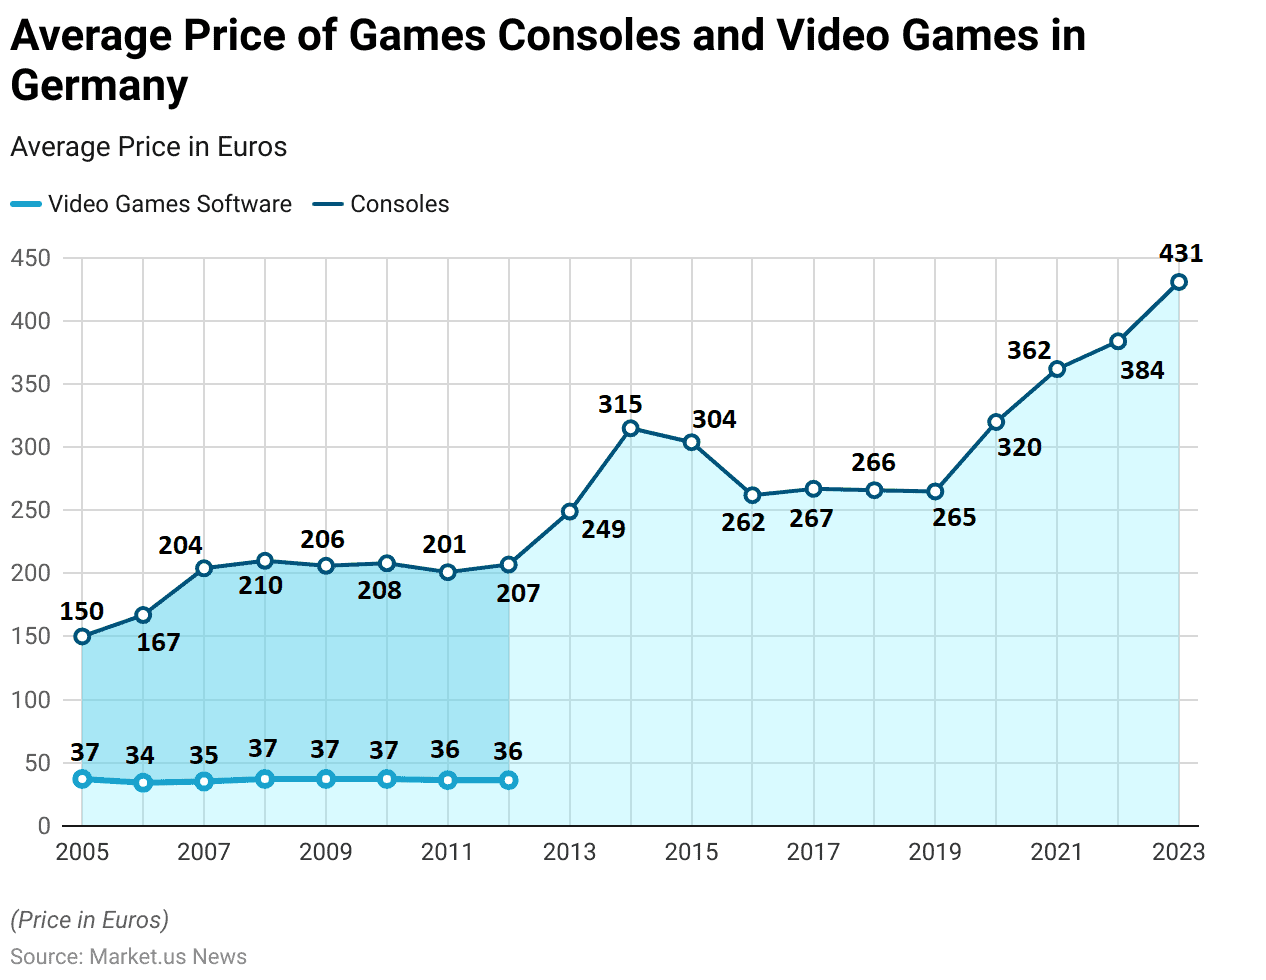
- The average price of video game software and consoles in Germany from 2005 to 2012 reveals significant trends and fluctuations.
- In 2005, the average price of video game software was EUR 37, while consoles were priced at EUR 150.
- The following year, 2006, saw a slight decrease in video game software prices to EUR 34, with console prices increasing to EUR 167.
- By 2007, video game software prices rose to EUR 35, and consoles saw a significant jump to EUR 204.
- The price of video game software remained stable at EUR 37 from 2008 to 2010, while console prices increased from EUR 210 in 2008 to EUR 208 in 2010.
- In 2011, video game software prices slightly decreased to EUR 36, with console prices dropping to EUR 201.
- This trend continued in 2012, when the price of video game software remained at EUR 36, and console prices rose slightly to EUR 207.
2013-2023
- Starting in 2013, only the average price of consoles was available, showing a significant increase to EUR 249.
- This upward trend in console prices continued, reaching EUR 315 in 2014 and peaking at EUR 320 in 2020.
- The average console prices saw a moderate decline to EUR 304 in 2015, EUR 262 in 2016, and EUR 267 in 2017.
- Prices stabilized around EUR 266 in 2018 and EUR 265 in 2019.
- However, a substantial rise occurred in 2021, with console prices soaring to EUR 362.
- This increase continued into 2022, with prices reaching EUR 384, and peaked in 2023 at EUR 431.
- This data reflects the dynamic pricing trends in the gaming market, influenced by technological advancements, market demand, and economic factors over nearly two decades.
(Source: Statista)
Demographics of Gaming Console Users Statistics
By Age
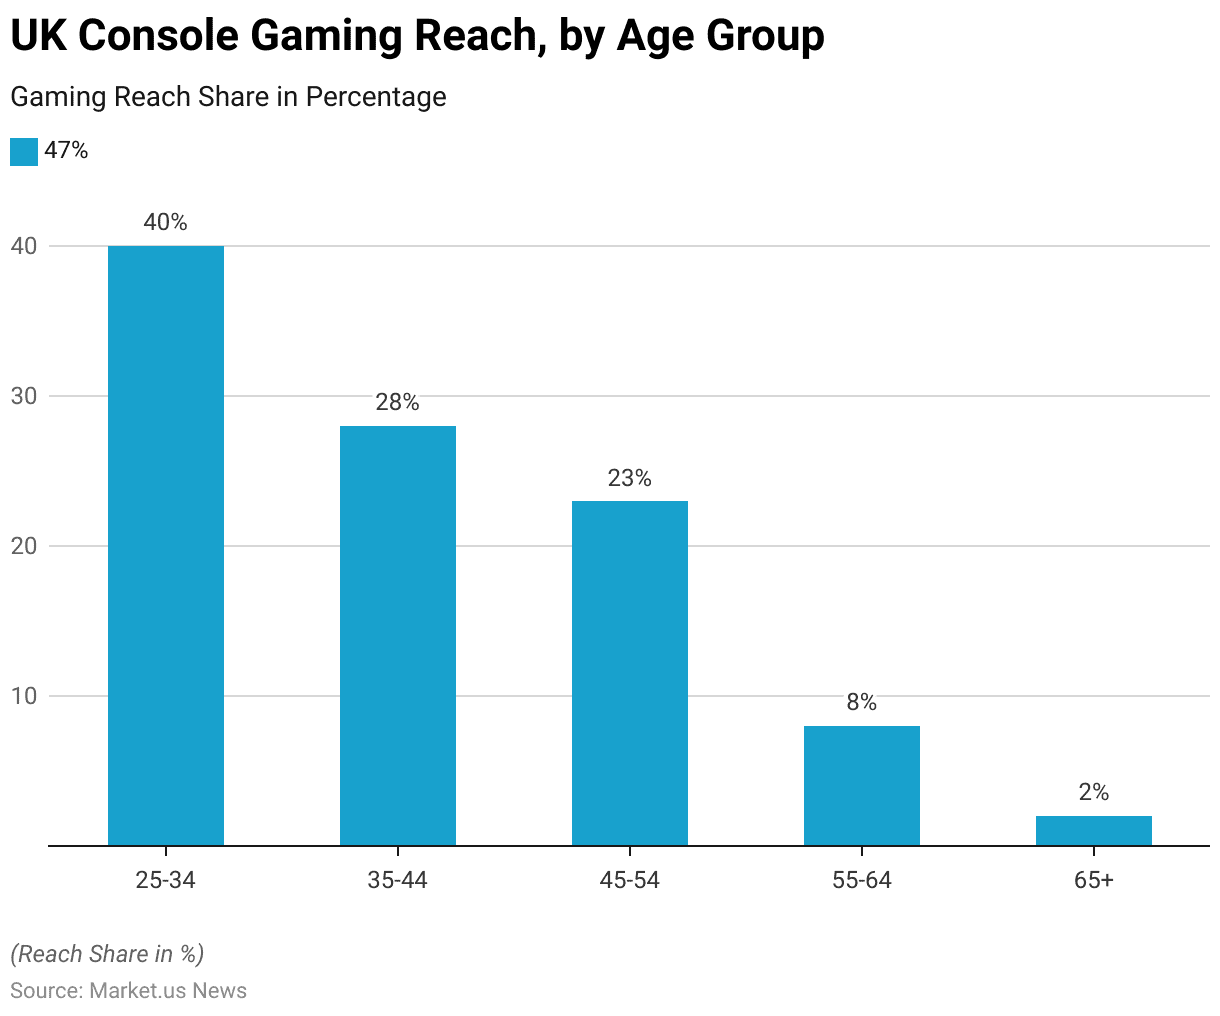
- As of November 2023, console gaming penetration in the United Kingdom exhibits significant variation across different age groups.
- The highest penetration is observed among the 16-24 age group, with 47% of respondents engaging in console gaming.
- This is followed closely by the 25-34 age group, which has a penetration rate of 40%.
- The 35-44 age group also shows a considerable participation rate of 28%.
- The penetration rate decreases with age, with 23% of respondents in the 45-54 age group reporting console gaming activity.
- Among the older demographics, 8% of those aged 55-64 engage in console gaming, while the 65+ age group has the lowest penetration rate at 2%.
- This data highlights the strong prevalence of console gaming among younger individuals in the UK, with a noticeable decline in participation among older age groups.
(Source: Statista)
Gender & Age
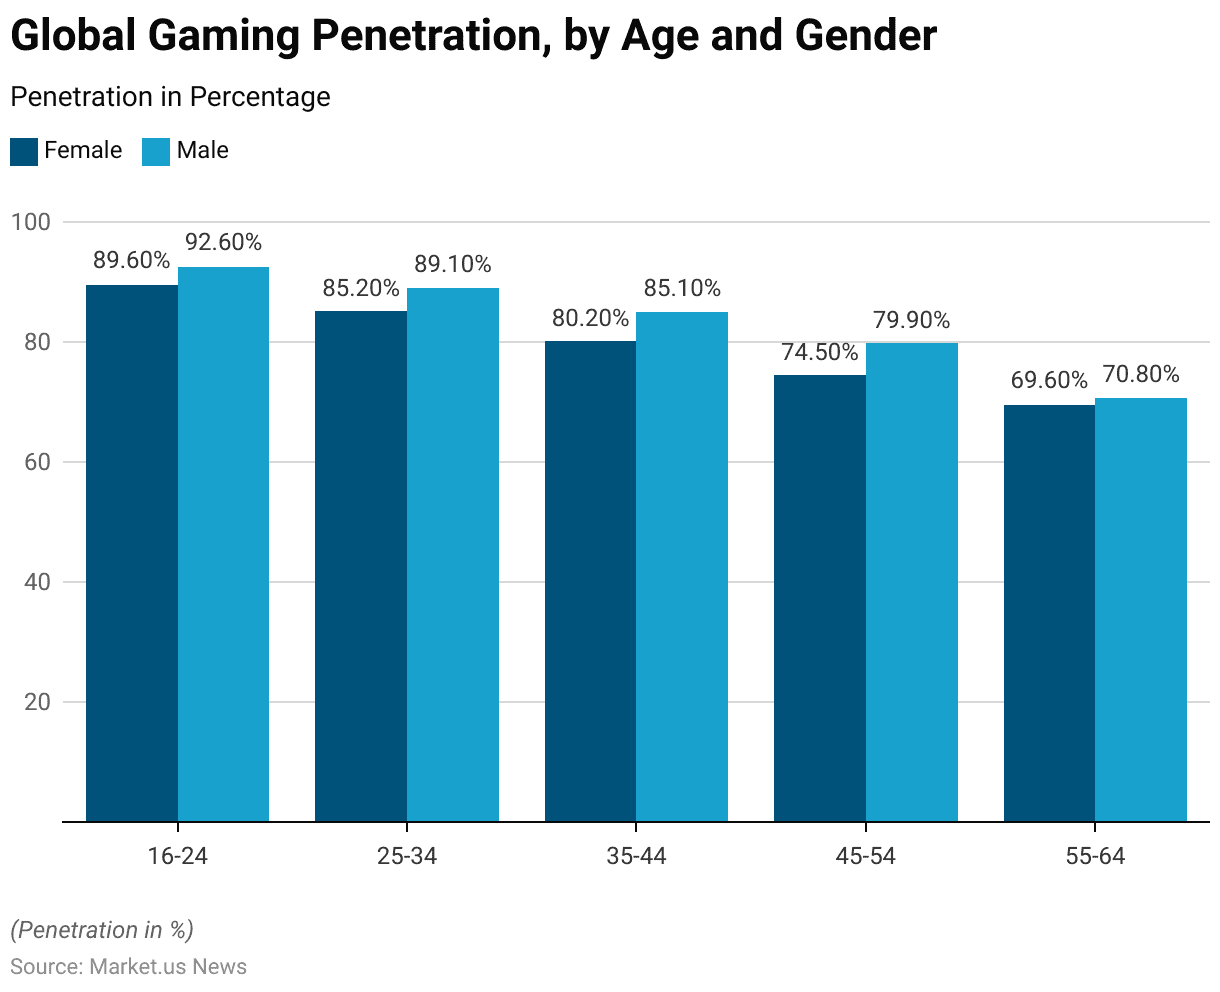
- As of the third quarter of 2023, the share of internet users worldwide who play video games on any device varies by age group and gender.
- Among the youngest cohort, aged 16-24, a substantial 89.60% of females and 92.60% of males engage in video gaming.
- The 25-34 age group shows slightly lower participation, with 85.20% of females and 89.10% of males playing video games.
- For those aged 35-44, 80.20% of females and 85.10% of males are involved in gaming activities.
- The 45-54 age group has a further decline in participation, with 74.50% of females and 79.90% of males playing video games.
- Among the oldest surveyed group, aged 55-64, 69.60% of females and 70.80% of males report playing video games.
- This data indicates that while video gaming is prevalent across all age groups, it is most common among younger internet users, with participation rates gradually decreasing with age.
- Additionally, males consistently show higher gaming participation rates compared to females in each age group.
(Source: Statista)
Video Gaming Penetration Statistics
Video Gaming Penetration – By Device
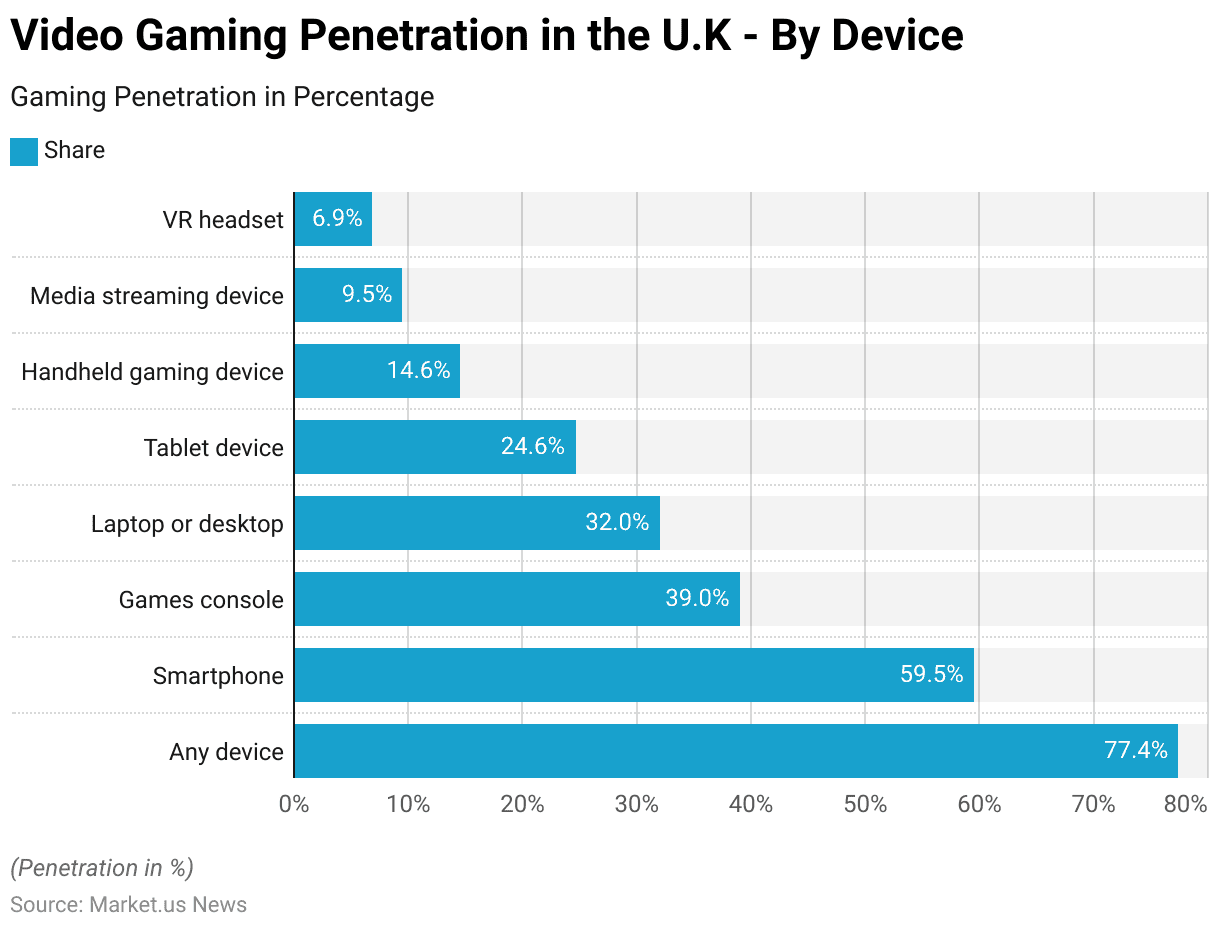
- As of the third quarter of 2023, 77.4% of internet users in the United Kingdom play video games on various devices.
- Smartphones are the most popular gaming platform used by 59.5% of respondents.
- Games consoles are utilized by 39% of internet users, while 32% play on laptops or desktops.
- Tablet devices are used by 24.6% of respondents for gaming.
- Handheld gaming devices have a smaller share, with 14.6% of internet users playing on these platforms.
- Media streaming devices are used for gaming by 9.5% of respondents, and VR headsets are the least common gaming device, with 6.9% of internet users engaging in gaming through virtual reality.
- This data highlights the diversity of devices used for gaming in the UK, with a significant preference for mobile and console gaming.
(Source: Statista)
Gaming Console Usage Statistics
Xbox One
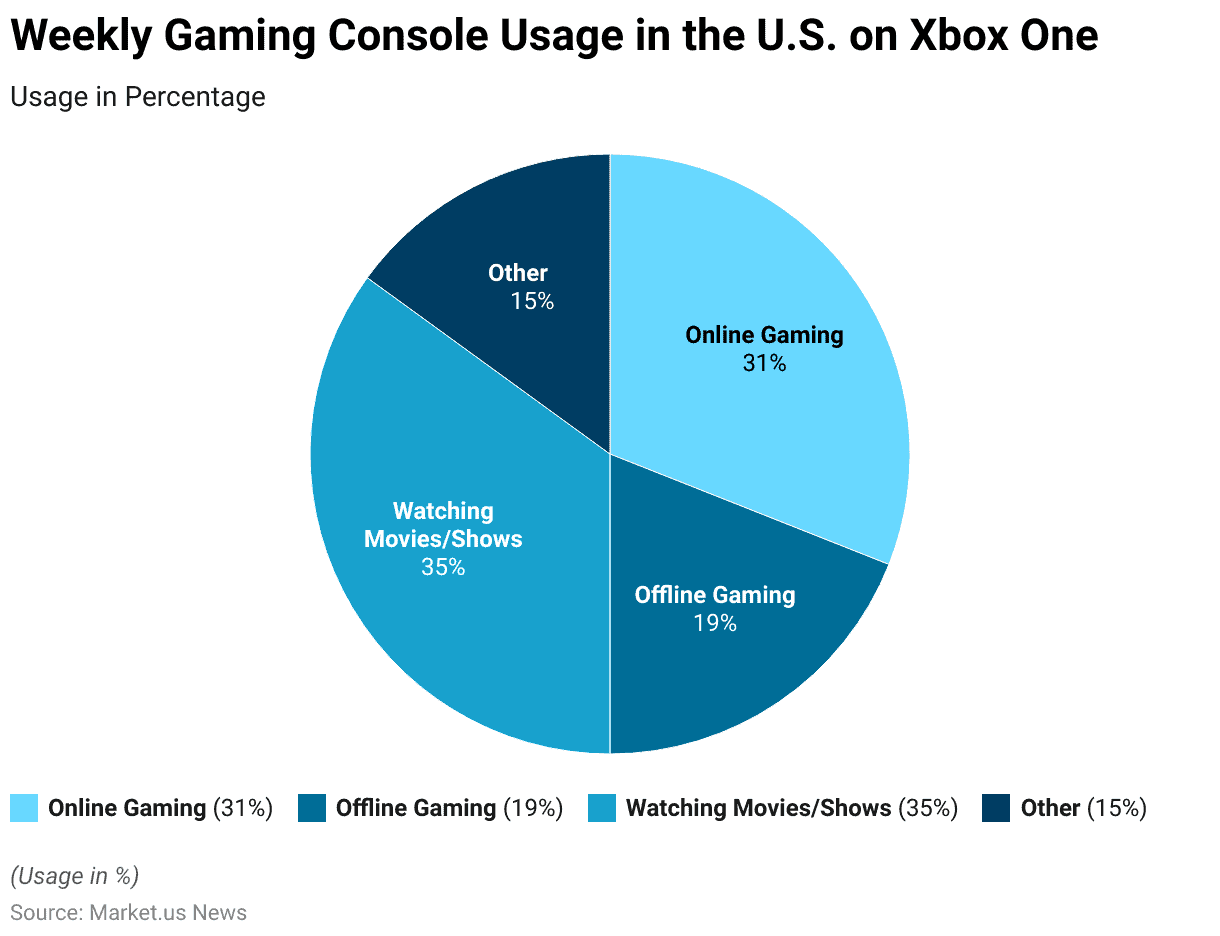
- In the United States, weekly usage of the Xbox One console is distributed across various activities.
- Online gaming constitutes 31% of usage, indicating a significant portion of time spent by users engaging in multiplayer and internet-based gaming activities.
- Offline gaming accounts for 19% of usage, reflecting the time spent playing games without an internet connection.
- A notable 35% of Xbox One usage is dedicated to watching movies and shows, highlighting the console’s role as a multimedia entertainment device.
- The remaining 15% of usage is categorized under ‘Other,’ which includes a variety of additional activities such as using apps, browsing the internet, and other miscellaneous functions.
- This data underscores the diverse ways in which its users utilize the Xbox One every week.
(Source: Nielsen)
PlayStation 4
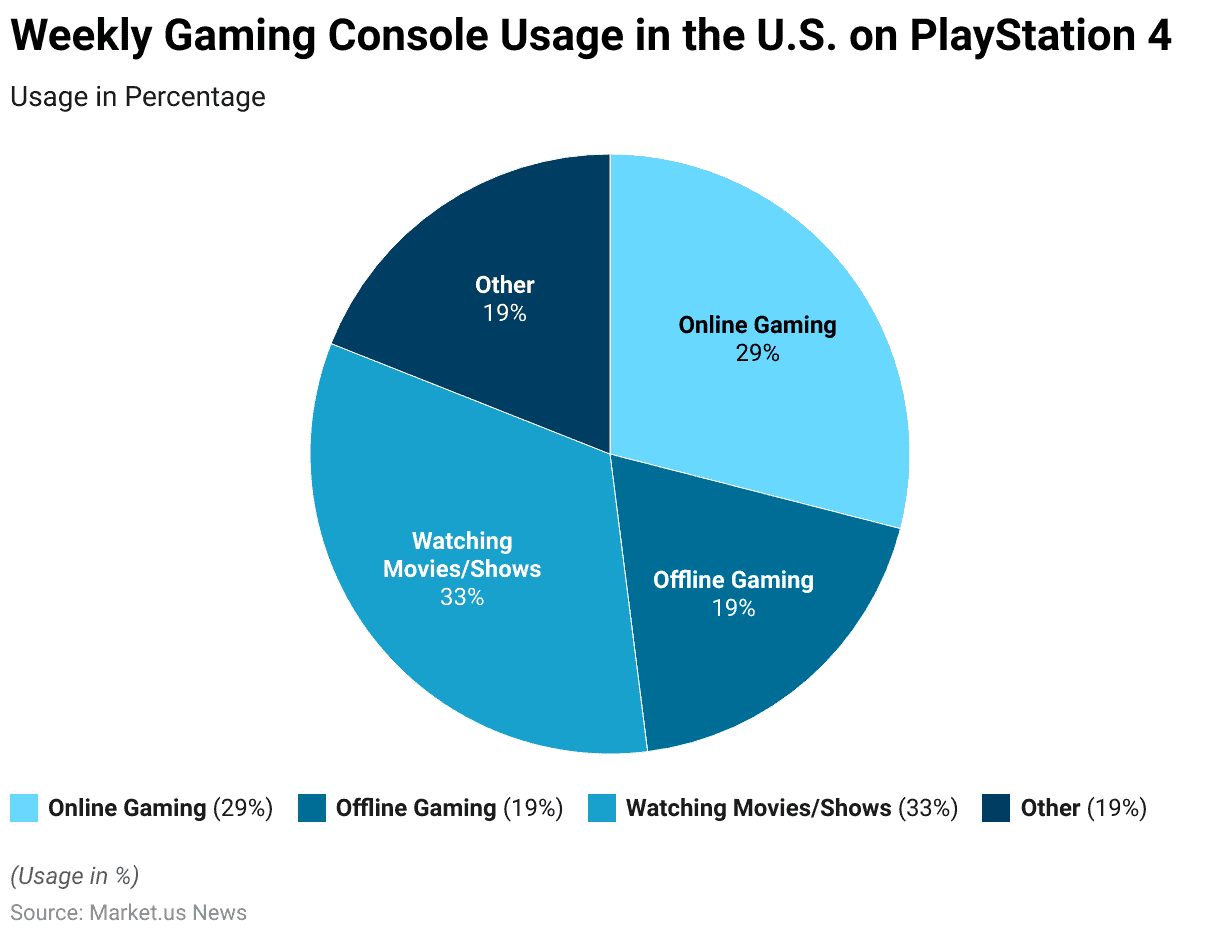
- In the United States, weekly usage of the PlayStation 4 console is divided among various activities.
- Online gaming comprises 29% of the usage. Indicating a significant engagement in multiplayer and internet-based gaming.
- Offline gaming, which includes playing games without an internet connection, accounts for 19% of the total usage.
- Watching movies and shows is a prominent activity on the PlayStation 4, making up 33% of the usage. Underscoring the console’s role as a multimedia entertainment hub.
- The remaining 19% of usage falls under ‘Other’ activities, which encompass a variety of additional functions such as using apps, browsing the internet, and other miscellaneous uses.
- This data highlights the diverse ways in which PlayStation 4 users in the US allocate their time on the console each week.
(Source: Nielsen)
Consumer Preferences and Trends
Gaming Console Factors Influencing Purchase Statistics
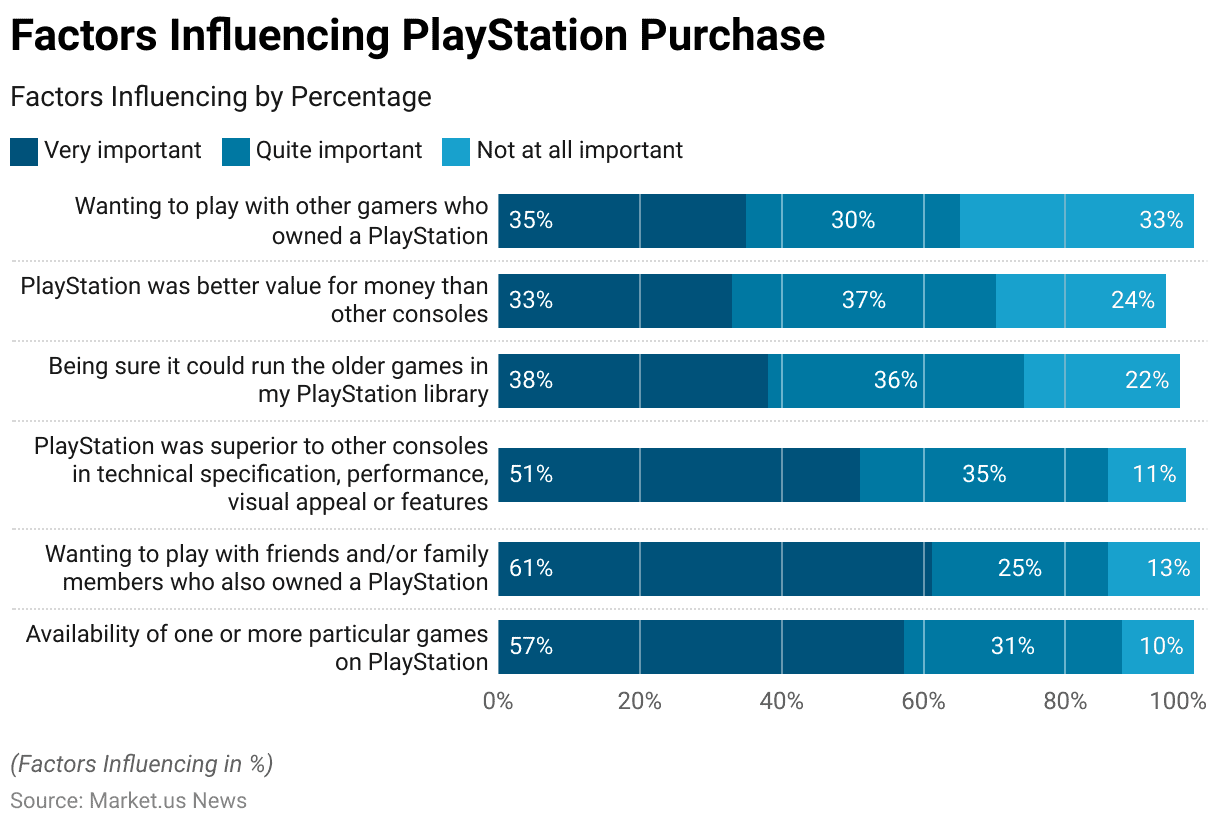
- Several factors significantly influence the decision to purchase a PlayStation, with varying degrees of importance attributed to consumers.
- The availability of specific games on PlayStation is a critical factor. Deemed very important by 57% of respondents and quite important by 31%, while only 10% consider it not at all important.
- Social connectivity also plays a crucial role. As 61% of respondents find playing with friends and family members who own a PlayStation very important, 25% find it quite important, and 13% not important.
- Technical superiority encompasses aspects such as specifications, performance, visual appeal, and features. It is very important for 51% of buyers and quite important for 35%, while 11% do not consider it important.
- Backward compatibility, ensuring that the console can run older games from the user’s PlayStation library, is very important for 38% of respondents and quite important for 36%, with 22% not prioritizing this factor.
- Perceived value for money is another significant consideration, with 33% of respondents rating it as very important, 37% as quite important, and 24% as not important.
- Lastly, the desire to play with other gamers who own a PlayStation is very important for 35% of respondents, quite important for 30%, and not important for 33%.
- These insights highlight the diverse motivations behind PlayStation purchases, ranging from game availability and social aspects to technical features and perceived value.
(Source: PlayStation Gamer Research)
Time Spent Playing Gaming Console Games Statistics
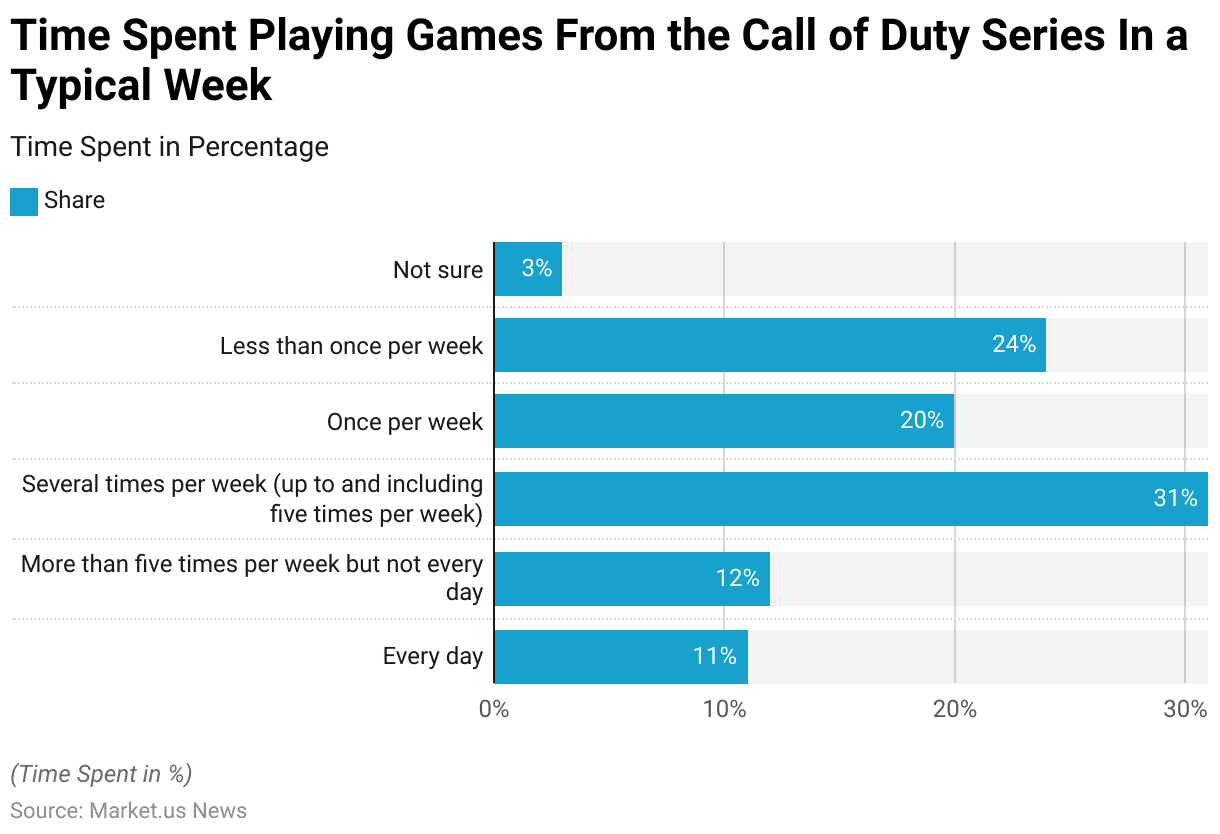
- The time spent playing games from the Call of Duty series varies significantly among respondents in a typical week.
- About 11% of respondents play Call of Duty every day, while 12% engage in the game more than five times per week but not daily.
- A significant portion, 31%, plays several times per week, up to and including five times.
- Playing once per week is reported by 20% of respondents, whereas 24% play less than once per week.
- Additionally, 3% of respondents are not sure about their gaming frequency.
- This data highlights the diverse gaming habits of Call of Duty players. With a notable proportion engaging in frequent gameplay sessions each week.
(Source: PlayStation Gamer Research)
Gaming Console Games Owned Recently Statistics
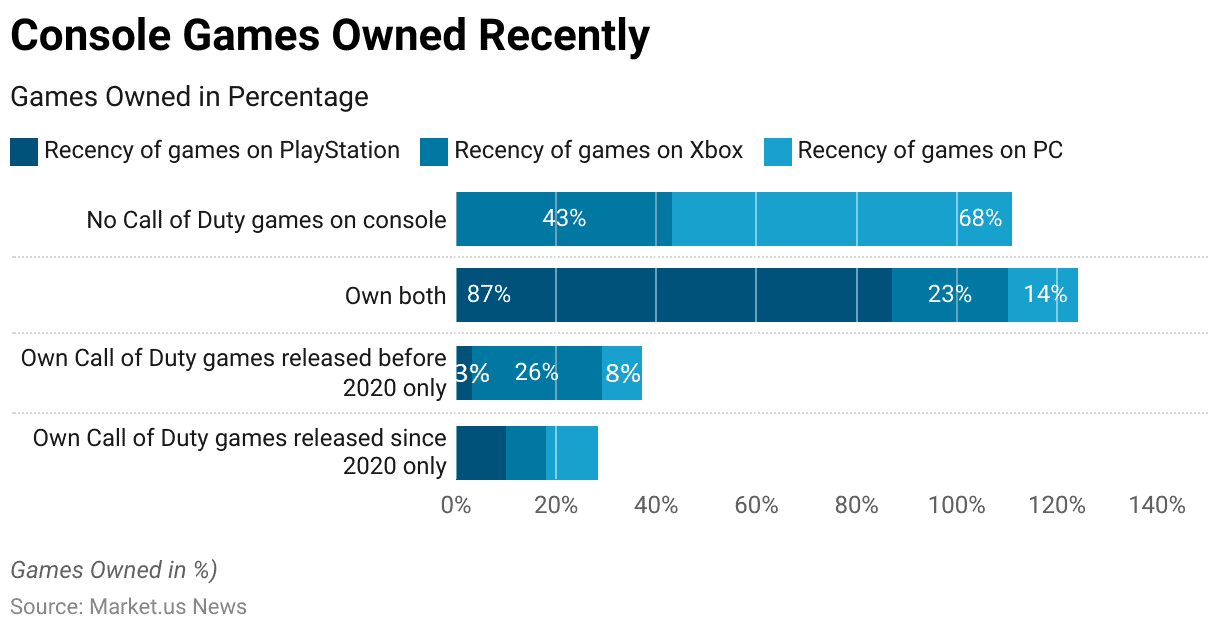
- The ownership patterns of Call of Duty games across different platforms highlight distinct trends in recency and platform preference.
- For PlayStation users, 10% own only Call of Duty games released since 2020. While 3% own only titles released before 2020.
- A significant majority, 87%, own both recent and older Call of Duty games, and no respondents indicated owning no Call of Duty games.
- In contrast, Xbox users exhibit a different distribution, with 8% owning only recent Call of Duty games and a higher 26% owning only older titles.
- Approximately 23% of Xbox users own both recent and older Call of Duty games, while 43% do not own any Call of Duty games on their console.
- PC gamers show a mixed pattern, with 10% owning only recent Call of Duty games and 8% owning only older ones.
- A smaller portion, 14%, own both recent and older Call of Duty games. Whereas a significant 68% do not own any Call of Duty games on their PC.
- This data underscores the varying degrees of engagement with the Call of Duty franchise across different gaming platforms. With PlayStation, users show the highest comprehensive ownership, followed by a more varied pattern among Xbox and PC users.
(Source: PlayStation Gamer Research)
Future Gaming Console Purchases Statistics
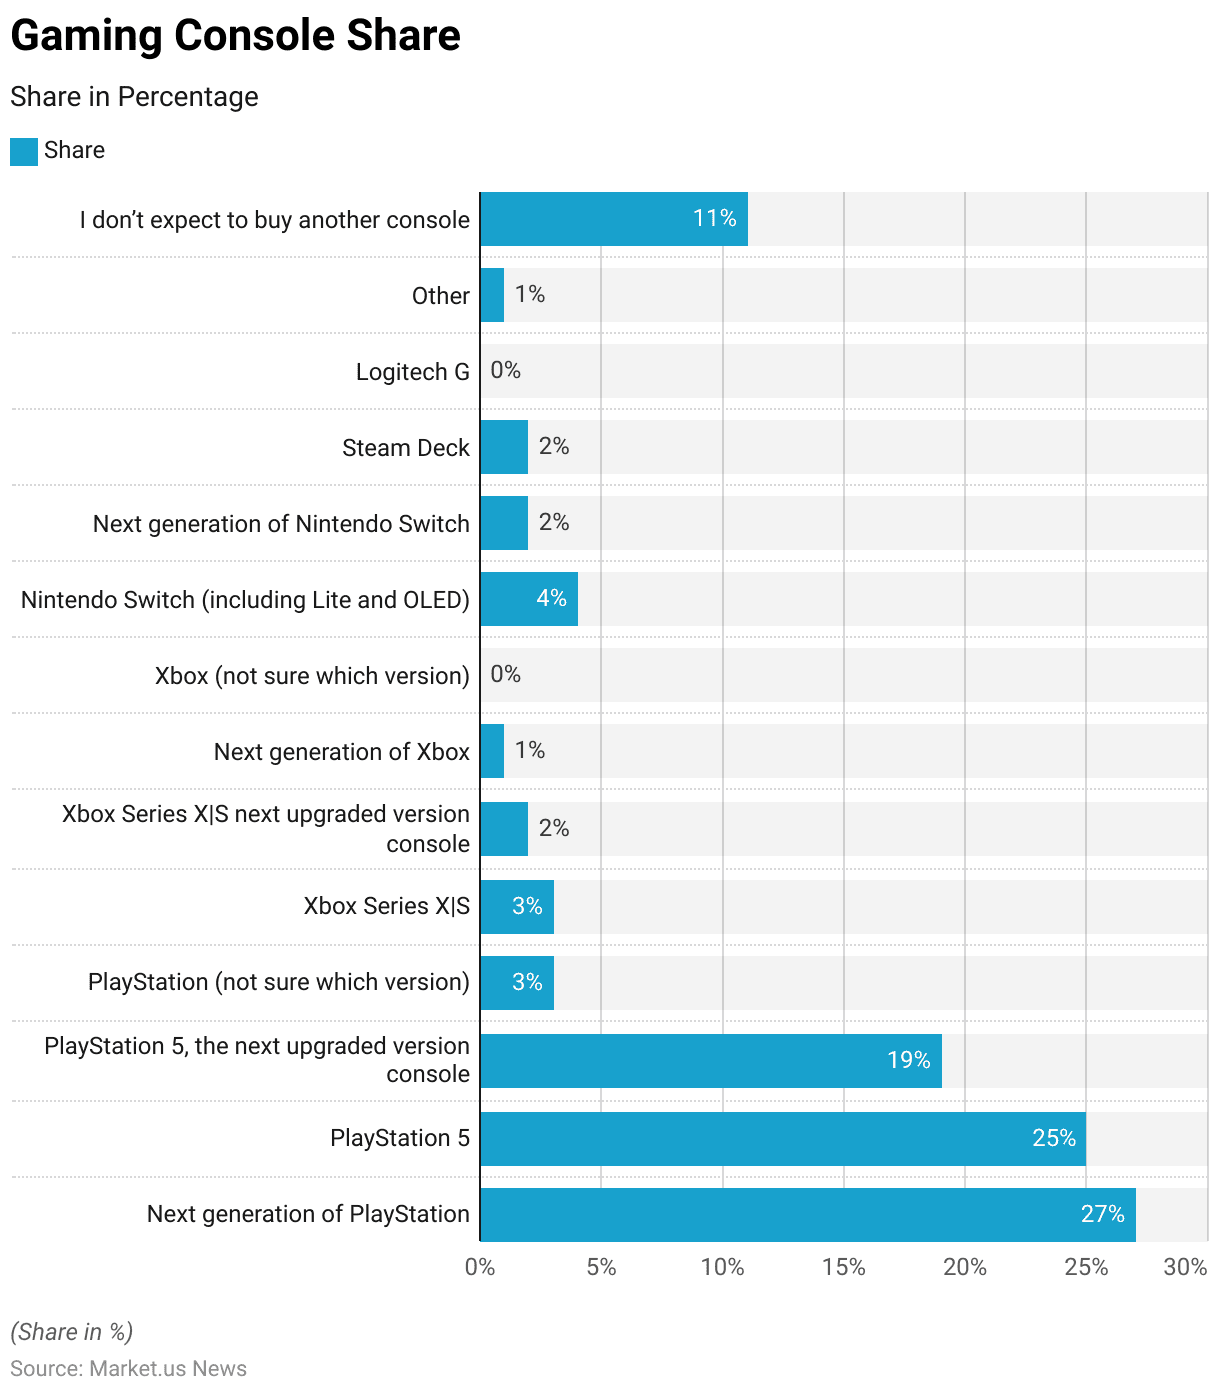
- When considering their next gaming console purchase, respondents show a strong preference for the PlayStation brand.
- About 27% of respondents are likely to buy the next generation of PlayStation consoles, while 25% plan to purchase a PlayStation 5.
- Additionally, 19% are interested in the next upgraded version of the PlayStation 5, and 3% are considering a PlayStation console but are unsure of the specific version.
- The Xbox brand also garners interest, with 3% of respondents likely to buy the Xbox Series X|S and 2% considering its next upgraded version.
- Only 1% are looking towards the next generation of Xbox consoles, and no respondents indicated uncertainty about which Xbox version to buy.
- Nintendo consoles maintain a modest share, with 4% of respondents planning to purchase a Nintendo Switch (including Lite and OLED versions) and 2% considering the next generation of the Nintendo Switch.
- The Steam Deck and other next-generation consoles each attract 2% of potential buyers.
- A small fraction, 1%, is interested in other consoles, while 11% of respondents do not expect to buy another console.
- This data reflects a predominant interest in PlayStation consoles, with notable but lesser interest in Xbox and Nintendo platforms among future gaming console buyers.
(Source: PlayStation Gamer Research)
Media Activities Undertaken While Playing Videogames
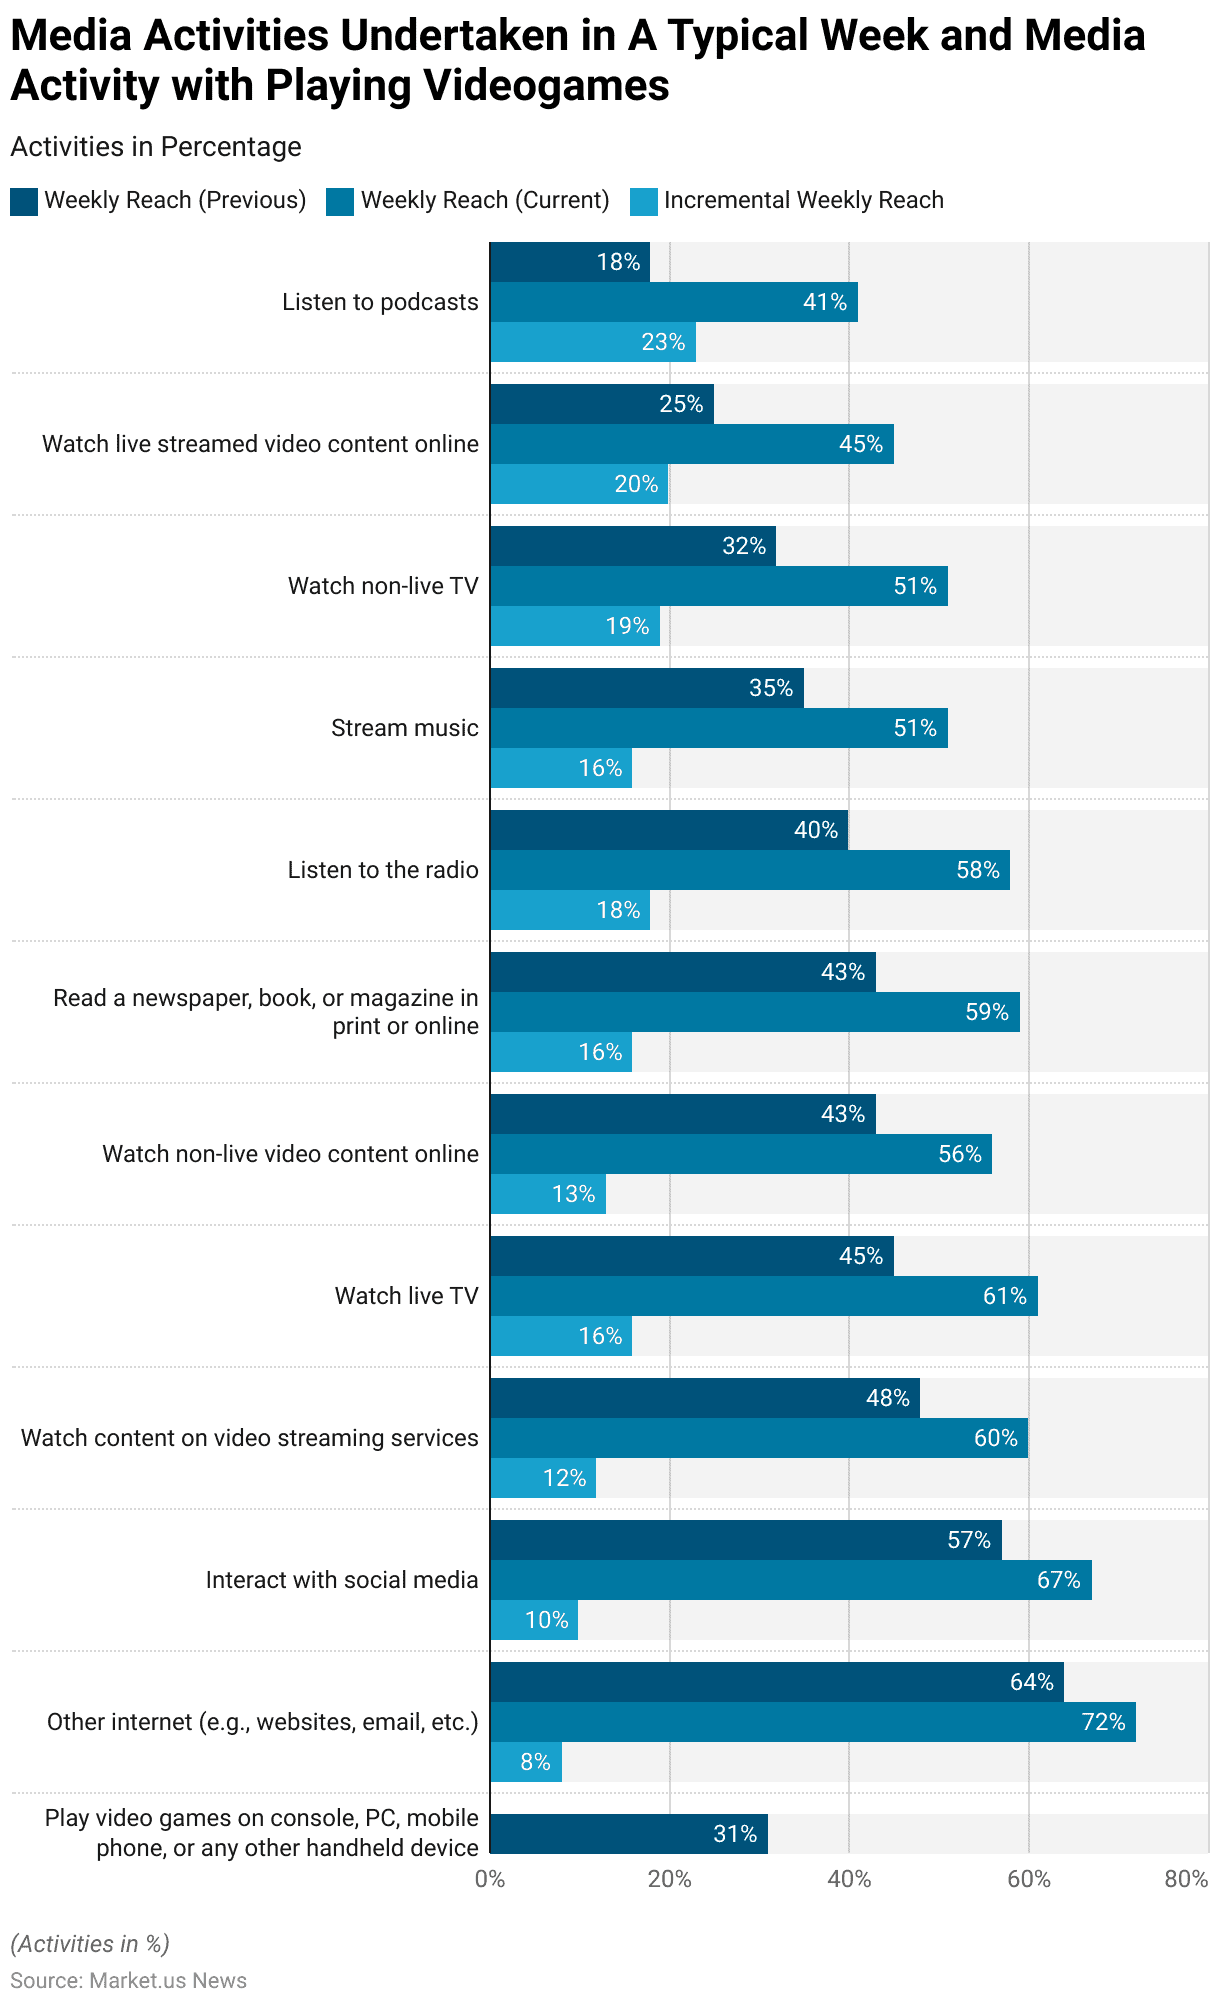
- In a typical week, various media activities exhibit differing levels of reach globally. Playing video games on consoles, PCs, mobile phones, or any other handheld device engages 31% of the global audience.
- Other internet activities, such as browsing websites and using email, have seen an increase in weekly reach from 64% to 72%, marking an 8% incremental rise. Interacting with social media platforms has grown from 57% to 67%, representing a 10% increase.
- Watching content on video streaming services has risen from 48% to 60%, showing a 12% growth.
- Watching live TV experienced a significant rise from 45% to 61%, a 16% increase while watching non-live video content online grew from 43% to 56%, a 13% increment.
- Reading newspapers, books, or magazines, either in print or online, increased from 43% to 59%, also marking a 16% rise.
- Listening to the radio saw an 18% increase, moving from 40% to 58%. Streaming music grew from 35% to 51%, reflecting a 16% rise.
- Watching non-live TV jumped from 32% to 51%, showing a 19% increase, while watching live-streamed video content online experienced a substantial rise from 25% to 45%, a 20% increment.
- Lastly, listening to podcasts saw the highest growth, increasing from 18% to 41%, a significant 23% rise.
- These figures indicate a notable shift towards digital and streaming media activities over the specified period.
(Source: YouGov)
Regulations and Laws for Gaming Console Statistics
- Gaming consoles are subject to a range of regulations and laws that vary significantly by country, impacting the industry from manufacturing to consumer use.
- In the United States, the Federal Trade Commission (FTC) oversees aspects such as consumer protection and privacy, while the Entertainment Software Rating Board (ESRB) enforces content ratings.
- In the European Union, regulations differ by member state, with authorities like the UK Gambling Commission and the Malta Gaming Authority setting stringent licensing and operational standards for online gaming.
- Germany has specific rules against loot boxes, requiring games to display warnings if they include such features.
- In China, the government imposes strict limitations on gaming time for minors and mandates real-name registration to combat gaming addiction.
- Similarly, Japan regulates in-game purchases and requires transparency in odds for random items.
- Brazil, emerging as a significant market, is in the process of developing comprehensive legislation to regulate the booming online gaming sector.
- These diverse regulatory frameworks aim to ensure consumer protection, fair play, and responsible gaming, reflecting the global variance in approach and enforcement.
(Sources: Chambers and Partners, International Comparative Legal Guides, Scaleo)
Recent Developments
Acquisitions and Mergers:
- Microsoft acquires ZeniMax Media: In early 2023, Microsoft completed its $7.5 billion acquisition of ZeniMax Media, the parent company of Bethesda Softworks. This acquisition aims to bolster Microsoft’s Xbox gaming portfolio with popular franchises like The Elder Scrolls, Fallout, and Doom.
- Sony acquires Bluepoint Games: In mid-2023, Sony acquired Bluepoint Games. A studio known for its high-quality remakes and remasters, for an undisclosed amount. This merger is expected to enhance Sony’s PlayStation lineup with exclusive titles and improved game development capabilities.
New Product Launches:
- PlayStation 5 Pro: In early 2024, Sony launched the PlayStation 5 Pro, an upgraded version of the PS5 featuring enhanced performance, higher resolution support, and improved graphics capabilities, targeting hardcore gamers and enthusiasts.
- Xbox Series X|S Expansion: Microsoft introduced new models of the Xbox Series X|S in mid-2023. Including a more affordable Series S variant with increased storage and a Series X model with enhanced processing power, aiming to cater to a broader audience.
Funding:
- Epic Games raises $1 billion: In 2023, Epic Games, the developer behind Fortnite and the Unreal Engine, raised $1 billion to expand its metaverse ambitions. Enhance gaming experiences on consoles, and develop new titles.
- Unity Technologies secures $600 million: Unity Technologies is known for its popular game development platform. Secured $600 million in early 2024 to invest in new tools and features for console game developers, aiming to streamline game creation and improve performance.
Technological Advancements:
- Ray Tracing and 8K Support: Advances in graphics technology are enabling gaming consoles to support ray tracing and 8K resolution, providing more realistic lighting, shadows, and textures, thus enhancing the overall gaming experience.
- Cloud Gaming Integration: The development of cloud gaming services is being integrated into consoles. Allowing gamers to stream games without needing to download or install them, increasing accessibility and convenience.
Market Dynamics:
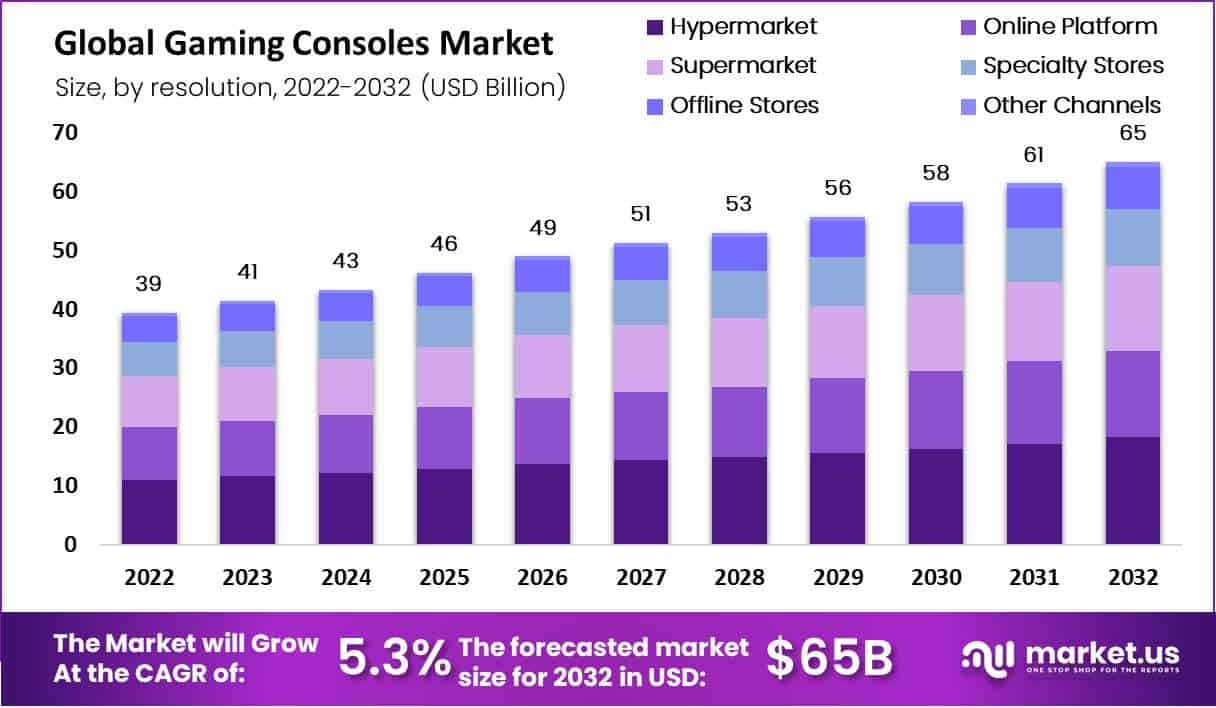
- Growth in Gaming Console Market: The global gaming console market is projected to grow at a CAGR of 8.3% from 2023 to 2028. Driven by the release of new console models, advancements in gaming technology, and increasing consumer demand for immersive gaming experiences.
- Rising Popularity of Subscription Services: Subscription-based gaming services like Xbox Game Pass and PlayStation Now are gaining popularity. Offering gamers access to a large library of games for a monthly fee contributes to market growth.
Regulatory and Strategic Developments:
- EU Digital Services Act: The European Union implemented the Digital Services Act in early 2024, which includes regulations on digital content and gaming. Ensuring transparency, consumer protection, and fair competition in the gaming industry.
- US FTC Guidelines on In-Game Purchases: The US Federal Trade Commission (FTC) issued new guidelines in 2023 to regulate in-game purchases and loot boxes. Aiming to protect consumers, especially minors, from deceptive practices and excessive spending.
Research and Development:
- Virtual Reality (VR) and Augmented Reality (AR): R&D efforts are focusing on integrating VR and AR technologies into gaming consoles to provide more immersive and interactive gaming experiences, with advancements in hardware and software development.
- AI in Game Development: Researchers are exploring the use of AI to enhance game development processes, including procedural content generation, adaptive gameplay, and intelligent NPCs (non-player characters), improving the quality and complexity of games.
Conclusion
Gaming Console Statistics – The gaming console market has seen significant growth and shifts in recent years.
Revenue is projected to rise from USD 16.4 billion in 2018 to USD 26.7 billion by 2029. With online sales surpassing offline by 2025.
PlayStation leads the market at 45%, followed by Nintendo and Xbox. The United States is the largest contributor to market revenue.
There is a notable transition from physical to digital content distribution. Console prices have surged, reflecting technological advancements.
Key factors driving PlayStation purchases include game availability, social connectivity, and technical specs.
Future purchase intentions favor next-generation consoles, especially from PlayStation, with strong interest in Nintendo and Xbox. Overall, the market is poised for continued growth and innovation.
FAQs
A gaming console is an electronic device designed primarily for playing video games. It connects to a display such as a TV or a monitor and includes controllers for user input. Popular examples include the PlayStation, Xbox, and Nintendo Switch.
Key features typically include high-definition graphics, online connectivity, multimedia capabilities, backward compatibility, and exclusive game titles. Controllers with advanced haptics and motion sensors are also common.
Storage capacity is crucial as it determines how many games, applications, and media files can be stored on the console. Modern games require significant storage space, often exceeding 50GB per game, making larger storage capacities preferable.
Digital games are downloaded directly from the console’s online store, whereas physical games are purchased as discs or cartridges. Digital games offer convenience and instant access, while physical games can be shared or resold.
Frame rate refers to the number of frames displayed per second (FPS). Higher frame rates (e.g., 60 FPS) result in smoother motion and improved gameplay experience compared to lower frame rates (e.g., 30 FPS).


