Table of Contents
- Introduction
- Editor’s Choice
- Gas Power Capacity Statistics
- Gas Turbine Market Overview
- Gas Turbine Orders Statistics
- Electricity Generation from Natural Gas-Fired Turbines
- Plant Load Factor of Combined Cycle Gas Turbine Stations Statistics
- Capacity of Combined-Cycle Natural Gas Turbine – By Configuration Statistics
- Transmission Entry Capacity (TEC) of Combined Cycle Gas Turbine Stations Statistics
- Thermal Efficiency of Combined Cycle Gas Turbine Stations Statistics
- Expenditure Required for Gas Turbine Statistics
- Export and Import Statistics of Gas Turbine Statistics
- Essential Cost Metrics Related to Gas Turbine Statistics
- Key Challenges and Concerns Faced by the Industry
- Gas Turbine Emissions and Control Statistics
- Innovations and Developments in Gas Turbine Statistics
- Regulations for Gas Turbines
- Recent Developments
- Conclusion
- FAQs
Introduction
Gas Turbine Statistics: A gas turbine is an internal combustion engine that converts fuel’s chemical energy into mechanical energy through the Brayton Cycle, which includes compression, combustion, and expansion stages.
Key components include a compressor, combustion chamber, turbine, and exhaust. Gas turbines are used in power generation, aviation, and industrial applications, with types such as heavy-duty, aero-derivative, and industrial turbines.
They offer advantages like high efficiency, compactness, and fuel flexibility but come with challenges, including high fuel consumption and emissions.
Despite these, gas turbines play a vital role in modern energy production, especially in combined-cycle power plants.
Editor’s Choice
- The global gas turbine market size is projected to reach USD 27.9 billion by 2033.
- In 2021, the global gas turbine market was led by General Electric, holding the largest share at 18%.
- From 2016 to 2025, GE Energy led the global gas turbine manufacturing market with a dominant 45.48% share.
- In 2021, the global gas turbine market exhibited a diverse regional distribution, with the Asia-Pacific (APAC) region leading the market, holding a 32.0% share.
- In 2017, the global orders for gas turbines used in power generation were led by the Far East region, which recorded the highest number of orders at 273 units, reflecting the region’s significant demand for electricity and ongoing infrastructure development.
- In 2017, global orders for gas turbines used in power generation were primarily driven by natural gas, which accounted for the highest number of orders at 279 units.
- Siemens Energy is advancing with technology that supports hydrogen co-firing, capable of accommodating between 15% and 75% hydrogen by volume in its turbines, with ambitions to achieve 100% hydrogen operation by 2030.

Gas Power Capacity Statistics
Global Gas Power Capacity
2000-2012
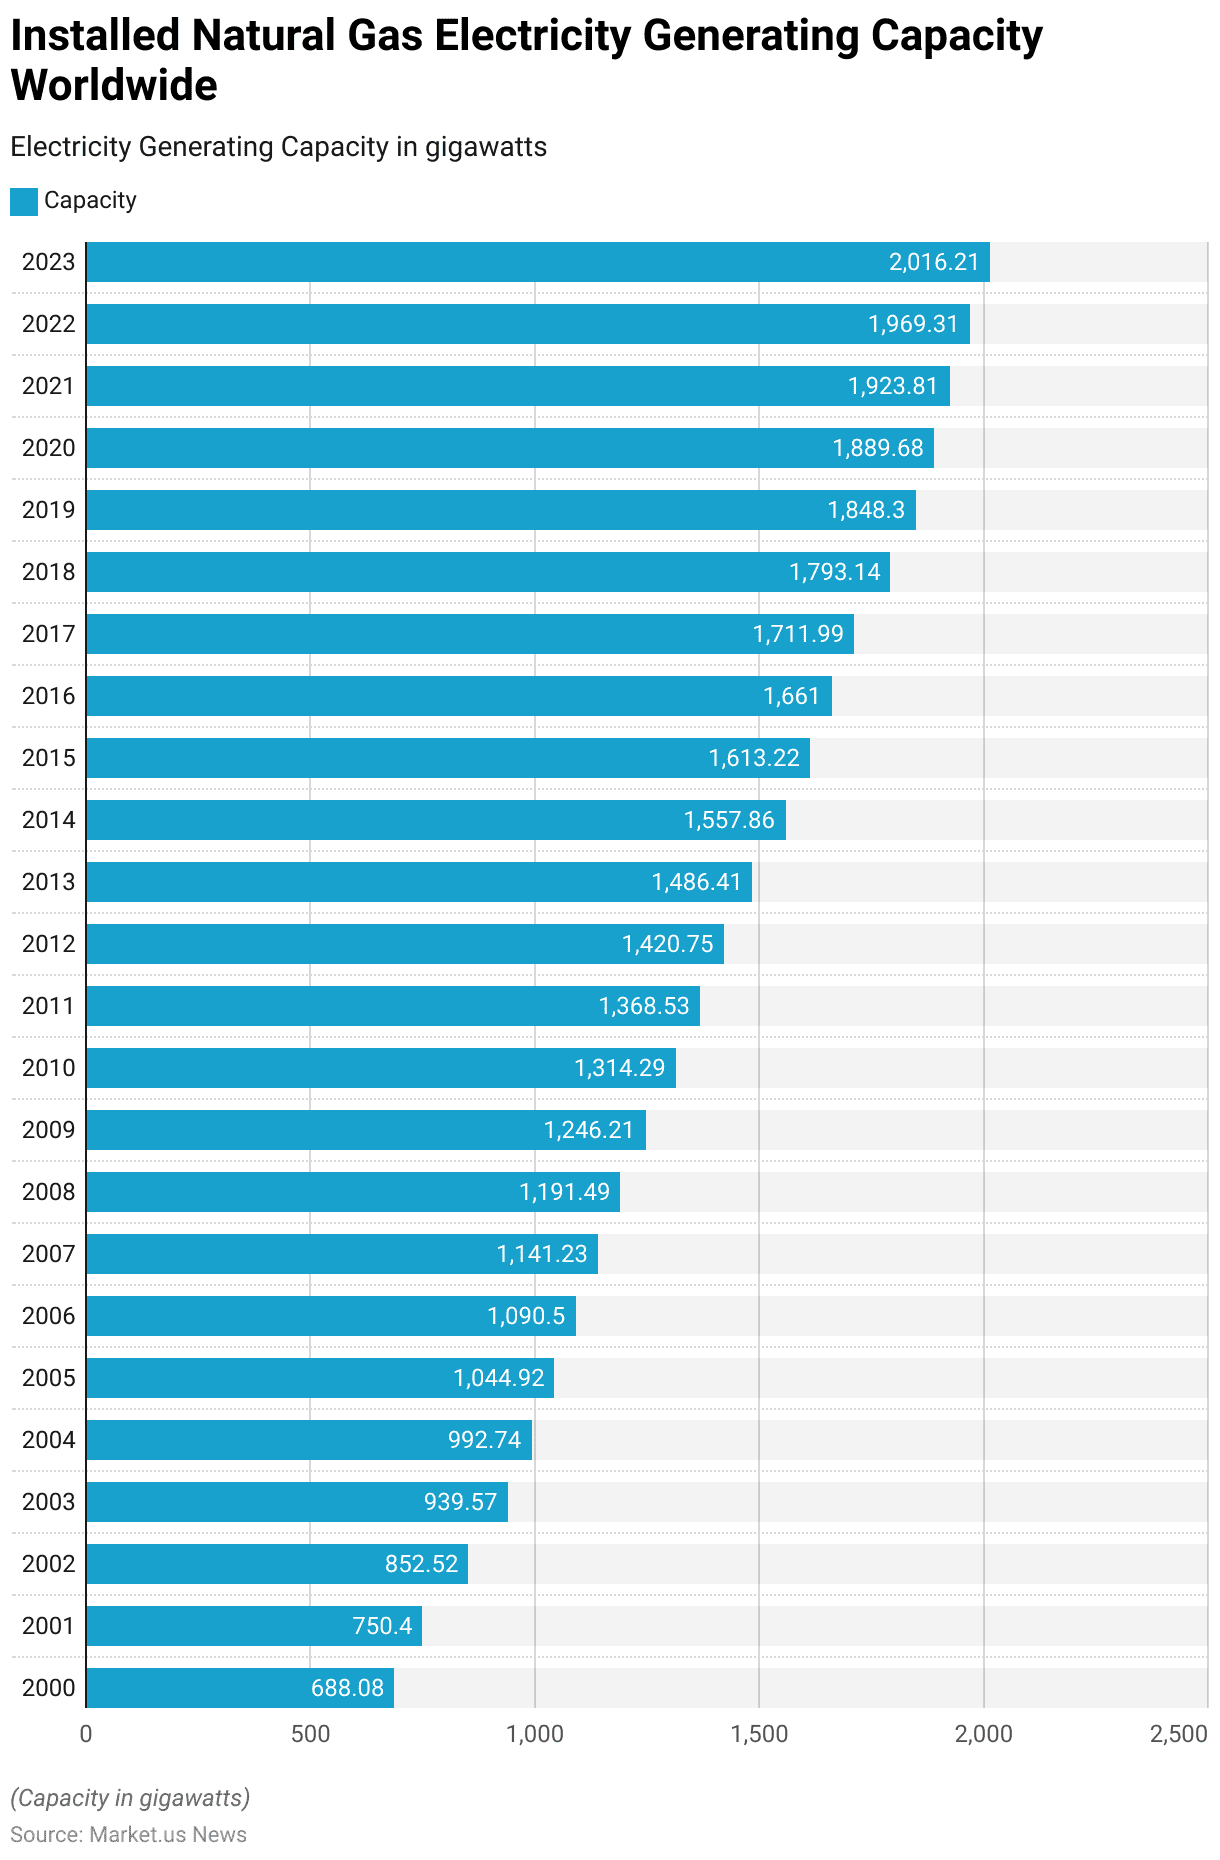
- The global installed natural gas electricity generating capacity has shown a consistent upward trend from 2000 to 2023.
- In 2000, the total capacity stood at 688.08 gigawatts, which increased to 750.4 gigawatts by 2001 and further to 852.52 gigawatts in 2002.
- The growth continued steadily, reaching 939.57 gigawatts in 2003, 992.74 gigawatts in 2004, and surpassing the 1,000 gigawatts mark in 2005 with 1,044.92 gigawatts.
- By 2006, capacity rose to 1,090.5 gigawatts and reached 1,141.23 gigawatts in 2007.
- The subsequent years saw similar growth, with capacity hitting 1,191.49 gigawatts in 2008 and 1,246.21 gigawatts in 2009.
- In 2010, the capacity increased to 1,314.29 gigawatts, followed by 1,368.53 gigawatts in 2011 and 1,420.75 gigawatts in 2012.
2013-2023
- By 2013, the global capacity stood at 1,486.41 gigawatts, climbing to 1,557.86 gigawatts in 2014 and further to 1,613.22 gigawatts in 2015.
- The upward trajectory continued through the latter half of the decade, with capacities of 1,661 gigawatts in 2016, 1,711.99 gigawatts in 2017, and 1,793.14 gigawatts in 2018.
- By 2019, the capacity had increased to 1,848.3 gigawatts and reached 1,889.68 gigawatts in 2020.
- The years 2021 and 2022 saw capacities of 1,923.81 gigawatts and 1,969.31 gigawatts, respectively.
- By 2023, the global installed capacity for natural gas electricity generation reached a new high of 2,016.21 gigawatts, underscoring the sustained growth and reliance on natural gas as a critical energy source in the global power generation mix.
(Source: Statista)
Global Gas Power Capacity in Development – By Country
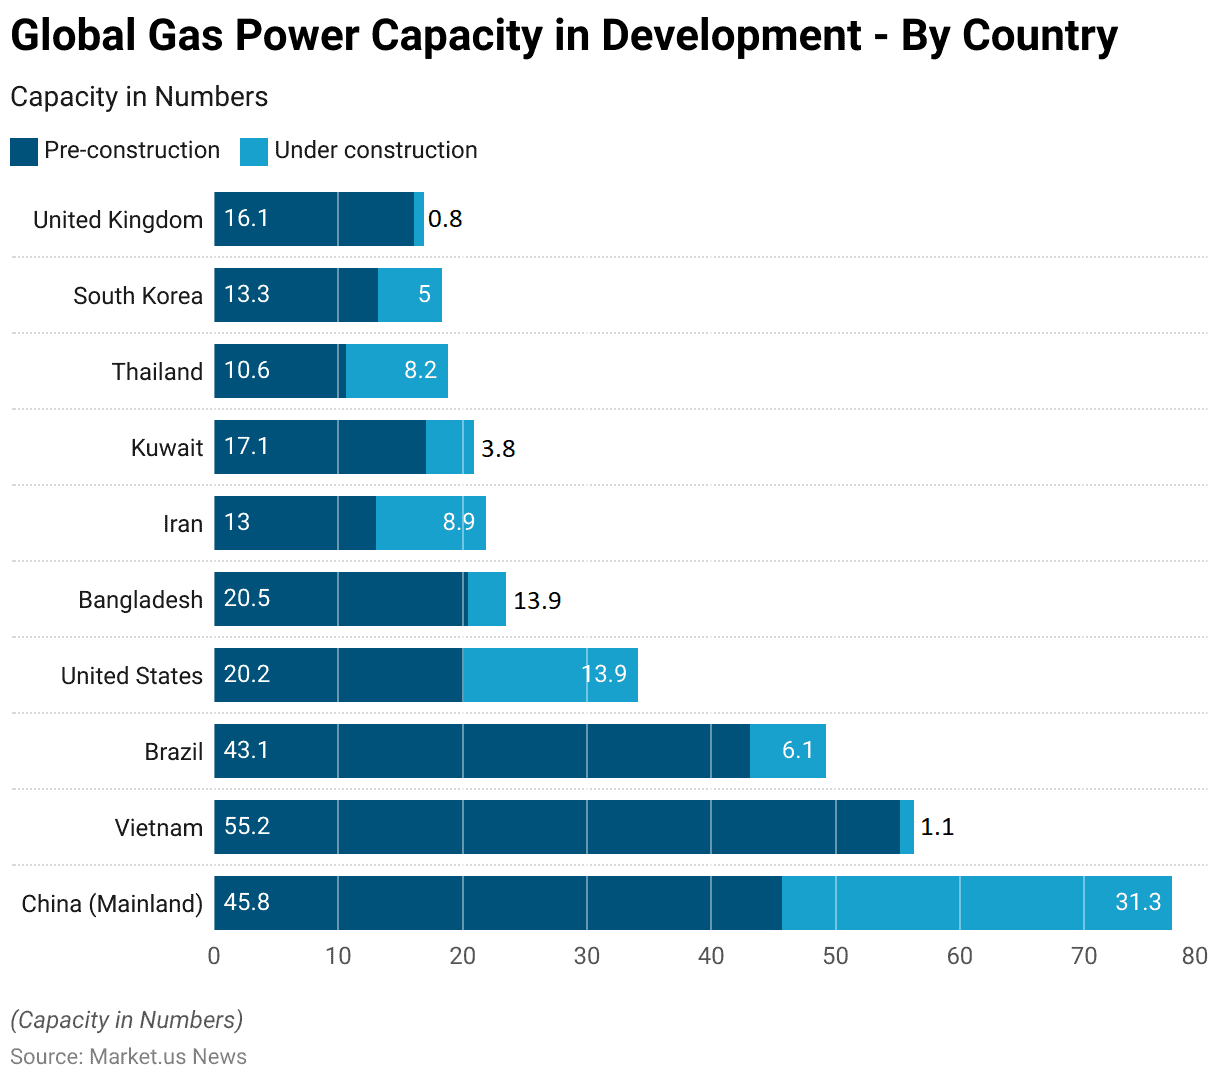
- As of 2022, significant natural gas electricity generating capacity was either in the planning stage or under construction across various countries.
- Vietnam leads in pre-construction capacity with 55.2 gigawatts (GW), followed by China (Mainland) with 45.8 GW and Brazil with 43.1 GW.
- The United States and Bangladesh also have substantial pre-construction capacities of 20.2 GW and 20.5 GW, respectively.
- Kuwait, the United Kingdom, South Korea, Iran, and Thailand have pre-construction capacities ranging between 10.6 GW and 17.1 GW.
- In terms of projects under construction, China (Mainland) again ranks highest with 31.3 GW, followed by the United States with 13.9 GW and Iran with 8.9 GW.
- Thailand and South Korea have 8.2 GW and 5 GW under construction, respectively, while Brazil (6.1 GW), Bangladesh (3.1 GW), and Kuwait (3.8 GW) are progressing with moderate capacities.
- Vietnam and the United Kingdom have relatively small capacities under construction, at 1.1 GW and 0.8 GW, respectively.
- These figures highlight the varying levels of investment and development in natural gas power infrastructure globally, with certain countries focusing heavily on expanding their capacity to meet growing energy demands.
(Source: Statista)
Gas Turbine Market Overview
Global Gas Turbine Market Size Statistics
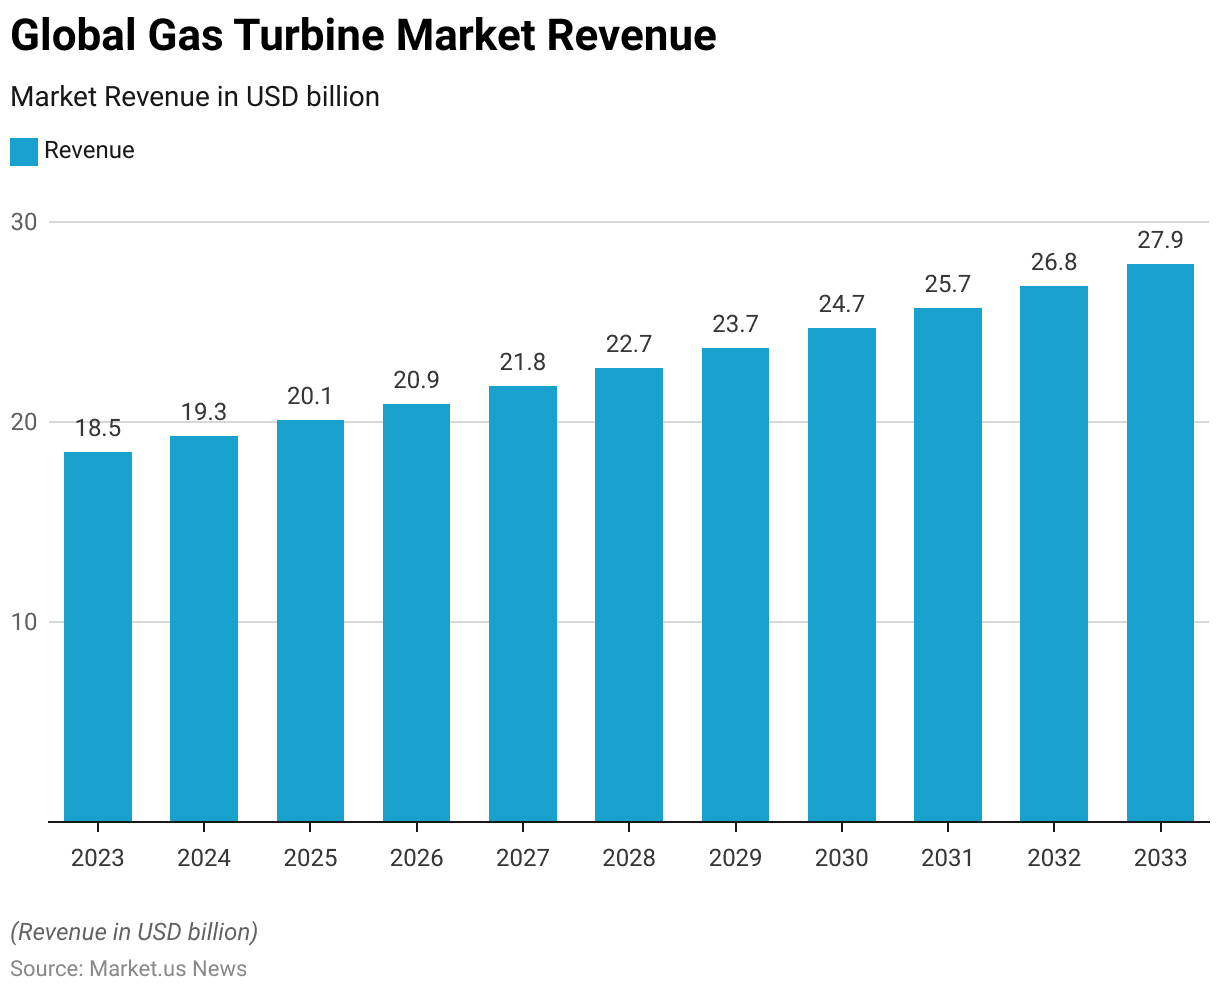
- The global gas turbine market is projected to experience steady growth over the next decade at a CAGR of 4.20%.
- In 2023, the market is valued at USD 18.5 billion, with revenue expected to increase incrementally each year.
- By 2024, it is forecasted to reach USD 19.3 billion, followed by USD 20.1 billion in 2025.
- This growth trajectory continues, with the market size anticipated to expand to USD 20.9 billion in 2026 and USD 21.8 billion in 2027.
- By 2028, revenues are expected to rise to USD 22.7 billion, further increasing to USD 23.7 billion in 2029 and USD 24.7 billion in 2030.
- The upward trend persists in subsequent years, with projections of USD 25.7 billion by 2031, USD 26.8 billion by 2032, and USD 27.9 billion by 2033.
- This consistent growth underscores the expanding demand for gas turbines, driven by advancements in technology, increasing energy needs, and a global shift toward more efficient power generation solutions.
(Source: market.us)
Global Gas Turbine Market Size – By Technology Statistics
2023-2027
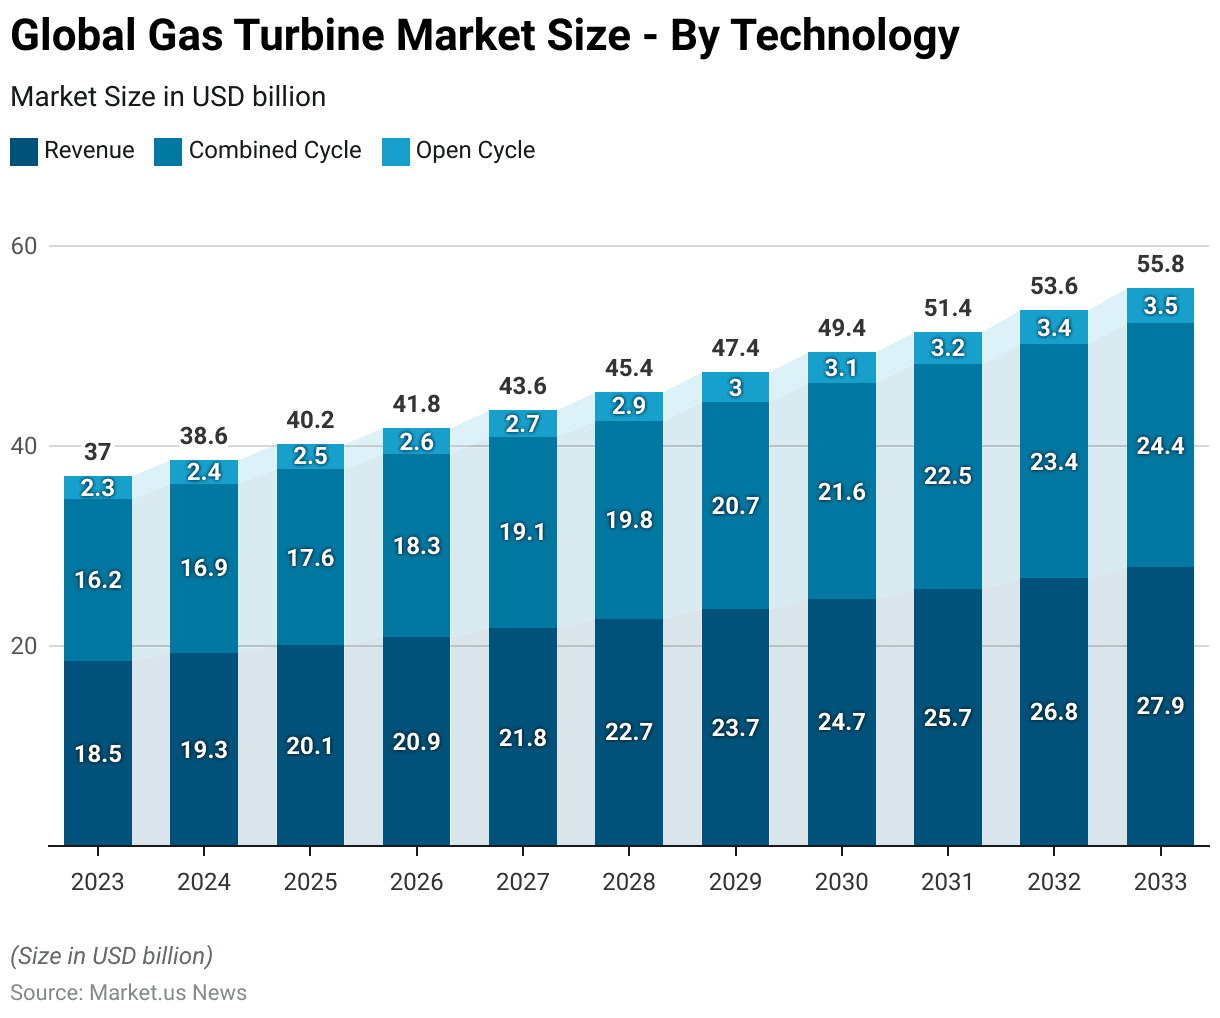
- The global gas turbine market is poised for steady growth, with revenues segmented by technology into combined cycle and open cycle.
- In 2023, the total market revenue is estimated at USD 18.5 billion, of which USD 16.2 billion is attributed to combined cycle technology and USD 2.3 billion to open cycle.
- By 2024, the market is projected to grow to USD 19.3 billion, with the combined cycle contributing USD 16.9 billion and the open cycle USD 2.4 billion.
- This upward trend continues annually, with total market revenue expected to reach USD 20.1 billion in 2025 (combined cycle: USD 17.6 billion, open cycle: USD 2.5 billion) and USD 20.9 billion in 2026 (combined cycle: USD 18.3 billion, open cycle: USD 2.6 billion).
- By 2027, the market is forecasted at USD 21.8 billion, comprising USD 19.1 billion from combined cycle and USD 2.7 billion from open cycle technologies.
2028-2033
- Further growth will see revenues climb to USD 22.7 billion in 2028 (combined cycle: USD 19.8 billion, open cycle: USD 2.9 billion) and USD 23.7 billion in 2029 (combined cycle: USD 20.7 billion, open cycle: USD 3.0 billion).
- In 2030, the market is projected to achieve USD 24.7 billion in revenue, with USD 21.6 billion from the combined cycle and USD 3.1 billion from the open cycle.
- The growth trajectory is set to continue, with the market reaching USD 25.7 billion in 2031 (combined cycle: USD 22.5 billion, open cycle: USD 3.2 billion), USD 26.8 billion in 2032 (combined cycle: USD 23.4 billion, open cycle: USD 3.4 billion), and USD 27.9 billion in 2033 (combined cycle: USD 24.4 billion, open cycle: USD 3.5 billion).
- This consistent growth highlights the increasing adoption of gas turbines, driven by the demand for efficient energy solutions, with combined cycle technology leading the market while open cycle sees steady gains.
(Source: market.us)
Competitive Landscape of Global Gas Turbine Market Statistics
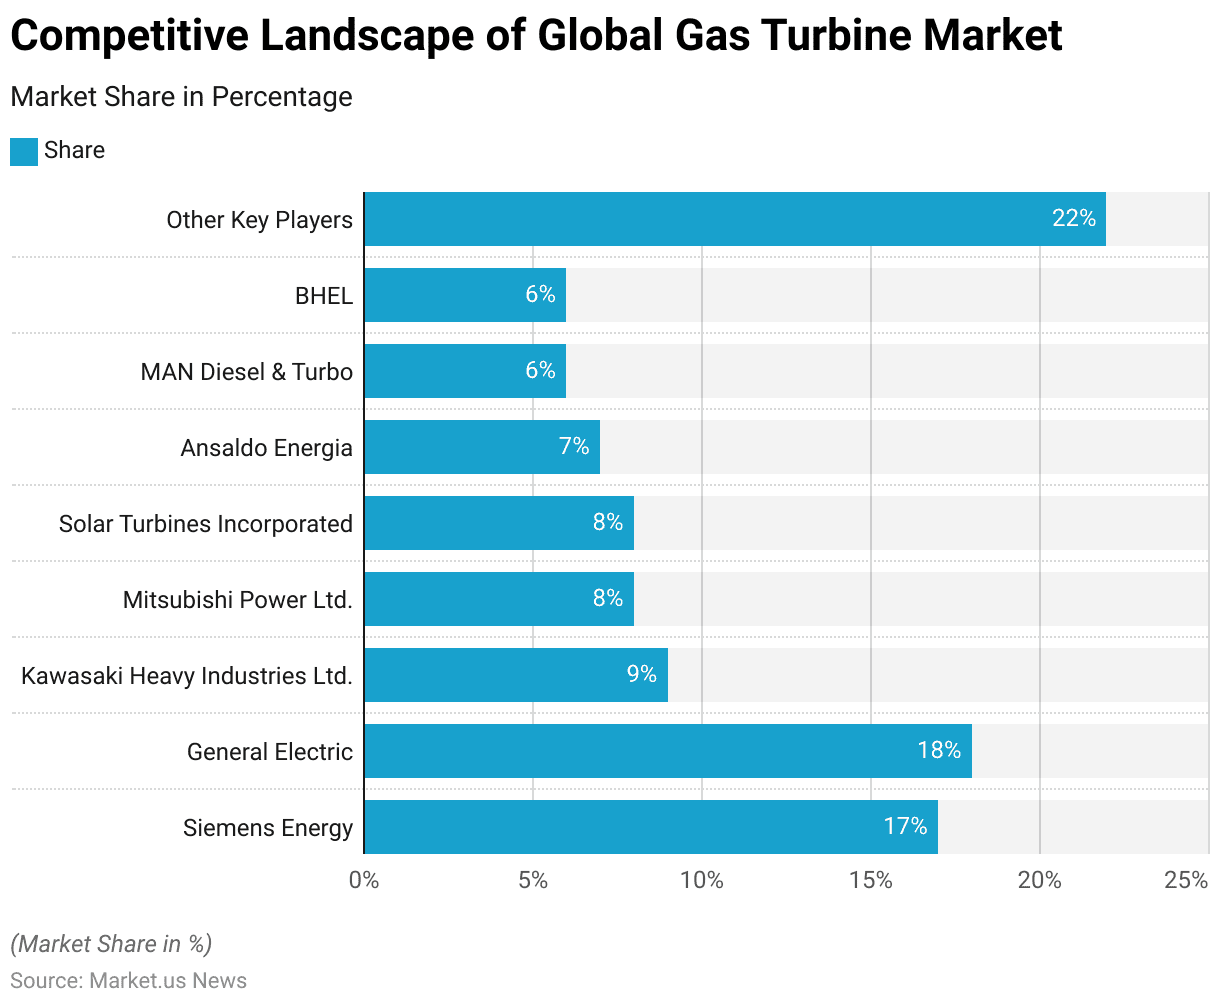
- Several key players dominated the competitive landscape of the global gas turbine market in 2021.
- General Electric held the largest market share at 18%, closely followed by Siemens Energy with 17%.
- Kawasaki Heavy Industries Ltd. accounted for 9% of the market, while Mitsubishi Power Ltd. and Solar Turbines Incorporated each captured an 8% share.
- Ansaldo Energia held a 7% share, with MAN Diesel & Turbo and BHEL each contributing 6% to the market.
- The remaining 22% of the market was occupied by other key players, reflecting a competitive and diverse industry environment.
- This distribution highlights the dominance of a few major companies while emphasizing the significant role of smaller players in driving innovation and meeting diverse market demands.
(Source: market.us)
Leading Gas Turbine Manufacturers – Based On Global Market Share Statistics
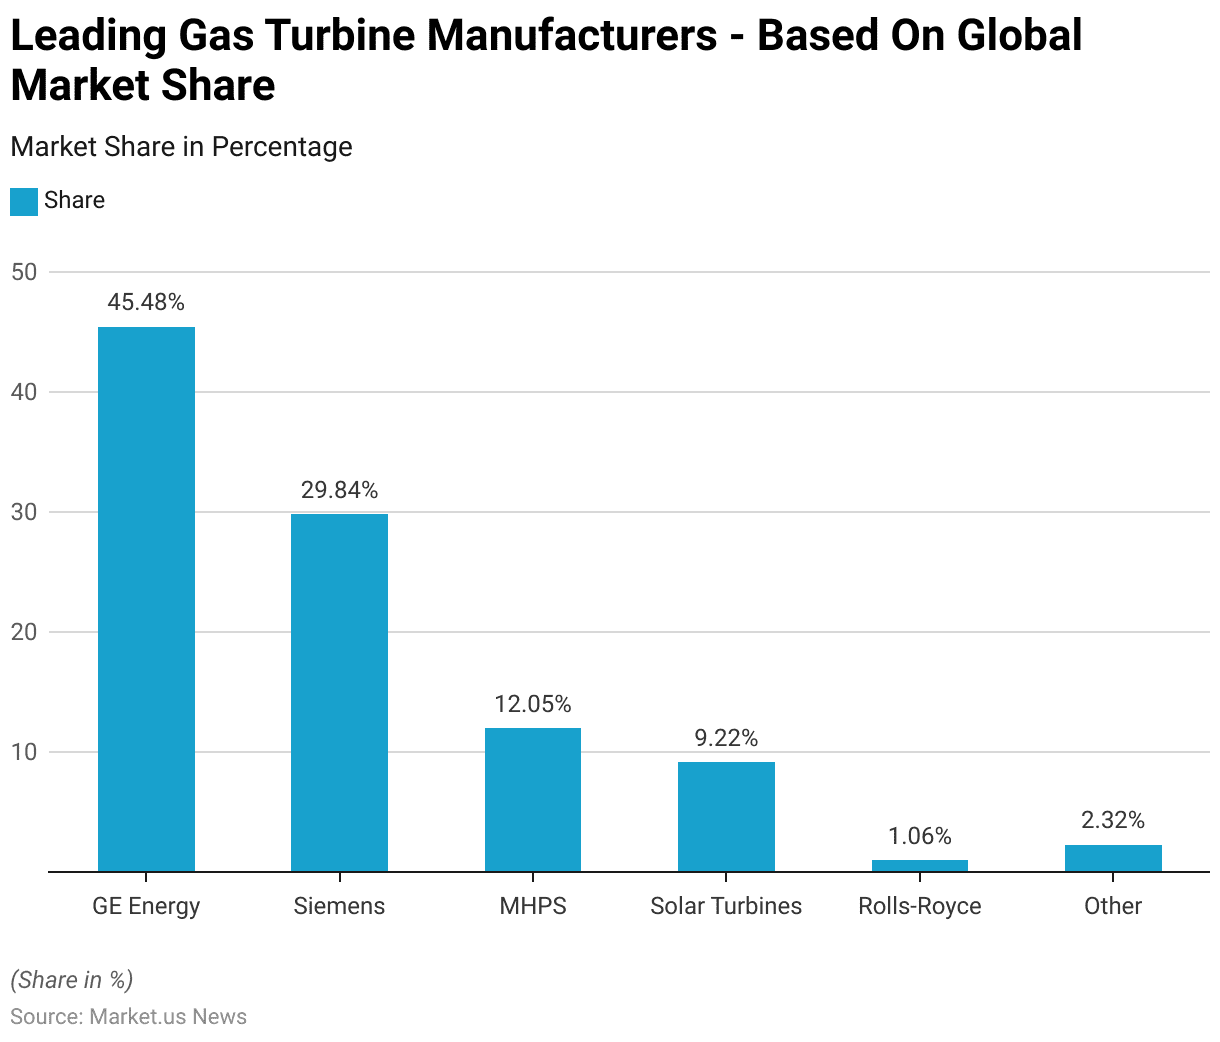
- Between 2016 and 2025, the global gas turbine market has been dominated by a few key manufacturers.
- GE Energy holds the largest market share at 45.48%, underscoring its leading position in the industry.
- Siemens follows with a significant share of 29.84%, further highlighting its substantial presence.
- Mitsubishi Hitachi Power Systems (MHPS) accounts for 12.05% of the market, while Solar Turbines captures 9.22%.
- Rolls-Royce has a modest share of 1.06%, and other manufacturers collectively represent 2.32% of the market.
- This concentration of market share among a few major players demonstrates their pivotal role in shaping the industry, while smaller competitors also contribute to technological innovation and market diversity.
(Source: Statista)
Global Gas Turbine Market Share – By Region Statistics
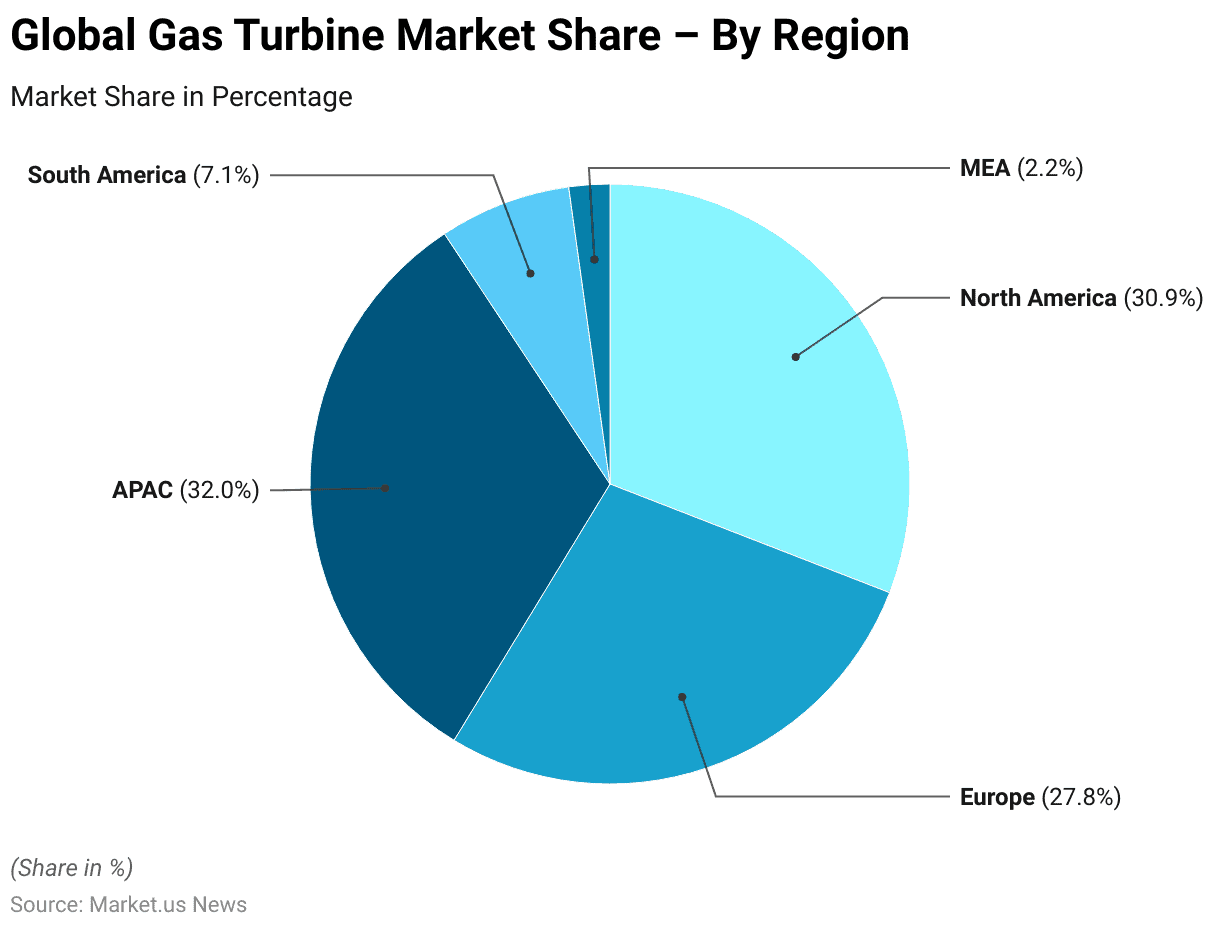
- In 2021, the global gas turbine market exhibited a diverse regional distribution, with the Asia-Pacific (APAC) region leading the market, holding a 32.0% share.
- North America followed closely, accounting for 30.9% of the market.
- Europe represented 27.8% of the global market, showcasing its significant contribution.
- South America held a smaller yet notable share of 7.1%, while the Middle East and Africa (MEA) accounted for 2.2% of the market.
- This distribution underscores the dominance of APAC and North America, which are driven by high demand for energy and industrial applications, while Europe also remains a critical market player.
- South America and MEA, though holding smaller shares, present potential opportunities for growth in the coming years.
(Source: market.us)
Gas Turbine Orders Statistics
Orders for Gas Turbine Used for Power Generation Globally – By Region Statistics
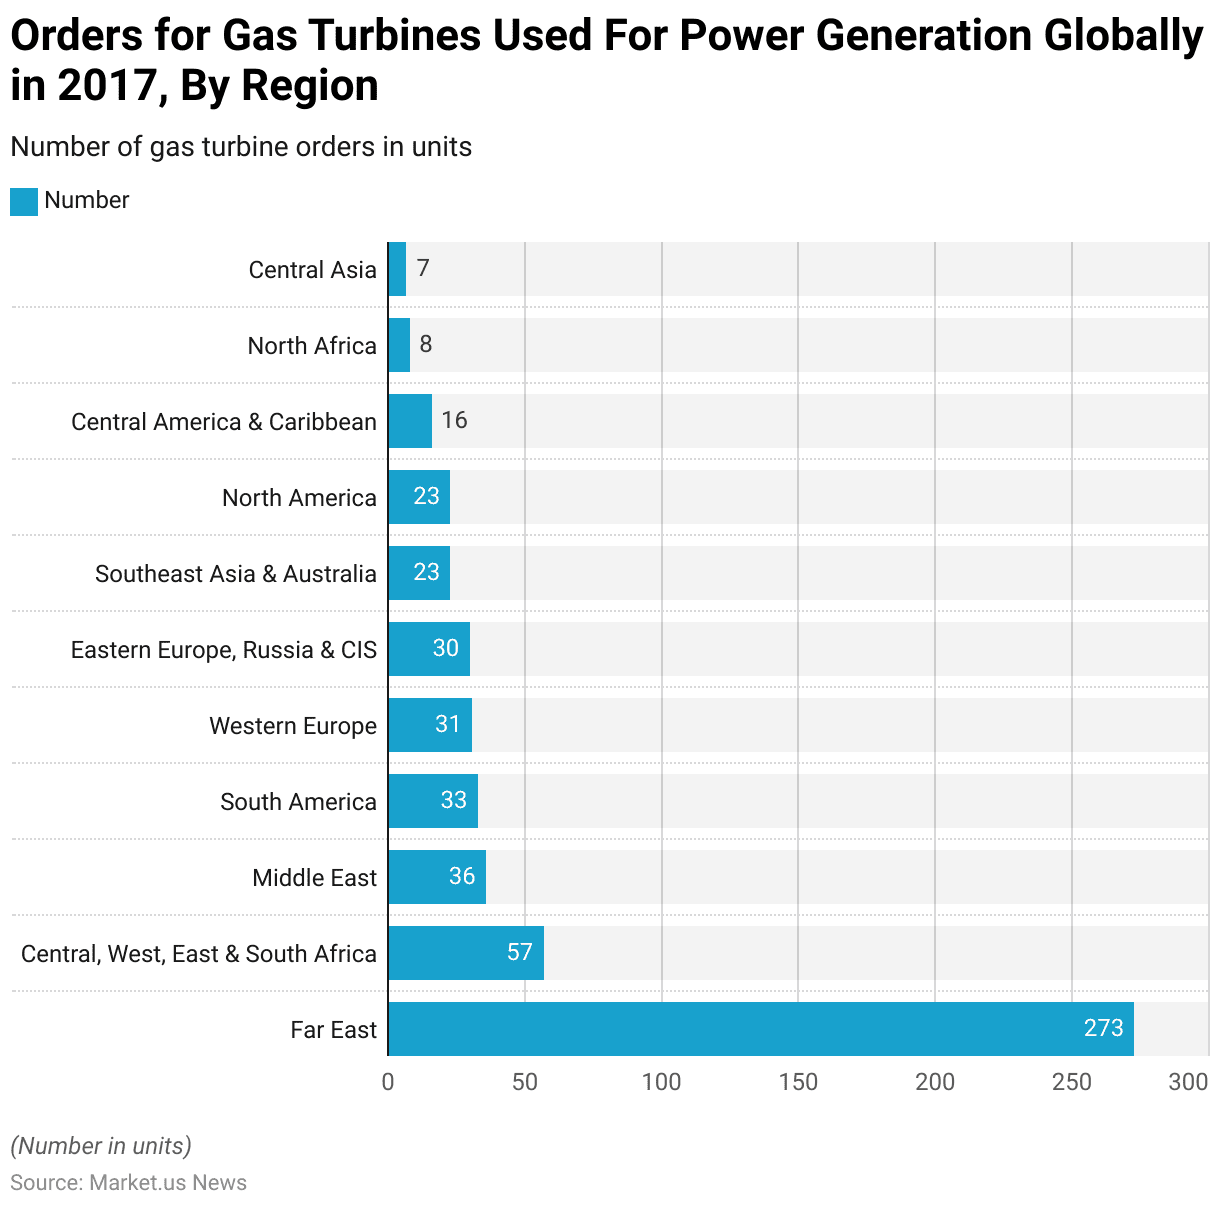
- In 2017, the global orders for gas turbines used in power generation were led by the Far East region, which recorded the highest number of orders at 273 units, reflecting the region’s significant demand for electricity and ongoing infrastructure development.
- Central, West, East, and South Africa collectively accounted for 57 units, driven by efforts to expand and modernize power generation capacities.
- The Middle East followed with 36 units, underpinned by the region’s growing energy needs and diversification strategies.
- South America placed next with 33 orders, supported by various infrastructure projects aimed at bolstering energy security.
- Western Europe and Eastern Europe, including Russia and the CIS, registered 31 and 30 orders, respectively, influenced by modernization initiatives and compliance with environmental regulations.
- Southeast Asia and Australia, along with North America, each accounted for 23 units, reflecting steady demand for gas turbines in both regions.
- Central America and the Caribbean recorded 16 orders, while North Africa followed with eight units.
- Lastly, Central Asia placed at the lower end with seven orders, indicative of the region’s comparatively lower but emerging demand for gas turbine technology.
- This distribution underscores the varying energy requirements and investment levels across different regions.
(Source: Statista)
Orders for Gas Turbine for Power Generation Globally – By Fuel Type Statistics
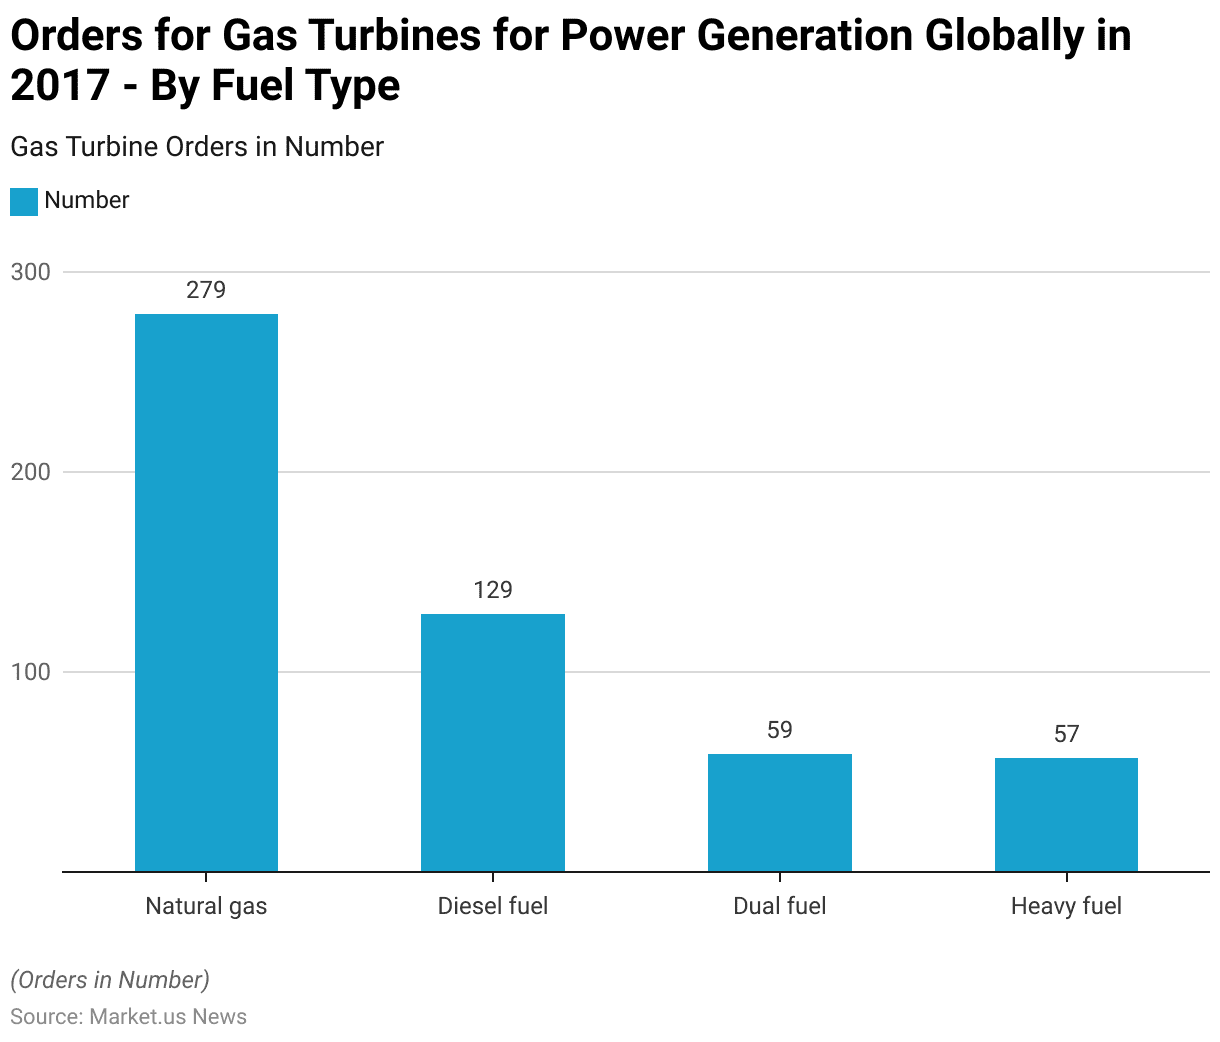
- In 2017, global orders for gas turbines used in power generation were primarily driven by natural gas, which accounted for the highest number of orders at 279 units.
- This highlights the continued preference for natural gas due to its efficiency, lower emissions, and widespread availability.
- Diesel fuel followed as the second most popular choice, with 129 units ordered, reflecting its utility in regions where natural gas infrastructure is limited or where flexibility in fuel sourcing is required.
- Dual-fuel turbines, capable of operating on both natural gas and liquid fuels, saw 59 units ordered, demonstrating the demand for versatile solutions in power generation.
- Lastly, heavy-fuel oil-based turbines accounted for 57 units, indicating their continued use in specific markets or applications where heavy fuel remains a viable energy source.
- This distribution underscores the dominance of natural gas while showcasing the continued relevance of alternative fuels in certain contexts.
(Source: Statista)
Electricity Generation from Natural Gas-Fired Turbines
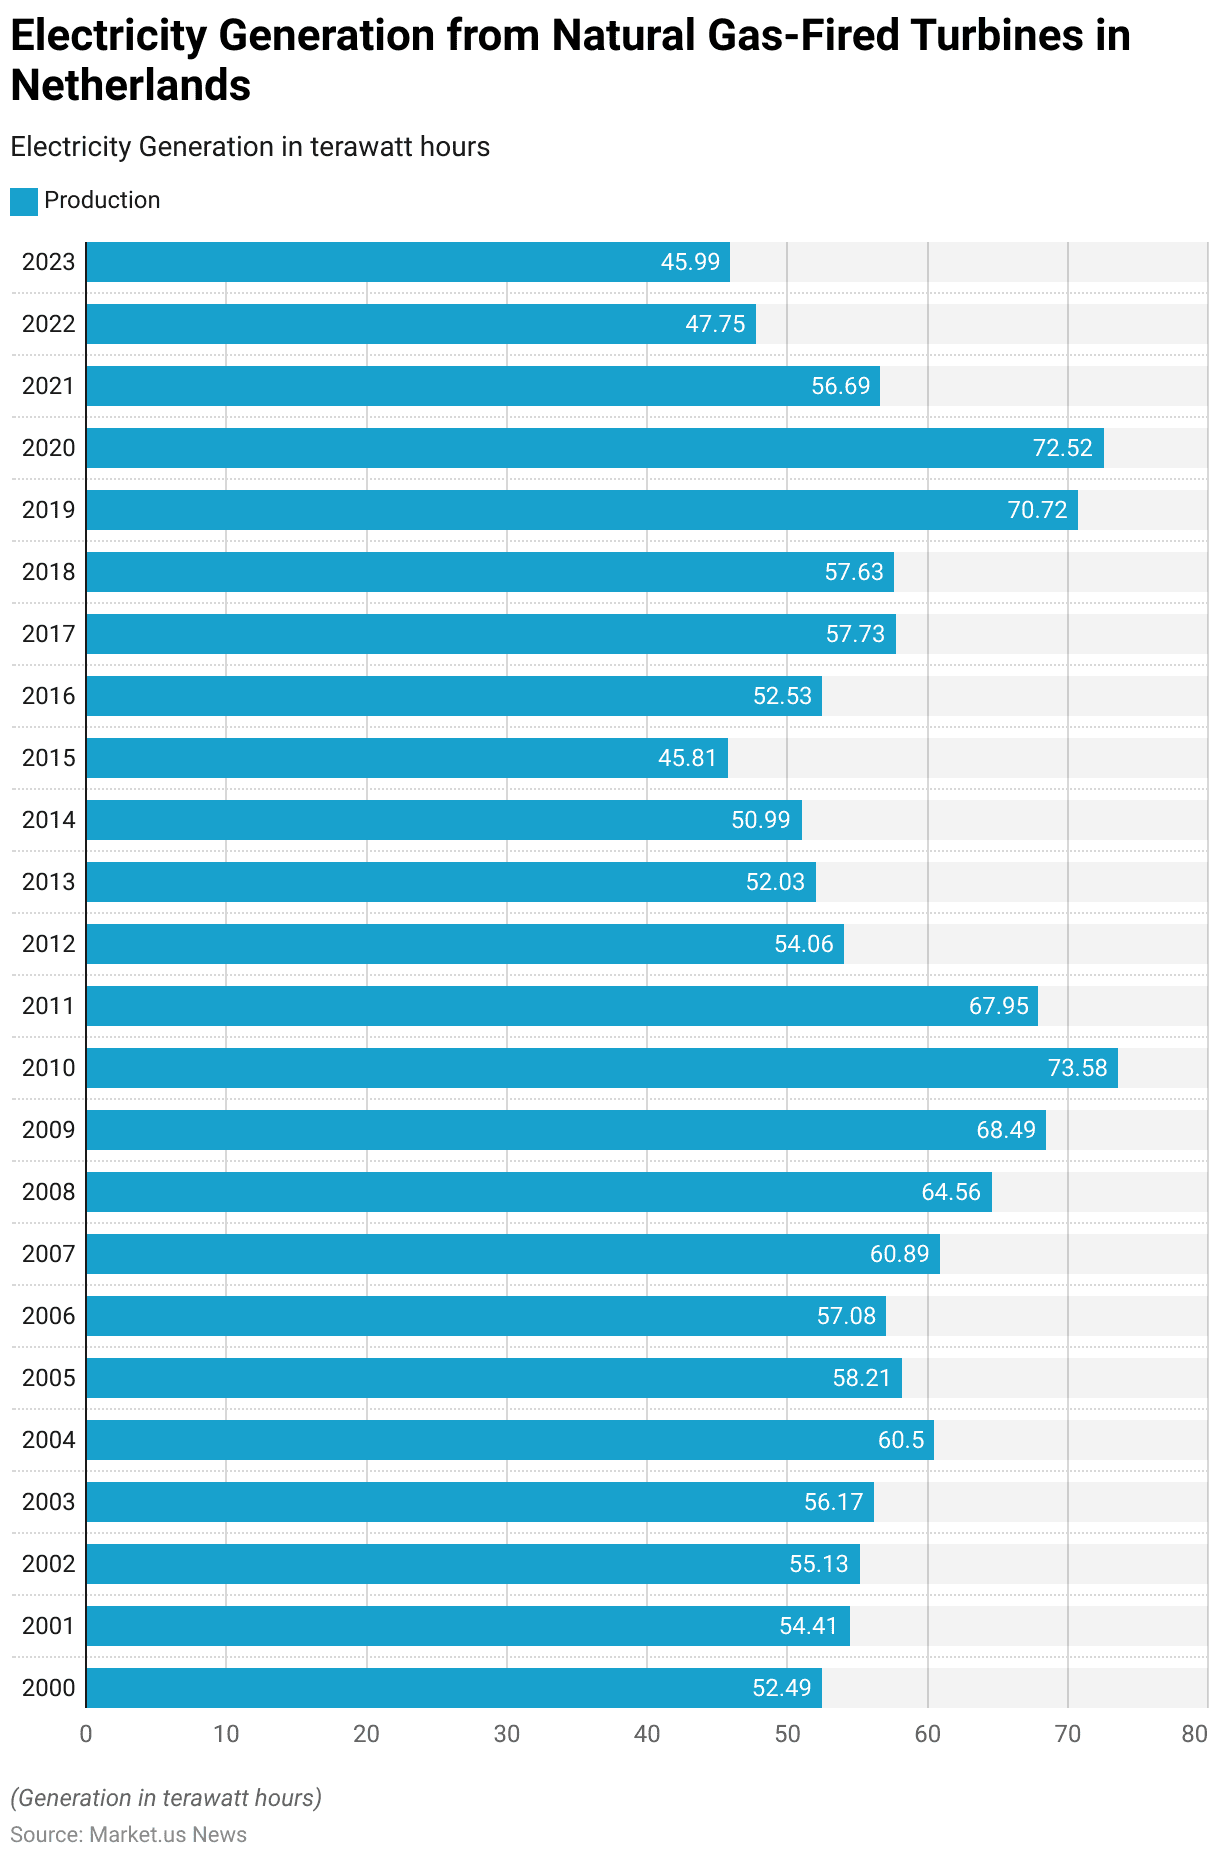
- Electricity generation from natural gas-fired turbines in the Netherlands experienced significant fluctuations between 2000 and 2023.
- In 2000, production was recorded at 52.49 terawatt hours (TWh) and steadily increased to 73.58 TWh by 2010, marking the highest point within the observed period.
- From 2011 to 2015, electricity generation showed a downward trend, declining from 67.95 TWh in 2011 to 45.81 TWh in 2015, likely due to a shift towards other energy sources and increased efficiency measures.
- However, from 2016 to 2020, natural gas-fired electricity saw a resurgence, with generation peaking again at 72.52 TWh in 2020, influenced by higher demand and possibly the phase-out of coal-fired plants.
- In the subsequent years, production fell sharply to 47.75 TWh in 2022 and 45.99 TWh in 2023, reflecting a potential decline in reliance on natural gas amid energy transition policies and the growing adoption of renewable energy sources.
- This trend highlights the dynamic nature of the Netherlands’ energy mix and its adaptation to environmental and market pressures over time.
(Source: Statista)
Plant Load Factor of Combined Cycle Gas Turbine Stations Statistics
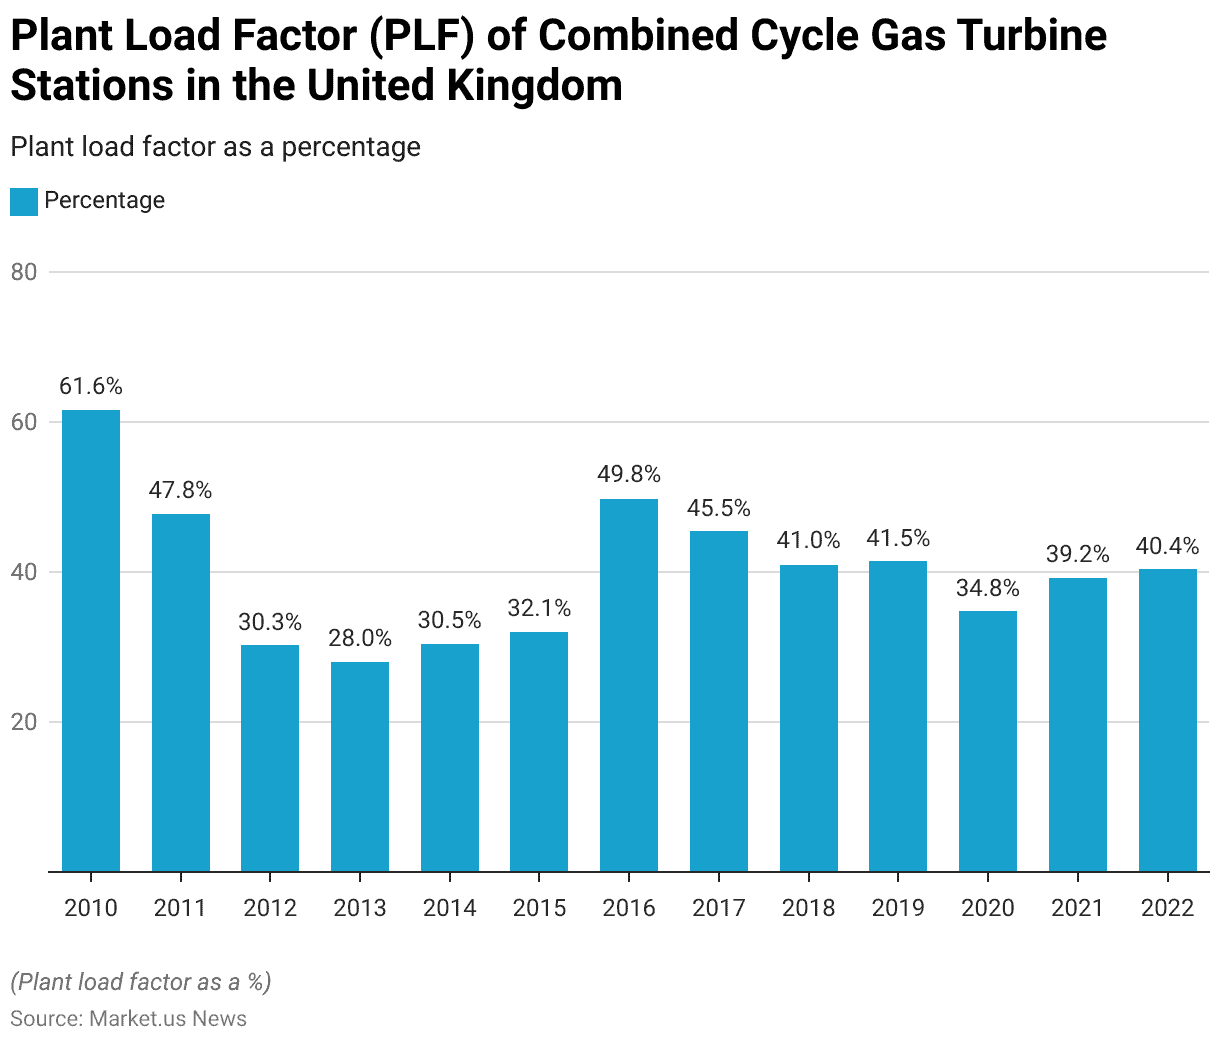
- The plant load factor (PLF) of combined cycle gas turbine (CCGT) stations in the United Kingdom has shown significant fluctuations from 2010 to 2022.
- In 2010, the PLF was at its peak, reaching 61.6%, indicating a high level of utilization.
- However, it declined sharply in the following years, falling to 47.8% in 2011 and further dropping to 30.3% in 2012.
- The downward trend continued in 2013 with a PLF of 28%, marking the lowest point during this period.
- Between 2014 and 2015, the PLF remained relatively stable at around 30.5% and 32.1%, respectively.
- A notable recovery occurred in 2016, when the PLF rose to 49.8%, followed by a slight decline to 45.5% in 2017.
- From 2018 to 2019, the PLF stabilized at approximately 41% before experiencing another dip to 34.8% in 2020, likely impacted by reduced energy demand during the COVID-19 pandemic.
- In the subsequent years, the PLF showed gradual improvement, reaching 39.2% in 2021 and 40.4% in 2022.
- This trend reflects the changing dynamics of the UK’s energy mix and the role of CCGT stations in meeting fluctuating electricity demand.
(Source: Statista)
Capacity of Combined-Cycle Natural Gas Turbine – By Configuration Statistics
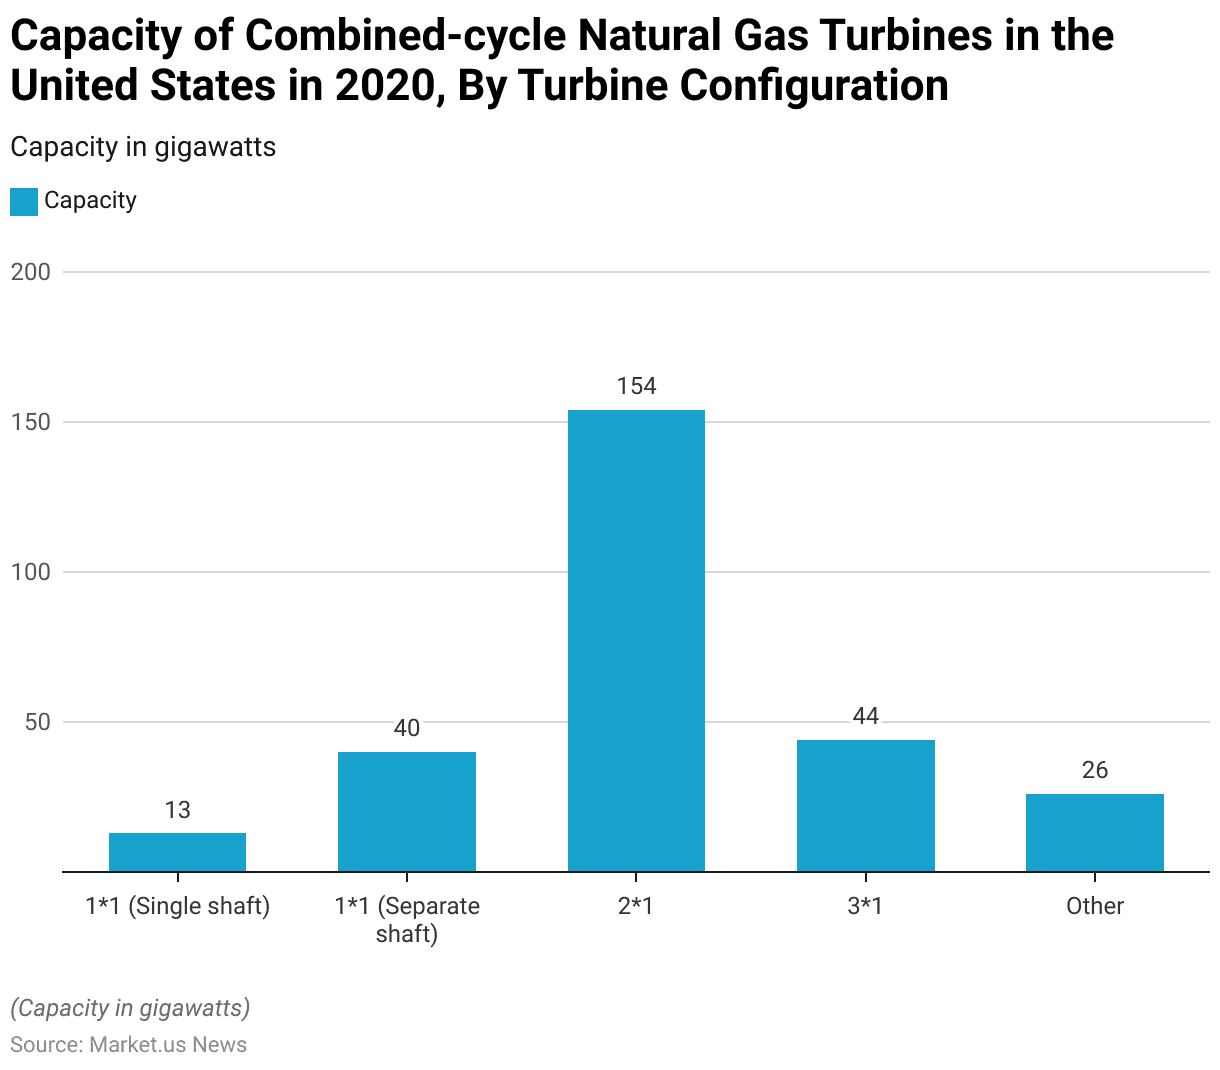
- In 2020, the capacity of combined-cycle natural gas turbines in the United States varied significantly based on turbine configuration.
- The 21 configuration, which typically consists of two gas turbines paired with one steam turbine, accounted for the largest share, with a total capacity of 154 gigawatts (GW).
- This was followed by the 31 configuration, with 44 GW, highlighting its importance in large-scale power generation.
- The 1*1 configuration was split into two categories: separate shaft systems, which contributed 40 GW, and single shaft systems, with a smaller capacity of 13 GW.
- Other configurations collectively accounted for 26 GW of capacity.
- This distribution underscores the dominance of multi-turbine configurations in maximizing efficiency and output in the U.S. power sector.
(Source: Statista)
Transmission Entry Capacity (TEC) of Combined Cycle Gas Turbine Stations Statistics
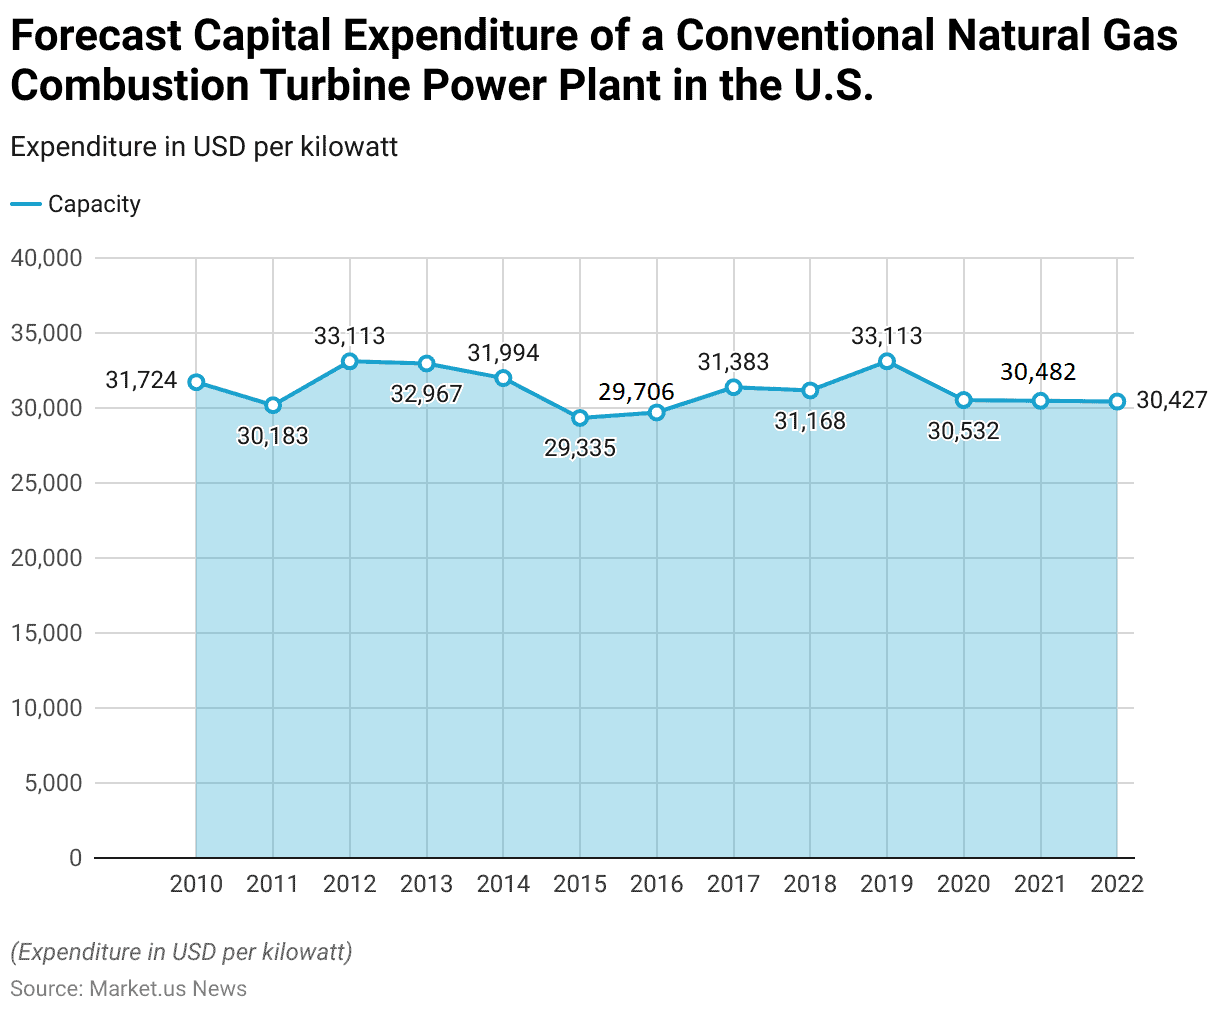
- The transmission entry capacity (TEC) of combined cycle gas turbine (CCGT) stations in the United Kingdom exhibited fluctuations between 2010 and 2022.
- In 2010, the TEC stood at 31,724 megawatts (MW), which declined to 30,183 MW in 2011 before increasing to a peak of 33,113 MW in 2012.
- A slight decrease was observed in 2013 with 32,967 MW, followed by another decline to 31,994 MW in 2014.
- The downward trend continued into 2015 and 2016, with TEC figures of 29,335 MW and 29,706 MW, respectively.
- By 2017, TEC had recovered slightly to 31,383 MW and remained stable in 2018 at 31,168 MW.
- In 2019, TEC returned to its peak value of 33,113 MW, reflecting improved transmission capacity during that year.
- However, the subsequent years saw gradual reductions, with TEC recorded at 30,532 MW in 2020, 30,482 MW in 2021, and 30,427 MW in 2022.
- These changes reflect ongoing adjustments in the UK’s energy infrastructure and the evolving role of CCGT stations in meeting electricity demand.
(Source: Statista)
Thermal Efficiency of Combined Cycle Gas Turbine Stations Statistics
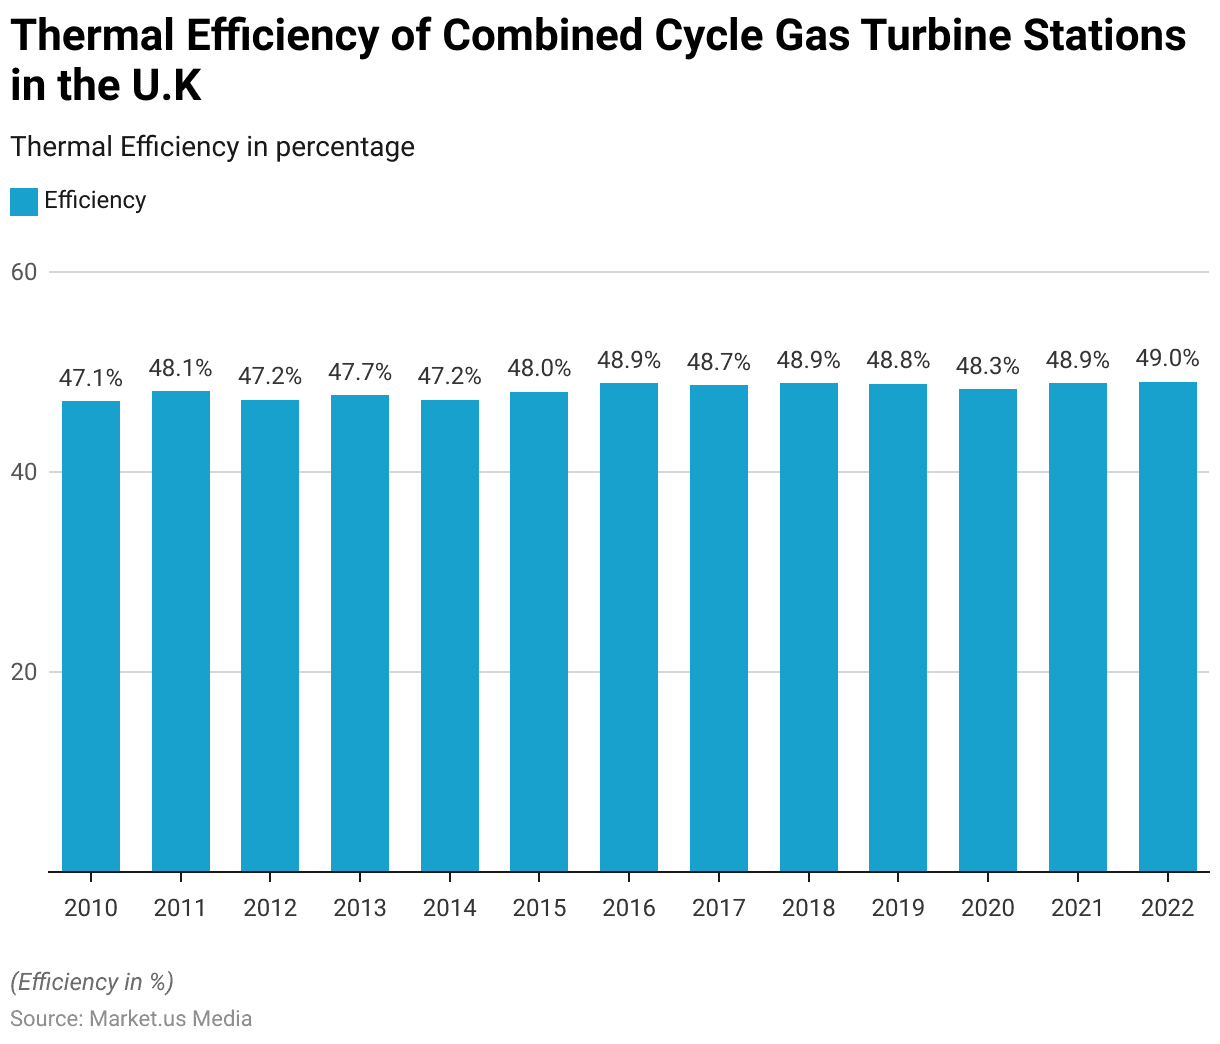
- The thermal efficiency of combined cycle gas turbine (CCGT) stations in the United Kingdom exhibited a gradual upward trend between 2010 and 2022.
- In 2010, the thermal efficiency was recorded at 47.1%, increasing to 48.1% in 2011.
- This was followed by minor fluctuations, with efficiency at 47.2% in both 2012 and 2014 and a slight rise to 47.7% in 2013.
- By 2015, the thermal efficiency reached 48%.
- From 2016 onward, the efficiency consistently improved, with 48.9% recorded in 2016 and a slight dip to 48.7% in 2017.
- The efficiency returned to 48.9% in both 2018 and 2021, with a marginal decline to 48.8% in 2019 and 48.3% in 2020.
- By 2022, the thermal efficiency reached its highest point at 49%, reflecting advancements in technology and operational improvements over the years.
- This steady increase underscores efforts to enhance the energy efficiency of CCGT stations in the UK’s power generation sector.
(Source: Statista)
Expenditure Required for Gas Turbine Statistics
Conventional F Class Natural Gas Combined-cycle Power Plant
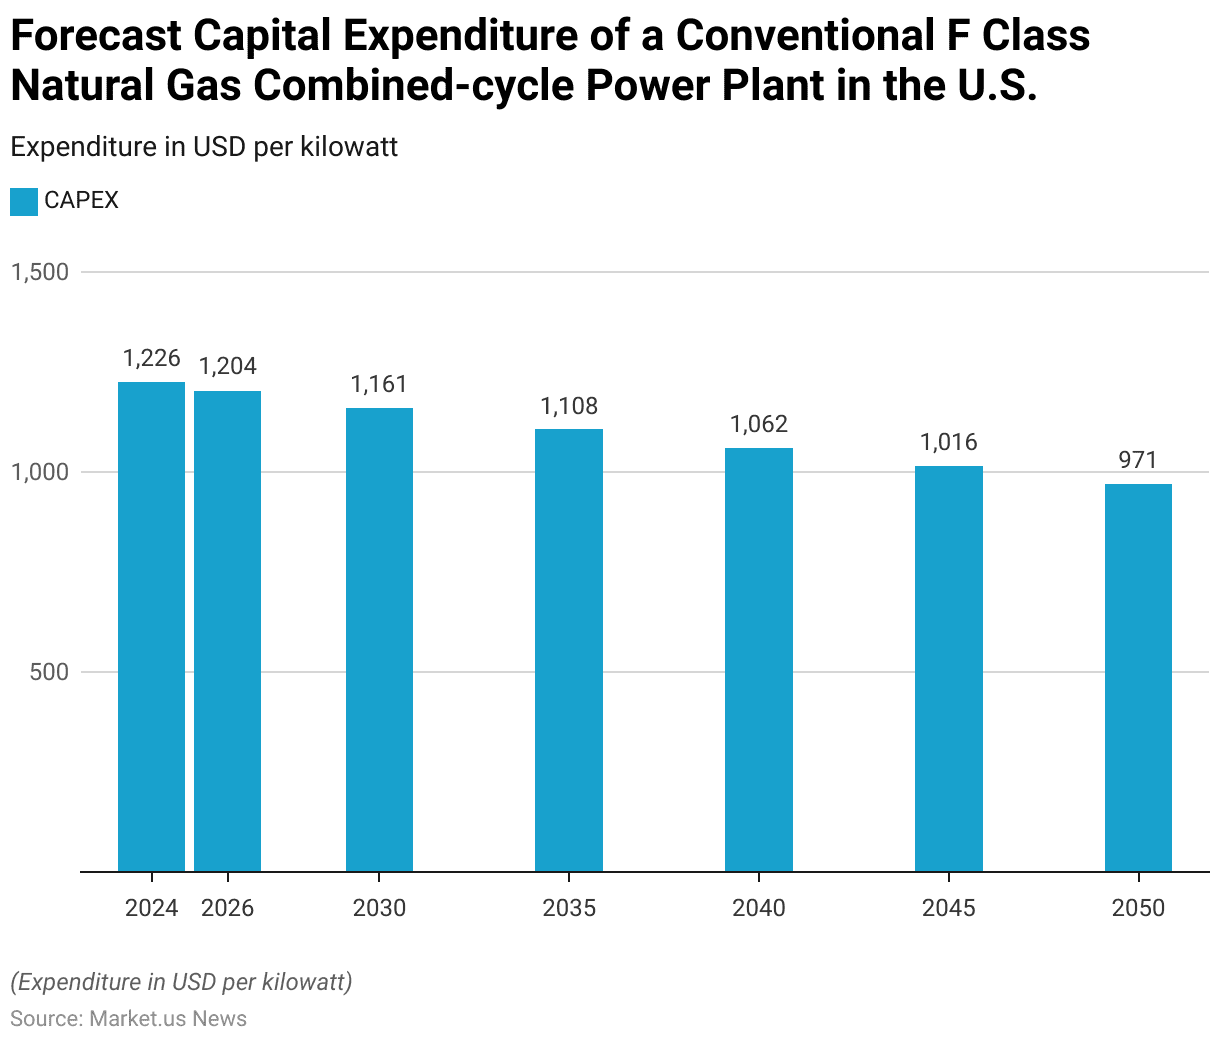
- The forecasted capital expenditure (CAPEX) for a conventional F-class natural gas combined-cycle power plant in the United States is expected to decline steadily from 2024 to 2050.
- In 2024, the CAPEX is projected at $1,226 per kilowatt, which will decrease to $1,204 per kilowatt by 2026.
- This downward trend continues through 2030, with an estimated CAPEX of $1,161 per kilowatt, and further reduces to $1,108 per kilowatt by 2035.
- By 2040, the CAPEX is expected to drop to $1,062 per kilowatt, reaching $1,016 per kilowatt in 2045.
- Finally, by 2050, the CAPEX is forecasted to fall to $971 per kilowatt.
- This gradual reduction reflects advancements in technology, efficiency improvements, and potential cost optimizations in the construction and operation of gas combined-cycle power plants over the coming decades.
(Source: Statista)
Conventional Natural Gas Combustion Turbine Power Plant
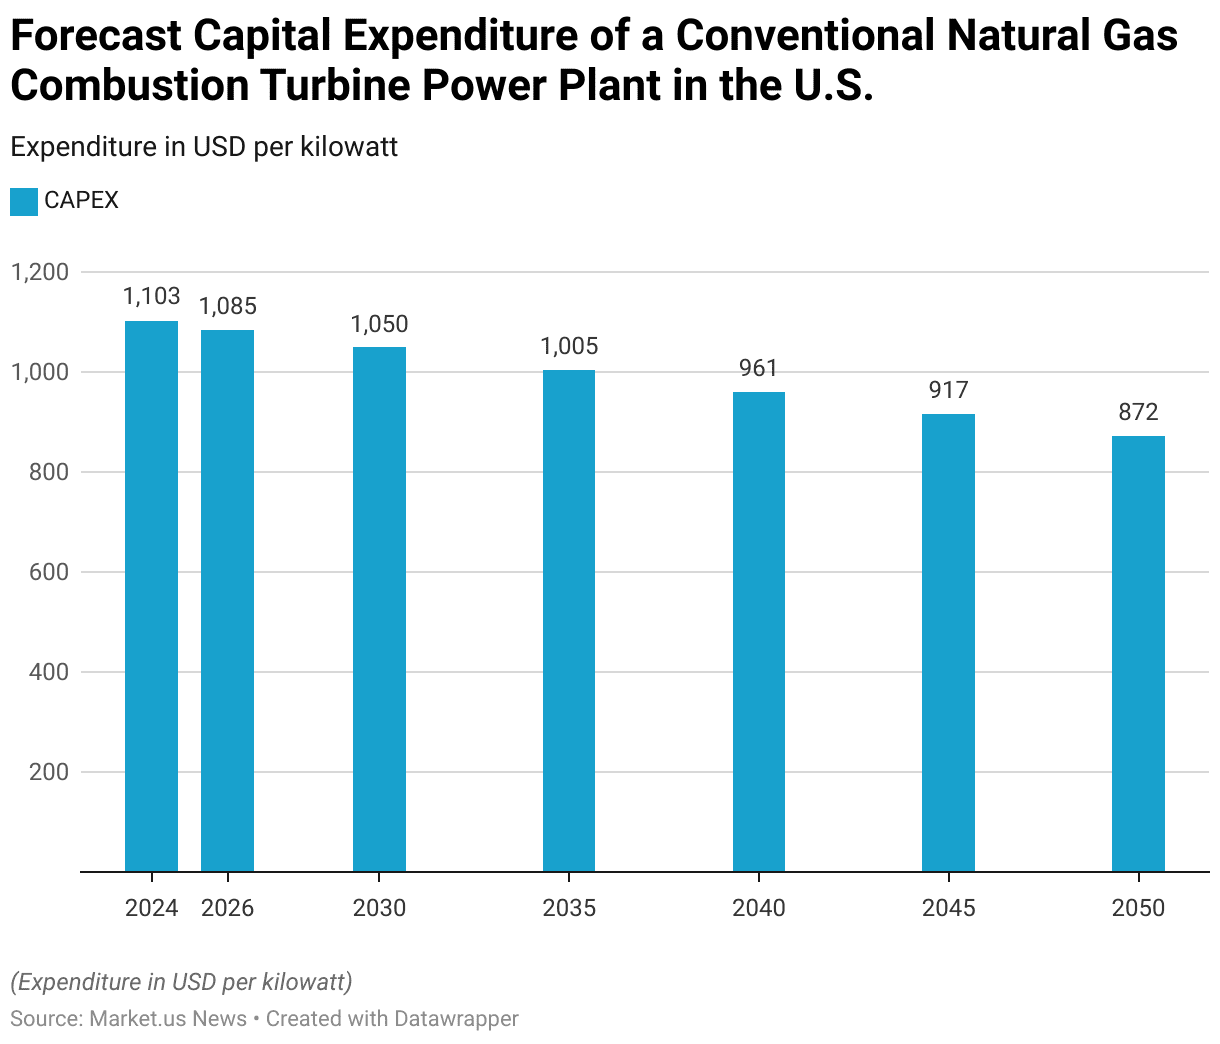
- The forecasted capital expenditure (CAPEX) for a conventional natural gas combustion turbine power plant in the United States is expected to decline gradually from 2024 to 2050.
- In 2024, the CAPEX is projected to be $1,103 per kilowatt, decreasing to $1,085 per kilowatt by 2026.
- This trend continues, with the CAPEX estimated at $1,050 per kilowatt in 2030 and $1,005 per kilowatt in 2035.
- By 2040, the expenditure is anticipated to drop to $961 per kilowatt, followed by $917 per kilowatt in 2045.
- The decline is projected to continue through 2050 when the CAPEX is expected to reach $872 per kilowatt.
- These reductions reflect advancements in technology and improvements in the efficiency and cost-effectiveness of natural gas combustion turbine power plants over time.
(Source: Statista)
Export and Import Statistics of Gas Turbine Statistics
Gas Turbine Exports – By Country Statistics
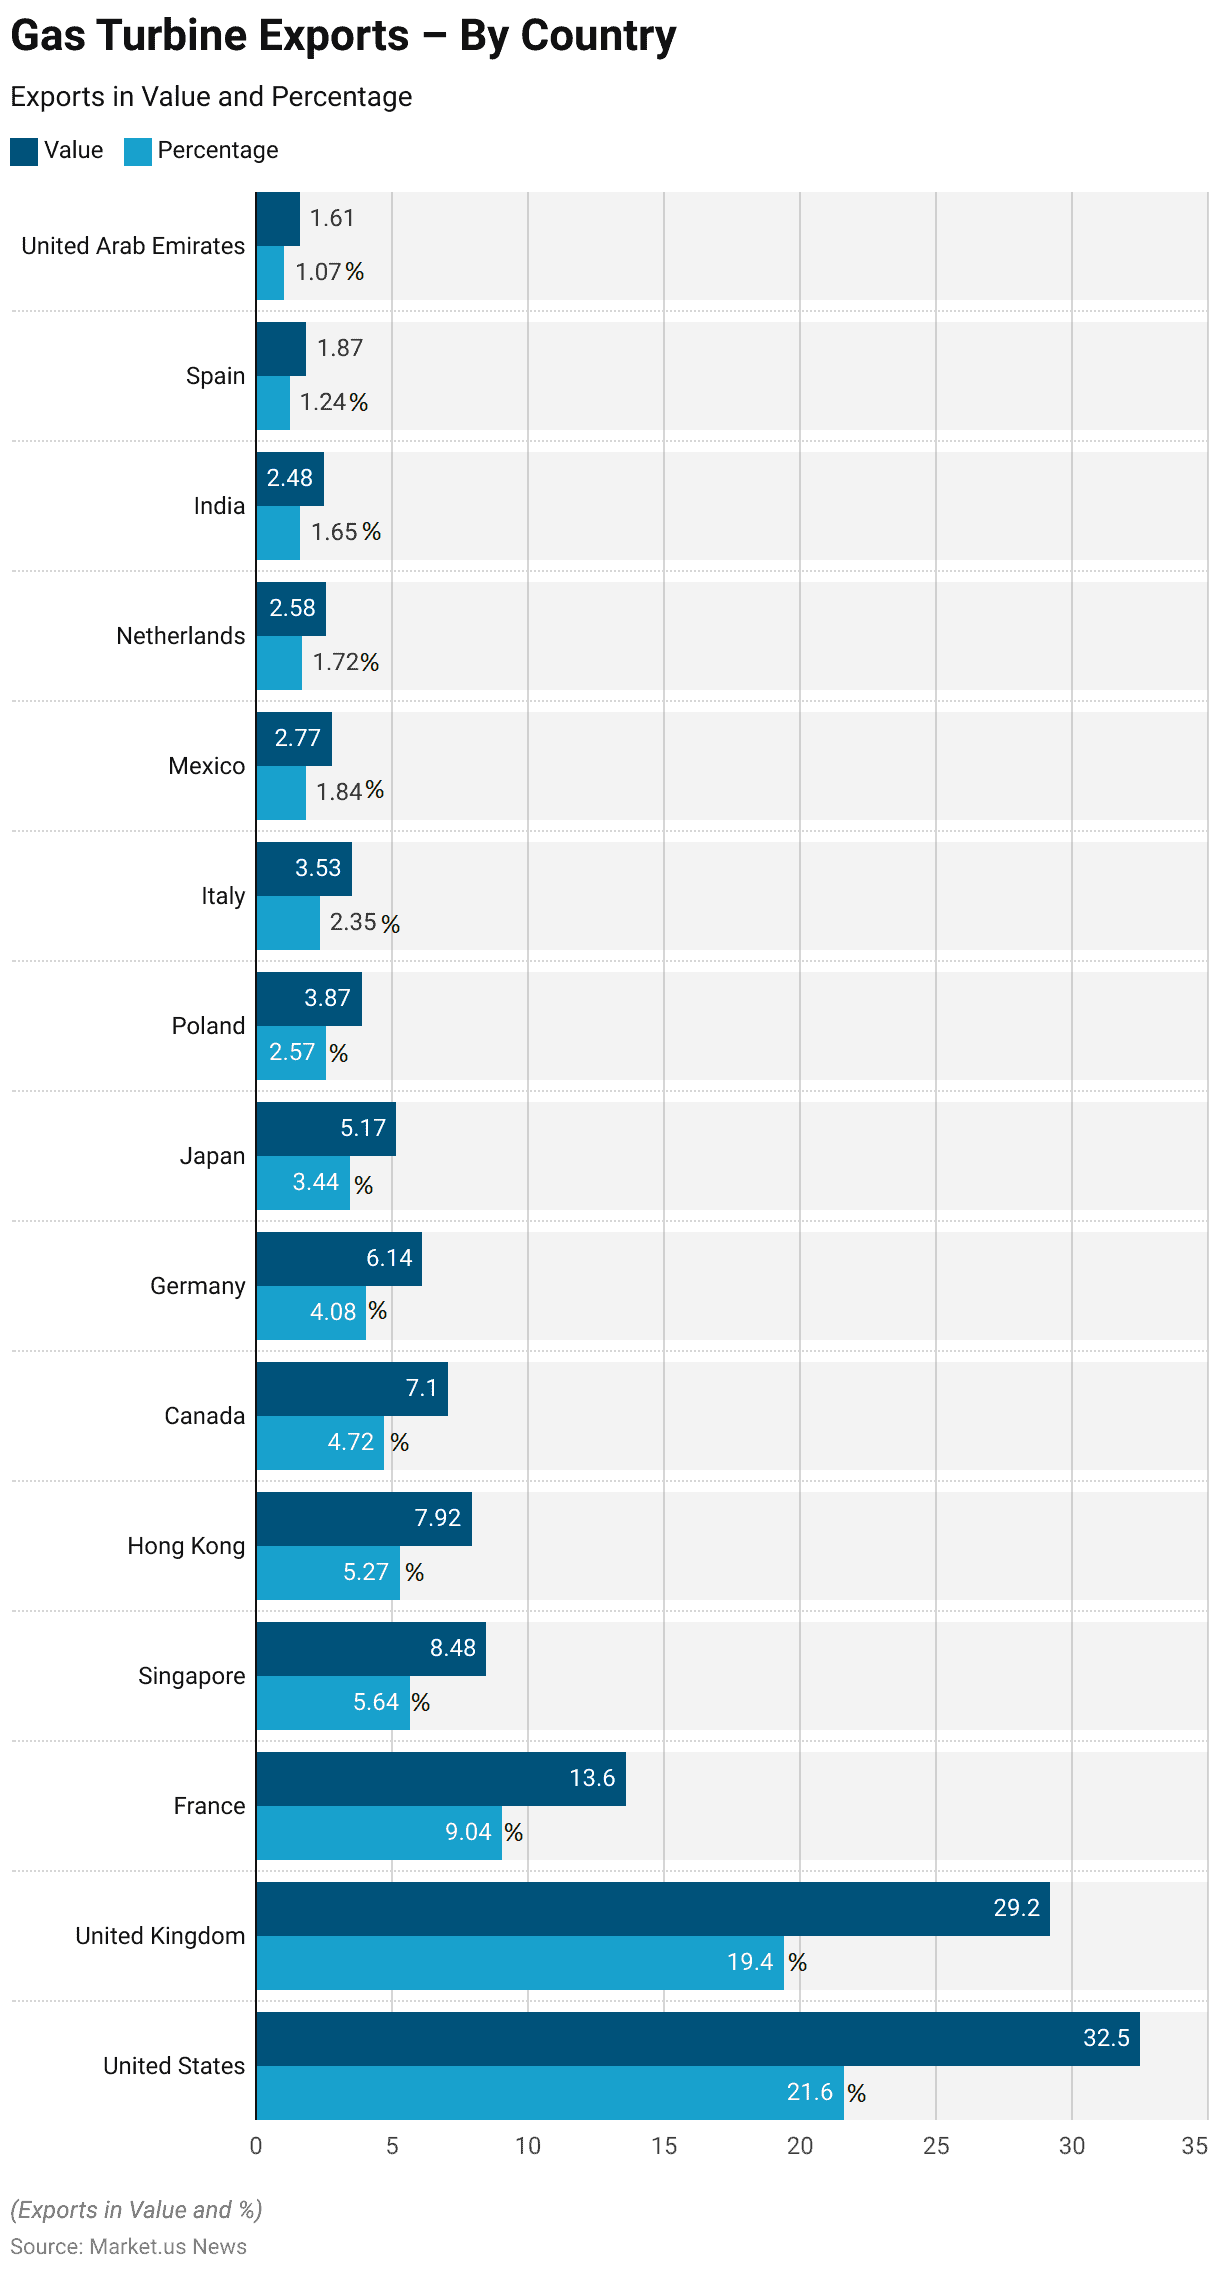
- In 2022, the global gas turbine export market was led by the United States, which accounted for the largest share with an export value of USD 32.5 billion, representing 21.60% of total exports.
- The United Kingdom followed closely, exporting gas turbines worth USD 29.2 billion and capturing 19.40% of the market.
- France ranked third with USD 13.6 billion, contributing 9.04% to the global total.
- Singapore and Hong Kong also made notable contributions, exporting USD 8.48 billion (5.64%) and USD 7.92 billion (5.27%), respectively.
- Canada and Germany were key players as well, with export values of USD 7.1 billion (4.72%) and USD 6.14 billion (4.08%), while Japan accounted for USD 5.17 billion (3.44%).
- Other significant exporters included Poland (USD 3.87 billion, 2.57%), Italy (USD 3.53 billion, 2.35%), and Mexico (USD 2.77 billion, 1.84%).
- Smaller shares were held by the Netherlands (USD 2.58 billion, 1.72%), India (USD 2.48 billion, 1.65%), Spain (USD 1.87 billion, 1.24%), and the United Arab Emirates (USD 1.61 billion, 1.07%).
- This distribution highlights the dominance of developed economies in the gas turbine export market, with emerging economies playing smaller but growing roles.
(Source: OEC World)
Gas Turbine Imports – By Country Statistics
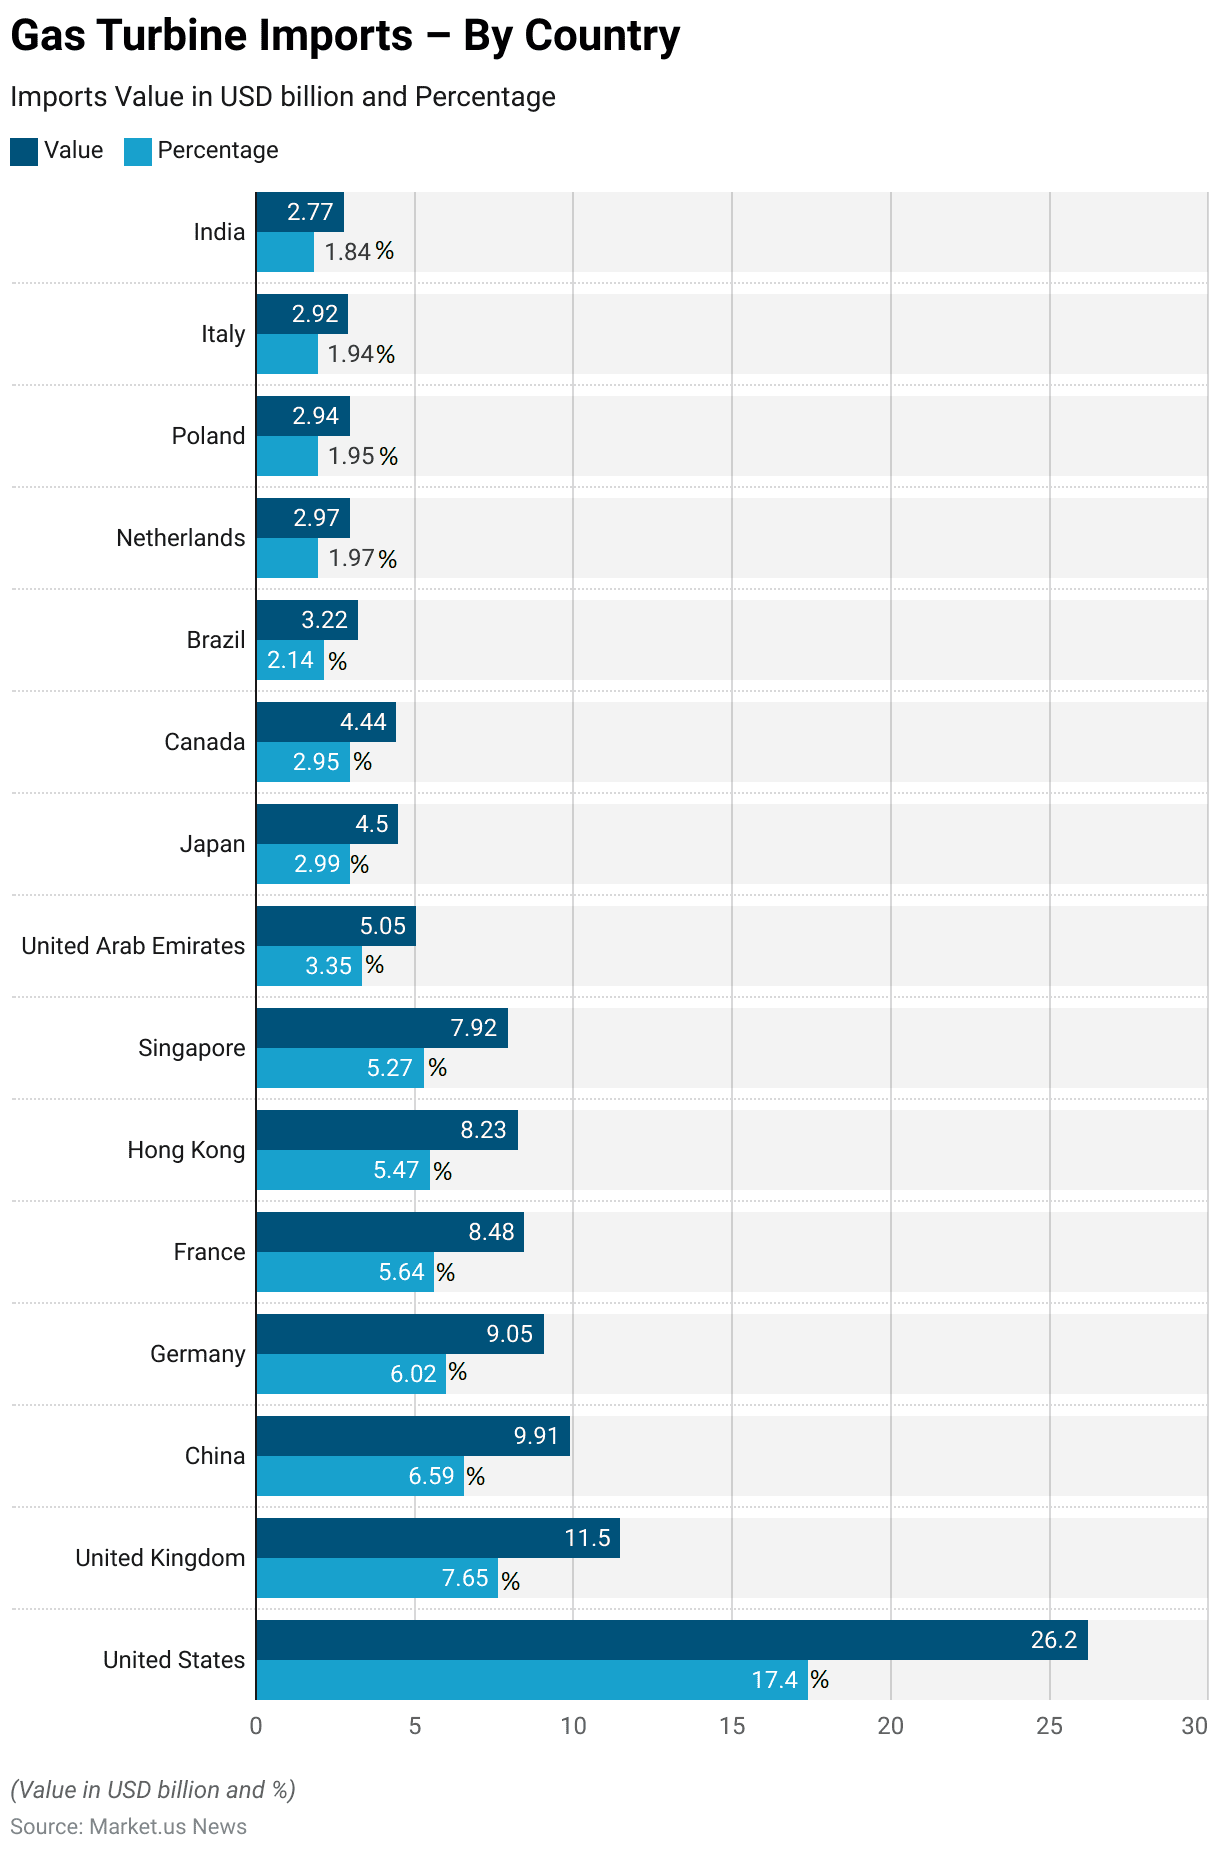
- In 2022, the global gas turbine import market was dominated by the United States, which accounted for the largest share with an import value of USD 26.2 billion, representing 17.40% of total imports.
- The United Kingdom ranked second, importing USD 11.5 billion worth of gas turbines, contributing 7.65% of the global total.
- China and Germany followed with imports valued at USD 9.91 billion (6.59%) and USD 9.05 billion (6.02%), respectively.
- France and Hong Kong also played significant roles, with imports worth USD 8.48 billion (5.64%) and USD 8.23 billion (5.47%).
- Singapore and the United Arab Emirates contributed with import values of USD 7.92 billion (5.27%) and USD 5.05 billion (3.35%), while Japan and Canada imported USD 4.5 billion (2.99%) and USD 4.44 billion (2.95%), respectively.
- Brazil accounted for USD 3.22 billion (2.14%), followed by the Netherlands (USD 2.97 billion, 1.97%), Poland (USD 2.94 billion, 1.95%), Italy (USD 2.92 billion, 1.94%), and India (USD 2.77 billion, 1.84%).
- This distribution highlights the prominence of major economies in driving global demand for gas turbines, reflecting their industrial and power generation needs.
(Source: OEC World)
Essential Cost Metrics Related to Gas Turbine Statistics
Monthly Natural Gas Price Index Worldwide
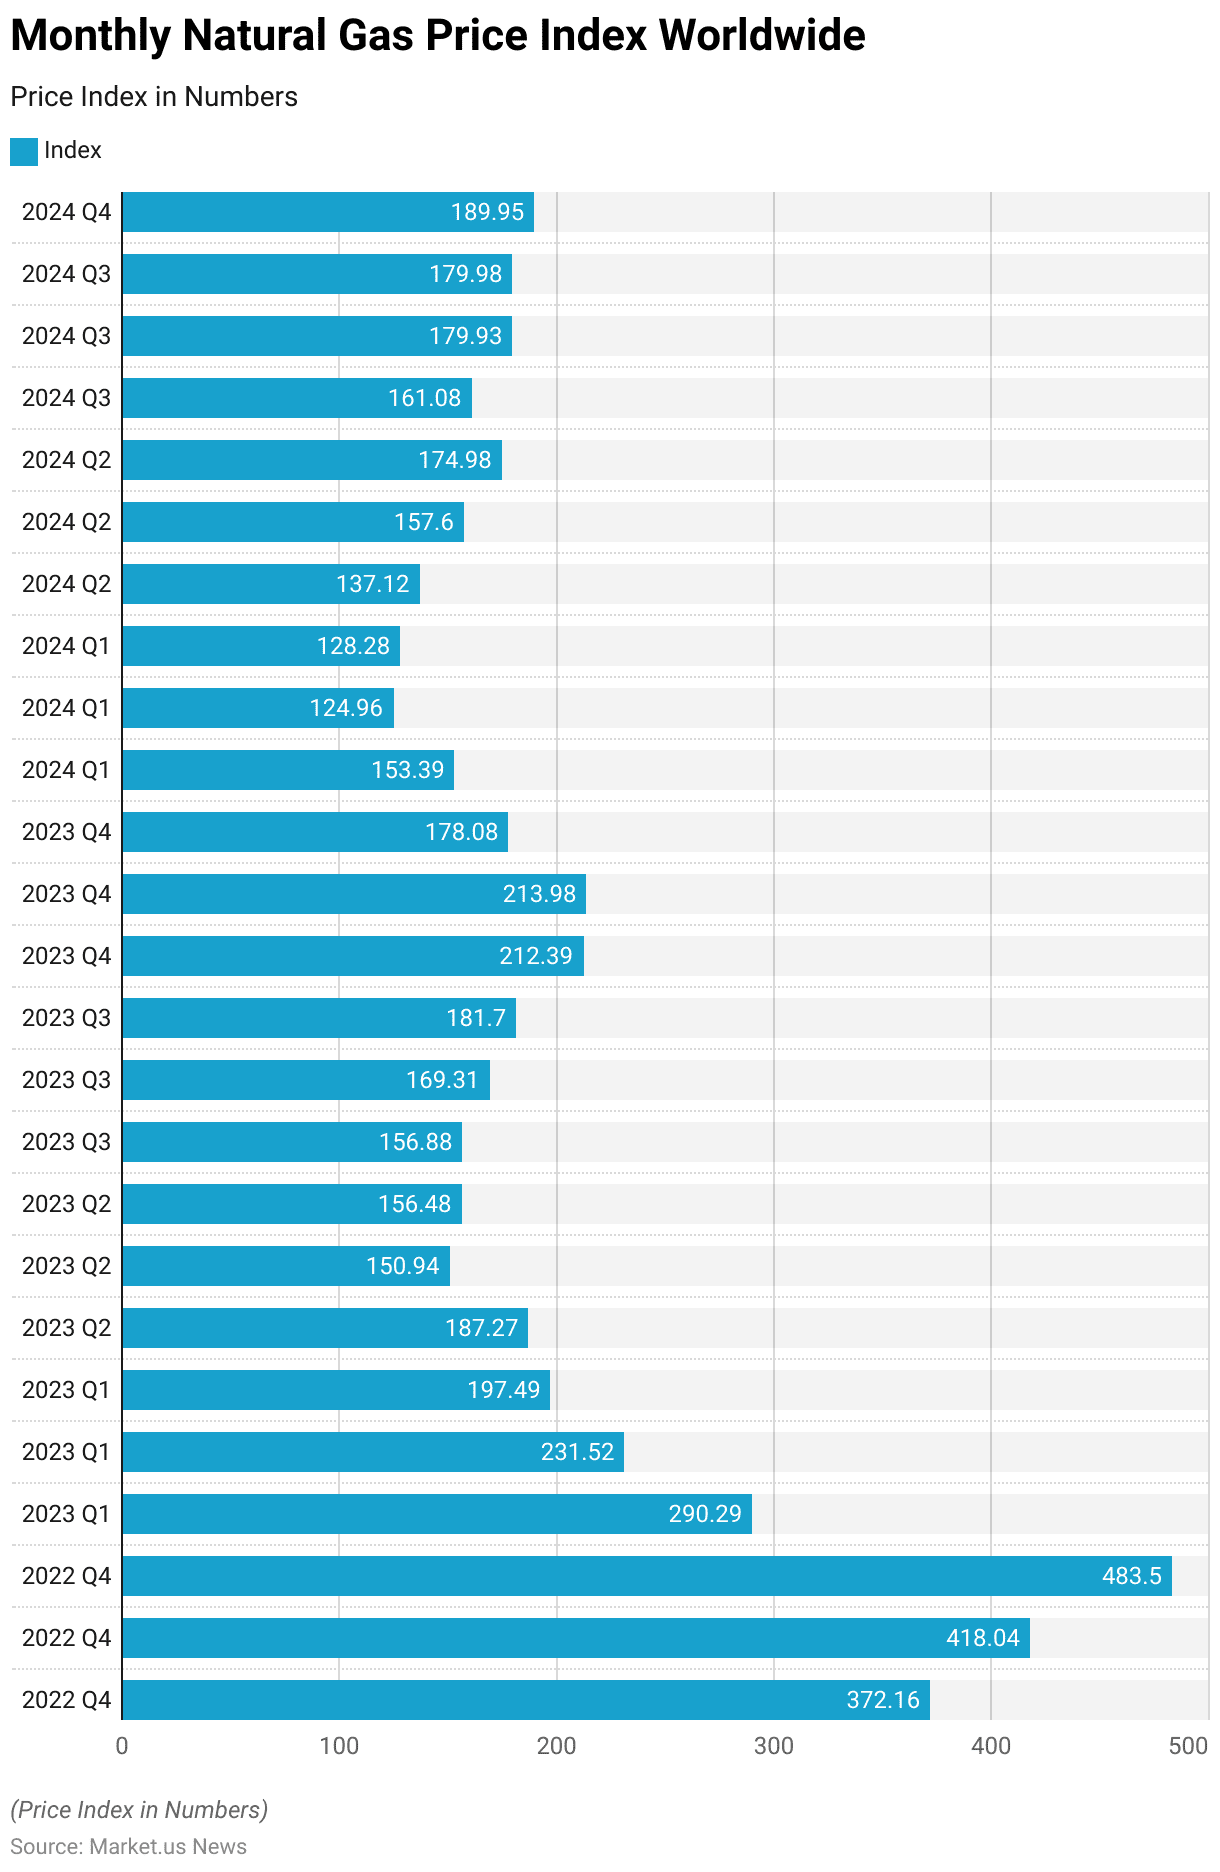
- From October 2022 to October 2024, the global natural gas price index experienced significant fluctuations.
- Starting at 372.16 in October 2022, the index rose sharply to 418.04 in November 2022 and peaked at 483.5 in December 2022, reflecting heightened demand during the winter months.
- However, the index dropped significantly in early 2023, declining to 290.29 in January, 231.52 in February, and 197.49 in March.
- This downward trend continued into the spring, with the index reaching 187.27 in April and bottoming out at 150.94 in May 2023.
- In the summer of 2023, the index stabilized, with values of 156.48 in June, 156.88 in July, and a slight increase to 169.31 in August.
- By September and October 2023, the index rose further to 181.7 and 212.39, respectively. In November and December 2023, it fell again to 213.98 and 178.08.
- In 2024, the index continued its downward trend in the early months, recording 153.39 in January, 124.96 in February, and 128.28 in March.
- A gradual recovery began in April with an index of 137.12, reaching 157.6 in May, 174.98 in June, and 161.08 in July.
- By August and September 2024, the index rose slightly to 179.93 and 179.98, with a further increase to 189.95 in October 2024.
- These variations reflect dynamic market conditions influenced by seasonal demand, geopolitical factors, and shifts in energy supply and consumption patterns.
(Source: Statista)
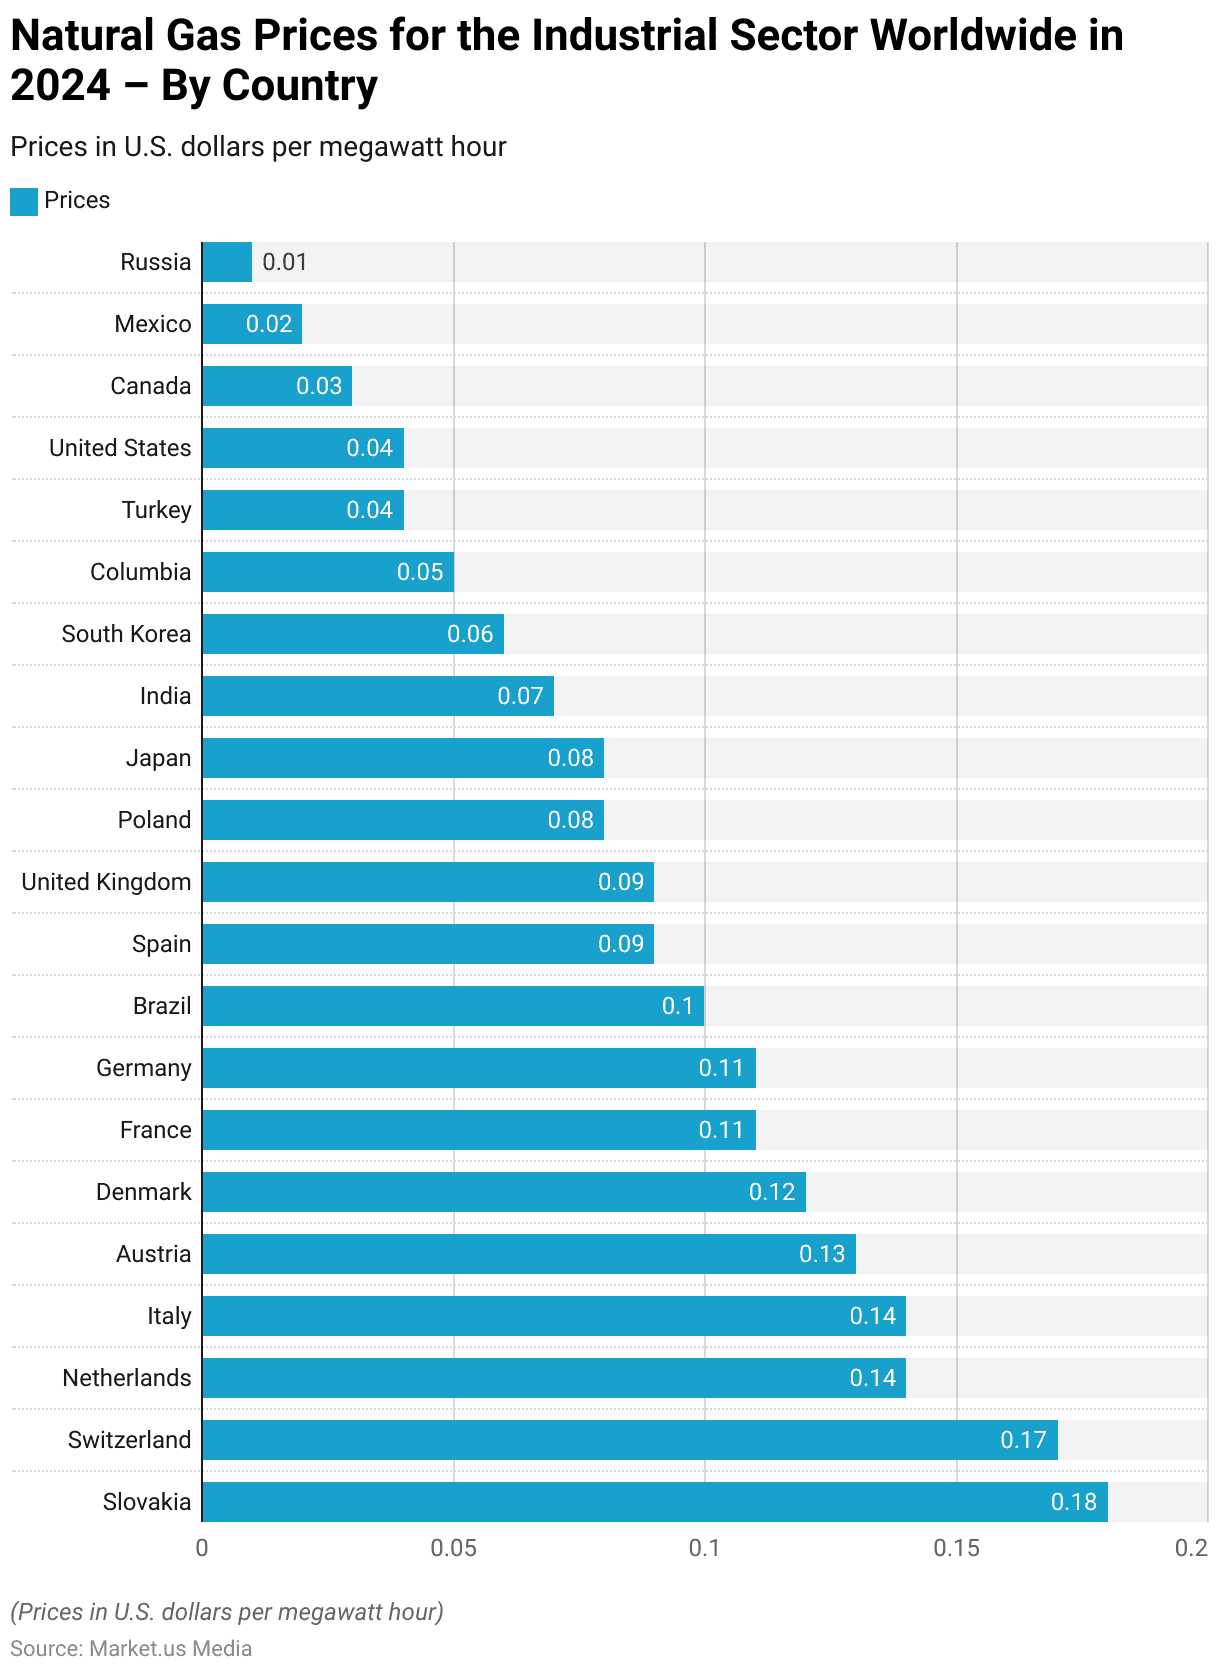
Natural Gas Prices for the Industrial Sector Worldwide – By Country
- As of 2024, natural gas prices for the industrial sector varied significantly across different countries.
- Slovakia reported the highest price at USD 0.18 per megawatt hour, followed by Switzerland at USD 0.17.
- The Netherlands and Italy each recorded prices of USD 0.14, while Austria stood at USD 0.13.
- Denmark’s industrial sector paid USD 0.12, with France and Germany both registering prices of USD 0.11.
- Brazil reported a slightly lower price of USD 0.10.
- Spain and the United Kingdom both recorded prices of USD 0.09, while Poland and Japan were slightly lower at USD 0.08.
- India followed with USD 0.07, and South Korea reported USD 0.06.
- Colombia saw prices of USD 0.05, and Turkey and the United States both recorded prices of USD 0.04.
- Canada reported USD 0.03, while Mexico and Russia had the lowest prices, at USD 0.02 and USD 0.01, respectively.
- This wide range highlights significant regional differences in natural gas pricing, influenced by factors such as availability, infrastructure, and energy policies.
(Source: Statista)
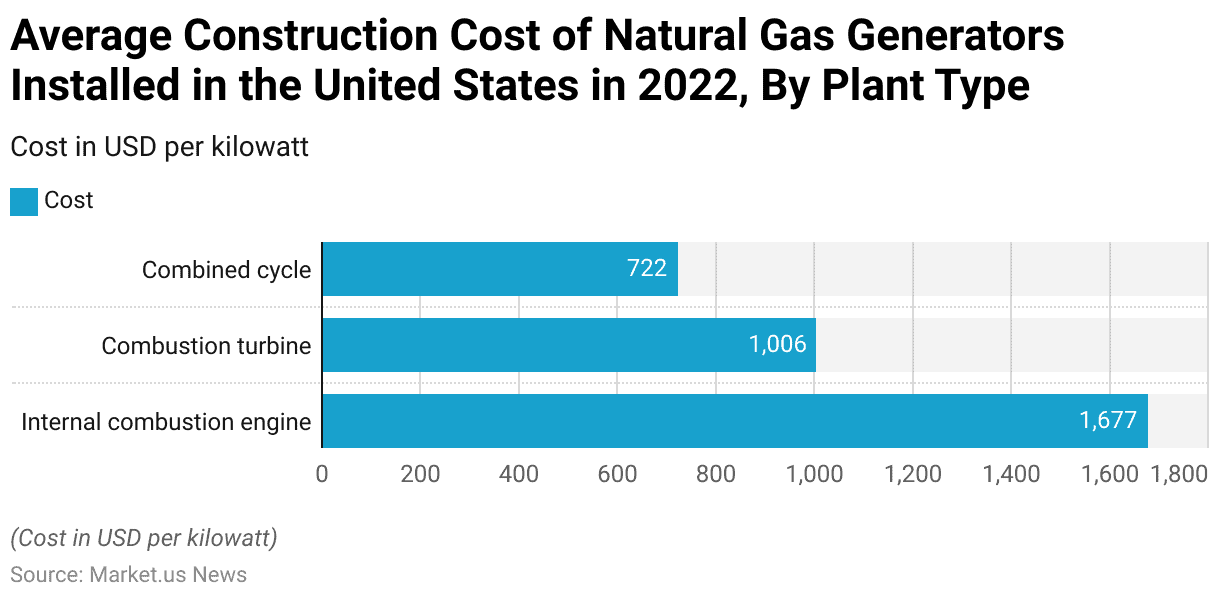
Construction Cost of Natural Gas Generators
- In 2022, the average construction costs for natural gas generators installed in the United States varied significantly by plant type.
- Internal combustion engine plants had the highest average construction cost at USD 1,677 per kilowatt, reflecting their specialized design and operational requirements.
- Combustion turbine plants followed, with an average construction cost of USD 1,006 per kilowatt, indicative of their widespread use and relatively lower complexity compared to internal combustion engines.
- Combined cycle plants, known for their high efficiency and integration of gas and steam turbines, had the lowest average construction cost at USD 722 per kilowatt.
- This cost distribution highlights the economic advantages of combined cycle plants, particularly in large-scale power generation projects.
(Source: Statista)
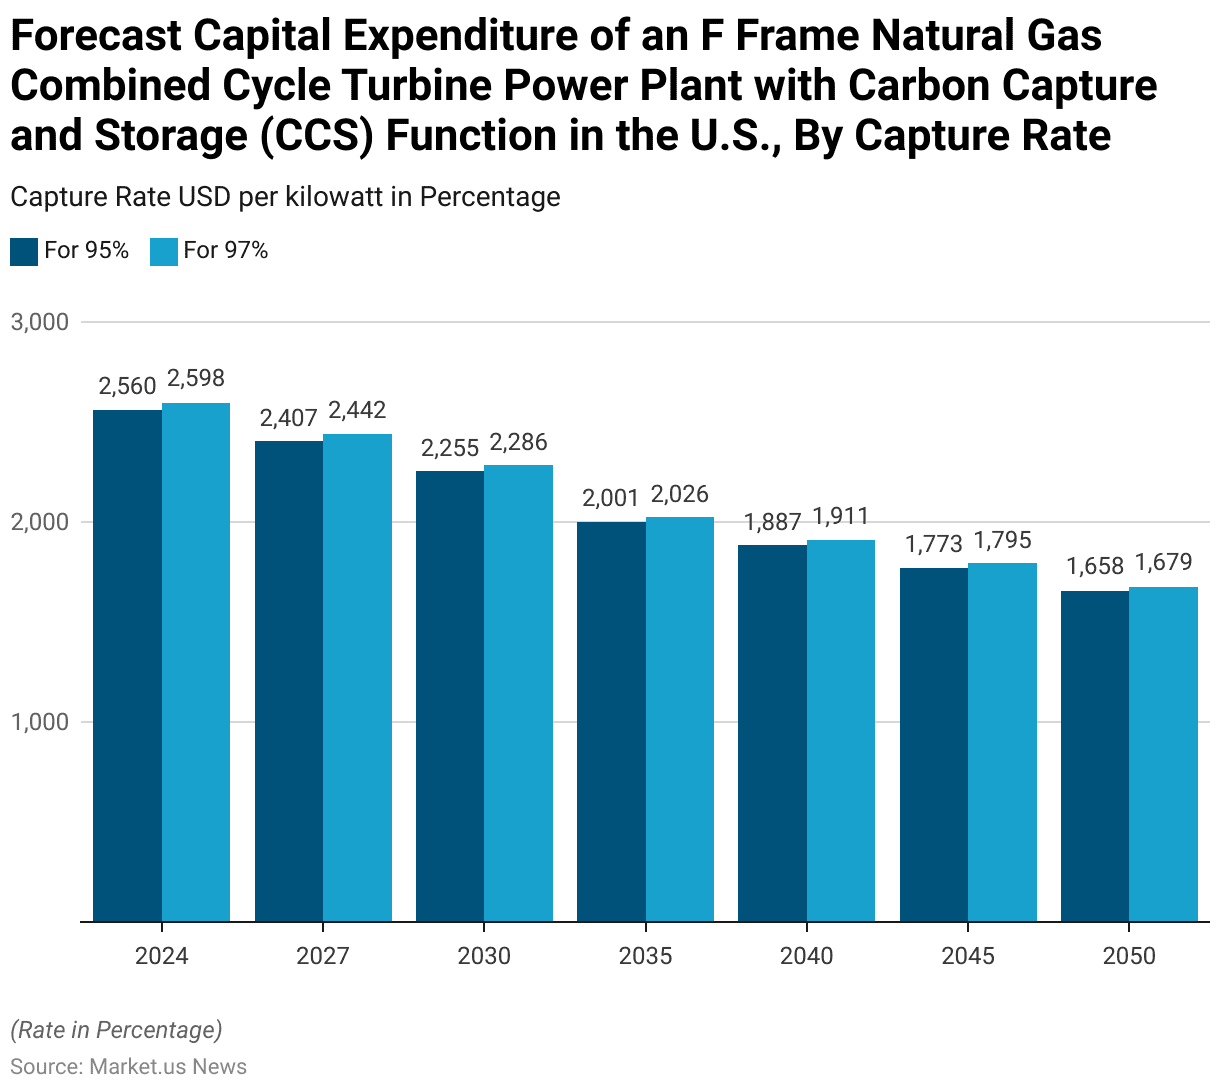
Capital Expenditure of an F Frame Natural Gas Combined Cycle Turbine Power Plant with Carbon Capture and Storage (CCS) Function
- The forecasted capital expenditure (CAPEX) for an F-frame natural gas combined cycle turbine power plant equipped with carbon capture and storage (CCS) functionality in the United States is projected to decrease steadily between 2024 and 2050.
- For a 95% carbon capture rate, the CAPEX in 2024 is estimated at USD 2,560 per kilowatt, compared to USD 2,598 per kilowatt for a 97% capture rate.
- By 2027, the costs are forecasted to decline to USD 2,407 and USD 2,442 per kilowatt for 95% and 97% capture rates, respectively.
- This downward trend continues into 2030, with CAPEX projected at USD 2,255 per kilowatt for 95% capture and USD 2,286 per kilowatt for 97% capture.
- In 2035, costs are expected to fall further to USD 2,001 and USD 2,026 per kilowatt, respectively.
- By 2040, CAPEX for 95% capture is forecasted at USD 1,887 per kilowatt, while 97% capture is estimated at USD 1,911 per kilowatt.
- Further reductions are anticipated by 2045, with CAPEX at USD 1,773 per kilowatt for 95% capture and USD 1,795 per kilowatt for 97% capture.
- By 2050, the CAPEX is expected to decline to USD 1,658 and USD 1,679 per kilowatt for 95% and 97% capture rates, respectively.
- These declining costs reflect advancements in CCS technology and increased efficiency in integrating carbon capture systems into natural gas power plants over the coming decades.
(Source: Statista)
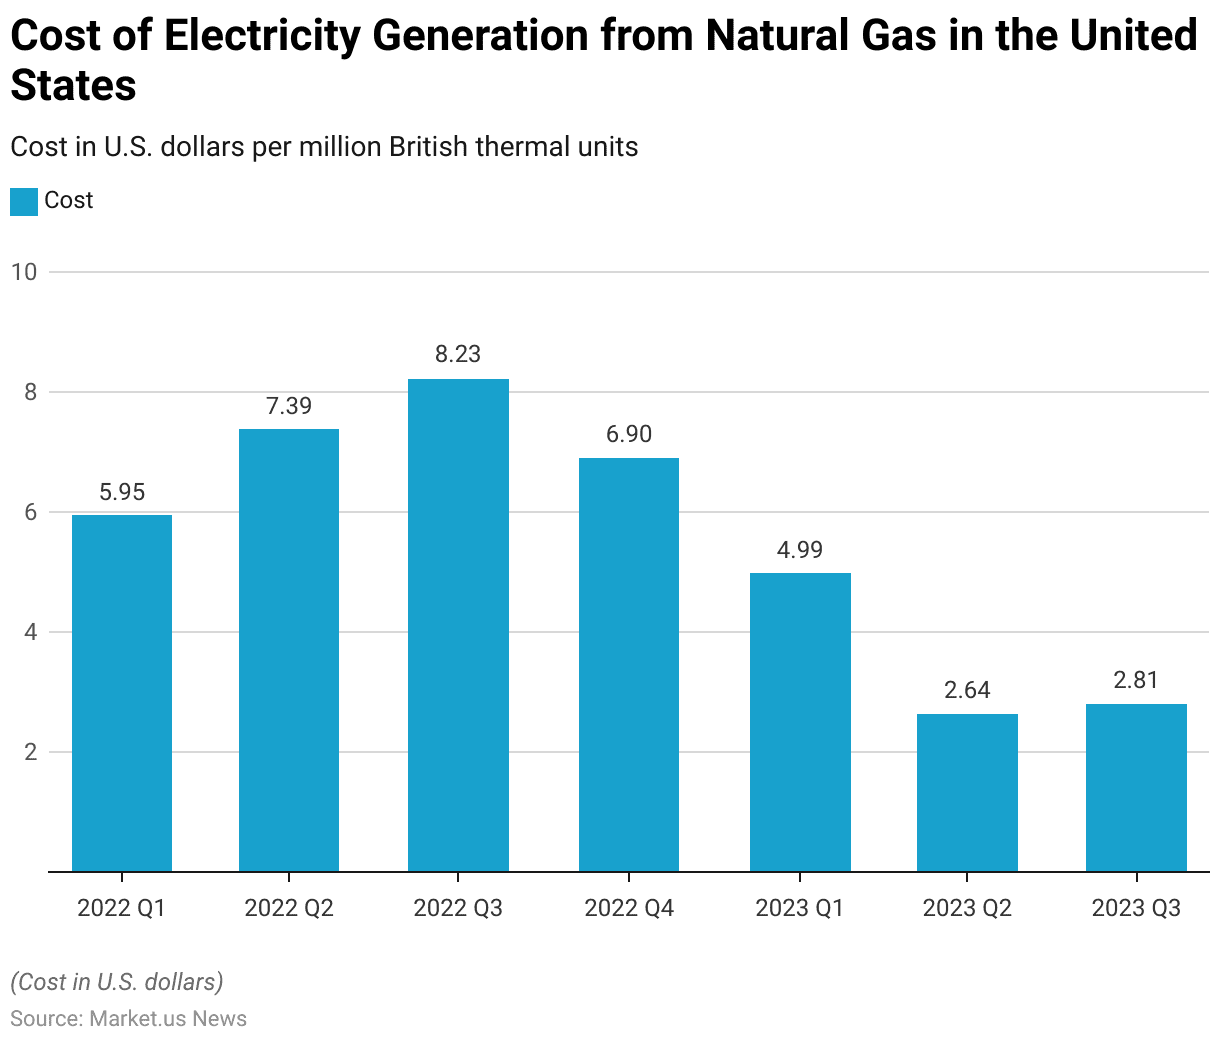
Cost of Electricity Generation from Natural Gas
- The cost of electricity generation from natural gas in the United States experienced notable fluctuations between the first quarter of 2022 and the third quarter of 2023.
- In Q1 2022, the cost was recorded at USD 5.95 per million British thermal units (MMBtu), which increased significantly to USD 7.39 per MMBtu in Q2 2022.
- This upward trend continued, peaking at USD 8.23 per MMBtu in Q3 2022, reflecting heightened natural gas prices during that period.
- However, by Q4 2022, the cost decreased to USD 6.90 per MMBtu.
- The trend shifted more sharply in 2023, with the cost falling to USD 4.99 per MMBtu in Q1 2023.
- It further declined to USD 2.64 per MMBtu in Q2 2023, marking the lowest point during this timeframe.
- By Q3 2023, the cost saw a slight increase to USD 2.81 per MMBtu.
- These fluctuations highlight the volatility in natural gas prices, influenced by market dynamics, seasonal demand, and broader economic factors impacting the energy sector.
(Source: Statista)
Key Challenges and Concerns Faced by the Industry
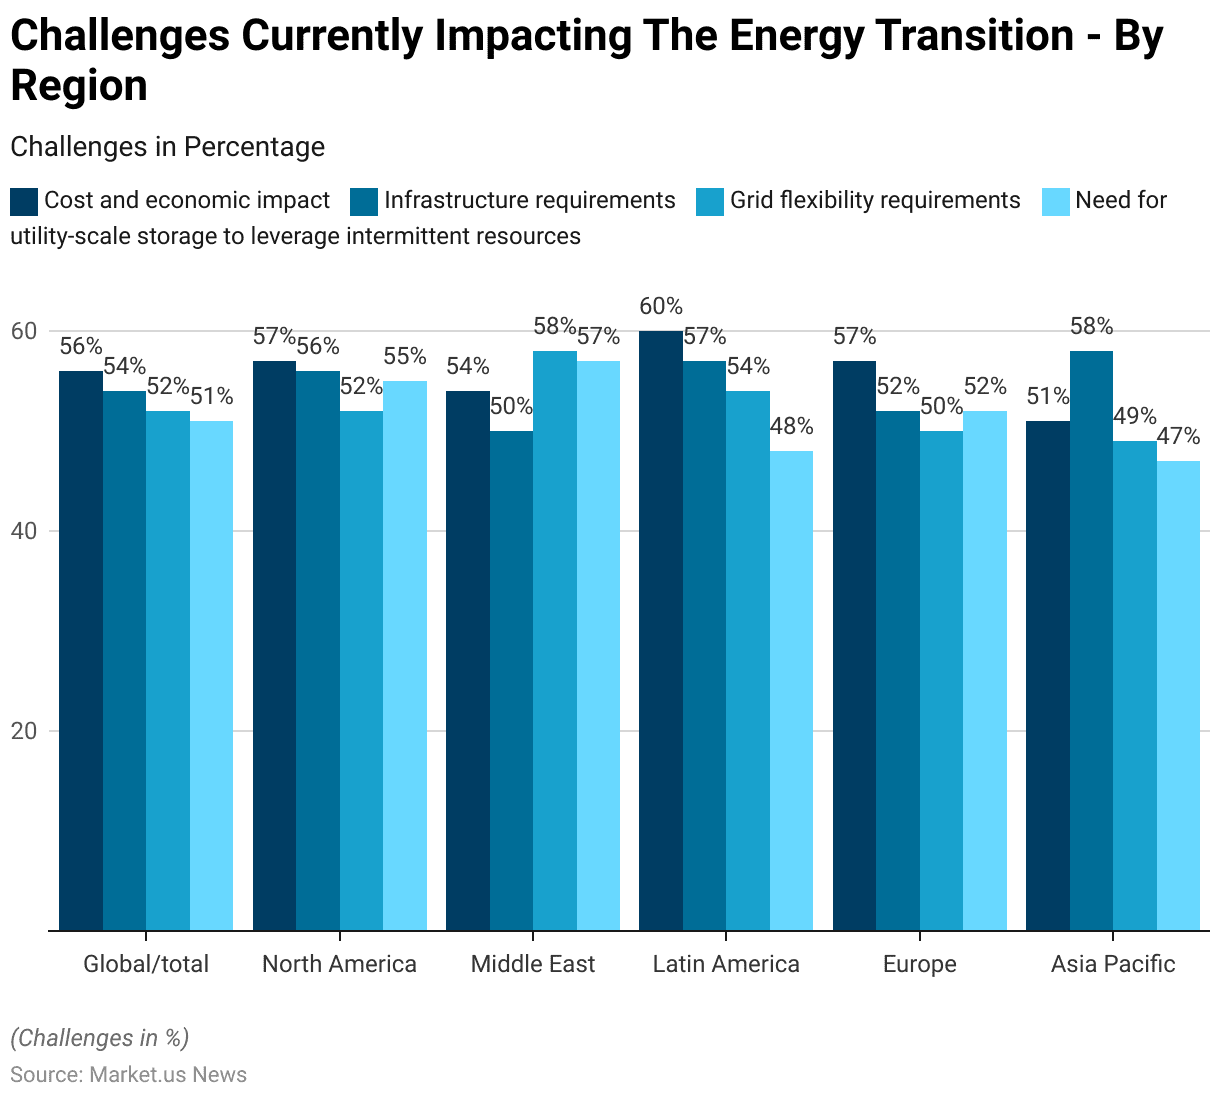
Challenges Currently Impacting the Energy Transition – By Region
- The energy transition in 2023 faces a variety of challenges across regions, with significant variations in priority concerns.
- Globally, 56% of respondents identified cost and economic impact as the greatest challenge, followed by infrastructure requirements (54%), grid flexibility requirements (52%), and the need for utility-scale storage to manage intermittent resources (51%).
- In North America, cost and economic impact and infrastructure requirements are the most pressing concerns, at 57% and 56%, respectively, with grid flexibility (52%) and utility-scale storage (55%) also seen as critical issues.
- In the Middle East, grid flexibility requirements are the top challenge at 58%, followed closely by the need for utility-scale storage (57%), cost and economic impact (54%), and infrastructure requirements (50%).
- Latin America has the highest concern for cost and economic impact (60%) and infrastructure requirements (57%), with grid flexibility (54%) and utility-scale storage (48%) viewed as relatively lower priorities.
- In Europe, cost and economic impact (57%) and infrastructure requirements (52%) lead the concerns, followed by utility-scale storage (52%) and grid flexibility (50%).
- In the Asia Pacific region, infrastructure requirements are the dominant concern at 58%, followed by cost and economic impact (51%), grid flexibility (49%), and utility-scale storage (47%).
- These regional differences highlight the varied challenges and priorities that must be addressed to accelerate the global energy transition effectively.
(Source: Statista)
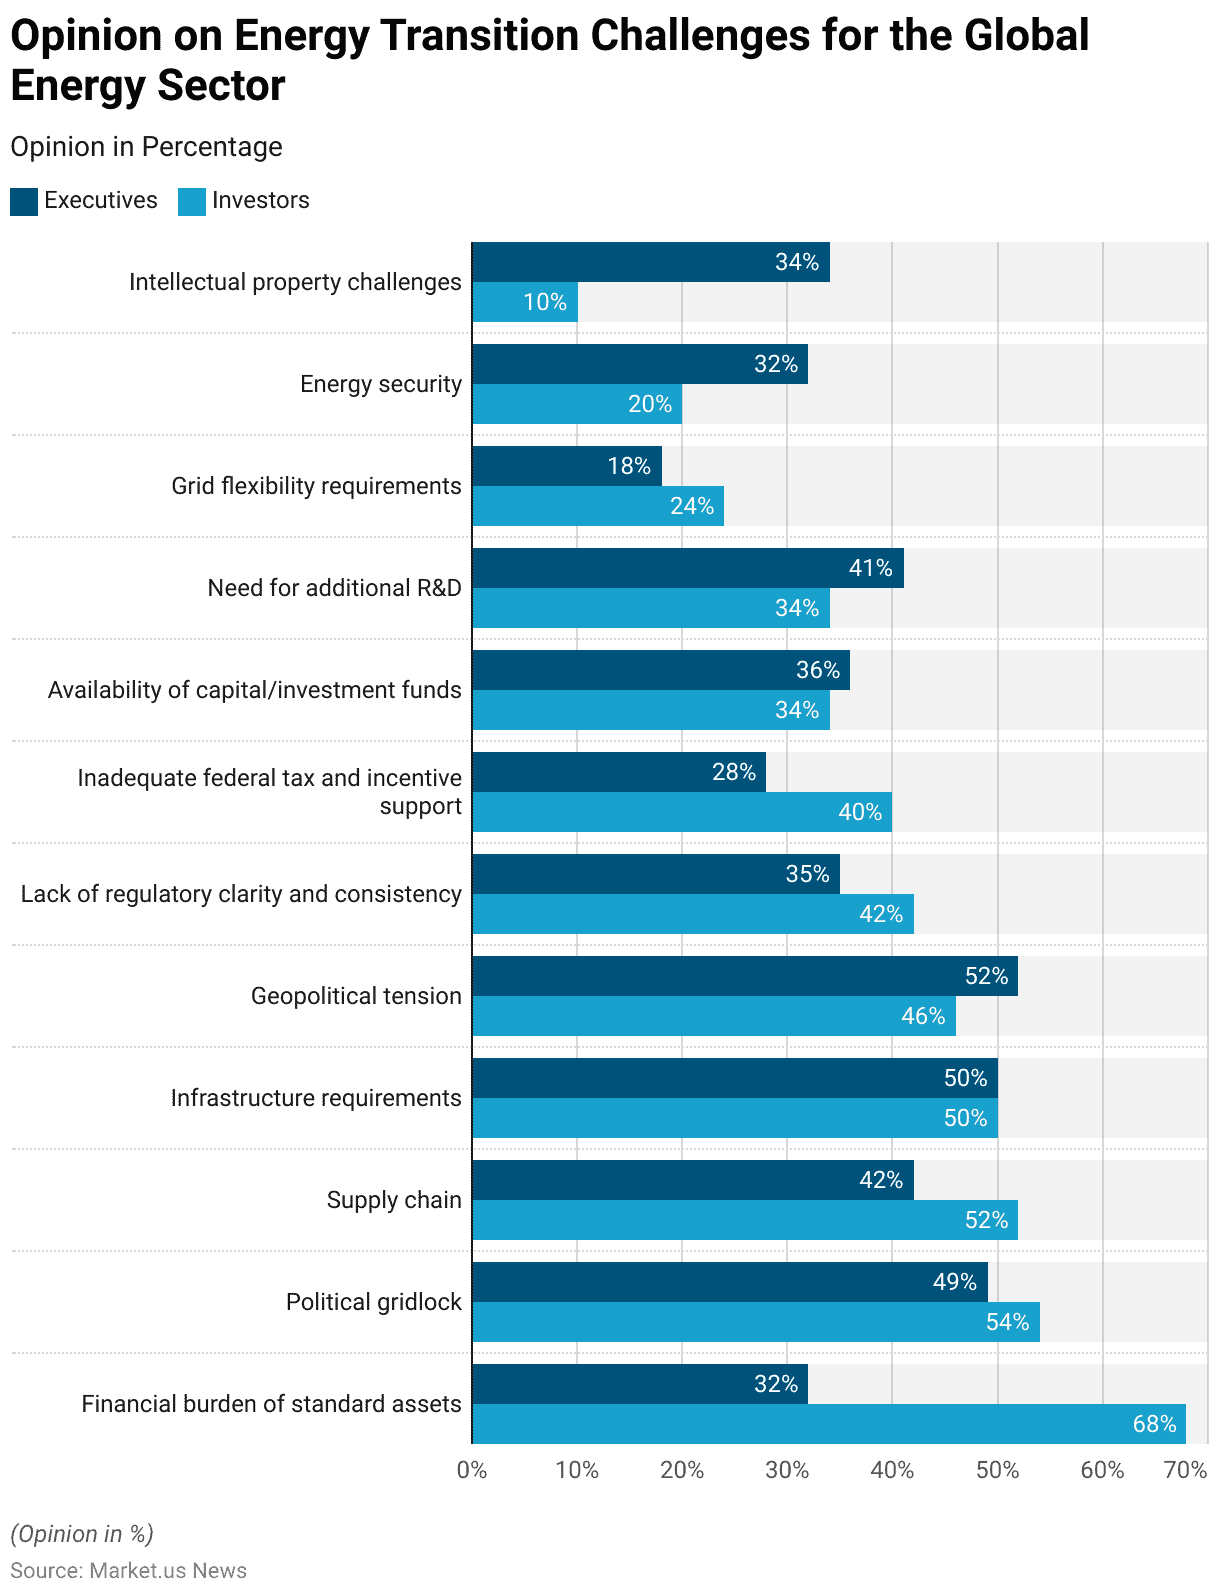
Opinion on Energy Transition Challenges for the Global Energy Sector
- In 2022, the greatest challenges impacting the global energy transition varied between executives and investors, reflecting their differing priorities and perspectives.
- Among investors, the financial burden of stranded assets was the top concern, cited by 68%, compared to only 32% of executives.
- Political gridlock was a significant challenge for both groups, with 49% of executives and 54% of investors highlighting it as a key issue.
- Supply chain constraints were also more pressing for investors (52%) than executives (42%).
- Infrastructure requirements were equally critical for both groups, with 50% viewing it as a challenge.
- Geopolitical tensions were more concerning for executives (52%) than investors (46%), while a lack of regulatory clarity and consistency was identified by 35% of executives and 42% of investors.
- Inadequate federal tax and incentive support was a greater concern for investors (40%) compared to executives (28%).
- Challenges related to the availability of capital or investment funds were similarly perceived by both groups, with 36% of executives and 34% of investors citing it.
- The need for additional research and development was a more prominent issue for executives (41%) than investors (34%).
- Grid flexibility requirements were a relatively lower concern, mentioned by 18% of executives and 24% of investors.
- Energy security was more pressing for executives (32%) than investors (20%), while intellectual property challenges were a notable concern for executives (34%) but minimally impactful for investors (10%).
- These insights reveal the distinct but overlapping priorities between executives and investors in addressing energy transition challenges.
(Source: Statista)
Gas Turbine Emissions and Control Statistics
- Gas turbine exhaust emissions produced from burning conventional fuels comprise a mix of major and minor species with varying concentrations.
- The major species include nitrogen (N₂), constituting 66–72% of the exhaust volume, primarily sourced from inlet air, and oxygen (O₂), which accounts for 12–18%, also originating from inlet air.
- Carbon dioxide (CO₂) and water vapor (H₂O), each ranging between 1–5% by volume, are produced through the oxidation of the carbon and hydrogen in the fuel, respectively.
- The minor species in the emissions include several pollutants measured in parts per million by volume (PPMV).
- Nitric oxide (NO) ranges from 20 to 220 PPMV, formed by the oxidation of atmospheric nitrogen, while nitrogen dioxide (NO₂), produced from fuel-bound organic nitrogen, typically falls between 2 and 20 PPMV.
- Carbon monoxide (CO), a product of incomplete fuel oxidation, ranges from 5 to 330 PPMV.
- Sulfur dioxide (SO₂), present in trace amounts up to 100 PPMV, and Sulfur trioxide (SO₃), ranging from trace levels to 4 PPMV, is generated from the oxidation of fuel-bound organic sulfur.
- Unburned hydrocarbons (UHC), resulting from incomplete oxidation of fuel or intermediates, are found in concentrations between 5 and 300 PPMV.
- Particulate matter, including trace amounts up to 25 PPMV, originates from various sources such as inlet ingestion, fuel ash, hot-gas-path attrition, and incomplete fuel oxidation.
- This composition highlights the complexity of emissions control in gas turbine operations.
(Source: GE Energy)
Innovations and Developments in Gas Turbine Statistics
- Recent innovations in gas turbine technology primarily focus on enhancing efficiency and reducing environmental impact, aligning with broader sustainability and decarbonization goals.
- Companies like Siemens Energy and Hanwha are pioneering in integrating hydrogen into gas turbine operations. Siemens Energy, for instance, is advancing with technology that supports hydrogen co-firing, capable of accommodating between 15% and 75% hydrogen by volume in its turbines, with ambitions to achieve 100% hydrogen operation by 2030.
- This progression includes collaboration with Constellation, achieving a 38% hydrogen blend in operation, demonstrating significant reductions in carbon emissions while maintaining NOx emissions within regulatory limits.
- Additionally, Hanwha’s developments underscore a commitment to retrofitting existing turbines for hydrogen use. For example, their project with Uniper in Rotterdam aims to convert a 123-megawatt turbine to use a hydrogen and natural gas mix, promoting a substantial reduction in CO2 and NOx emissions.
- This reflects a broader strategy to deploy hydrogen gas turbine technology globally, enhancing green energy resilience and contributing to a net-zero emissions future.
- Overall, the gas turbine sector is increasingly focusing on hybrid systems that integrate renewable energy sources and leverage digital tools to optimize performance and reliability.
- The sector is not only adapting to use a broader spectrum of fuels, including various hydrogen blends and synthetic gases but also enhancing system responsiveness to dynamic power demands, which is crucial for supporting intermittent renewable energy sources.
- This adaptation involves advanced combustion technologies, improved turbine materials, and novel design strategies aimed at minimizing the lifecycle environmental impact while maintaining or enhancing power generation efficiency.
(Source: Onclive, Hanwha Global, Power Magazine)
Regulations for Gas Turbines
- Regulations governing gas turbines are evolving globally, with significant developments, particularly in the United States, where the Environmental Protection Agency (EPA) has proposed stringent new standards to control greenhouse gas (GHG) emissions from both new and existing gas-fired combustion turbines.
- Under these regulations, newly constructed or reconstructed gas turbines are subject to phased standards of performance that become progressively stricter, incorporating technologies like carbon capture and storage (CCS) and low-GHG hydrogen co-firing.
- For example, new baseload units will be required to implement 90% CCS by 2035 or to ramp up hydrogen co-firing to 96% by 2038. Existing large turbines that are frequently used will follow similar stringent guidelines to reduce their carbon footprint significantly.
- These regulations aim to drastically reduce carbon emissions, which is expected to result in substantial public health benefits, including reductions in premature deaths, hospital visits, and asthma attacks by 2030.
- This regulatory approach is anticipated to facilitate a cleaner energy sector by leveraging proven technologies like CCS and innovative methods such as hydrogen co-firing. This ensures that the power sector can meet these standards without a significant impact on electricity prices, thereby supporting long-term planning and investment in sustainable energy technologies.
(Sources: Us Epa, Holland & Knight, Eia)
Recent Developments
Acquisitions and Mergers:
- GE Vernova’s Acquisition of GESAT Stake: In September 2024, GE Vernova acquired the remaining 55% ownership stake in General Electric Saudi Advanced Turbines (GESAT) from Dussur, becoming the sole owner of the joint venture.
- Established in 2017, GESAT has manufactured over 200 gas turbine modules for power generation plants across ten countries, including Saudi Arabia.
Product Launches:
- Russia’s GTD-110M Gas Turbine: In October 2024, Russia introduced its first domestically produced high-capacity gas turbine, the GTD-110M, at the Udarnaya power station.
- This turbine, designed and manufactured by Rostec and Power Machines, increases the plant’s capacity to 560 megawatts, supplying 10% of the electricity for the Krasnodar region.
Funding and Investments:
- Siemens Energy’s Financial Turnaround: In November 2024, Siemens Energy reported a net income of €1.3 billion for the fiscal year ending in September, a significant improvement from the previous year’s €4.6 billion loss.
- This turnaround was driven by increased orders for gas turbines, power transformers, and decarbonization technologies.
Conclusion
Gas Turbine Statistics – Gas turbines are essential for global power generation, offering high efficiency, operational flexibility, and lower emissions compared to other fossil fuel technologies.
Their adaptability to fuels like natural gas and hydrogen makes them vital for the energy transition. However, challenges such as managing emissions, integrating carbon capture and storage (CCS), and improving fuel flexibility remain.
With advancements in efficiency and emissions control, gas turbines will continue to play a crucial role in supporting renewable energy and achieving sustainability goals.
FAQs
A gas turbine is a mechanical device that converts the energy from burning fuel into mechanical power, which is then used for electricity generation, propulsion, or industrial processes.
Gas turbines primarily use natural gas but can also operate on liquid fuels like diesel, as well as alternative fuels such as hydrogen, biogas, and syngas.
Gas turbines offer high efficiency, fast start-up times, operational flexibility, low greenhouse gas emissions compared to coal, and the ability to complement renewable energy sources.
The key components include the compressor, combustion chamber, and turbine. The compressor compresses air, the combustion chamber burns fuel, and the turbine extracts energy to drive the generator.
Gas turbines are used in power generation, aircraft propulsion, marine propulsion, and industrial processes requiring mechanical power.


