Table of Contents
- Introduction
- Editor’s Choice
- Camping Market Overview
- Revenue Generation from Camping
- Camping Users and Penetration Rate
- Global Glamping Market Size Statistics
- Glamping Sites and Seasonality Statistics
- Demographics of Glamping Participants Statistics
- Glamping and Camping Statistics Across Different Nations Statistics
- Glamping Experience Trends and Statistics
- Key Spending and Expenditure Statistics
- Glamping Regulations
- Recent Developments
- Conclusion
- FAQs
Introduction
Glamping Statistics: Glamping, or glamorous camping, combines the outdoor experience of camping with luxury and amenities typically found in hotels, appealing to travelers seeking comfort in nature.
The market has grown significantly due to rising interest in outdoor experiences. The impact of the COVID-19 pandemic, and the diversification of accommodations like yurts and treehouses.
Target audiences include Millennials, families, and eco-conscious consumers. While the sector faces challenges such as regulatory issues, seasonality, and sustainability concerns. It is expected to continue its upward trajectory.
Innovations in accommodation design and a focus on unique experiences will further drive growth in this segment of the travel industry.
Editor’s Choice
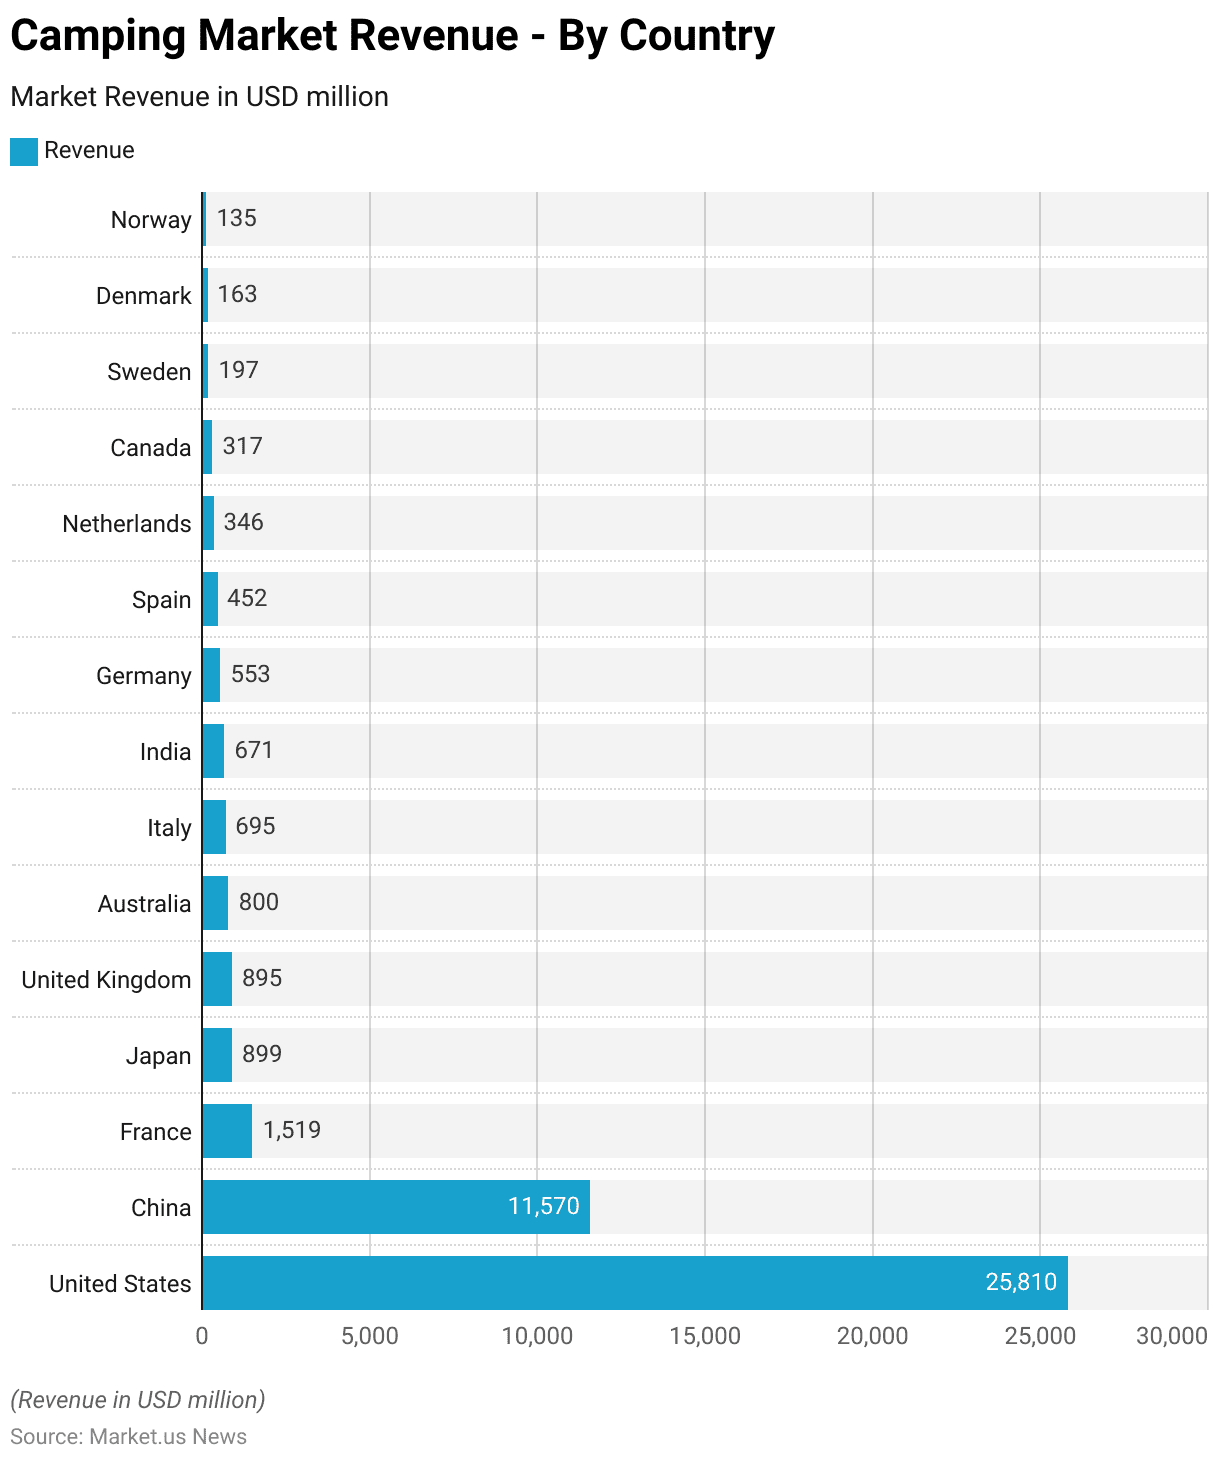
- The camping market revenue by country reveals significant variances across different regions. The United States leads by a substantial margin, generating USD 25,810 million.
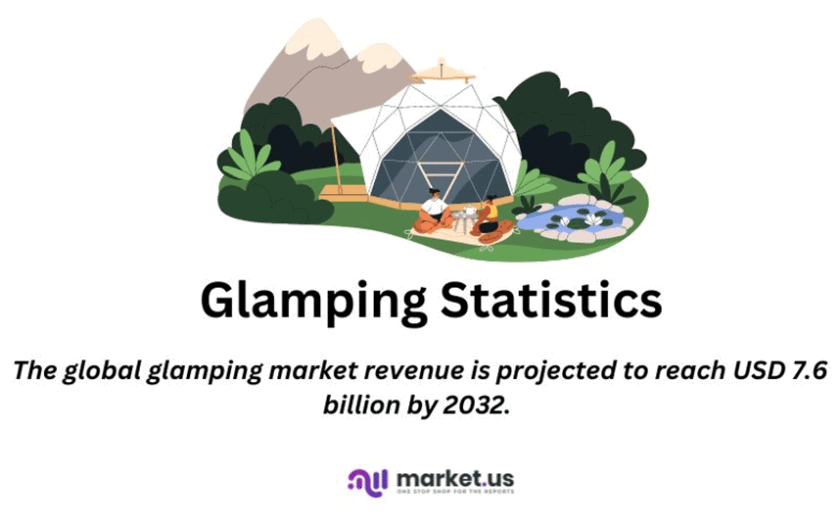
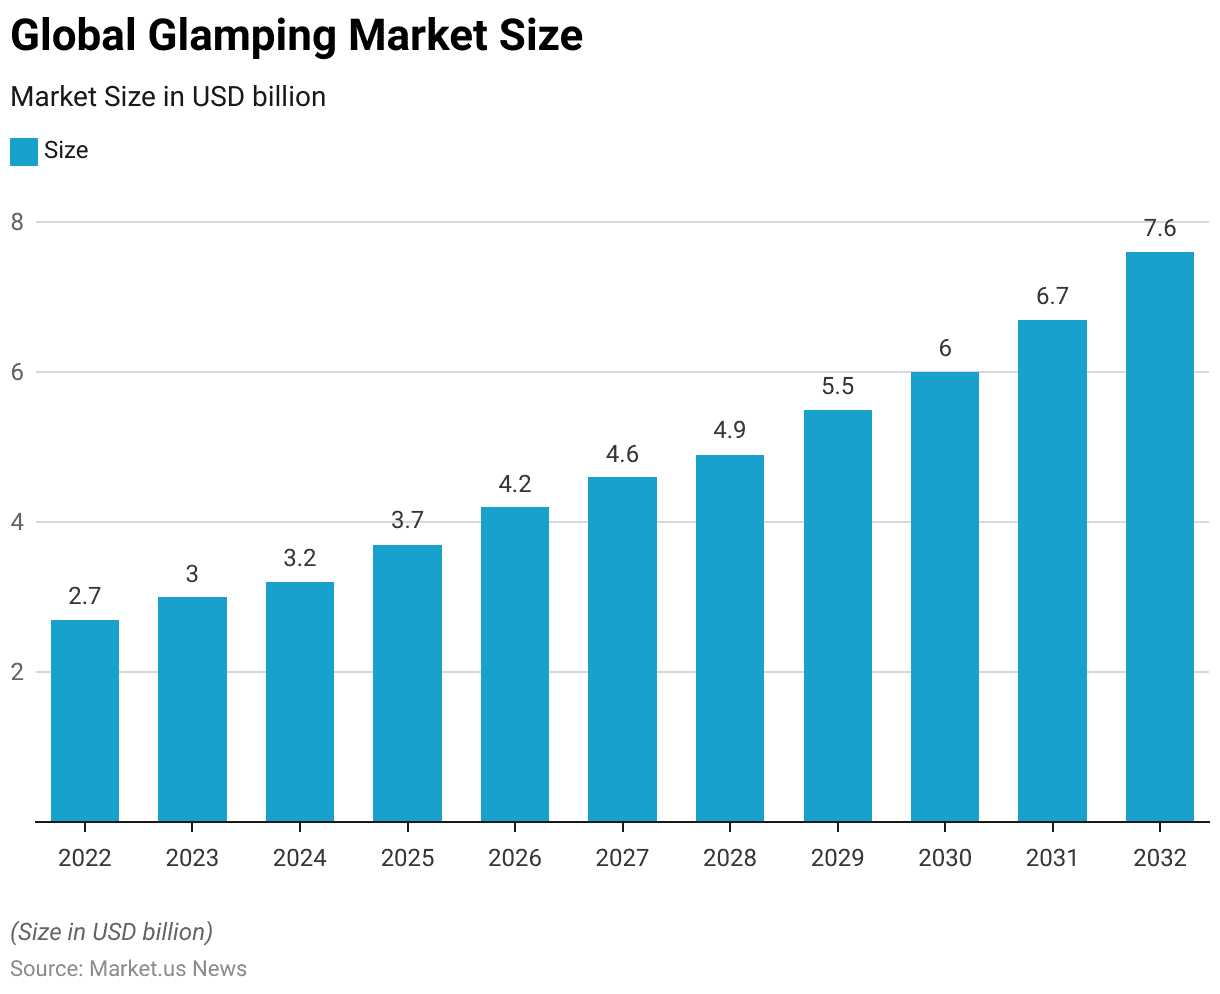
- The global glamping market revenue is projected to reach USD 7.6 billion by 2032.
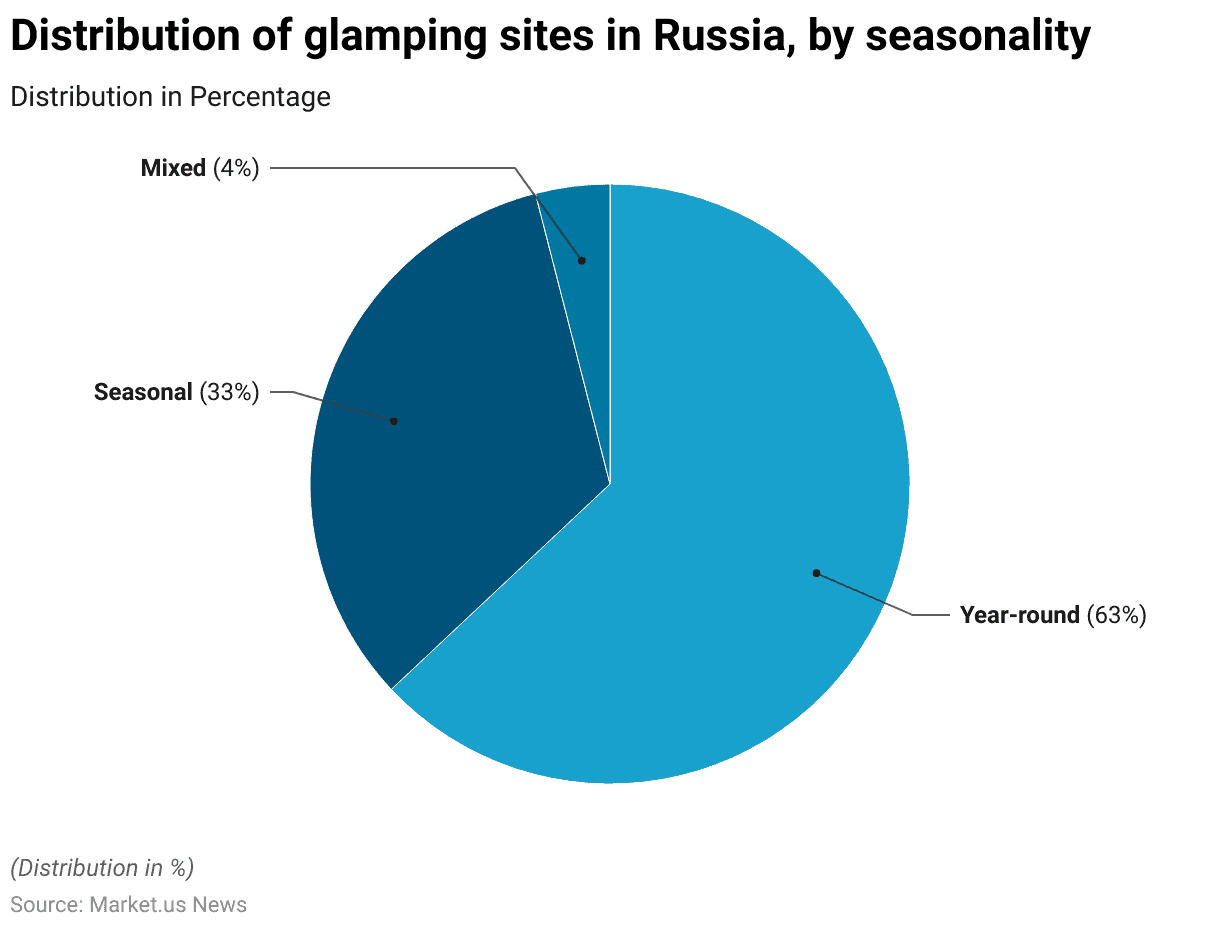
- As of June 2023, the distribution of glamping sites in Russia by seasonality shows a predominant preference for year-round operations. Approximately 63% of all glamping sites are operational throughout the year, catering to guests regardless of the season.
- In 2023, the global
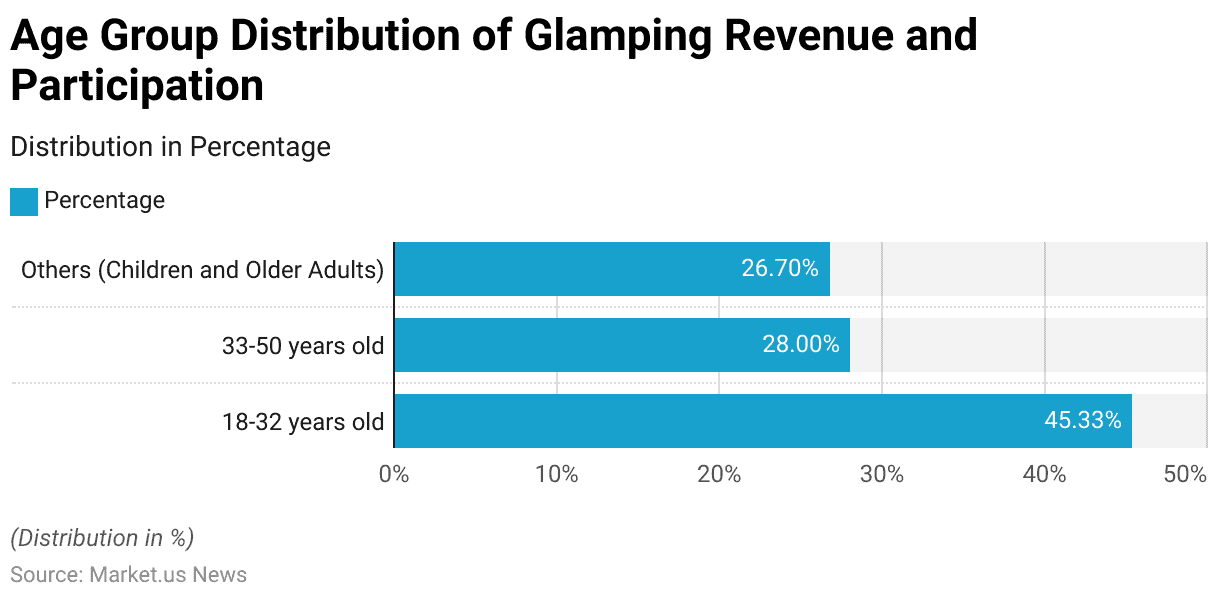
- demonstrated notable age-related segmentation in revenue generation. Individuals aged 18 to 32 years old led the market, contributing 45.33% of the revenue.
- In April 2023, participation in glamping across various regions of Japan showed varied levels of engagement. The Kinki region led with the highest share of participants at 11.20%.
- As of April 2023, the popularity and interest in glamping among individuals in Japan varied significantly. A survey indicated that 59.70% of respondents had not experienced glamping but expressed a desire to try it.
- In the UK, recent amendments to the Permitted Development Rights (PDR) allow landowners to operate temporary glamping sites for up to 60 days without full planning permission. A change aimed at boosting short-term, low-impact tourism during peak seasons.
Camping Market Overview
Global Camping Market Revenue By Glamping Statistics
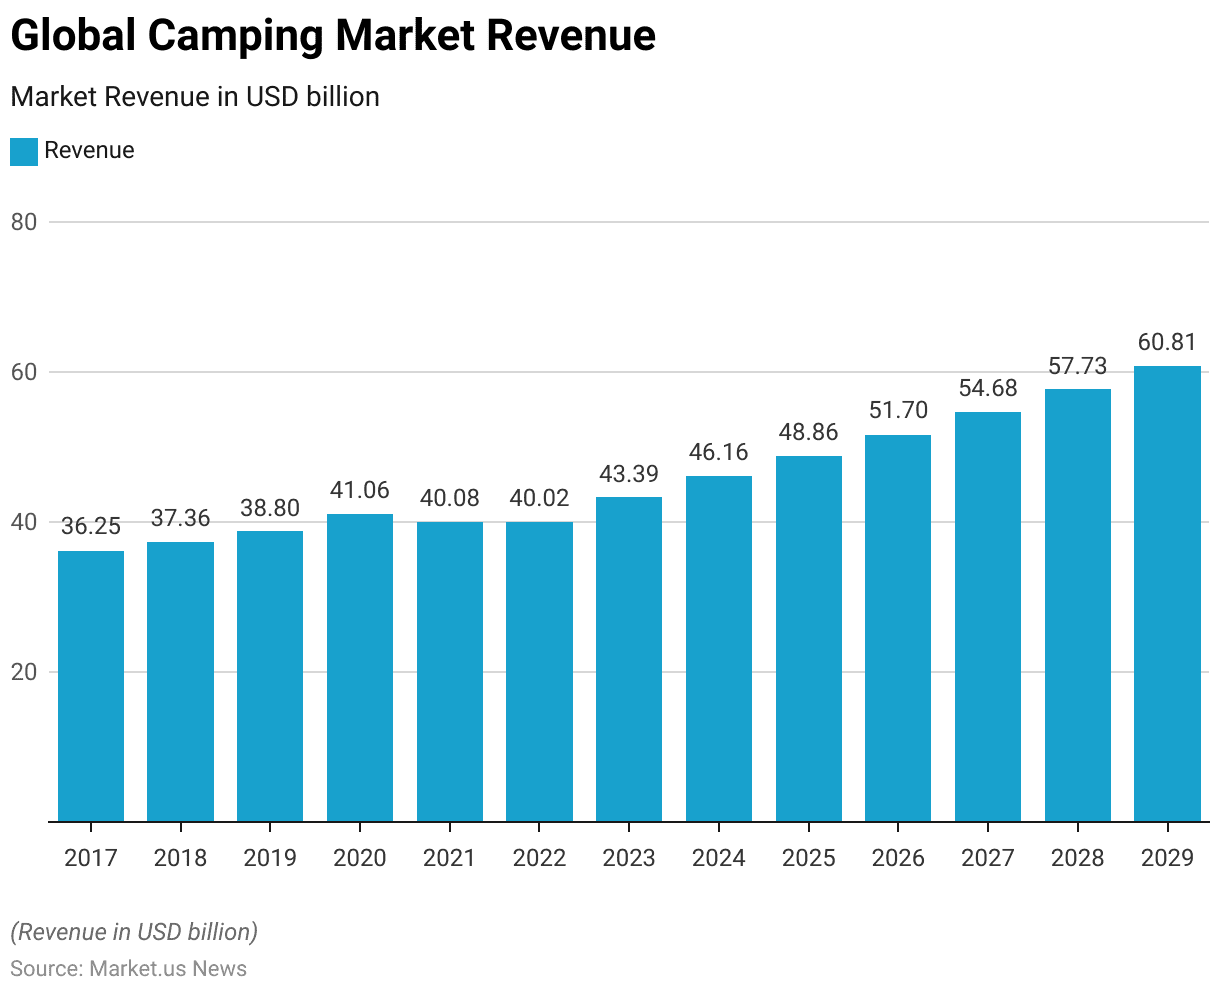
- The global camping market has exhibited a steady growth trend from 2017 to 2029 at a CAGR of 5.67%.
- Starting at a revenue of USD 36.25 billion in 2017, the market experienced gradual increases, reaching USD 37.36 billion in 2018 and USD 38.80 billion in 2019.
- Despite a slight surge to USD 41.06 billion in 2020, the market saw a modest retraction to USD 40.08 billion in 2021, maintaining a nearly flat trajectory at USD 40.02 billion in 2022.
- The recovery commenced in 2023, with revenue climbing to USD 43.39 billion. Followed by a consistent rise to USD 46.16 billion in 2024.
- Further, the upward trend continued, with the market expected to expand to USD 48.86 billion in 2025, USD 51.70 billion in 2026, USD 54.68 billion in 2027, USD 57.73 billion in 2028, and projected to reach USD 60.81 billion by 2029.
- This trajectory reflects a sustained interest and investment in camping as a recreational activity, demonstrating the sector’s resilience and growing consumer engagement over the years.
(Source: Statista)
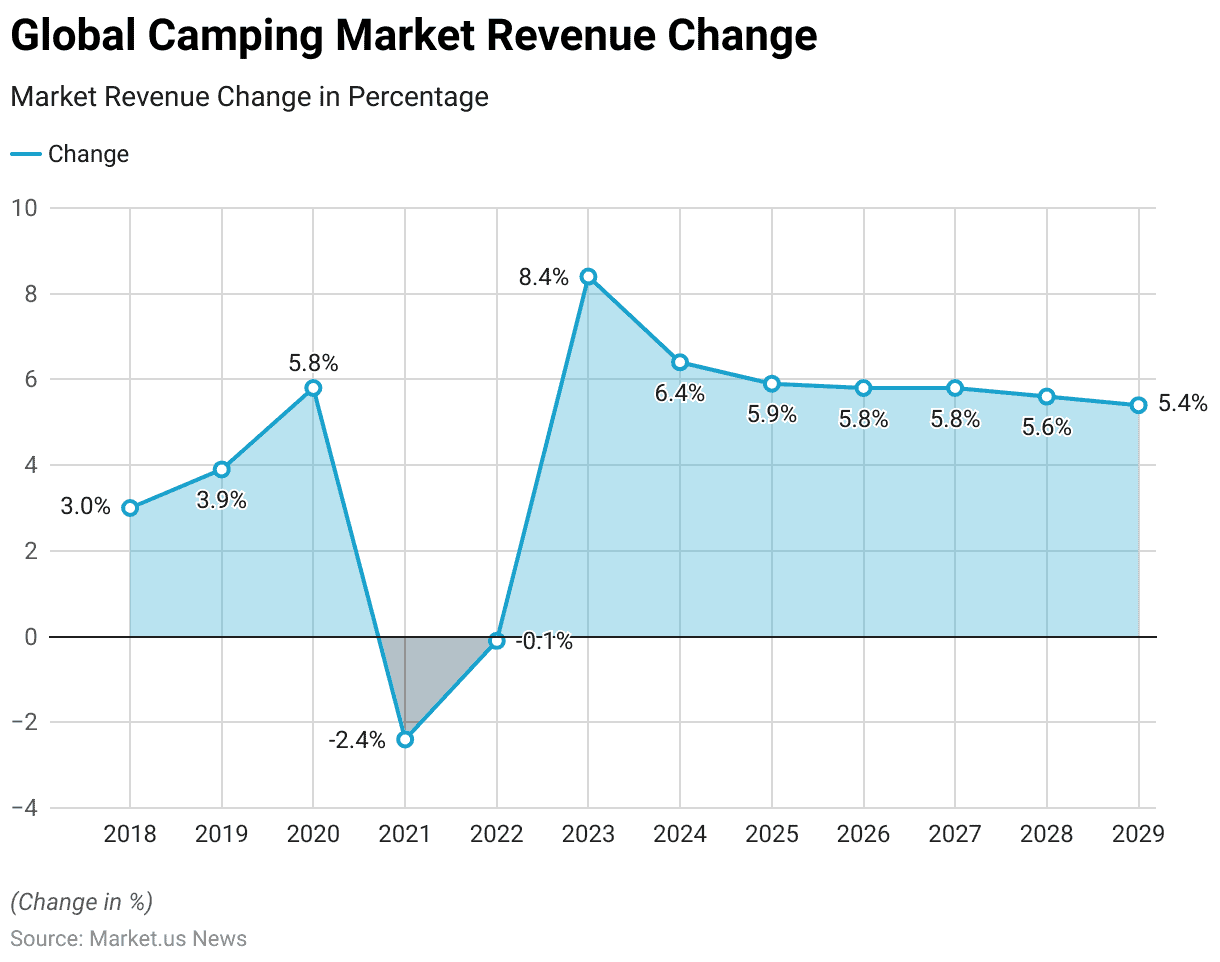
Camping Market Revenue Change By Glamping Statistics
- The annual percentage change in revenue for the global camping market has fluctuated between 2018 and 2029.
- In 2018, the market grew by 3.0%, followed by a higher growth rate of 3.9% in 2019.
- The growth rate peaked at 5.8% in 2020 before experiencing a decline in 2021, where it fell by 2.4%.
- A slight decrease continued in 2022 with a negligible drop of 0.1%.
- However, the market rebounded strongly in 2023, recording an 8.4% increase.
- This recovery trend persisted through the subsequent years, with growth rates of 6.4% in 2024, 5.9% in 2025, and consistent increases of 5.8% in both 2026 and 2027.
- The growth slightly tapered off to 5.6% in 2028 and further to 5.4% by 2029, indicating a stable yet slowing expansion in the latter years of the forecast period.
(Source: Statista)
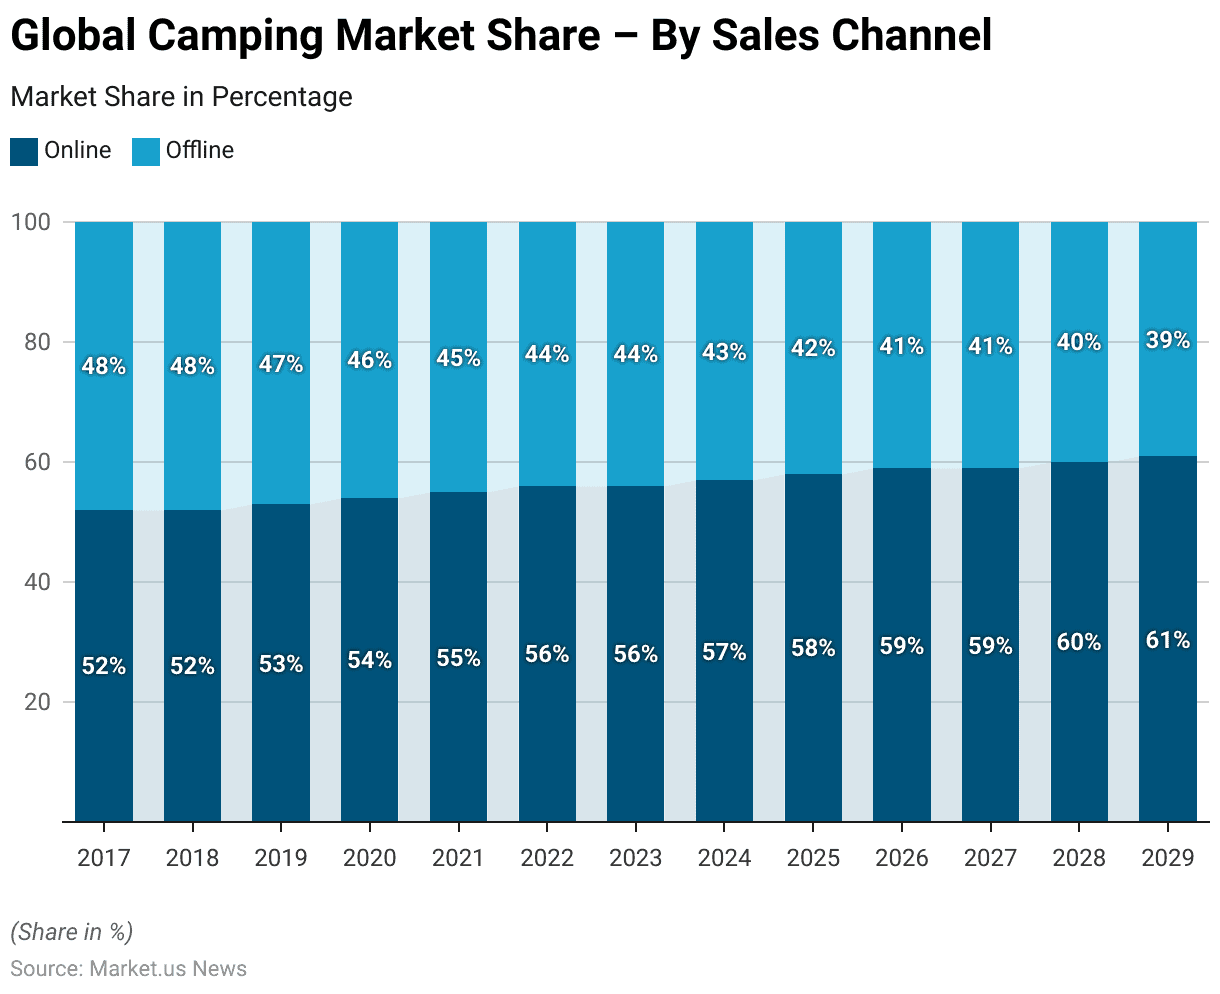
Glamping Statistics by Global Camping Market Share – By Sales Channel
- The distribution of sales in the global camping market between online and offline channels from 2017 to 2029 shows a consistent shift toward online purchasing.
- In 2017, the online sales channel accounted for 52% of the market, closely followed by offline sales at 48%. This pattern remained stable in 2018.
- From 2019 onwards, a gradual increase in the proportion of online sales was observed, with the online share growing to 53% and the offline reducing to 47%.
- This trend of increasing online dominance continued annually, with the online percentage reaching 54% in 2020, 55% in 2021, and steadily increasing by about 1% each year after that.
- By 2025, the online share had risen to 58%, and it further expanded to 59% by 2026.
- This increment continued, reaching 60% in 2028 and culminating at 61% by 2029, while the offline segment correspondingly decreased to 39%.
- This gradual shift highlights the growing consumer preference for online shopping in the camping market over the years.
(Source: Statista)
Glamping Statistics By Camping Market Revenue – By Country
- The camping market revenue by country reveals significant variances across different regions.
- The United States leads by a substantial margin, generating USD 25,810 million.
- China follows as the second largest market with USD 11,570 million.
- European countries also show notable contributions, with France generating USD 1,519 million, placing it third.
- Japan and the United Kingdom are nearly at a level, with revenues of USD 899 million and USD 895 million, respectively.
- Australia contributes USD 800 million, while Italy reports USD 695 million, and India closely trails with USD 671 million.
- Germany’s market revenue stands at USD 553 million, followed by Spain with USD 452 million.
- The Netherlands and Canada have smaller yet significant market revenues of USD 346 million and USD 317 million, respectively.
- In Scandinavia, Sweden, Denmark, and Norway present smaller market sizes of USD 197 million, USD 163 million, and USD 135 million, respectively.
- This distribution underscores a diverse global engagement with camping, with predominant revenues being generated in the United States and China.
(Source: Statista)
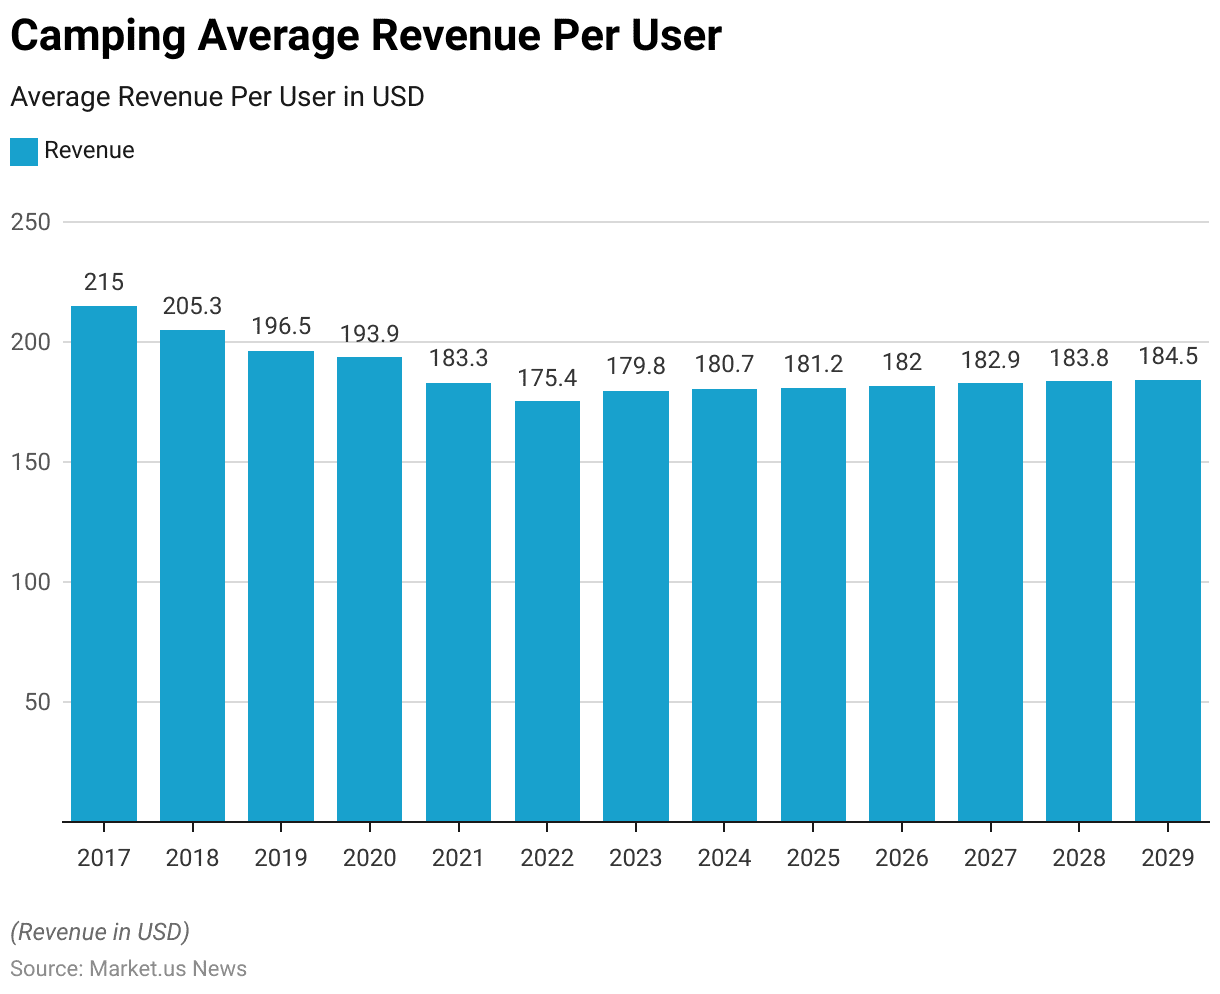
Revenue Generation from Camping
- The Camping Average Revenue Per User (ARPU) has seen a fluctuating pattern from 2017 to 2029.
- In 2017, the ARPU started at USD 215.00, which was the highest value recorded in the period.
- There was a noticeable decline over the next few years, with the ARPU reducing to USD 205.30 in 2018, further decreasing to USD 196.50 in 2019, and then to USD 193.90 in 2020.
- The decline continued into 2021, reaching a low of USD 183.30.
- A slight rebound occurred in 2022, with the ARPU at USD 175.40, followed by an increase to USD 179.80 in 2023.
- This recovery trend continued, albeit modestly, through the subsequent years: USD 180.70 in 2024, USD 181.20 in 2025, and progressively increasing to USD 182.00 in 2026, USD 182.90 in 2027, USD 183.80 in 2028, and finally reaching USD 184.50 by 2029.
- The pattern reflects an initial sharp decline in ARPU followed by a period of gradual recovery and stabilization towards the end of the forecast period.
(Source: Statista)
Camping Users and Penetration Rate
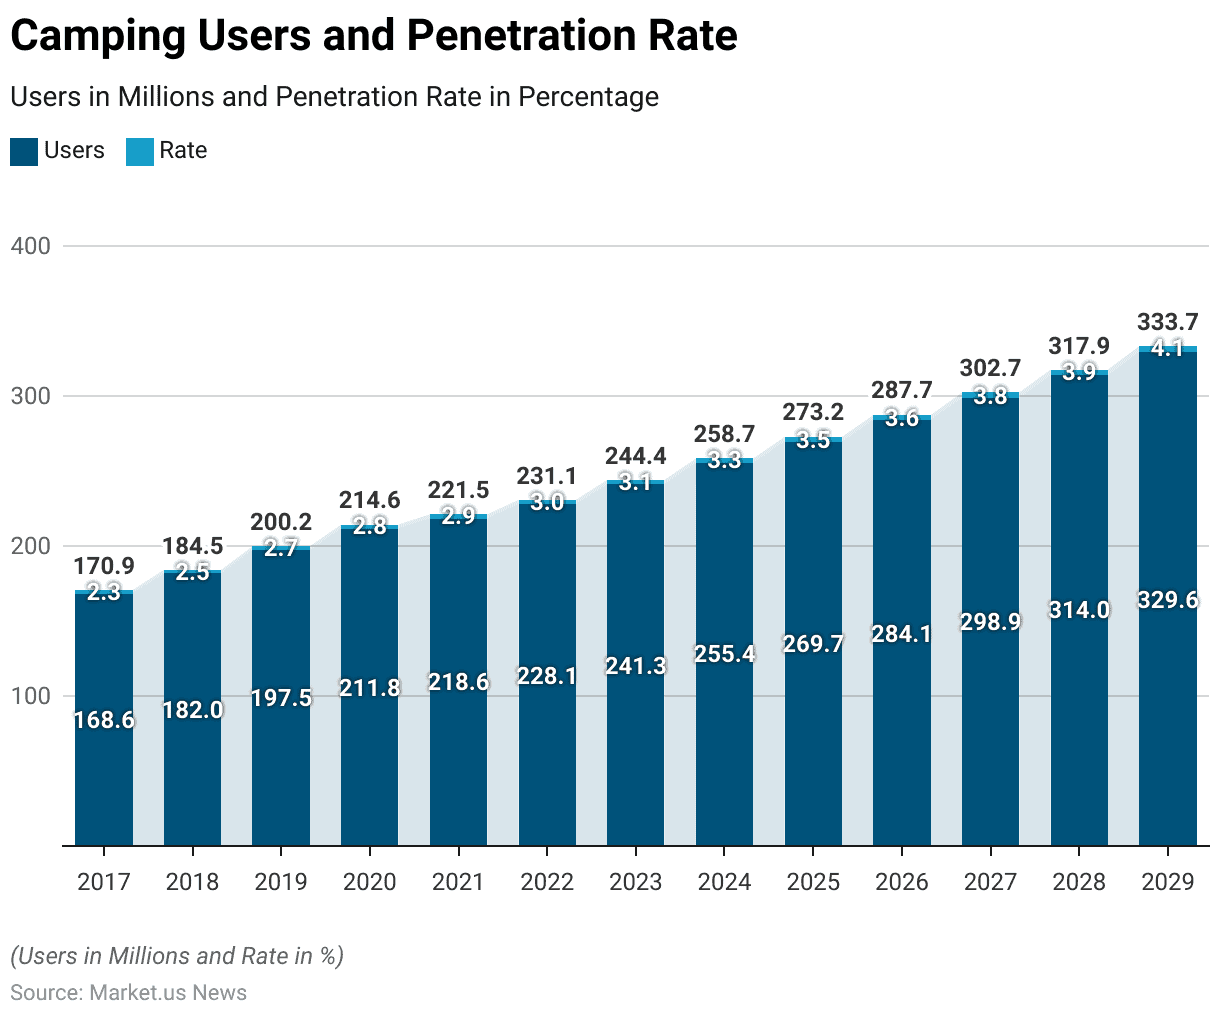
- From 2017 to 2029, the camping industry witnessed consistent growth in both the number of users and the penetration rate.
- In 2017, the number of camping users stood at 168.60 million, with a penetration rate of 2.3%.
- The user base grew to 182.00 million in 2018, with a slight increase in penetration rate to 2.5%.
- This upward trend continued, reaching 197.50 million users and a 2.7% penetration rate in 2019.
- The growth momentum was sustained through 2020, with users increasing to 211.80 million and penetration edging up to 2.8%.
- By 2021, there were 218.60 million users with a penetration rate of 2.9%.
- The growth accelerated in the subsequent years, with the user count rising to 228.10 million in 2022 and a penetration rate of 3.0%, followed by 241.30 million users and a 3.1% penetration rate in 2023.
- The pattern of growth was robust, with user numbers reaching 255.40 million and a penetration rate of 3.3% by 2024, further expanding to 269.70 million users and a 3.5% penetration rate in 2025.
- The trend persisted, with users increasing to 284.10 million in 2026 and the penetration rate growing to 3.6%.
- By 2027, users had climbed to 298.90 million and a 3.8% penetration rate.
- The progression continued, reaching 314.00 million users by 2028 with a penetration rate of 3.9% and peaking at 329.60 million users with a 4.1% penetration rate by 2029.
- This consistent increase illustrates a growing global engagement with camping as a leisure activity.
(Source: Statista)
Global Glamping Market Size Statistics
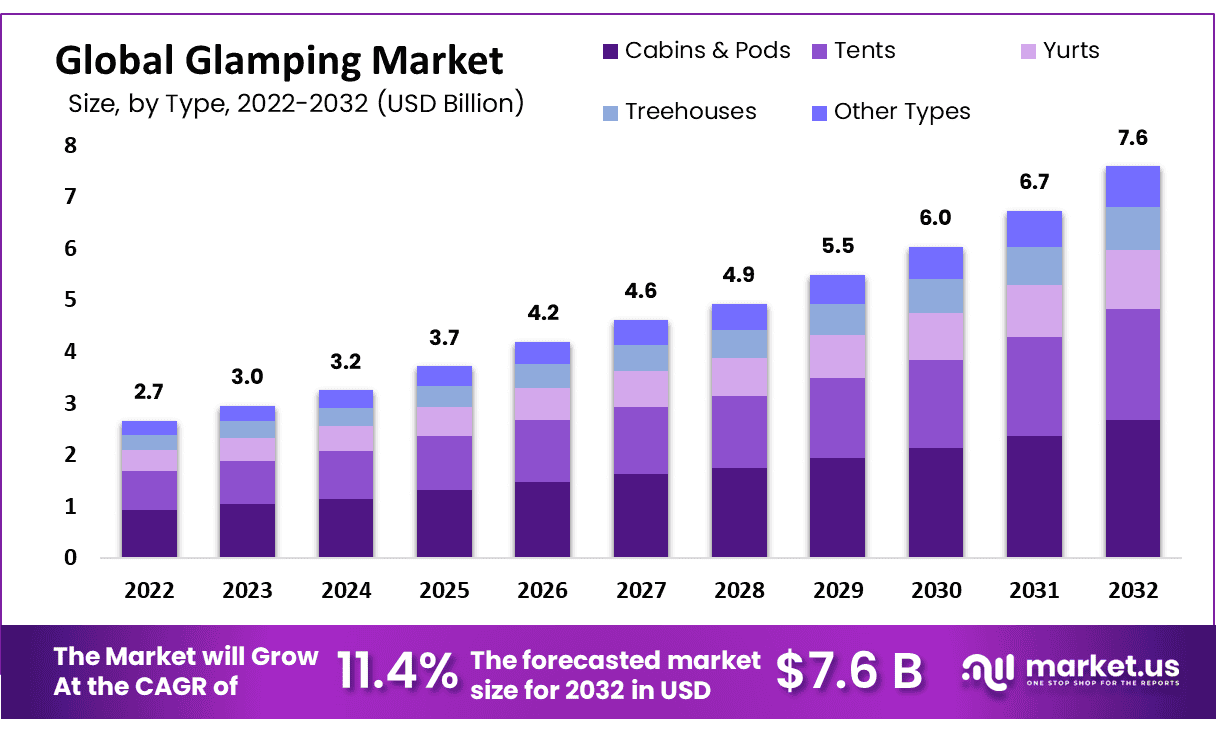
- The global glamping market size has exhibited a robust growth trajectory from 2022 to 2032.
- In 2022, the market was valued at USD 2.7 billion.
- It saw an increase to USD 3.0 billion in 2023 and further to USD 3.2 billion in 2024.
- The growth momentum continued, with the market size expanding to USD 3.7 billion in 2025 and USD 4.2 billion in 2026.
- By 2027, the market size reached USD 4.6 billion, and it grew to USD 4.9 billion in 2028.
- The upward trend persisted, with significant growth noted as the market size climbed to USD 5.5 billion in 2029, USD 6.0 billion in 2030, and USD 6.7 billion in 2031.
- The forecast culminated in a market size of USD 7.6 billion by 2032, reflecting a sustained increase in consumer interest and investment in glamping as a luxurious outdoor activity over the decade.
(Source: market.us)
Glamping Sites and Seasonality Statistics
- As of June 2023, the distribution of glamping sites in Russia by seasonality shows a predominant preference for year-round operations.
- Approximately 63% of all glamping sites are operational throughout the year, catering to guests regardless of the season.
- Seasonal sites, which operate only during specific times of the year, account for 33% of the total.
- A smaller segment, constituting 4% of the sites, operates on a mixed basis, blending elements of both year-round and seasonal availability.
- This distribution highlights a significant leaning towards providing continuous service, likely due to the demand for luxury camping experiences across various seasons in Russia.
(Source: Statista)
Demographics of Glamping Participants Statistics
According to Age Group
- In 2023, the global glamping market demonstrated notable age-related segmentation in revenue generation.
- Individuals aged 18 to 32 years old led the market, contributing 45.33% of the revenue.
- The next significant segment was composed of individuals aged 33 to 50 years, who accounted for 28% of glamping participation.
- The remainder of the market, making up 26.7%, was largely represented by children participating in family glamping activities and older adults.
- These figures underline distinct preferences and participation levels across different age groups within the glamping industry.
(Source: Eco Structures)
Among Men
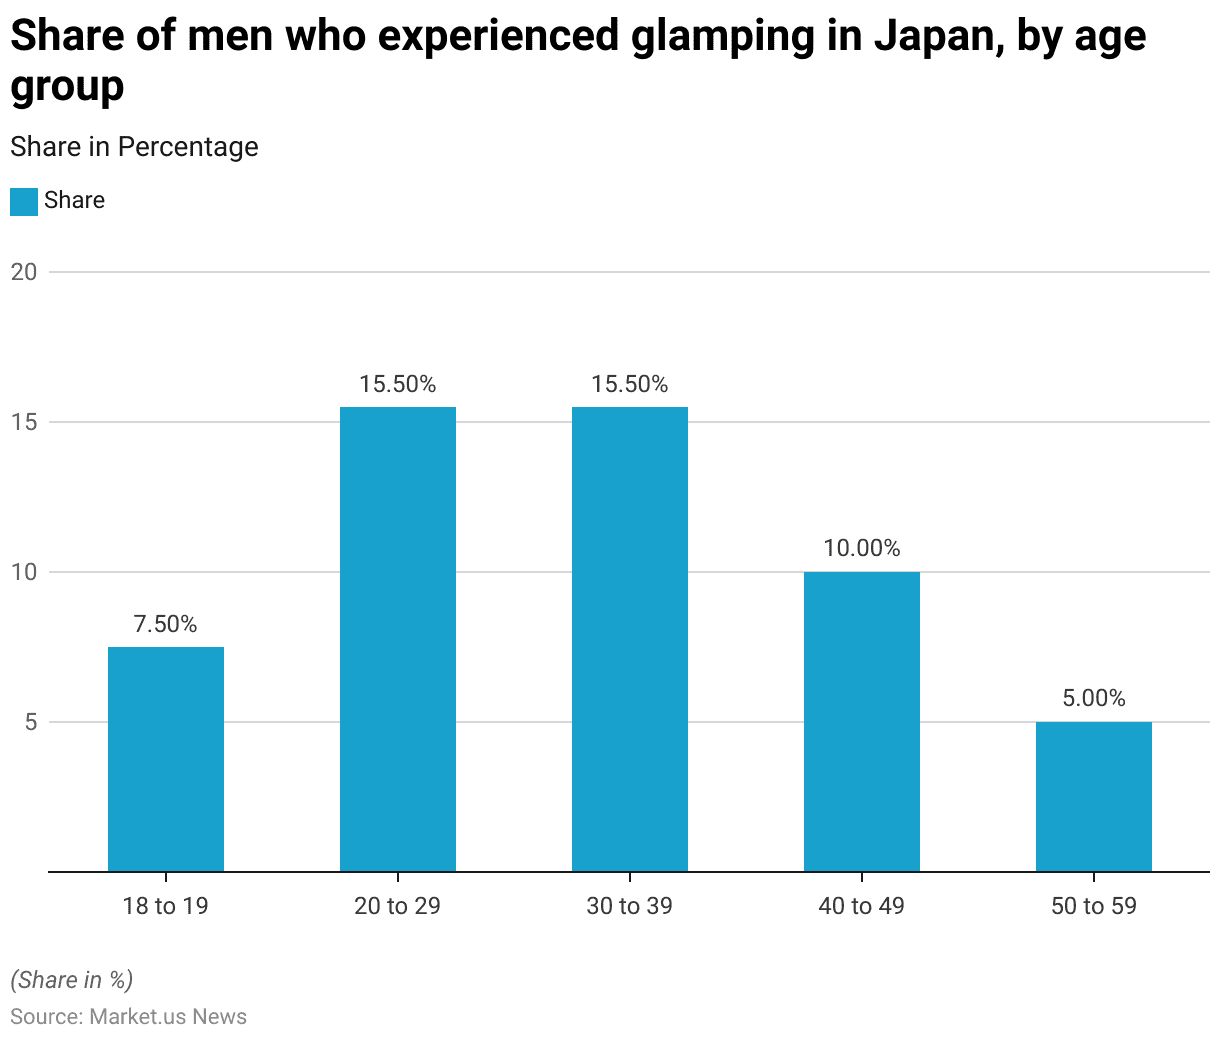
- The data presents the percentage of men in Japan who have experienced glamping, segmented by age groups as of April 2023.
- The age group of 18 to 19 years accounts for 7.50% of men who have tried glamping.
- The share rises significantly in the 20 to 29 and 30 to 39 age groups, each holding 15.50% of the total.
- This trend then decreases with age; men aged 40 to 49 represent 10% of glamping participants, while those in the 50 to 59 age group constitute the smallest percentage at 5%.
- This distribution suggests that younger men, particularly those in their twenties and thirties, are more inclined to participate in glamping activities in Japan.
(Source: Statista)
Among Women
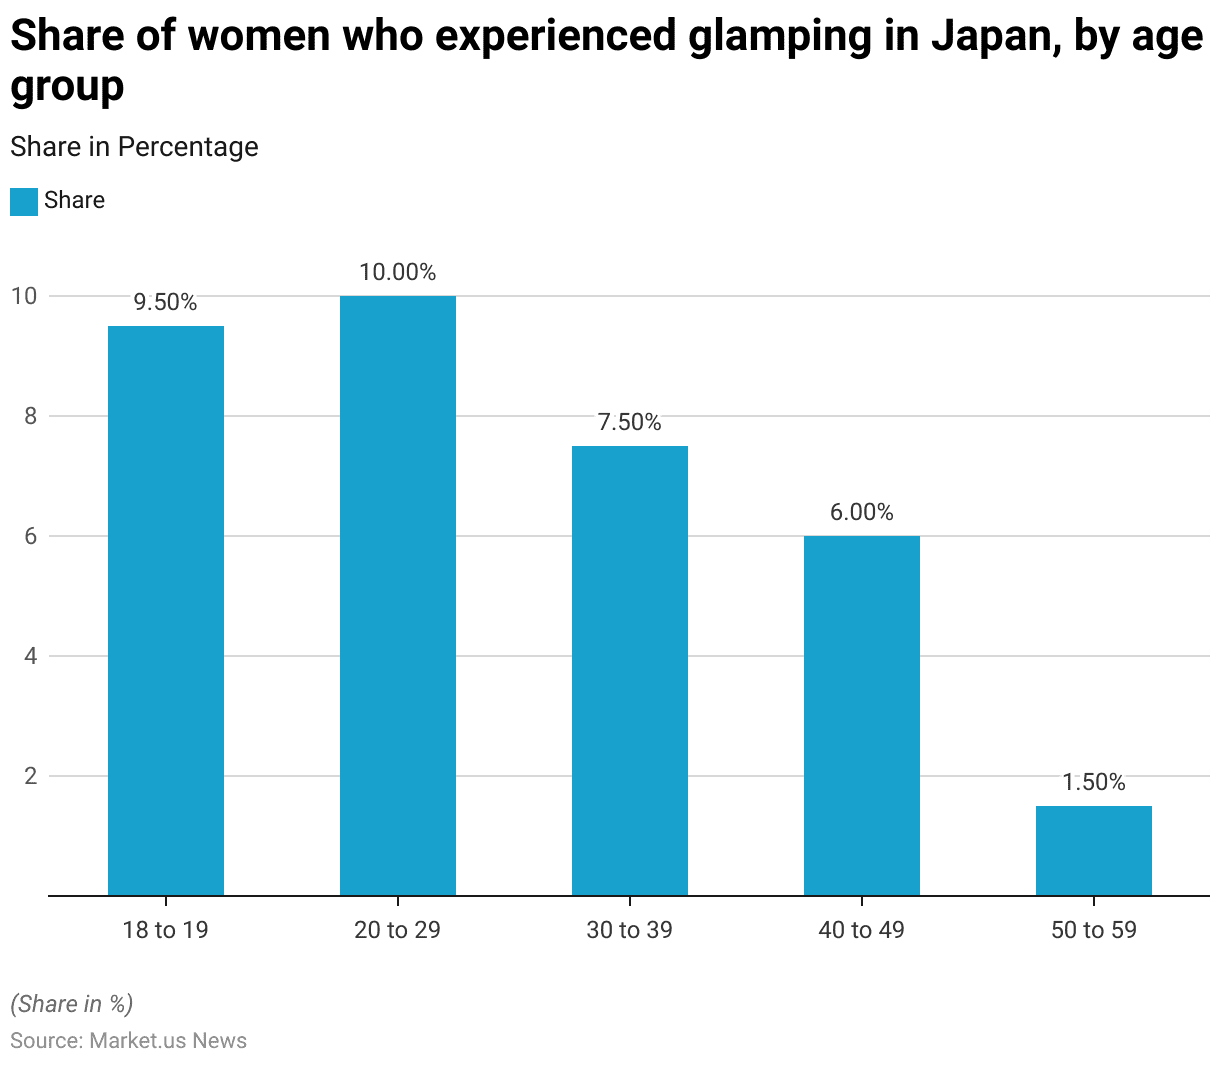
- The data illustrates the distribution of women in Japan who have experienced glamping, categorized by age groups as of April 2023.
- The youngest cohort, aged 18 to 19, has the highest participation rate at 9.50%.
- This is closely followed by women aged 20 to 29, who account for 10% of those who have engaged in glamping.
- There is a noticeable decline in participation among the subsequent age groups, with 7.50% of women aged 30 to 39 having tried glamping.
- Those in the 40 to 49 age group represent 6% of the total, and the 50 to 59 age group has the lowest share, at only 1.50%.
- This indicates that glamping is most popular among younger women, particularly those under 30.
(Source: Statista)
Glamping and Camping Statistics Across Different Nations Statistics
Japan Glamping Statistics
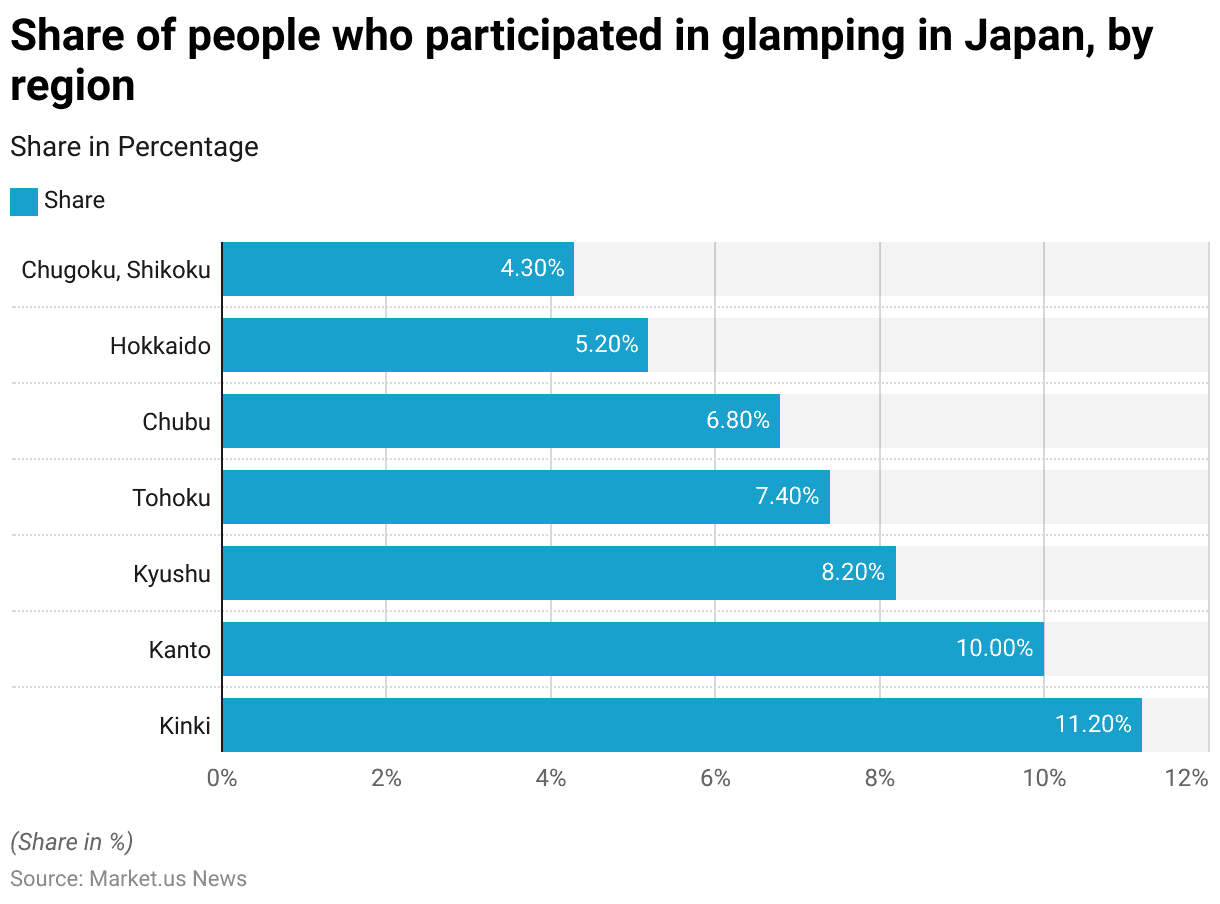
- In April 2023, participation in glamping across various regions of Japan showed varied levels of engagement.
- The Kinki region led with the highest share of participants at 11.20%.
- This was closely followed by the Kanto region, which accounted for 10% of the glamping participants.
- Kyushu also held a significant share with 8.20%, while Tohoku contributed 7.40%.
- Chubu region’s participation was slightly lower at 6.80%.
- Hokkaido saw a share of 5.20%, and the combined regions of Chugoku and Shikoku recorded the lowest participation rate at 4.30%.
- This data illustrates a regional disparity in the popularity of glamping within Japan.
(Source: Statista)
United States Glamping Statistics
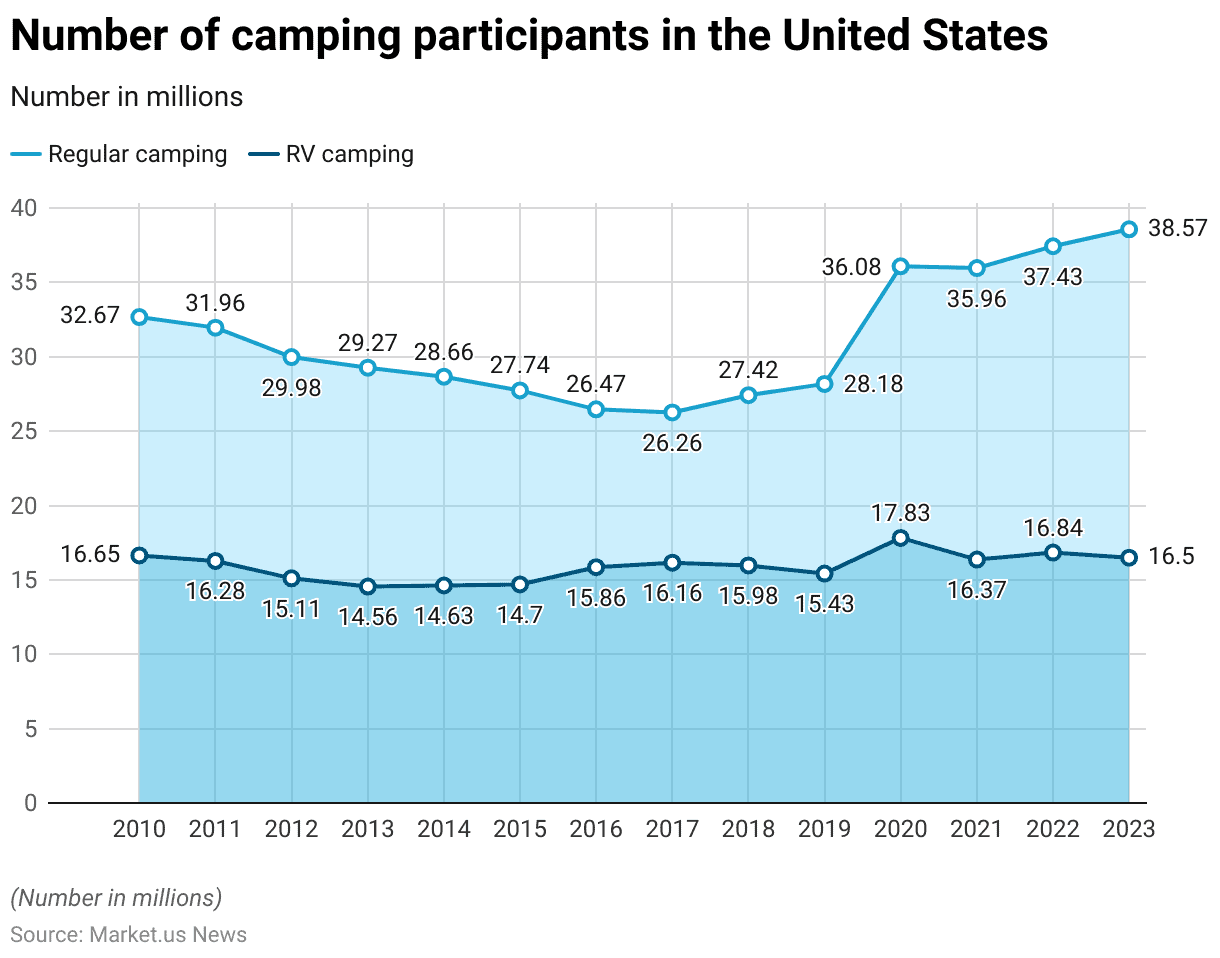
- From 2010 to 2023, the number of camping participants in the United States, both for regular and RV camping, experienced several fluctuations.
- In 2010, regular camping saw 32.67 million participants, which decreased steadily over the years to a low of 26.26 million in 2017.
- However, participation began to rise again, reaching 38.57 million by 2023.
- RV camping followed a similar trend, starting with 16.65 million participants in 2010, declining slightly to 14.56 million by 2013, and then gradually increasing, peaking at 17.83 million in 2020 before stabilizing at 16.5 million in 2023.
- Significant increases in participation were observed in both camping categories during 2020, possibly influenced by outdoor activity trends during the pandemic.
- Regular camping showed a stronger upward trajectory from 2019 onward. Surpassing pre-2010 levels by 2023, while RV camping maintained relatively stable participation, with minor variations.
(Source: Statista)
Canada Glamping Statistics
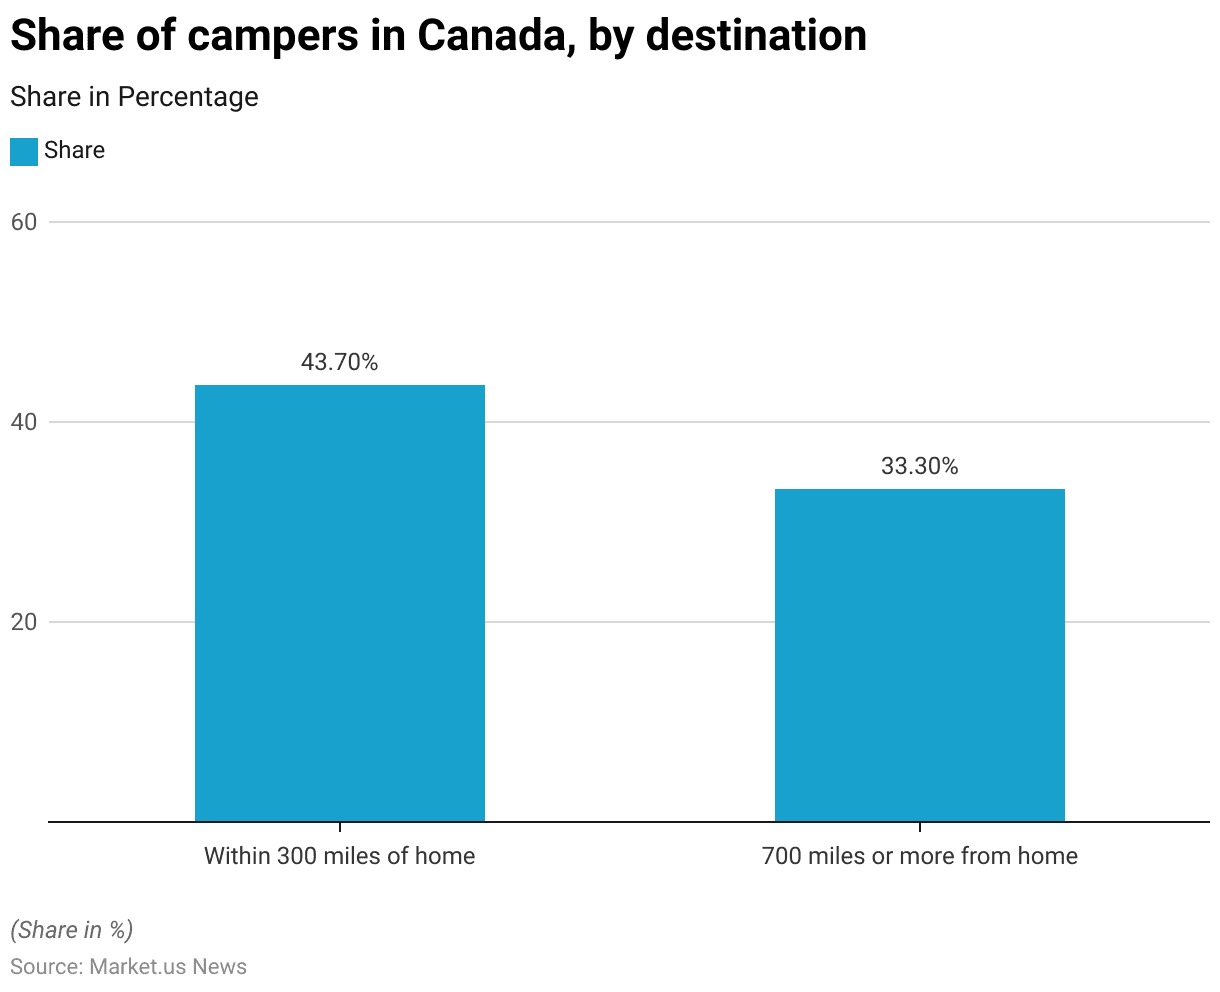
- As of June 2022, the distribution of camping destinations among Canadian campers varied significantly based on distance from home.
- The majority of campers, representing 43.70%, chose destinations within 300 miles of their residence.
- In contrast, a substantial portion, 33.30% of respondents, preferred to venture much further, choosing destinations that were 700 miles or more away from home.
- This data underscores a diverse preference for camping distances among the Canadian population, with a notable inclination towards more proximate locations.
(Source: Statista)
Germany Glamping Statistics
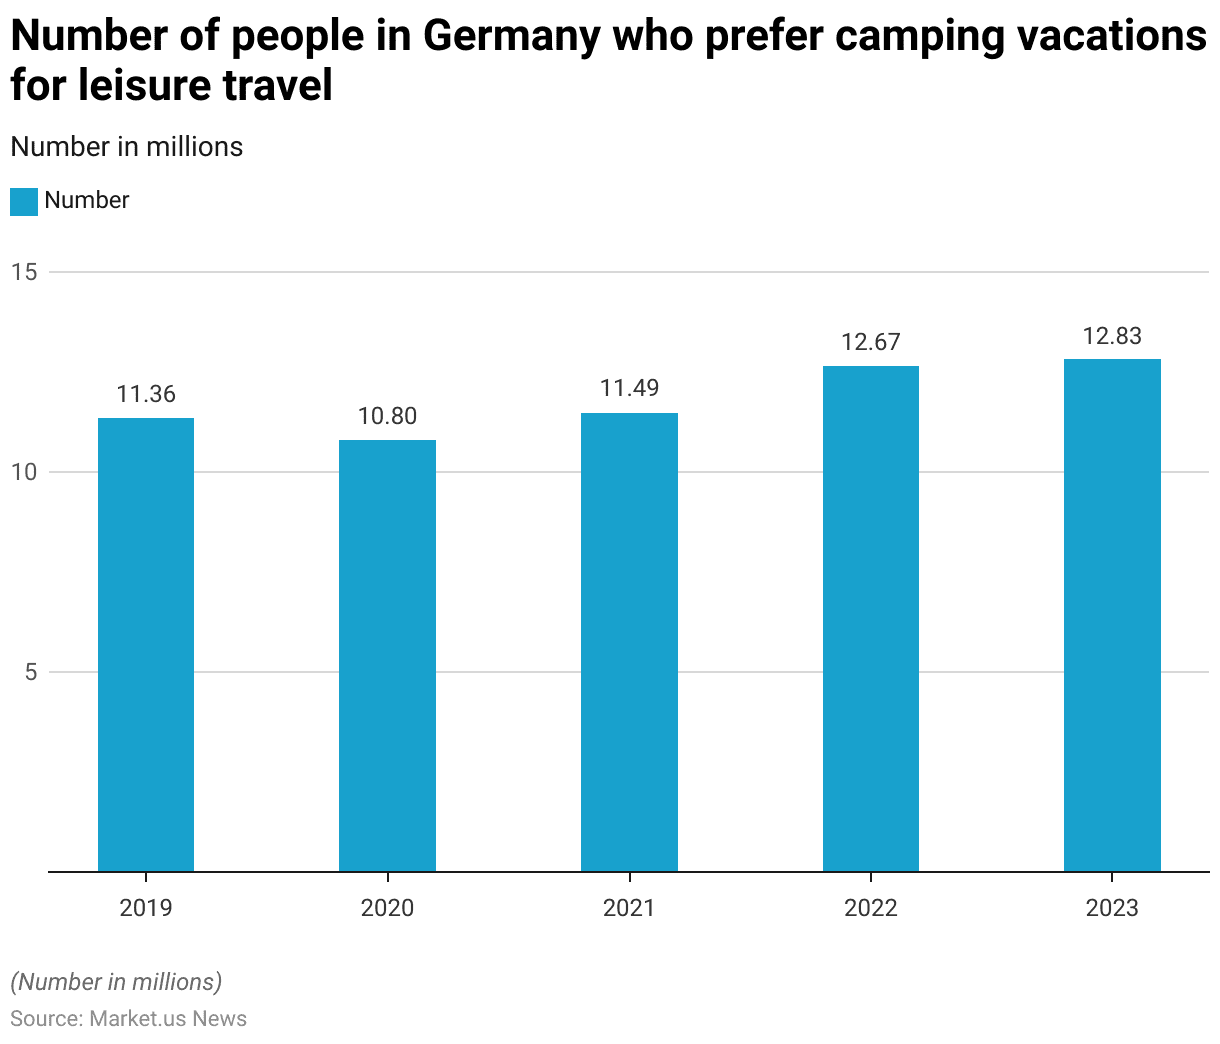
- From 2019 to 2023, the number of people in Germany who prefer camping vacations for leisure travel showed interesting fluctuations.
- In 2019, there were 11.36 million individuals who favored camping trips.
- This number dipped in 2020 to 10.8 million, likely due to the constraints imposed by global events.
- However, the trend reversed in 2021, with numbers rising to 11.49 million.
- By 2022, the preference for camping vacations continued to grow significantly, reaching 12.67 million.
- This upward trend persisted into 2023, with the count slightly increasing to 12.83 million. Indicating a strengthened interest in camping as a leisure activity among Germans.
(Source: Statista)
France Glamping Statistics
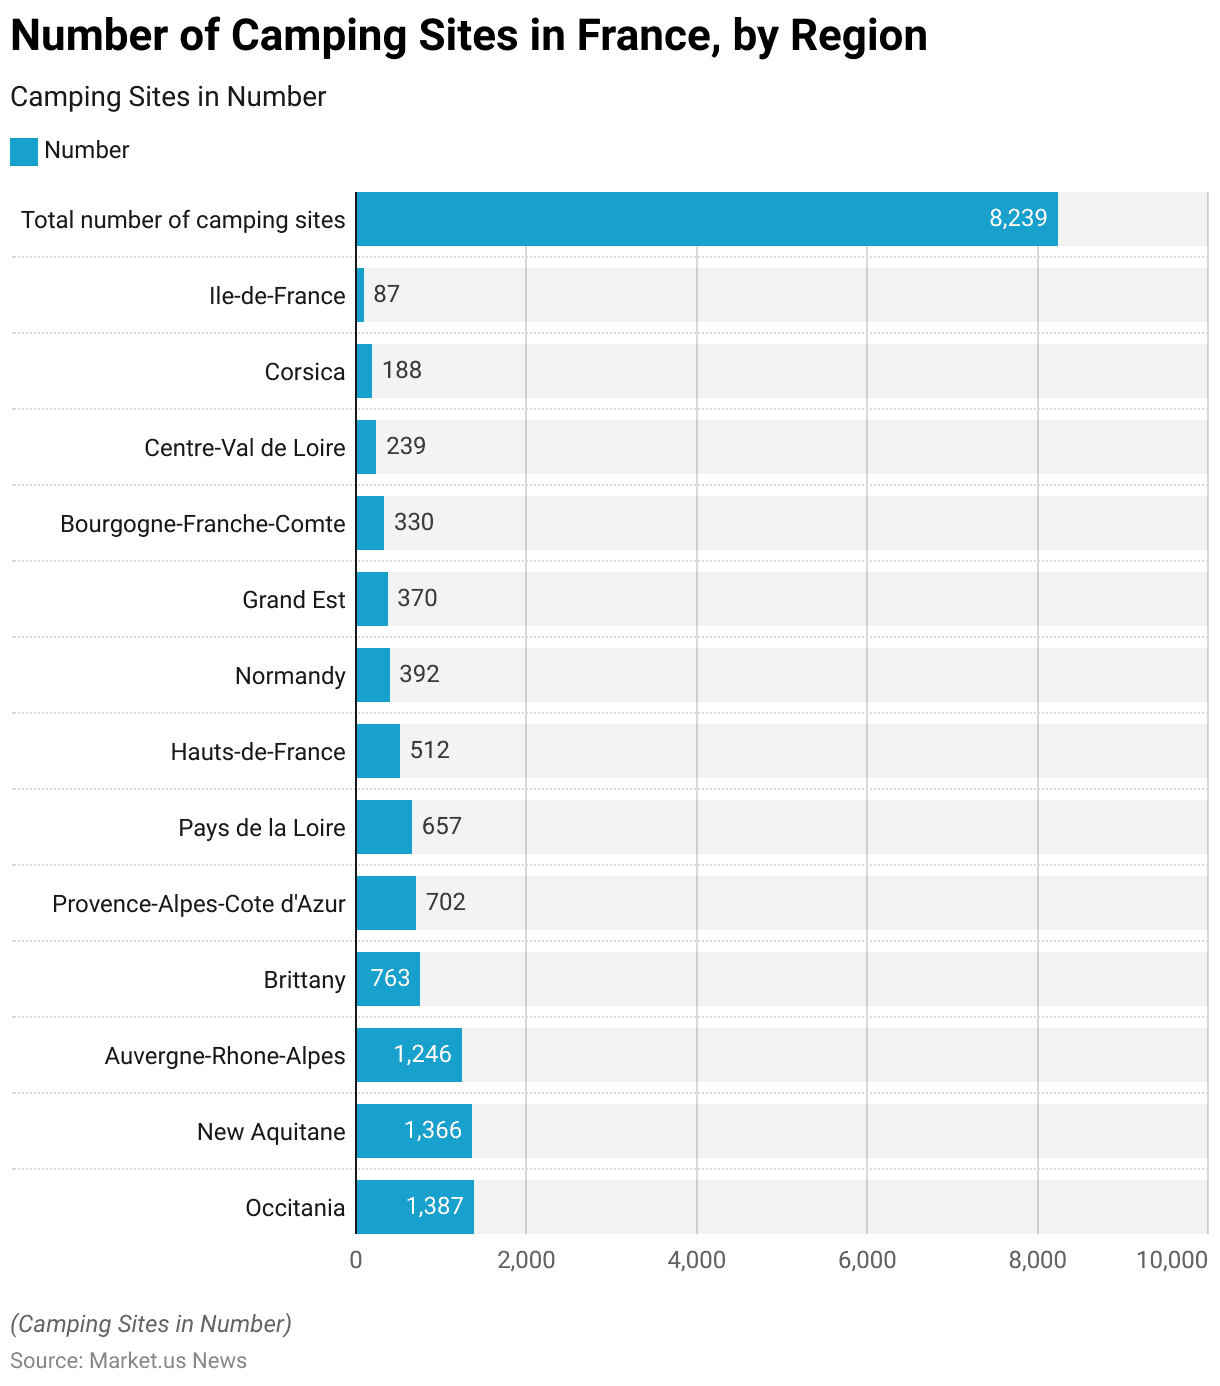
- As of February 2021, France had a total of 8,239 camping sites distributed across various regions.
- Occitania topped the list with the highest number of sites at 1,387, closely followed by New Aquitaine with 1,366.
- The Auvergne-Rhone-Alpes region is also prominently featured, with 1,246 camping sites.
- Brittany and Provence-Alpes-Cote d’Azur had a substantial number of sites as well, recording 763 and 702, respectively.
- Other regions with notable numbers included Pays de la Loire with 657 sites, Hauts-de-France with 512, and Normandy with 392.
- The Grand Est and Bourgogne-Franche-Comte regions had fewer sites, totaling 370 and 330, respectively.
- Centre-Val de Loire, Corsica, and Ile-de-France had even fewer camping facilities, reporting 239, 188, and 87 sites, respectively.
- This comprehensive distribution underscores the popularity and widespread availability of camping facilities across France.
(Source: Statista)
Australia Glamping Statistics
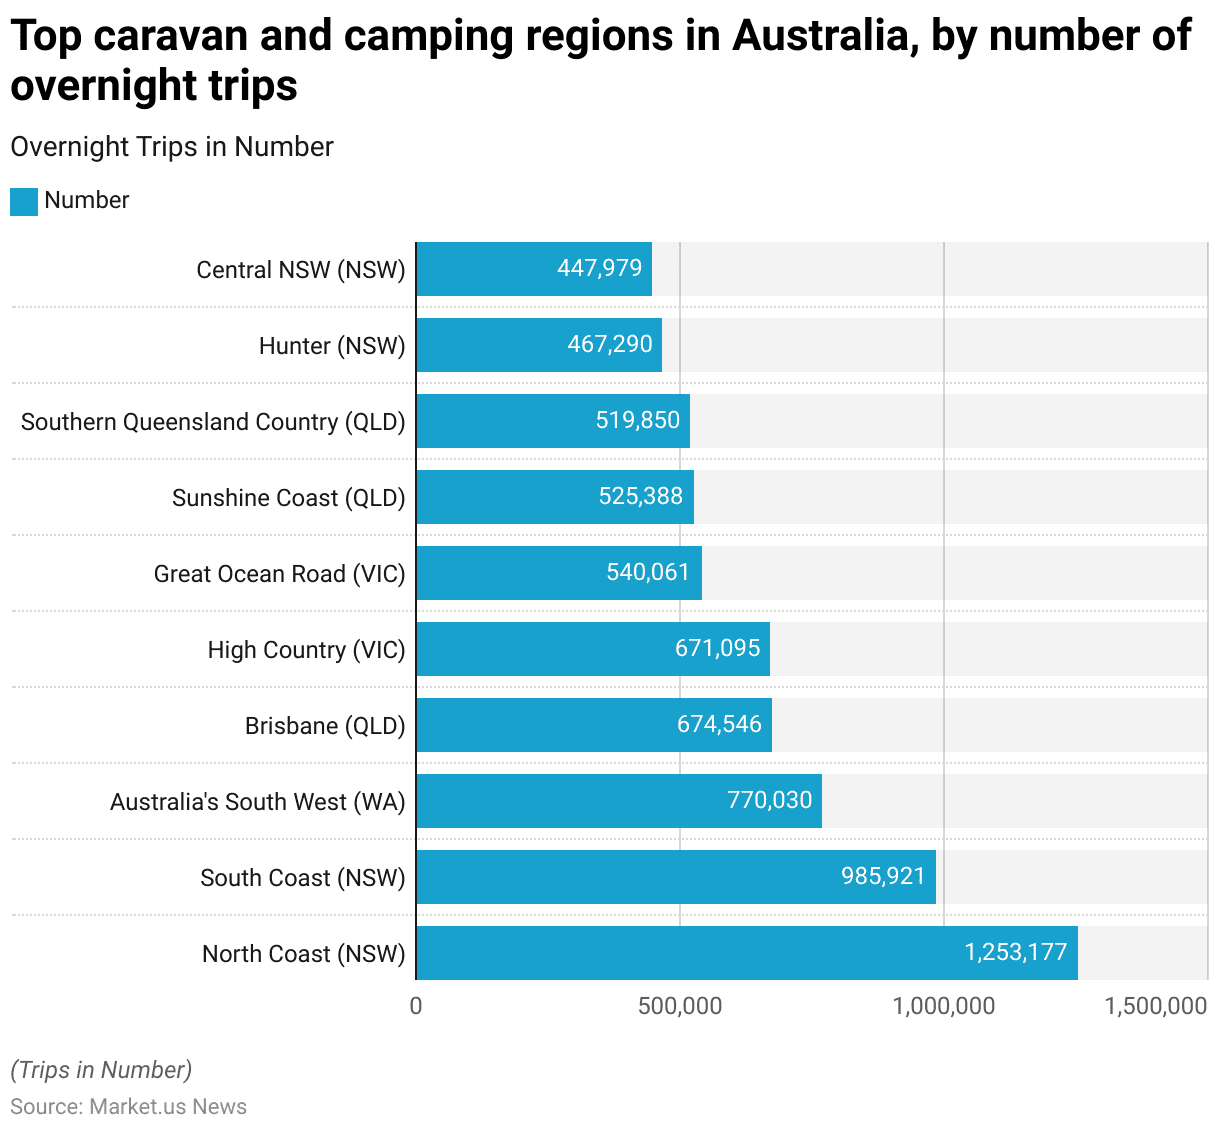
- In 2022, various regions across Australia were popular for caravan and camping activities. As reflected by the number of overnight trips recorded.
- The North Coast of New South Wales led the list with a substantial 12,533,177 overnight trips.
- The South Coast of New South Wales also showed significant camping activity, with 9,859,921 trips.
- Western Australia’s South West saw 770,030 trips, making it another favored destination.
- Brisbane in Queensland had 674,546 overnight trips, closely followed by Victoria’s High Country with 671,095.
- The Great Ocean Road in Victoria recorded 540,061 trips.
- Other notable regions included Queensland’s Sunshine Coast and Southern Queensland Country, with 525,388 and 519,850 trips, respectively.
- New South Wales’s Hunter and Central regions also featured prominently, with 467,290 and 447,979 trips, respectively.
- These statistics highlight Australia’s vibrant outdoor culture and the appeal of its diverse landscapes for camping and caravanning enthusiasts.
(Source: Statista)
South Korea Glamping Statistics
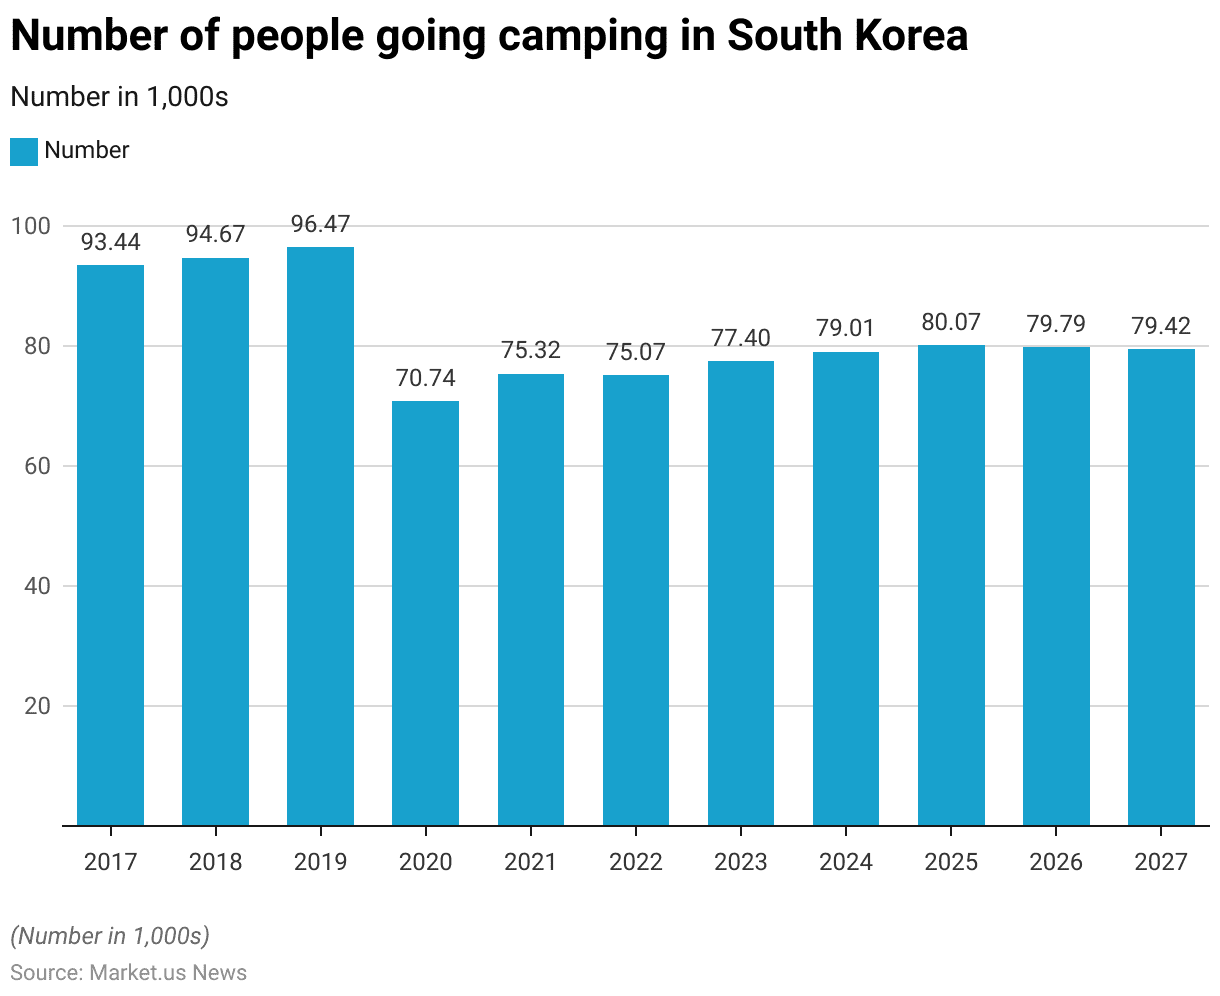
- From 2017 to 2022, the number of people going camping in South Korea exhibited some fluctuations and has been forecasted to continue changing up until 2027.
- Initially, in 2017, the camping population was at 93.44 thousand, gradually increasing to 96.47 thousand by 2019.
- However, a significant drop occurred in 2020, when the number fell to 70.74 thousand, likely impacted by external events.
- A slight recovery was seen in 2021 with 75.32 thousand campers, and the numbers remained stable in 2022 at 75.07 thousand.
- The forecast from 2023 to 2027 suggests a gradual increase, starting from 77.4 thousand in 2023, peaking at 80.07 thousand in 2025, and then slightly decreasing to 79.42 thousand by 2027.
- These trends indicate a recovery and stabilization in the popularity of camping in South Korea following the downturn experienced in 2020.
(Source: Statista)
Malaysia Glamping Statistics
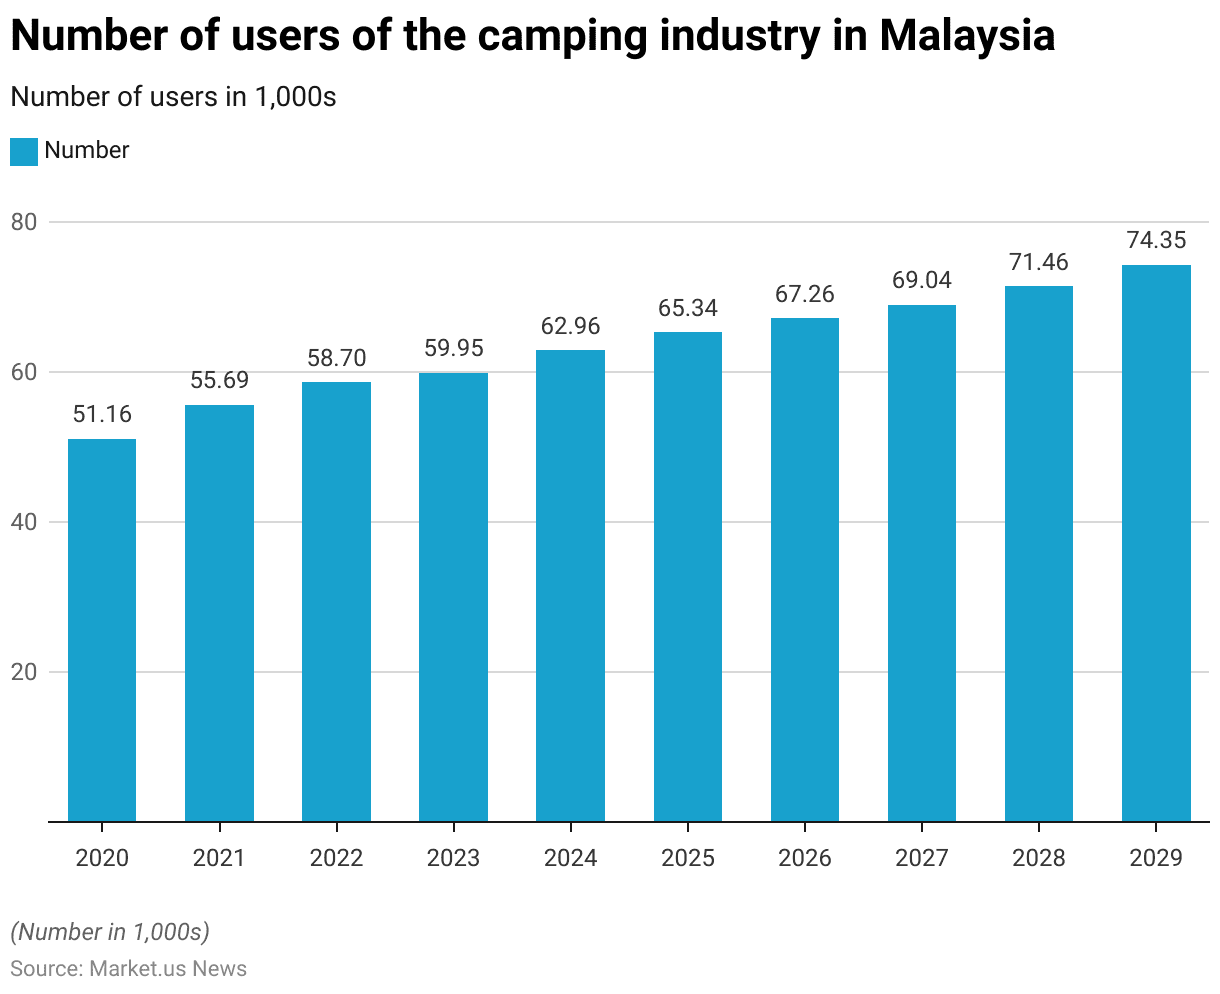
- The camping industry in Malaysia has seen a steady increase in the number of users from 2020 through to projections for 2029.
- In 2020, there were 51.16 thousand users, which rose to 55.69 thousand in 2021.
- The growth continued with 58.7 thousand users in 2022 and a slight increase to 59.95 thousand in 2023.
- The upward trend is expected to persist, reaching 62.96 thousand in 2024, 65.34 thousand in 2025, and 67.26 thousand in 2026.
- The projections for the following years indicate further growth, with the user base expected to expand to 69.04 thousand in 2027, 71.46 thousand in 2028, and culminating at 74.35 thousand by 2029.
- Further, this consistent increase reflects a growing interest in and sustained popularity of camping as a recreational activity in Malaysia over the past decade.
(Source: Statista)
Glamping Experience Trends and Statistics
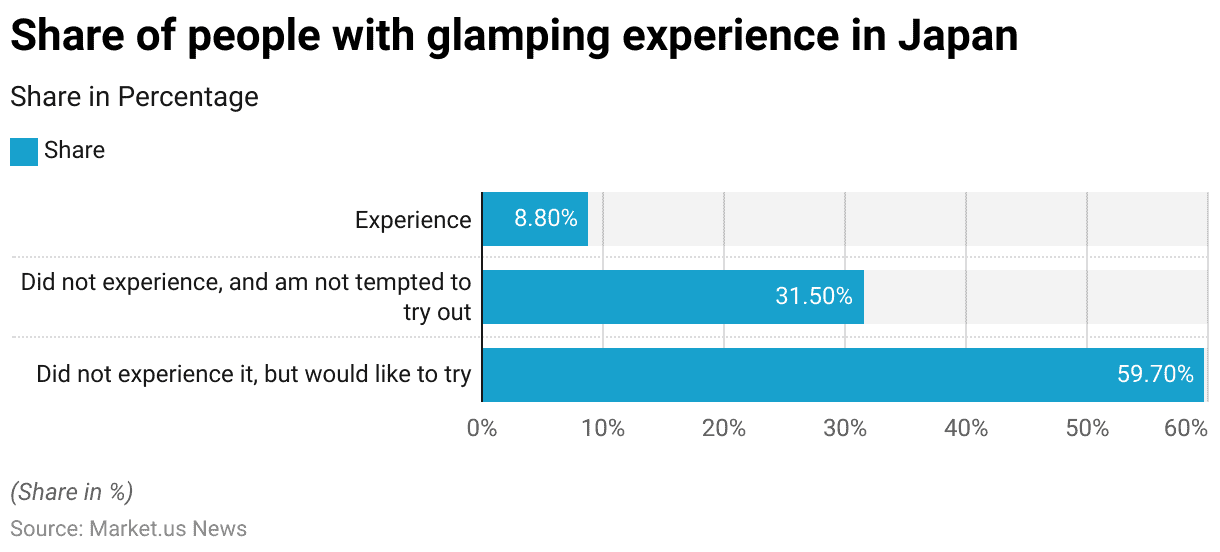
- As of April 2023, the popularity and interest in glamping among individuals in Japan varied significantly.
- A survey indicated that 59.70% of respondents had not experienced glamping but expressed a desire to try it.
- In contrast, 31.50% of those surveyed stated they had not tried glamping and were not interested in doing so.
- Only a small portion, 8.80%, of the respondents had experienced glamping.
- This data suggests that while a significant majority of the population remains curious about glamping, actual participation rates are still relatively low.
(Source: Statista)
Key Spending and Expenditure Statistics
Travel Expenditure During Camping Trips
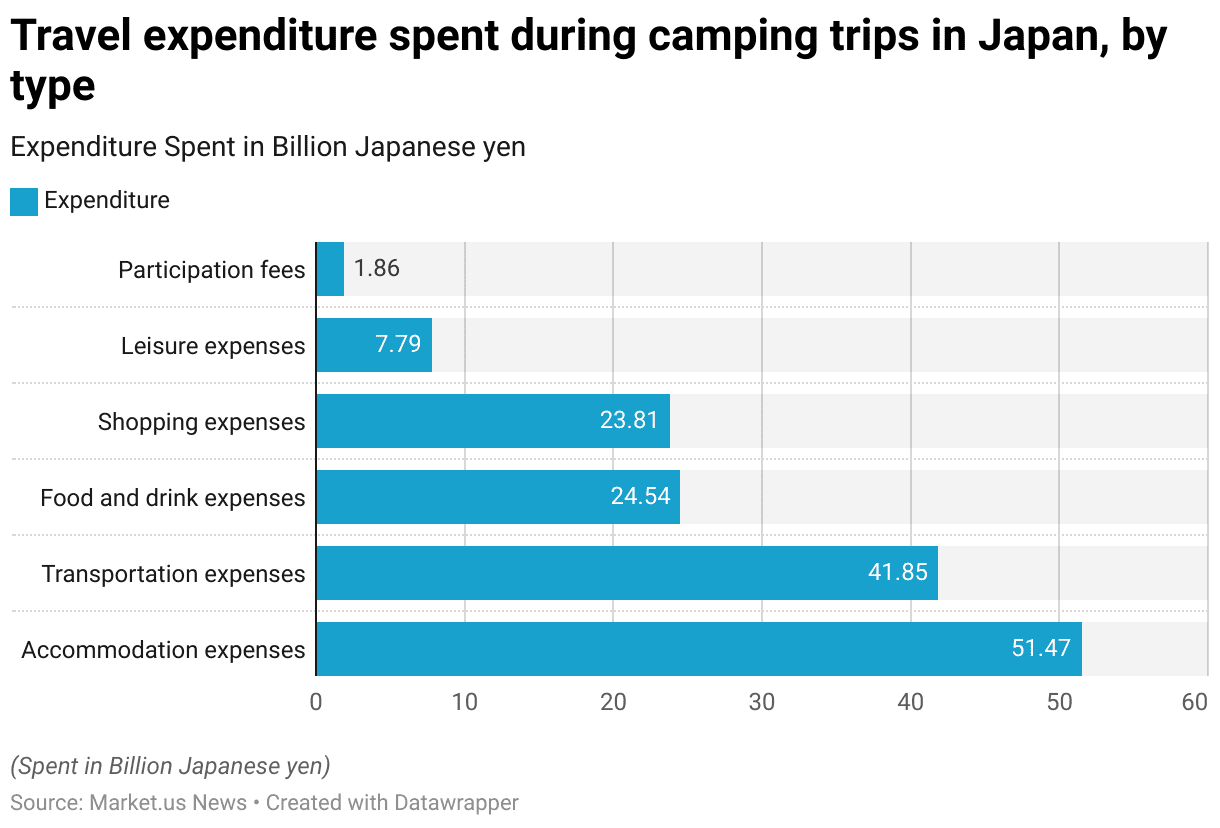
- In 2023, the distribution of travel expenditure related to camping trips in Japan was categorized into various types.
- Accommodation expenses represented the highest portion of spending at 51.47 billion Japanese yen, indicating a significant investment in staying facilities.
- Transportation expenses followed with 41.85 billion yen, underscoring the costs associated with reaching camping destinations.
- Expenditure on food and drink was also substantial, totaling 24.54 billion yen, while shopping expenses during trips amounted to 23.81 billion yen.
- Leisure activities accounted for 7.79 billion yen, reflecting spending on recreational pursuits.
- The smallest category was participation fees, which amounted to only 1.86 billion yen.
- This breakdown highlights the diverse aspects of camping trip budgets, with a strong focus on accommodation and transport.
(Source: Statista)
Expenditure on Sports and Camping Equipment
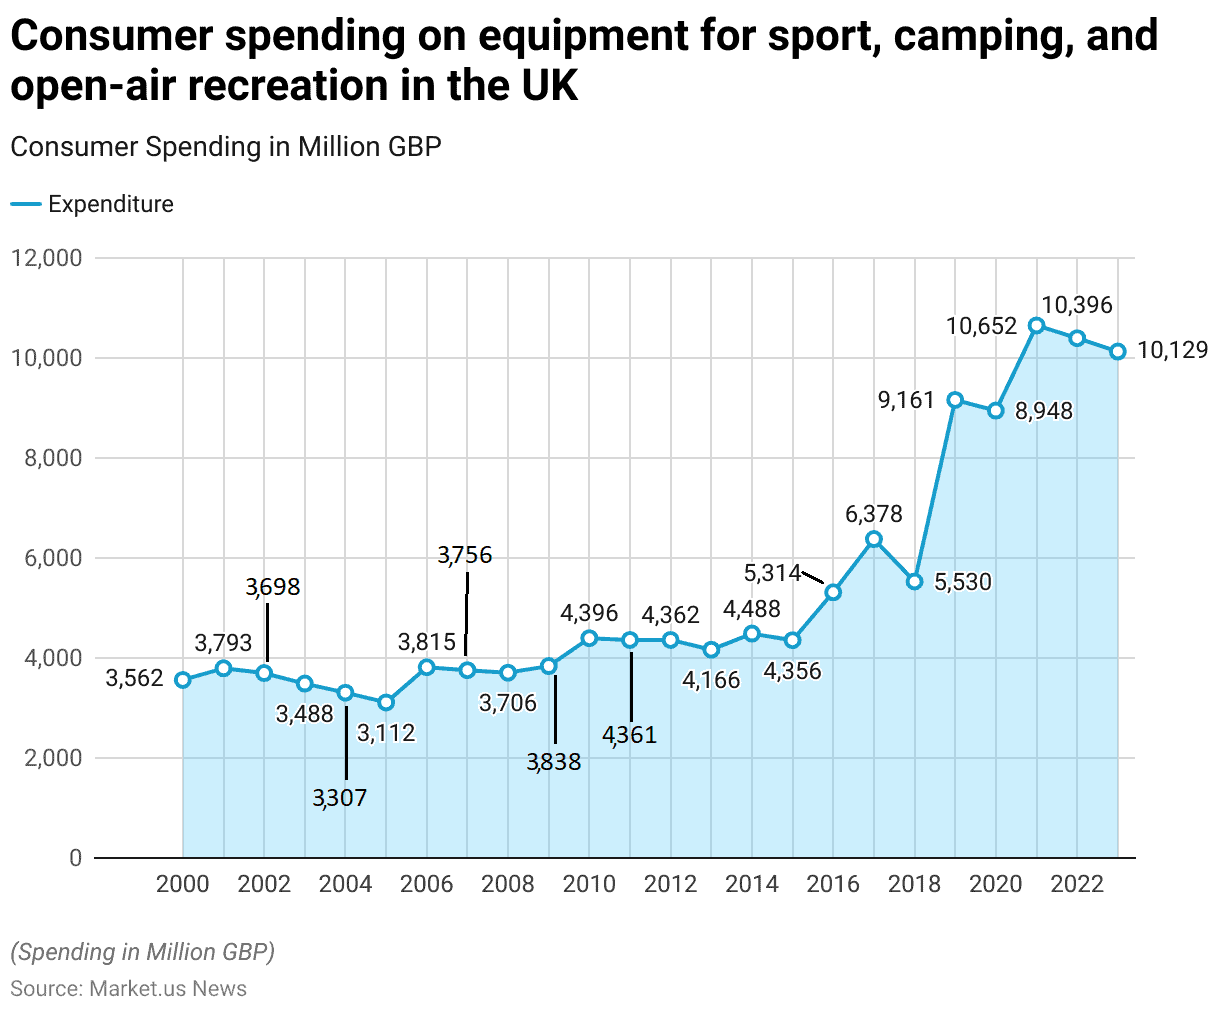
- Between 2000 and 2023, consumer spending on equipment for sport, camping, and open-air recreation in the United Kingdom experienced notable fluctuations.
- In 2000, expenditure stood at £3,562 million, rising to £3,793 million in 2001 before decreasing slightly to £3,698 million in 2002.
- A downward trend continued until 2005, with spending reaching £3,112 million.
- However, from 2006 onward, a period of gradual recovery began, with spending increasing to £3,815 million in 2006 and continuing to fluctuate through 2010, when expenditure reached £4,396 million.
- After a brief period of relative stability between 2011 and 2015, where spending hovered around £4,300 million to £4,488 million, significant growth occurred from 2016, when consumer expenditure surged to £5,314 million.
- This upward trend continued into 2017, with spending reaching £6,378 million. A notable increase occurred in 2019, with expenditure peaking at £9,161 million, followed by a slight dip in 2020 to £8,948 million.
- Despite this, consumer spending rebounded strongly in 2021, reaching £10,652 million.
- In the subsequent years, spending slightly declined to £10,396 million in 2022 and £10,129 million in 2023.
- Overall, the data reflects a significant long-term increase in consumer spending on sporting, camping, and open-air recreational equipment over the two-decade period, despite some periods of decline.
(Source: Statista)
Travel Expenditure During Camping Trips
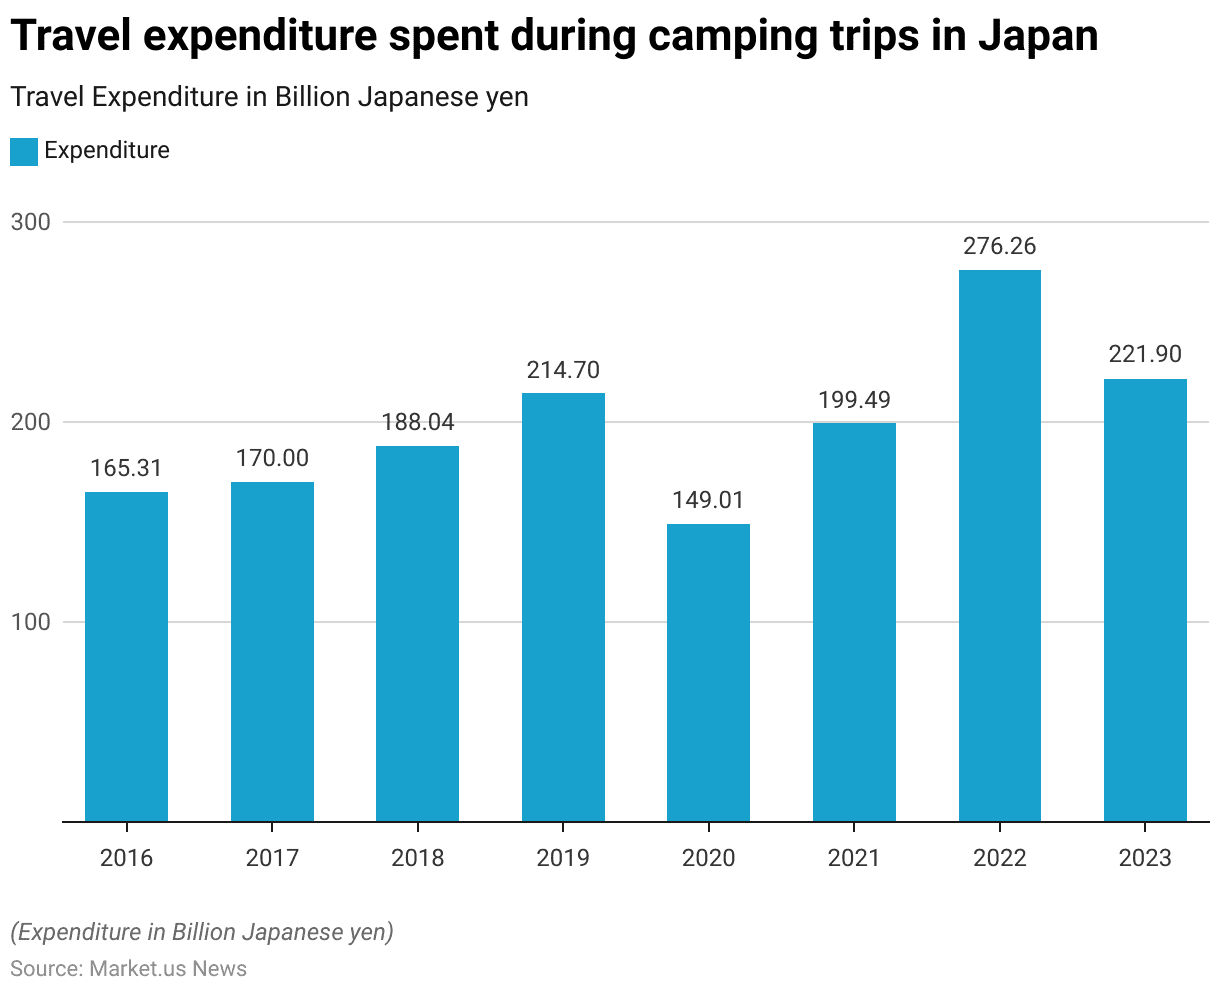
- From 2016 to 2023, travel expenditure during camping trips in Japan displayed a notable fluctuation, reflecting broader economic trends and likely shifts in consumer behavior.
- In 2016, spending started at 165.31 billion Japanese yen, with a steady increase over the next three years, culminating in 214.7 billion yen by 2019.
- However, in 2020, there was a significant downturn, with expenditure dropping to 149.01 billion yen, likely due to the impacts of global events on travel and outdoor activities.
- A recovery began in 2021, with spending rising to 199.49 billion yen, and by 2022, expenditure surged to a peak of 276.26 billion yen.
- In 2023, there was a decrease to 221.9 billion yen, yet spending remained significantly higher than the initial figures reported in 2016.
- This period illustrates the dynamic nature of travel spending in Japan’s camping sector, which is influenced by varying factors, including economic conditions and changing consumer preferences.
(Source: Statista)
Camping and Caravan Visitor Spending
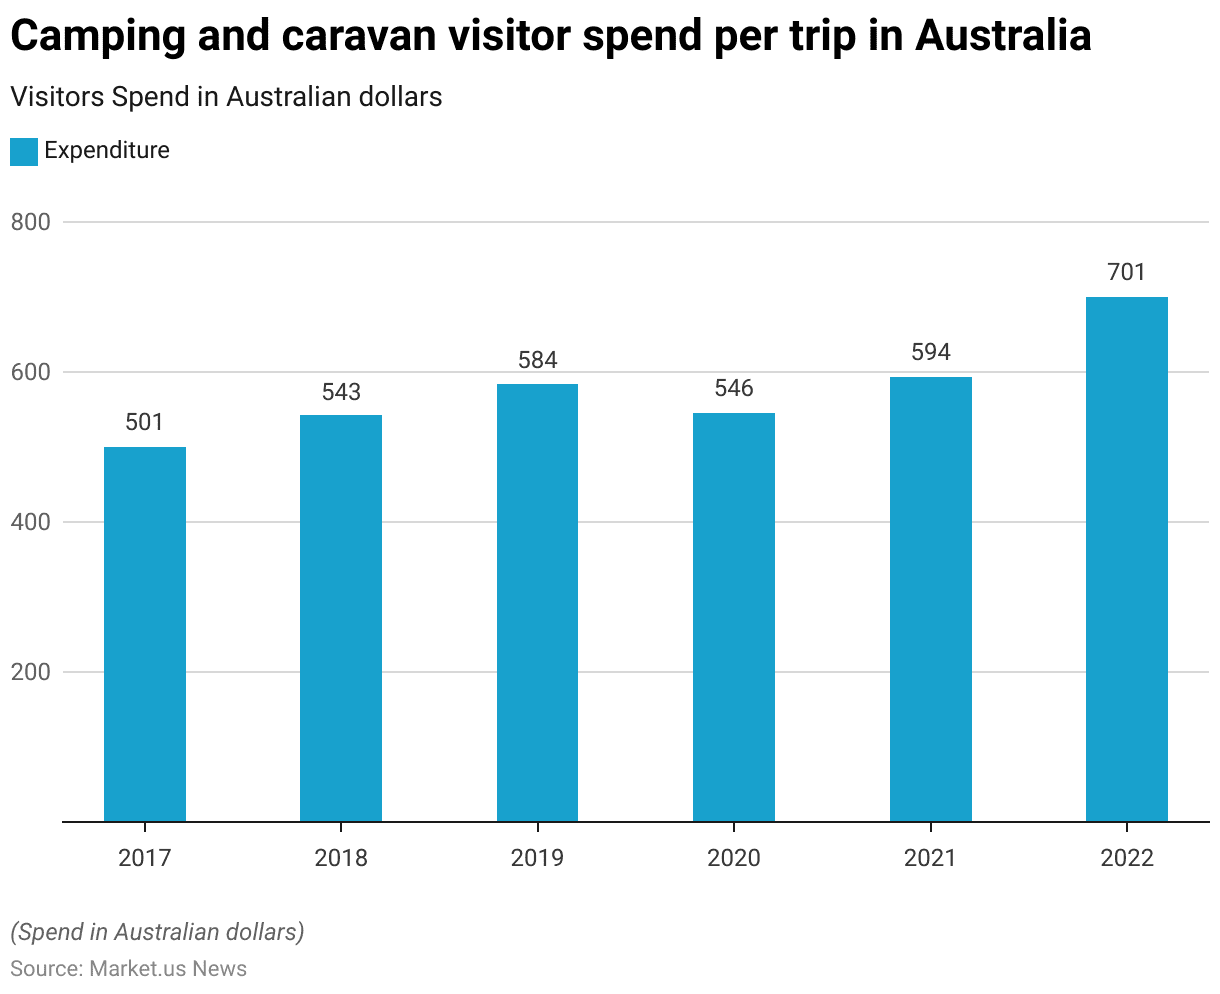
- From 2017 to 2022, visitor spending per trip on camping and caravanning in Australia exhibited a general upward trend with some annual variations.
- In 2017, the expenditure was 501 million Australian dollars, which gradually increased to 543 million in 2018 and further to 584 million in 2019, indicating a growing economic impact from this sector.
- However, there was a slight decrease in 2020, where spending dropped to 546 million, potentially due to disruptions caused by external factors.
- The trend resumed its upward trajectory in 2021 with a rise to 594 million, and by 2022, spending had significantly increased to 701 million Australian dollars.
- This progression underscores the robust recovery and expansion of the camping and caravanning sector in Australia, reflecting increased consumer spending per trip over these years.
(Source: Statista)
Campers Willingness to Spend on a Garden
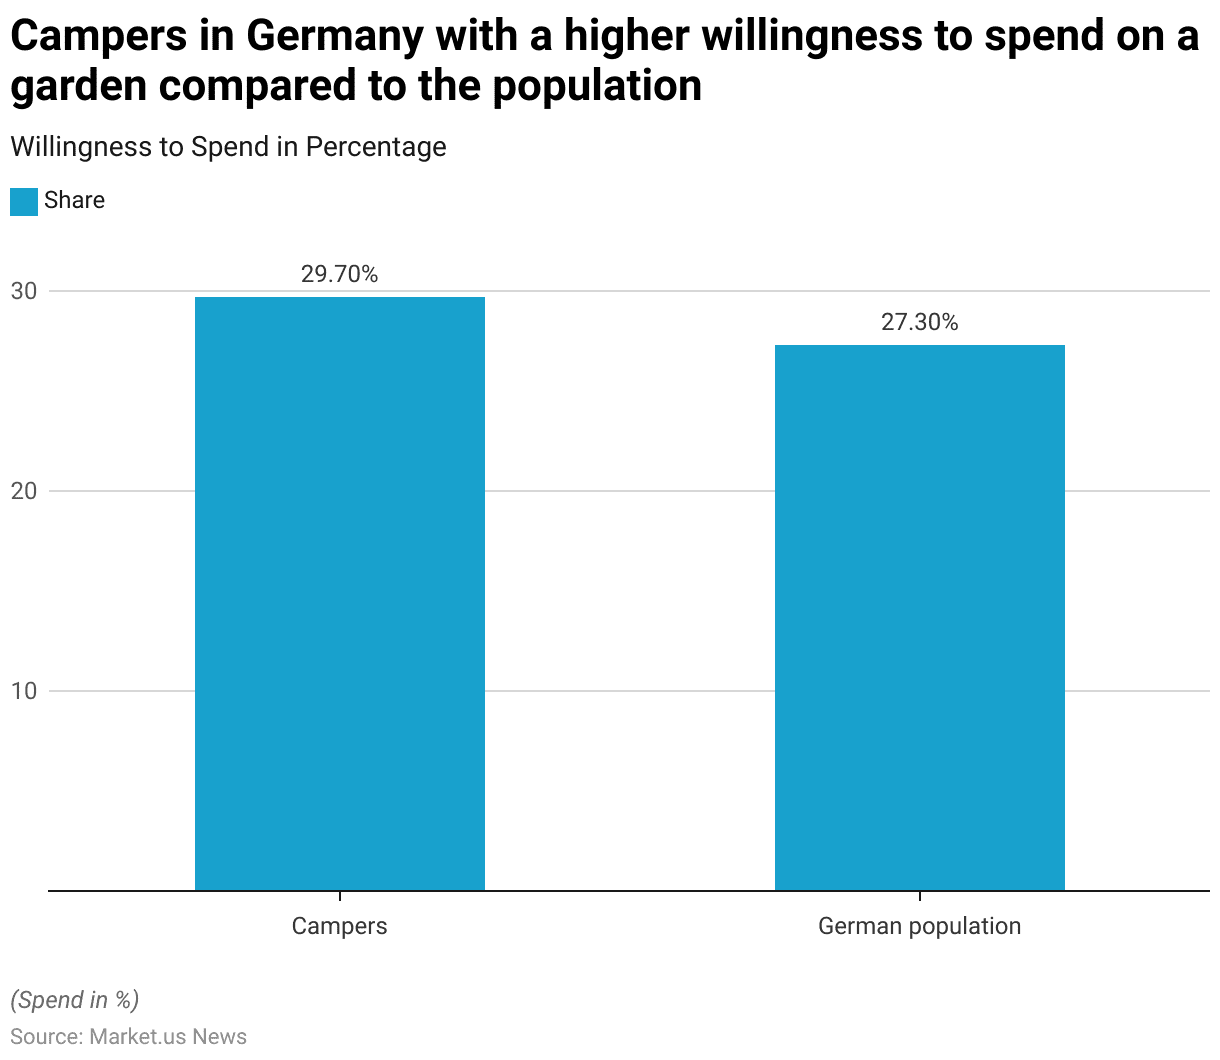
- In 2023, a comparison of spending willingness on gardens among campers and the general German population revealed a slight difference.
- Approximately 29.70% of campers in Germany expressed a higher willingness to spend on their gardens.
- In contrast, a slightly lower percentage of the general German population, 27.30%, showed the same inclination.
- This indicates that campers in Germany are somewhat more likely to invest in their gardens compared to the broader population. Suggesting a potential link between outdoor recreational activities and a greater interest in home gardening.
(Source: Statista)
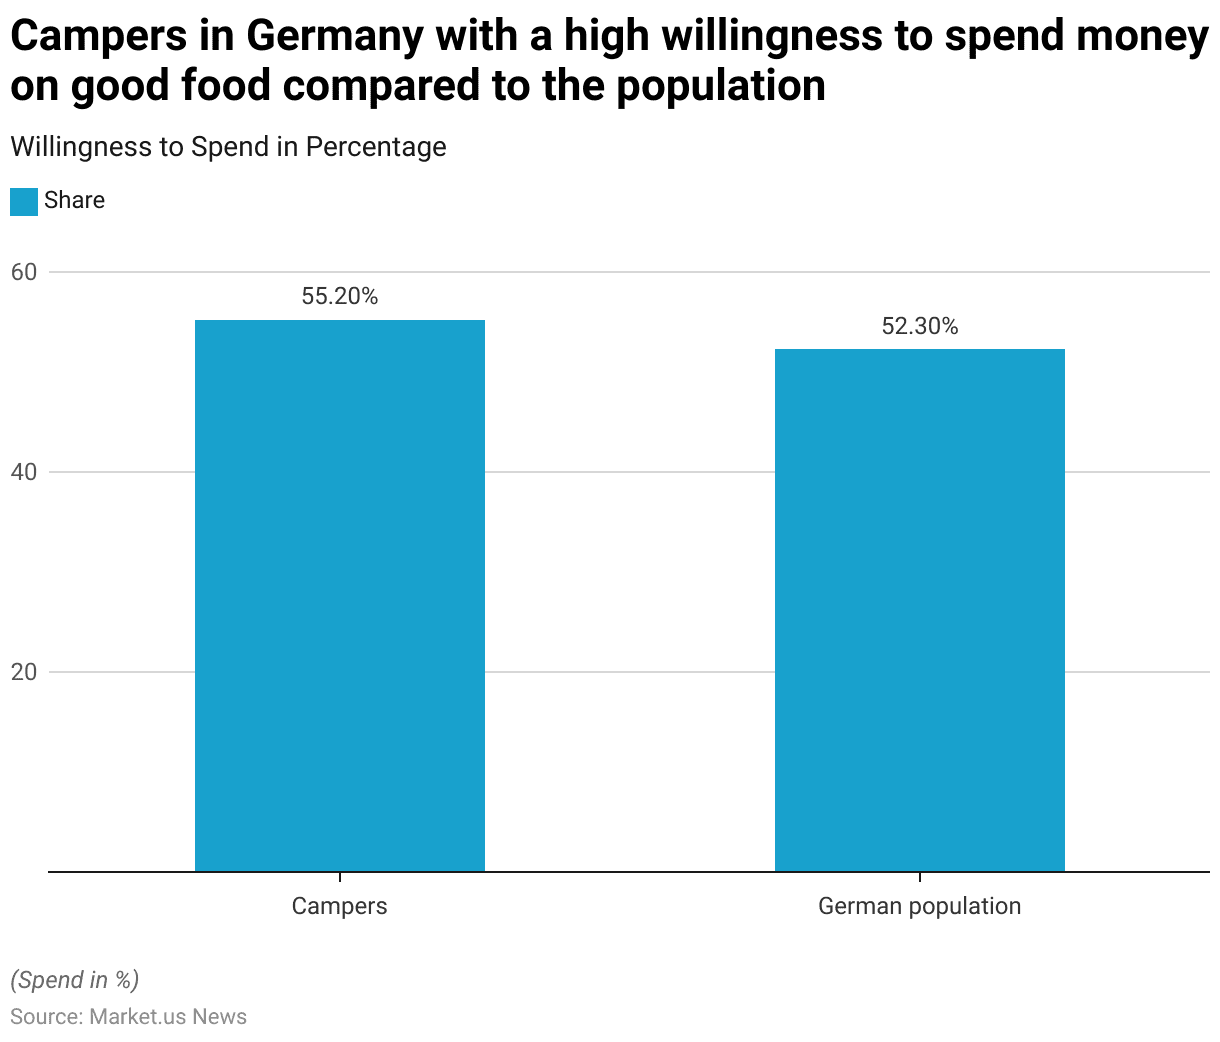
Campers Willingness to Spend Money On Good Food
- In 2023, the propensity to spend money on good food among campers and the general population in Germany was measured, showing a slight preference among campers.
- Specifically, 55.20% of campers reported a high willingness to spend on good food. Compared to 52.30% of the general German population.
- This indicates that individuals who engage in camping are slightly more inclined to invest in quality food. Which could reflect a broader appreciation for the quality of life and leisure activities among the camping community in Germany.
(Source: Statista)
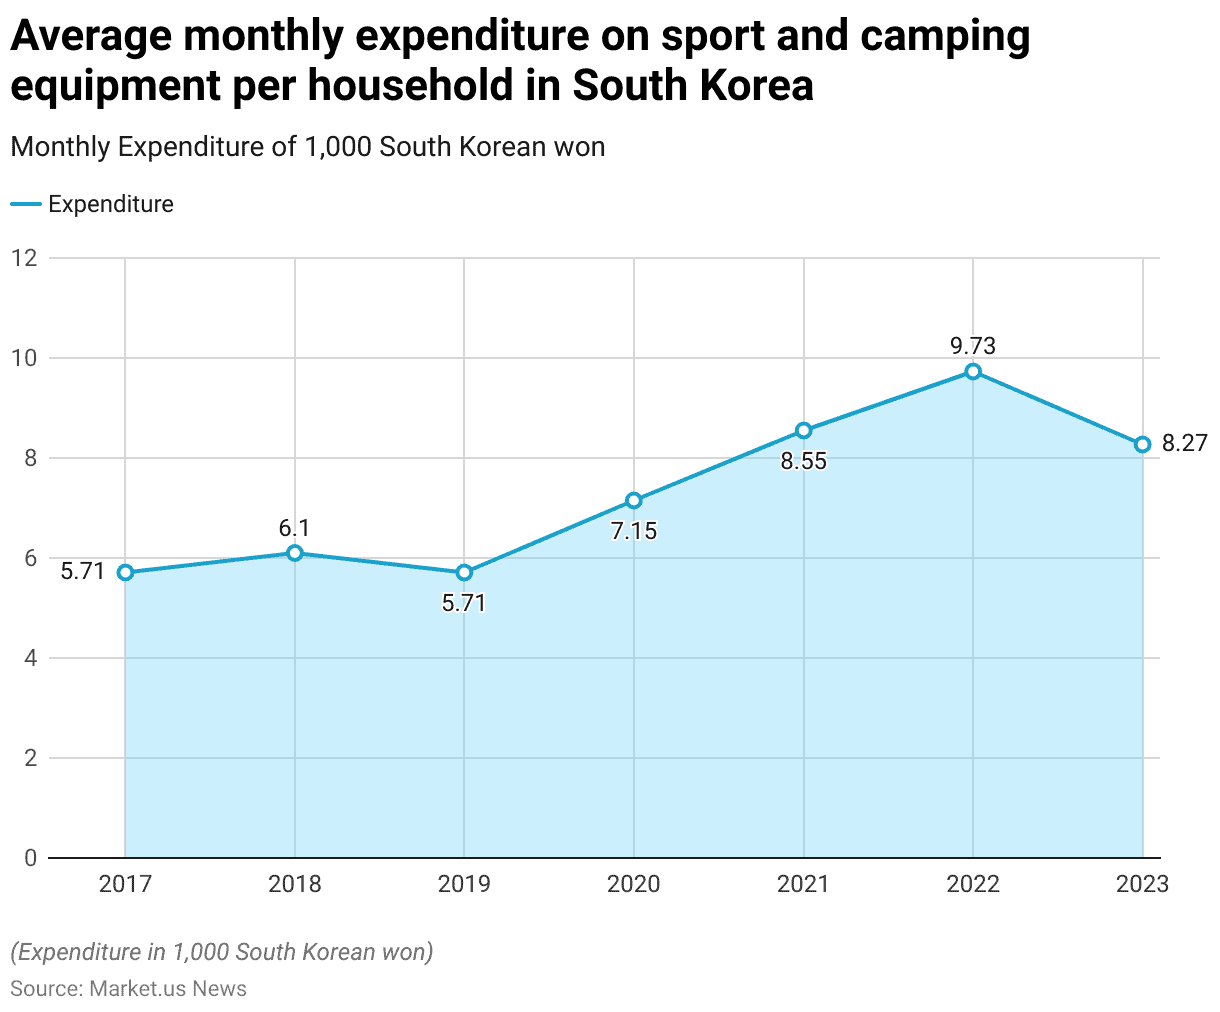
Household Spending On Sports and Camping Equipment
- From 2017 to 2023, the average monthly expenditure per household on sport and camping equipment in South Korea exhibited an overall upward trend with some fluctuations.
- In 2017, households spent an average of 5.71 thousand South Korean won monthly.
- This expenditure increased slightly in 2018 to 6.1 thousand won, then reverted to 5.71 thousand won in 2019.
- A noticeable increase occurred in 2020, with spending rising to 7.15 thousand won.
- The upward trend continued more sharply in 2021, reaching 8.55 thousand won, and peaked in 2022 at 9.73 thousand won.
- However, in 2023, there was a decrease in the average monthly expenditure to 8.27 thousand won.
- This data reflects the varying investment in sports and camping gear by South Korean households over these years. Showing heightened spending during the latter part of the period with a slight decline in the most recent year.
(Source: Statista)
Glamping Regulations
- Glamping regulations vary significantly by country, reflecting local environmental, economic, and social factors.
- In the UK, recent amendments to the Permitted Development Rights (PDR) allow landowners to operate temporary glamping sites for up to 60 days without full planning permission, a change aimed at boosting short-term, low-impact tourism during peak seasons.
- This facilitates easier entry into the glamping market, though restrictions apply in sensitive areas such as Sites of Special Scientific Interest or near scheduled monuments.
- In Scotland, a more stringent approach has been adopted. All short-term lets, including glamping pods, must adhere to comprehensive licensing requirements, ensuring compliance with health, safety, and environmental standards.
- Moreover, this includes mandatory fire risk assessments, displaying valid Energy Performance Certificates, and adherence to local planning regulations.
- Greece, on the other hand, has implemented specific regulations through its Ministry of Tourism, focusing on the qualifications of luxury tent facilities, emphasizing sustainable tourism practices and integration with local cultural offerings.
- These regulatory frameworks reflect a balancing act between fostering tourism and protecting local communities and environments. Each region’s specific requirements, from planning permissions to impact assessments on local wildlife and landscapes, are crucial for anyone considering entering the glamping market to understand thoroughly and adhere to.
- Thus, potential investors and operators must engage with local authorities and possibly join relevant trade associations to navigate these regulations effectively.
(Sources: EuroAsia Journal, Glamping Business, Glamping Hub, EuroAsia Journal, Yala Canvas Lodges, Championing the power of planning)
Recent Developments
Acquisitions and Mergers:
- Hipcamp acquires Youcamp: In 2023, Hipcamp, a leading online platform for camping and glamping bookings, acquired Youcamp, an Australian outdoor accommodation platform, for $55 million. This acquisition helped Hipcamp expand its glamping options in Australia, making it a global leader in unique outdoor stays.
- Collective Retreats merges with Tentrr: In early 2024, Collective Retreats, a luxury glamping company, merged with Tentrr, an online marketplace for camping and glamping. The merger, valued at $75 million, is aimed at expanding both companies’ luxury outdoor offerings, especially in North America.
New Product Launches:
- Under Canvas launches new safari tent model: In mid-2023, Under Canvas, a luxury glamping company, introduced its Safari Tent 2.0, featuring upgraded sustainable materials, solar-powered lighting, and enhanced insulation for year-round use. This new tent model is part of Under Canvas’ plan to expand into colder regions and offer year-round glamping experiences.
- AutoCamp introduces Airstream Glamping Suites: In early 2024, AutoCamp, a leading glamping site operator, unveiled its Airstream Glamping Suites, combining modern amenities with retro design. These suites include full kitchens, luxurious bathrooms, and outdoor fire pits, targeting travelers looking for a blend of adventure and comfort.
Funding:
- Glampitect secures $20 million for glamping site development: In 2023, Glampitect, a company specializing in designing and developing glamping sites, raised $20 million in a Series B funding round. The funding will be used to expand its glamping site consulting and development services across Europe and North America.
- Getaway raises $50 million to expand tiny cabin experiences: In late 2023, Getaway, a company offering tiny cabin stays in nature, raised $50 million to scale its operations and build more glamping locations near major U.S. cities. The investment will focus on providing secluded, luxury outdoor experiences close to urban centers.
Technological Advancements:
- Sustainable energy solutions in glamping: By 2025, 30% of new glamping sites are expected to integrate solar panels, composting systems, and eco-friendly construction materials to align with the rising demand for sustainable tourism.
- Smart technology in glamping accommodations: As the industry evolves, smart technology such as app-based check-ins, temperature control, and AI-powered customer service is expected to be integrated into 25% of glamping sites by 2026 to improve guest experiences.
Conclusion
Glamping Statistics: Glamping, or “glamorous camping,” merges the allure of traditional camping with the comforts of a hotel. Appealing to those seeking a unique travel experience that connects them with nature without sacrificing luxury.
Further, this trend has grown rapidly, attracting a diverse demographic from millennials in search of picturesque settings to older individuals desiring comfort without the hassle.
Glamping not only enhances local economies through tourism but also emphasizes sustainable, eco-friendly practices.
Finally, as it continues to evolve, glamping is becoming a more influential part of the tourism industry, offering a promising blend of nature and luxury that caters to evolving consumer preferences for unique and comfortable travel experiences.
FAQs
Glamping, or glamorous camping, combines the traditional experience of camping with the luxury and amenities of a hotel. It allows campers to enjoy the beauty of the outdoors without sacrificing comfort.
Unlike traditional camping, which involves pitching a tent and previous most modern conveniences, glamping provides a pre-set-up accommodation that could range from a canvas tent to a treehouse, all equipped with modern amenities.
Many glamping sites focus on sustainability, using eco-friendly materials and practices such as solar power, composting toilets, and recycling services to minimize the environmental impact.
Accommodations can vary widely, including yurts, teepees, treehouses, cabins, and luxury tents. Each offers a unique experience, often integrated creatively into local landscapes.
Costs can vary significantly based on location, type of accommodation, and included amenities. Some sites offer a budget-friendly experience, while others can be quite luxurious and expensive.


