Table of Contents
- Introduction
- Editor’s Choice
- Global Golf Ball Market Overview
- Golf Ball Specifications Statistics
- Golf Players Statistics
- Golf Ball Companies Statistics
- Golf Ball Export Statistics
- Golf Ball Import Statistics
- Golf Ball Sales Compared to Other Golf Accessories
- Key Spending/Investments
- Regulations for Golf Balls
- Recent Developments
- Conclusion
- FAQs
Introduction
Golf Ball Statistics: Golf balls are essential in golf, designed with a core for initial velocity and a cover for feel and durability.
Cores are typically synthetic rubber or resin, influencing distance, while covers, commonly Surlyn or urethane, affect spin and control.
Dimples on the surface minimize drag and enhance flight stability. Golf balls come in two main types: two-piece for distance and durability and multi-layer for enhanced spin and feel.
Regulations by bodies like the USGA ensure fairness. Choosing a ball depends on skill level and course conditions. With beginners favoring distance and durability and advanced players valuing spin and feel.
Editor’s Choice
- The global golf ball market revenue is projected to reach USD 1.357 billion by 2032.
- The global golf ball market is dominated by several key players. Callaway Golf Co. leading the market with a 21% share.
- As of the latest data, leisure applications dominate the market, accounting for 65% of the total market share. This reflects the widespread popularity of golf as a recreational activity among amateur and casual players.
- The global golf ball market is geographically segmented, with North America holding the largest market share at 35.0%.
- In 2022, the global golf ball export market was led by Chinese Taipei, which exported golf balls valued at USD 295 million, accounting for 31.3% of the total export share.
- In 2022, the United States dominated the global golf ball import market with a total import value of USD 350 million, accounting for 37.1% of the market share.
- Golf ball regulations are primarily governed by the United States Golf Association (USGA) and the Royal and Ancient Golf Club of St Andrews (R&A), ensuring consistency and fairness in the sport globally.
Global Golf Ball Market Overview
Global Golf Ball Market Size Statistics
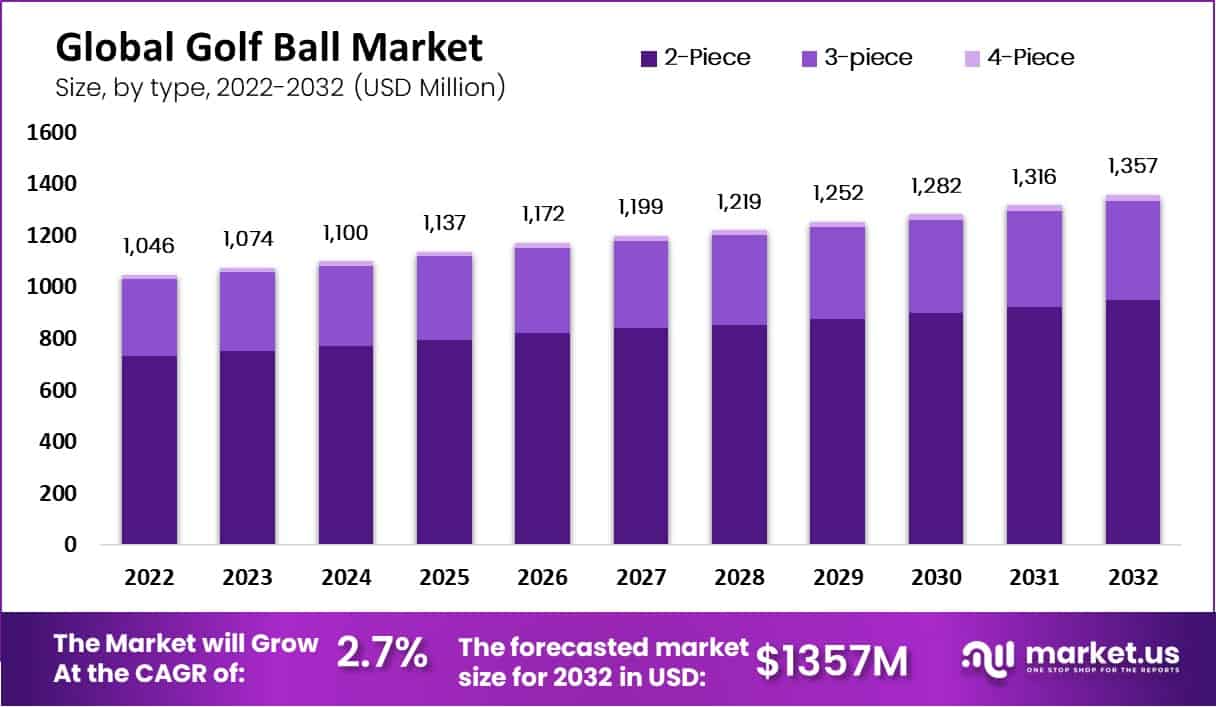
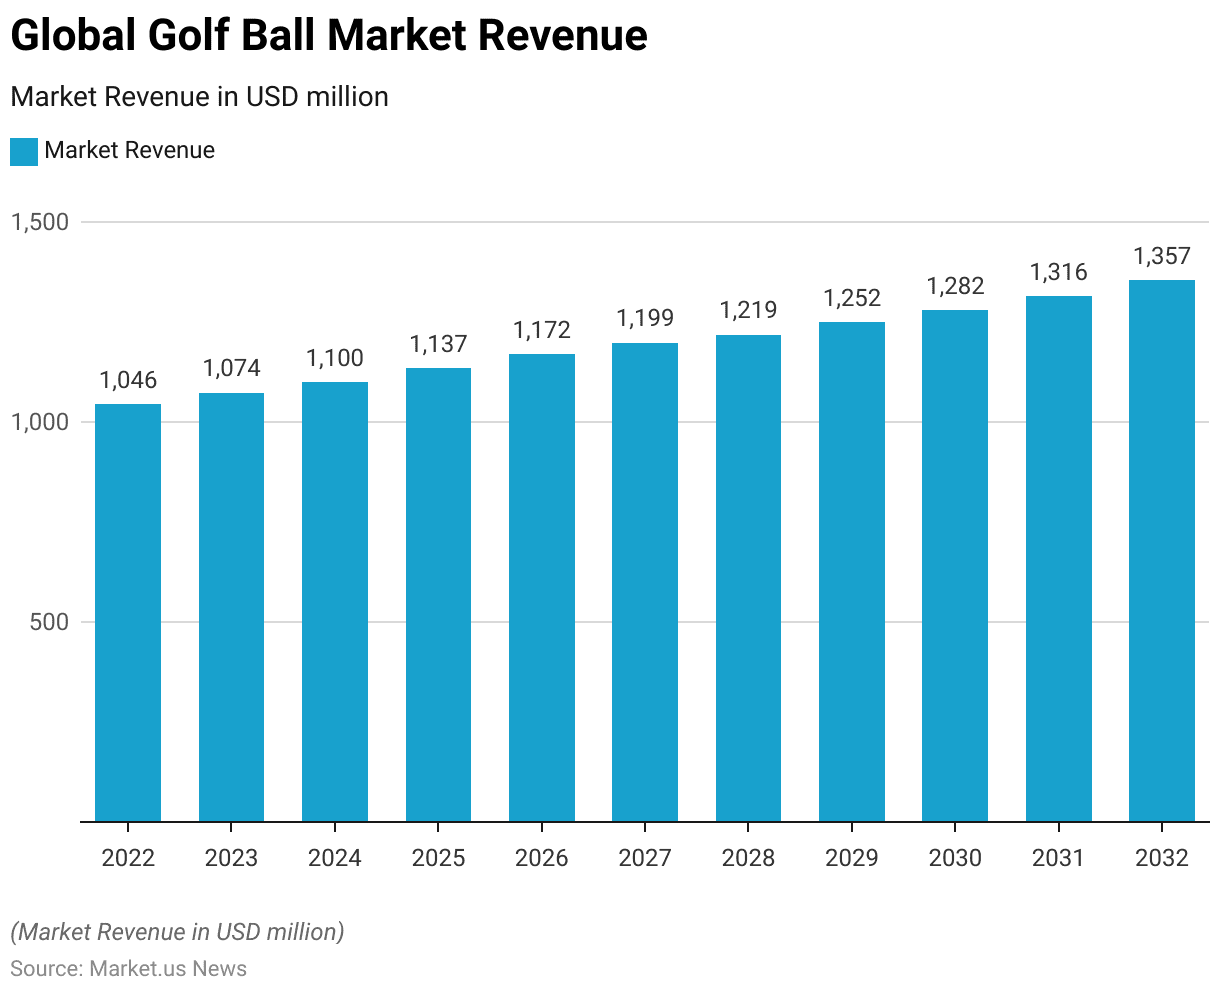
- The global golf ball market has exhibited steady growth in recent years at a CAGR of 2.70%, with revenue reaching USD 1.046 billion in 2022.
- This upward trend is projected to continue, with the market expected to generate USD 1.074 billion in 2023 and further increase to USD 1.100 billion in 2024.
- By 2025, revenue is anticipated to reach USD 1.137 billion, followed by USD 1.172 billion in 2026.
- The market is forecasted to maintain this growth trajectory. With revenues rising to USD 1.199 billion in 2027, USD 1.219 billion in 2028, and USD 1.252 billion in 2029.
- Projections for 2030 indicate revenues of USD 1.282 billion, escalating to USD 1.316 billion by 2031.
- By 2032, the global golf ball market is expected to achieve a significant milestone with revenues of USD 1.357 billion.
- This consistent growth reflects a positive outlook for the market over the next decade.
(Source: market.us)
Competitive Landscape of the Global Golf Ball Market Statistics
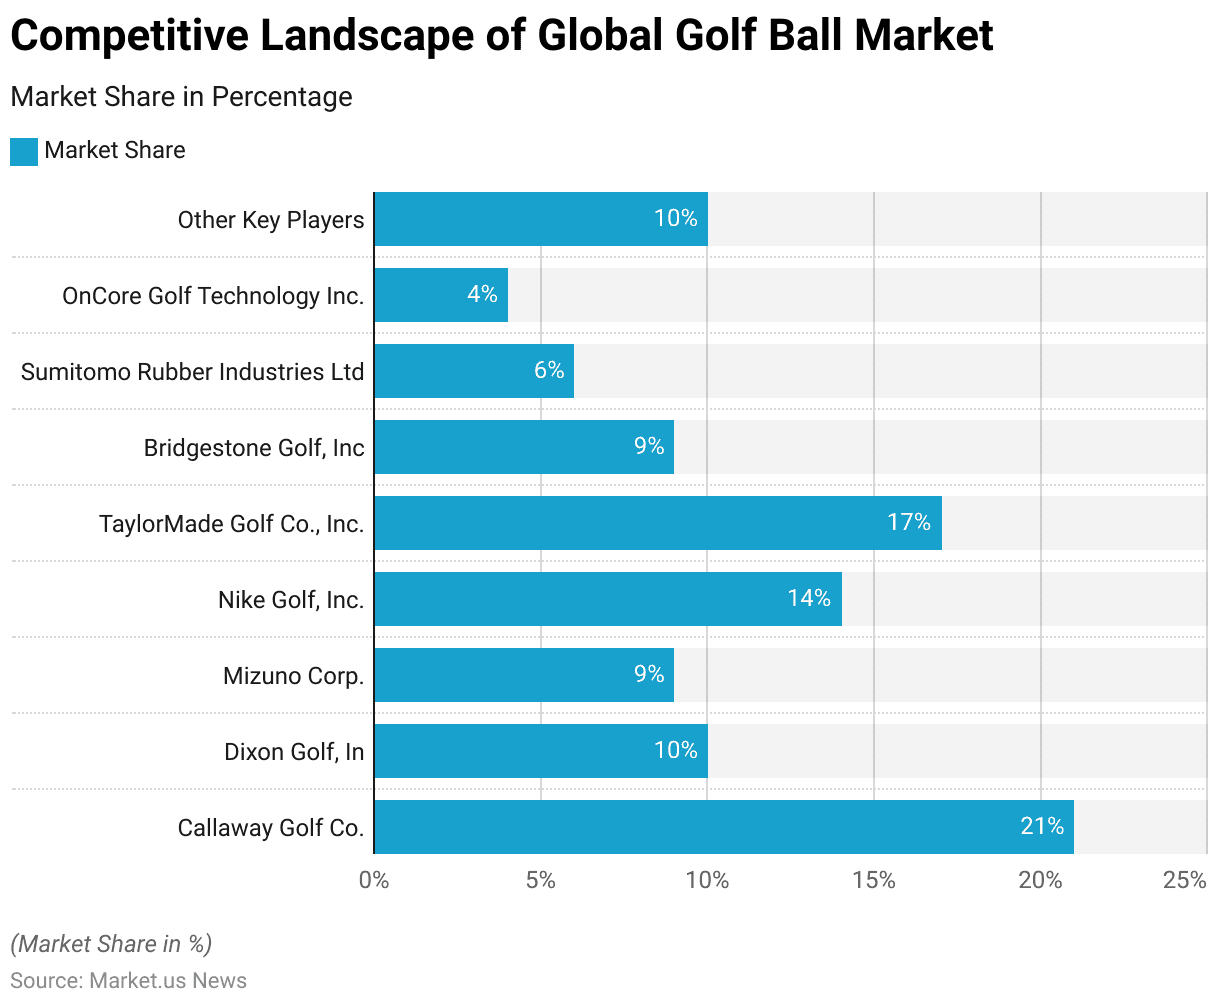
- The global golf ball market is dominated by several key players. Callaway Golf Co. leading the market with a 21% share.
- Nike Golf, Inc. holds a significant portion as well, accounting for 14% of the market.
- TaylorMade Golf Co., Inc. follows closely with a 17% market share.
- Dixon Golf, Inc. and Mizuno. At the same time, each captures 10% and 9% of the market, respectively, while Bridgestone Golf, Inc. also holds a 9% share.
- Sumitomo Rubber Industries Ltd commands 6% of the market, and OnCore Golf Technology Inc. possesses a 4% share.
- The remaining 10% of the market is distributed among other key players. This competitive landscape highlights the significant presence and influence of these companies within the industry.
(Source: market.us)
Global Golf Ball Market Share – By Application Statistics
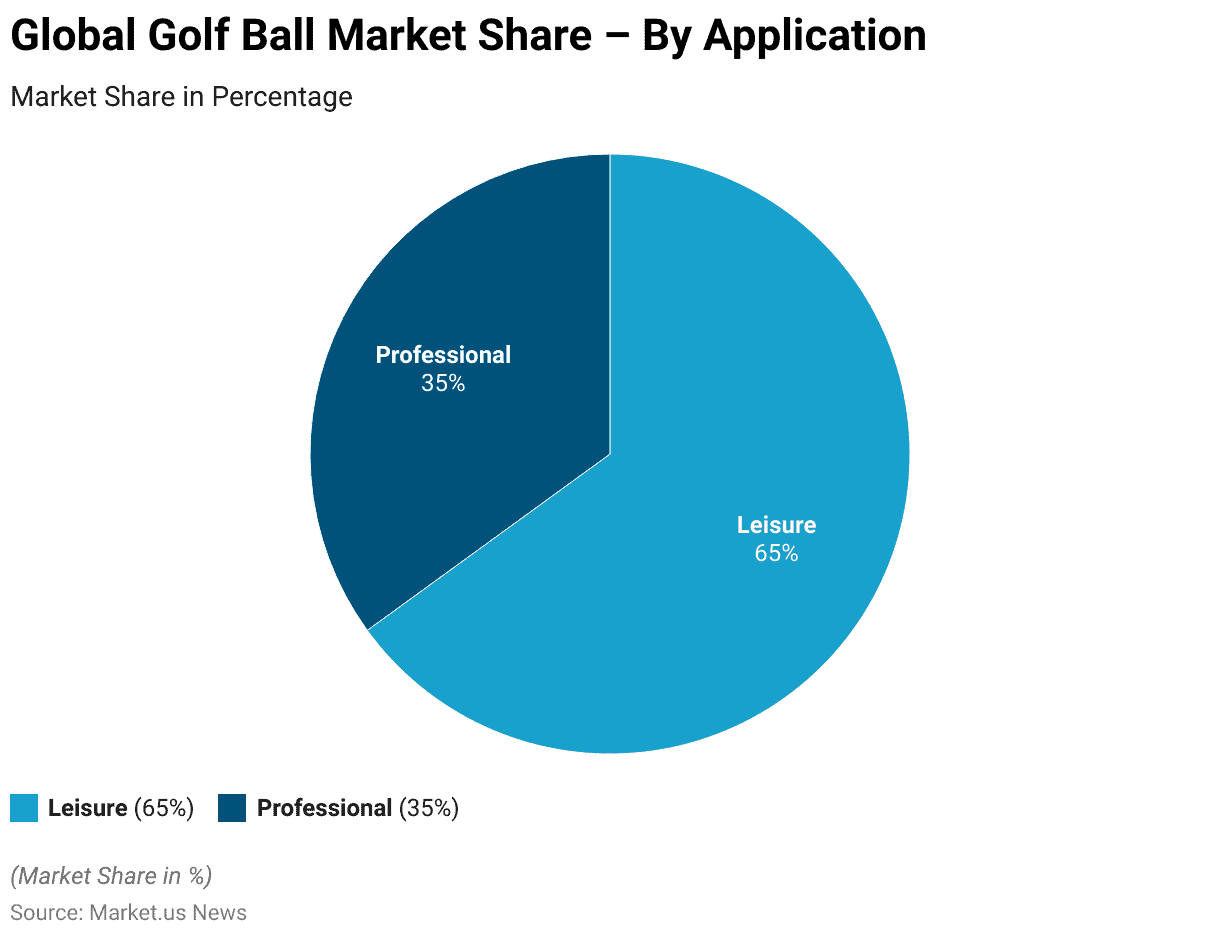
- In the global golf ball market, the application of golf balls is primarily divided between leisure and professional use.
- As of the latest data, leisure applications dominate the market, accounting for 65% of the total market share. This reflects the widespread popularity of golf as a recreational activity among amateur and casual players.
- In contrast, the professional segment holds a 35% market share, highlighting the demand from professional golfers and competitive events.
- This distribution underscores the significant influence of the leisure market in driving the overall demand for golf balls.
- At the same time, the professional segment continues to contribute substantially due to the requirements of high-performance equipment in competitive sports.
(Source: market.us)
Regional Analysis of the Global Golf Ball Market Statistics
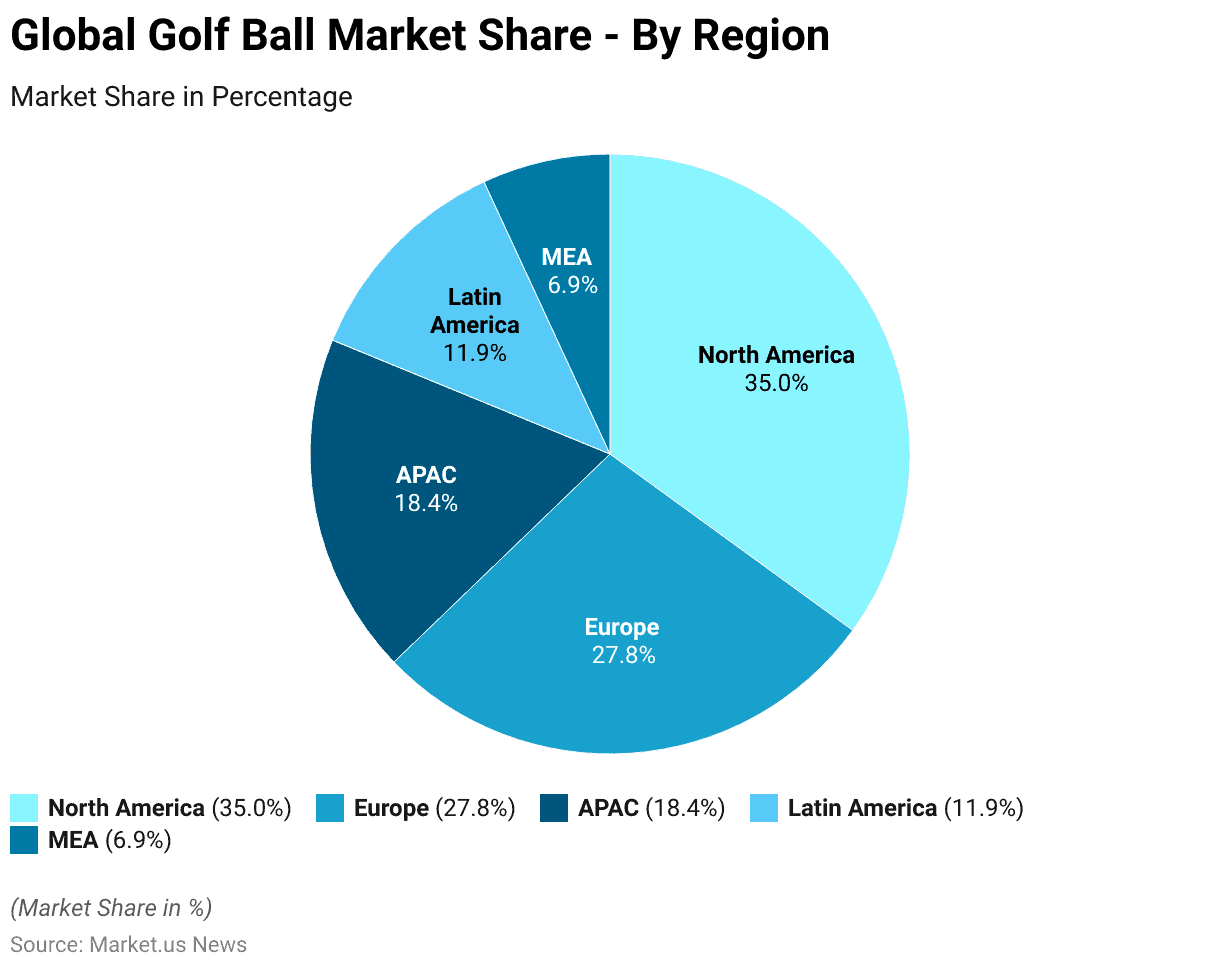
- The global golf ball market is geographically segmented, with North America holding the largest market share at 35.0%.
- Europe follows with a substantial 27.8% share, indicating a strong presence in this region as well.
- The Asia-Pacific (APAC) region accounts for 18.4% of the market, reflecting its growing importance in the industry.
- Latin America holds an 11.9% share, while the Middle East and Africa (MEA) region accounts for 6.9% of the market.
- This regional distribution underscores the diverse and widespread demand for golf balls across different parts of the world.
(Source: market.us)
Golf Ball Specifications Statistics
- Golf balls are crafted to meet specific performance criteria, and their specifications include various parameters that influence their playability.
- Typically, a standard golf ball has a diameter of 1.68 inches (42.67 mm) and a maximum weight of 1.62 ounces (45.93 grams) as per the Rules of Golf. The core of the ball, which can be made of materials like rubber or synthetic polymers, is designed to optimize energy transfer and affect compression and distance.
- Golf balls can be two-piece, three-piece, or even more complex in structure. With multiple layers aimed at improving distance, spin, and control.
- The cover of the ball is often made from materials like urethane or surlyn. Features a dimple pattern that affects aerodynamics, influencing the ball’s flight path and stability.
- For instance, the Titleist Pro V1, a popular model, has a three-piece construction with a urethane elastomer cover and 388 dimples designed for a lower trajectory and a softer feel.
- In contrast, the Callaway ERC Soft incorporates a hybrid cover and a high-speed mantle layer to maximize energy transfer and greenside control.
- These detailed specifications ensure that each golf ball model caters to different playing styles and preferences Providing options for players seeking specific attributes like distance, spin, or feel.
- The diversity in design and materials used in golf balls underscores the importance of choosing the right ball to match individual performance needs on the course.
(Sources: Golf.com, My Golf Spy, Today’s Golfer)
Golf Players Statistics
Number of Golfers – By Country
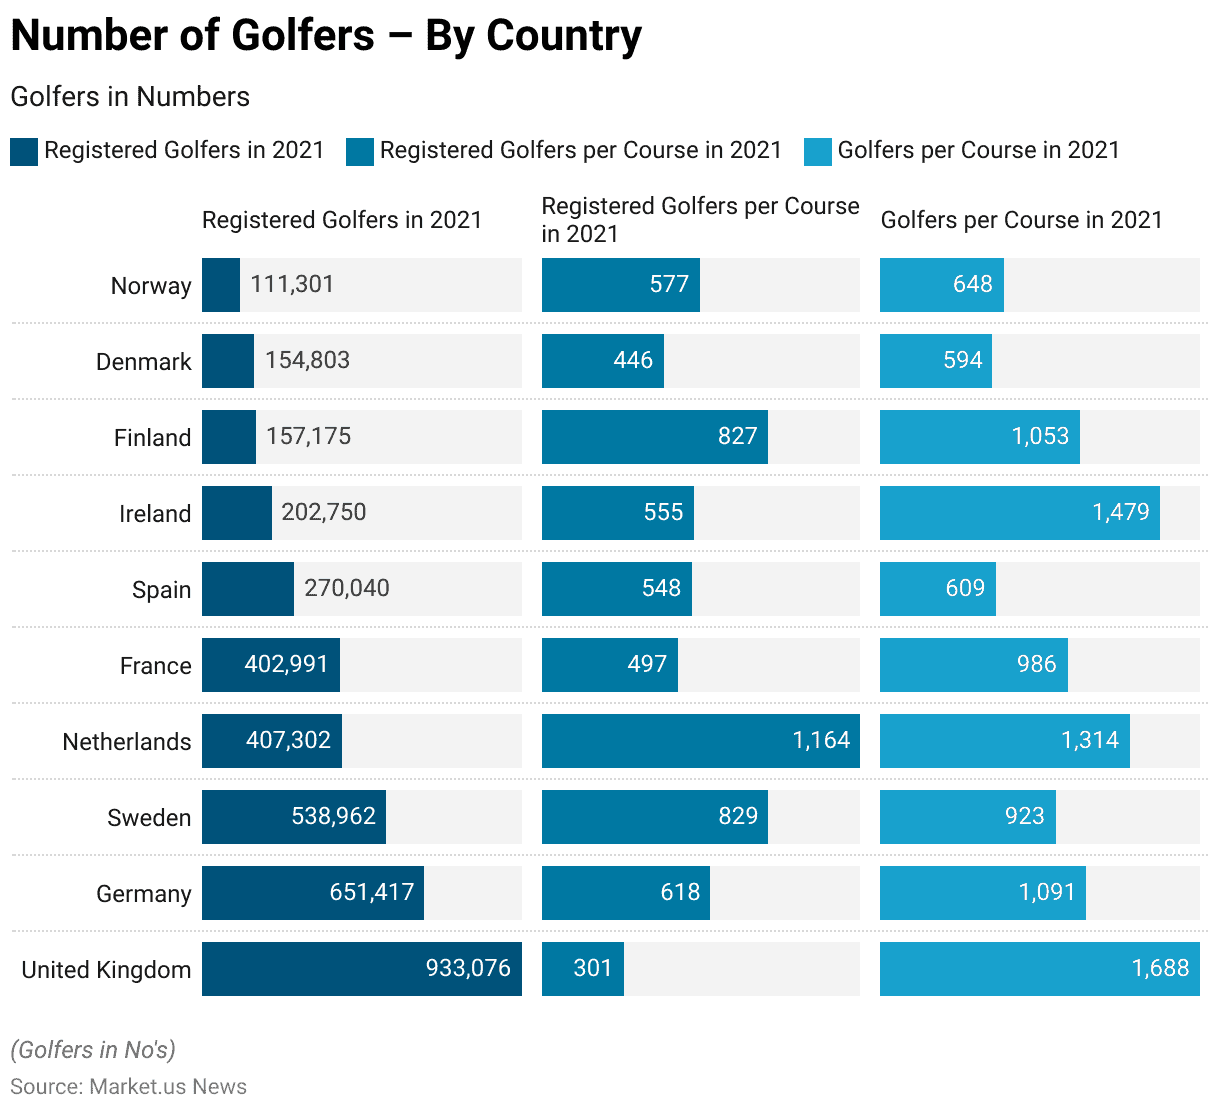
- In 2021, the number of registered golfers across various European countries highlighted the sport’s popularity and its distribution per golf course.
- The United Kingdom led with 933,076 registered golfers, averaging 301 registered golfers and 1,688 total golfers per course. Germany followed with 651,417 registered golfers, showing a higher density of 618 registered golfers and 1,091 total golfers per course.
- Sweden had 538,962 registered golfers, with 829 registered golfers and 923 total golfers per course. In the Netherlands, there were 407,302 registered golfers. With the highest density of 1,164 registered golfers and 1,314 total golfers per course.
- France recorded 402,991 registered golfers, averaging 497 registered golfers and 986 total golfers per course. Spain had 270,040 registered golfers, with 548 registered golfers and 609 total golfers per course.
- Ireland’s 202,750 registered golfers averaged 555 registered golfers and 1,479 total golfers per course. Finland reported 157,175 registered golfers, with 827 registered golfers and 1,053 total golfers per course.
- Denmark had 154,803 registered golfers, averaging 446 registered golfers and 594 total golfers per course. Lastly, Norway recorded 111,301 registered golfers, with 577 registered golfers and 648 total golfers per course.
- This data illustrates the varying levels of golf participation and course utilization across these countries.
(Source: World Population Review)
Golf Ball Companies Statistics
Revenue of Selected Golf Equipment/Apparel Companies Worldwide
Acushnet
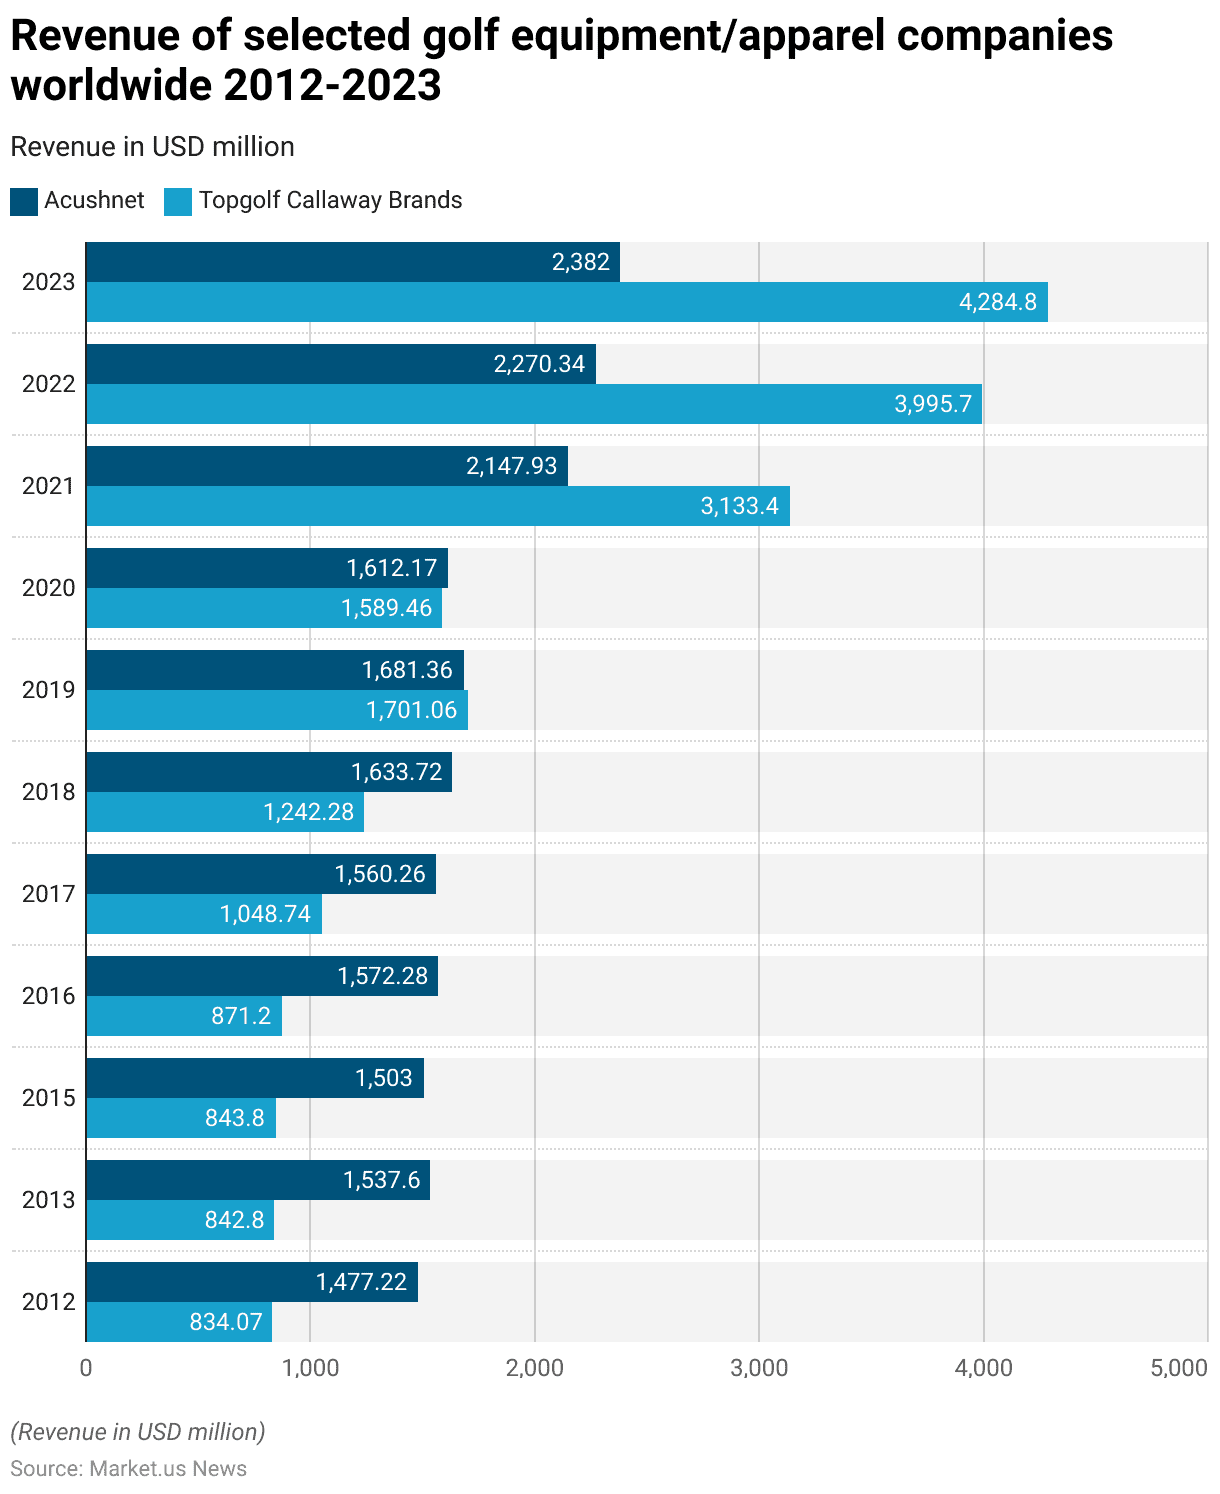
- From 2012 to 2023, Acushnet has demonstrated significant revenue growth in the golf equipment and apparel market.
- In 2012, Acushnet reported revenues of USD 1,477.22 million, while Topgolf Callaway Brands generated USD 834.07 million.
- Over the following years, Acushnet’s revenue saw a steady increase. Reaching USD 1,537.60 in 2013, USD 1,503.00 million in 2015, and USD 1,572.28 million in 2016.
- By 2017, Acushnet’s revenue slightly dipped to USD 1,560.26 million but recovered in 2018 to USD 1,633.72 million.
- The company continued its upward trajectory with revenues of USD 1,681.36 million in 2019 and USD 1,612.17 million in 2020 before surging to USD 2,147.93 million in 2021, USD 2,270.34 million in 2022, and reaching USD 2,382.00 million in 2023.
(Source: Statista)
Topgolf Callaway Brands
- Topgolf Callaway Brands also experienced notable growth. With revenues of USD 842.80 million in 2013, increasing to USD 843.80 million in 2015 and USD 871.20 million in 2016.
- A significant jump occurred in 2017, with revenues rising to USD 1,048.74 million, followed by USD 1,242.28 million in 2018.
- The most substantial growth was observed in 2019, with revenues soaring to USD 1,701.06 million. Though they slightly decreased to USD 1,589.46 million in 2020.
- The following years saw remarkable growth, with revenues skyrocketing to USD 3,133.40 million in 2021, USD 3,995.70 million in 2022, and an impressive USD 4,284.80 million in 2023.
- This data highlights the robust expansion and market presence of both Acushnet and Topgolf Callaway Brands over the past decade.
(Source: Statista)
Golf Course Management Companies
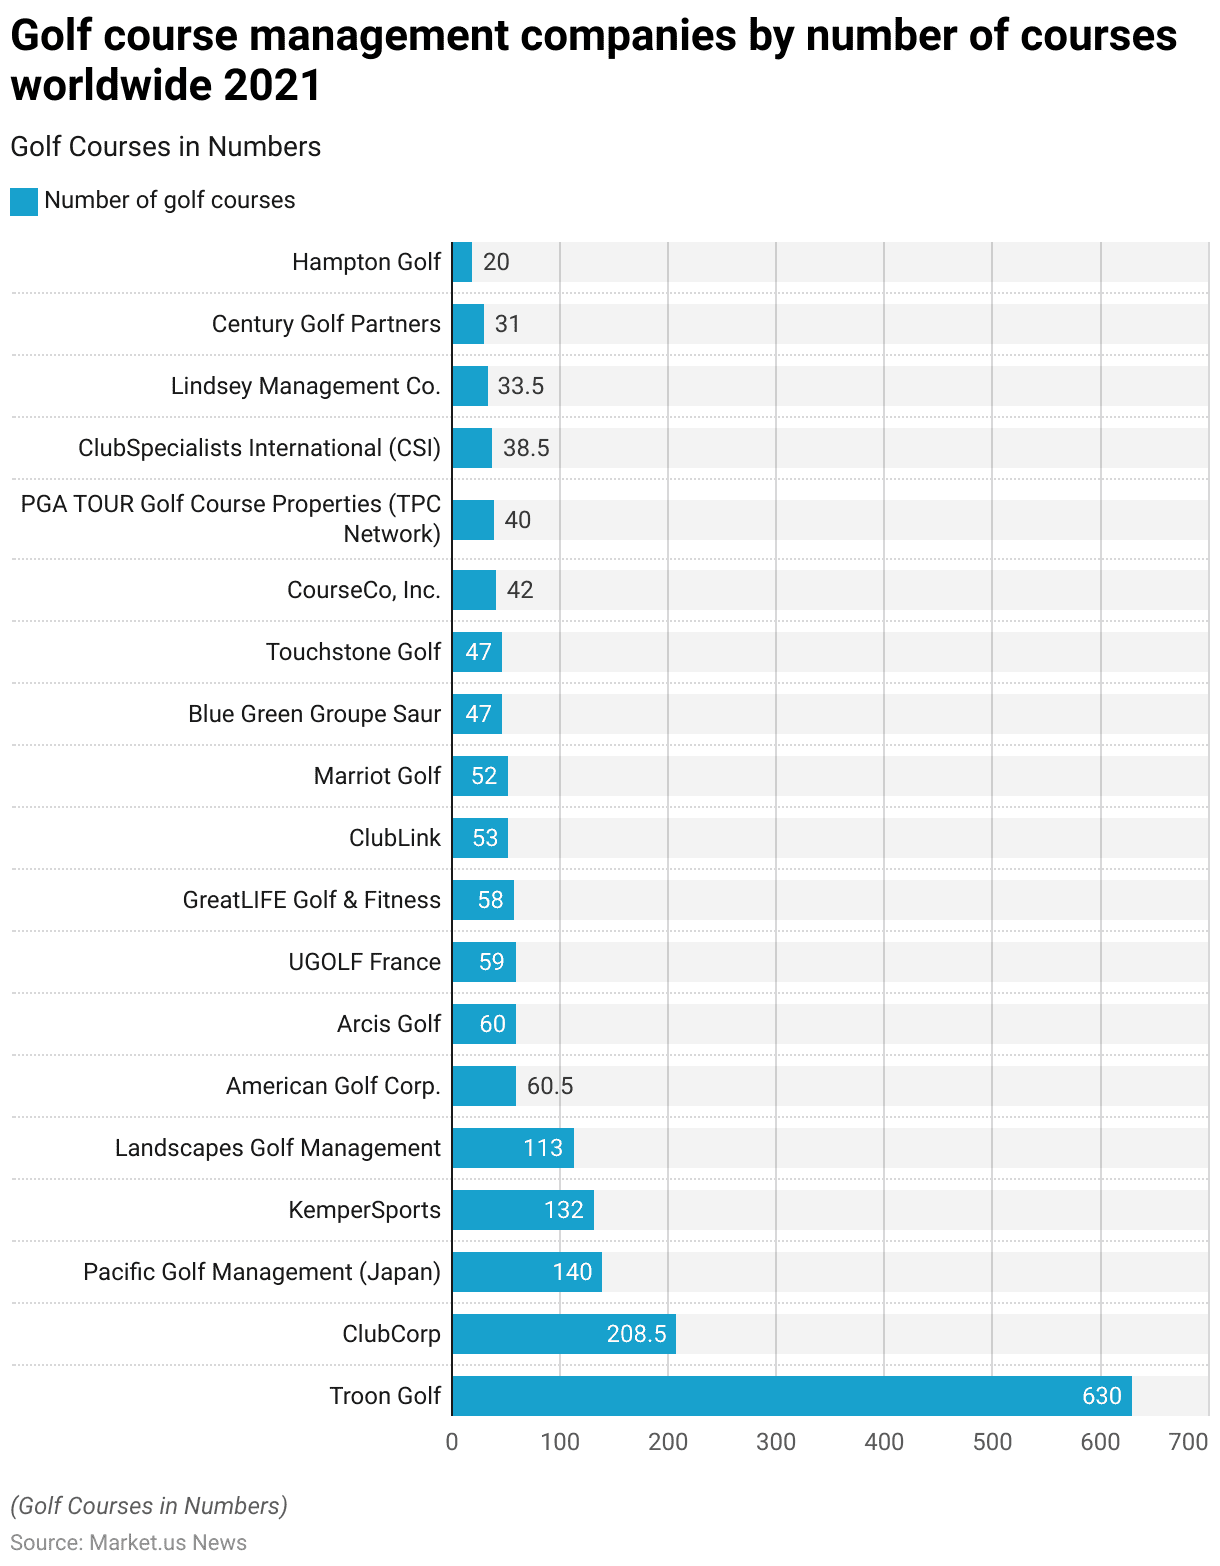
- In 2021, several golf course management companies operated a significant number of golf courses worldwide.
- Troon Golf led the market with an impressive portfolio of 630 golf courses. ClubCorp followed with 208.5 courses under its management.
- Pacific Golf Management in Japan managed 140 courses, while KemperSports oversaw 132 courses.
- Landscapes Golf Management was responsible for 113 courses, and American Golf Corp. managed 60.5 courses.
- Sixty courses closely follow Arcis Golf, and UGOLF France manages 59 courses. GreatLIFE Golf & Fitness operated 58 courses, while ClubLink managed 53 courses.
- Marriot Golf was responsible for 52 courses, and Blue Green Groupe Saur managed 47 courses. The same number as Touchstone Golf.
- CourseCo, Inc. managed 42 courses, and the PGA TOUR Golf Course Properties (TPC Network) oversaw 40 courses.
- ClubSpecialists International (CSI) managed 38.5 courses, while Lindsey Management Co. was responsible for 33.5 courses.
- Century Golf Partners managed 31 courses, and Hampton Golf operated 20 courses. This distribution highlights the extensive reach and influence of these companies within the global golf course management industry.
(Source: Statista)
Golf Ball Export Statistics
Top Golf Ball Exporting Nations Statistics
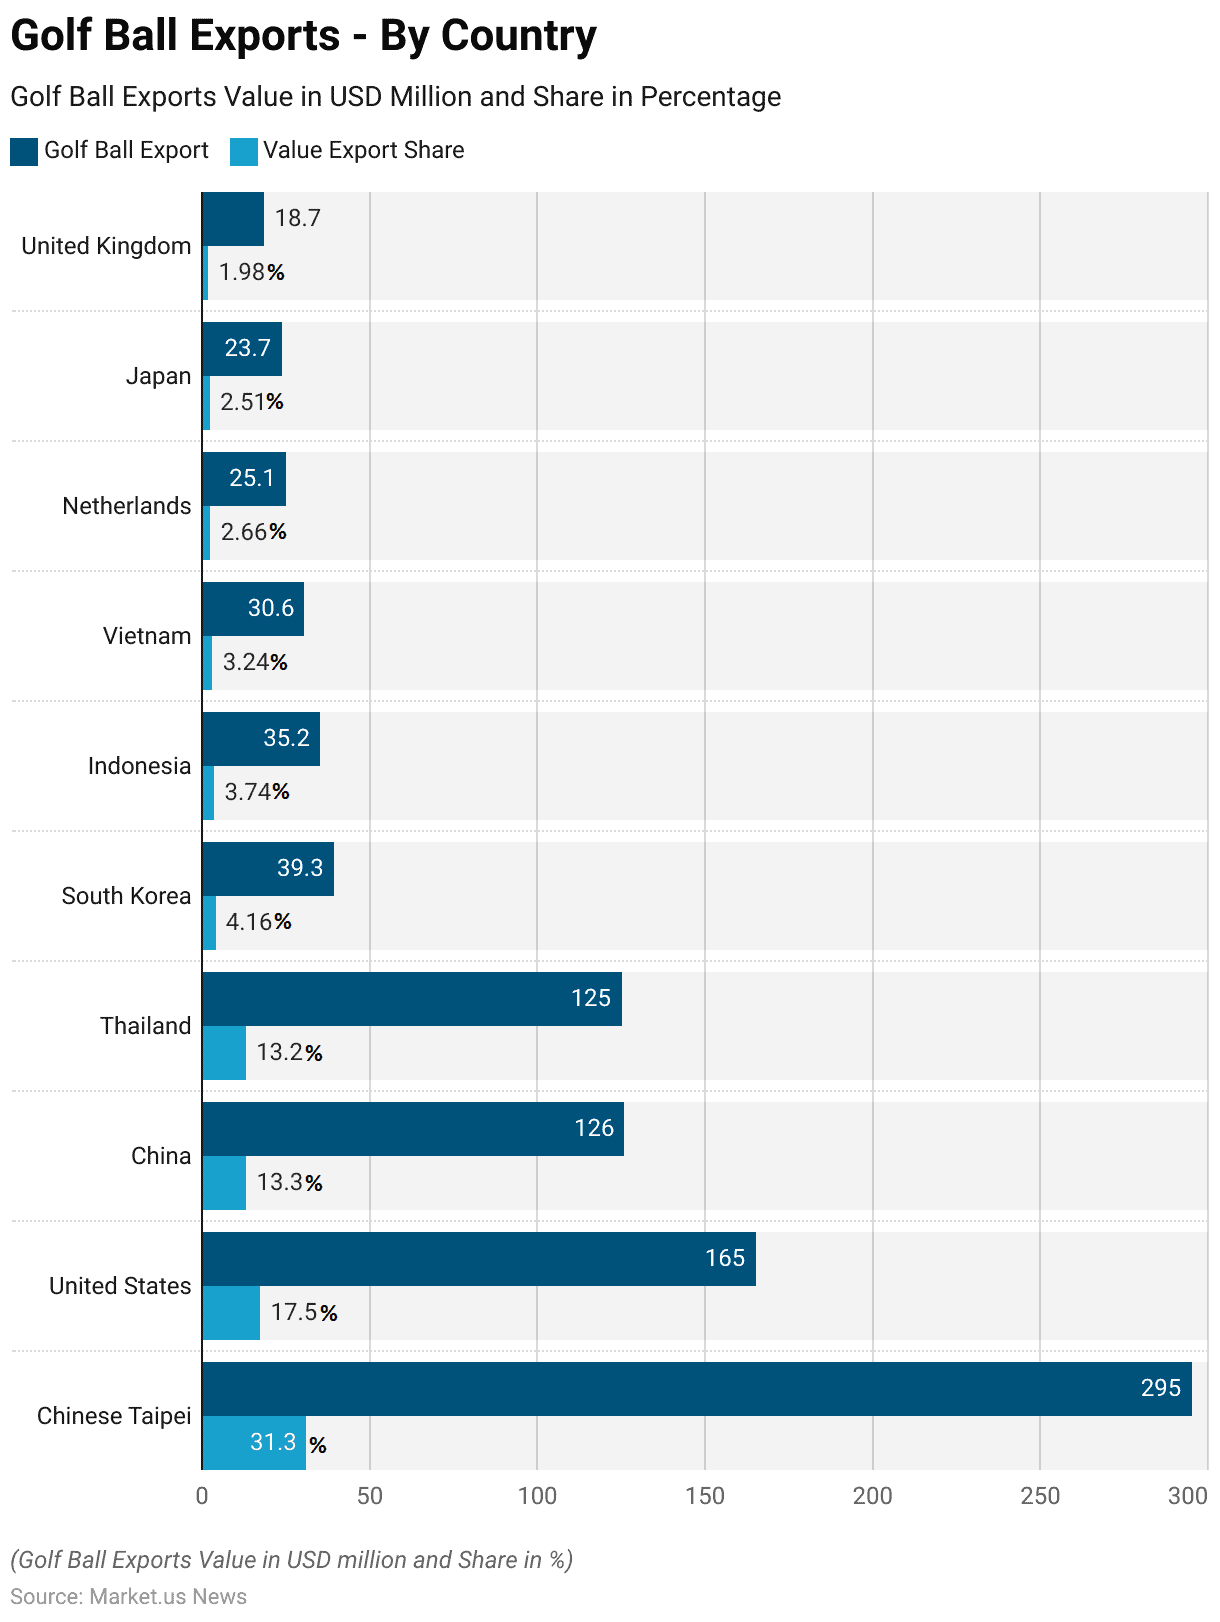
- In 2022, the global golf ball export market was led by Chinese Taipei. Which exported golf balls valued at USD 295 million, accounting for 31.3% of the total export share.
- The United States followed with exports worth USD 165 million, representing 17.5% of the market share.
- China and Thailand both made significant contributions. With export values of USD 126 million (13.3%) and USD 125 million (13.2%), respectively.
- South Korea exported golf balls worth USD 39.3 million, capturing 4.16% of the market share. While Indonesia’s exports totaled USD 35.2 million, or 3.74%.
- Vietnam exported USD 30.6 million worth of golf balls, constituting 3.24% of the market share.
- The Netherlands, Japan, and the United Kingdom also played notable roles. With export values of USD 25.1 million (2.66%), USD 23.7 million (2.51%), and USD 18.7 million (1.98%), respectively.
- This data highlights the significant contributions of these countries to the global golf ball export market.
(Source: OEC World)
Golf Ball Import Statistics
Top Golf Ball Importing Nations Statistics
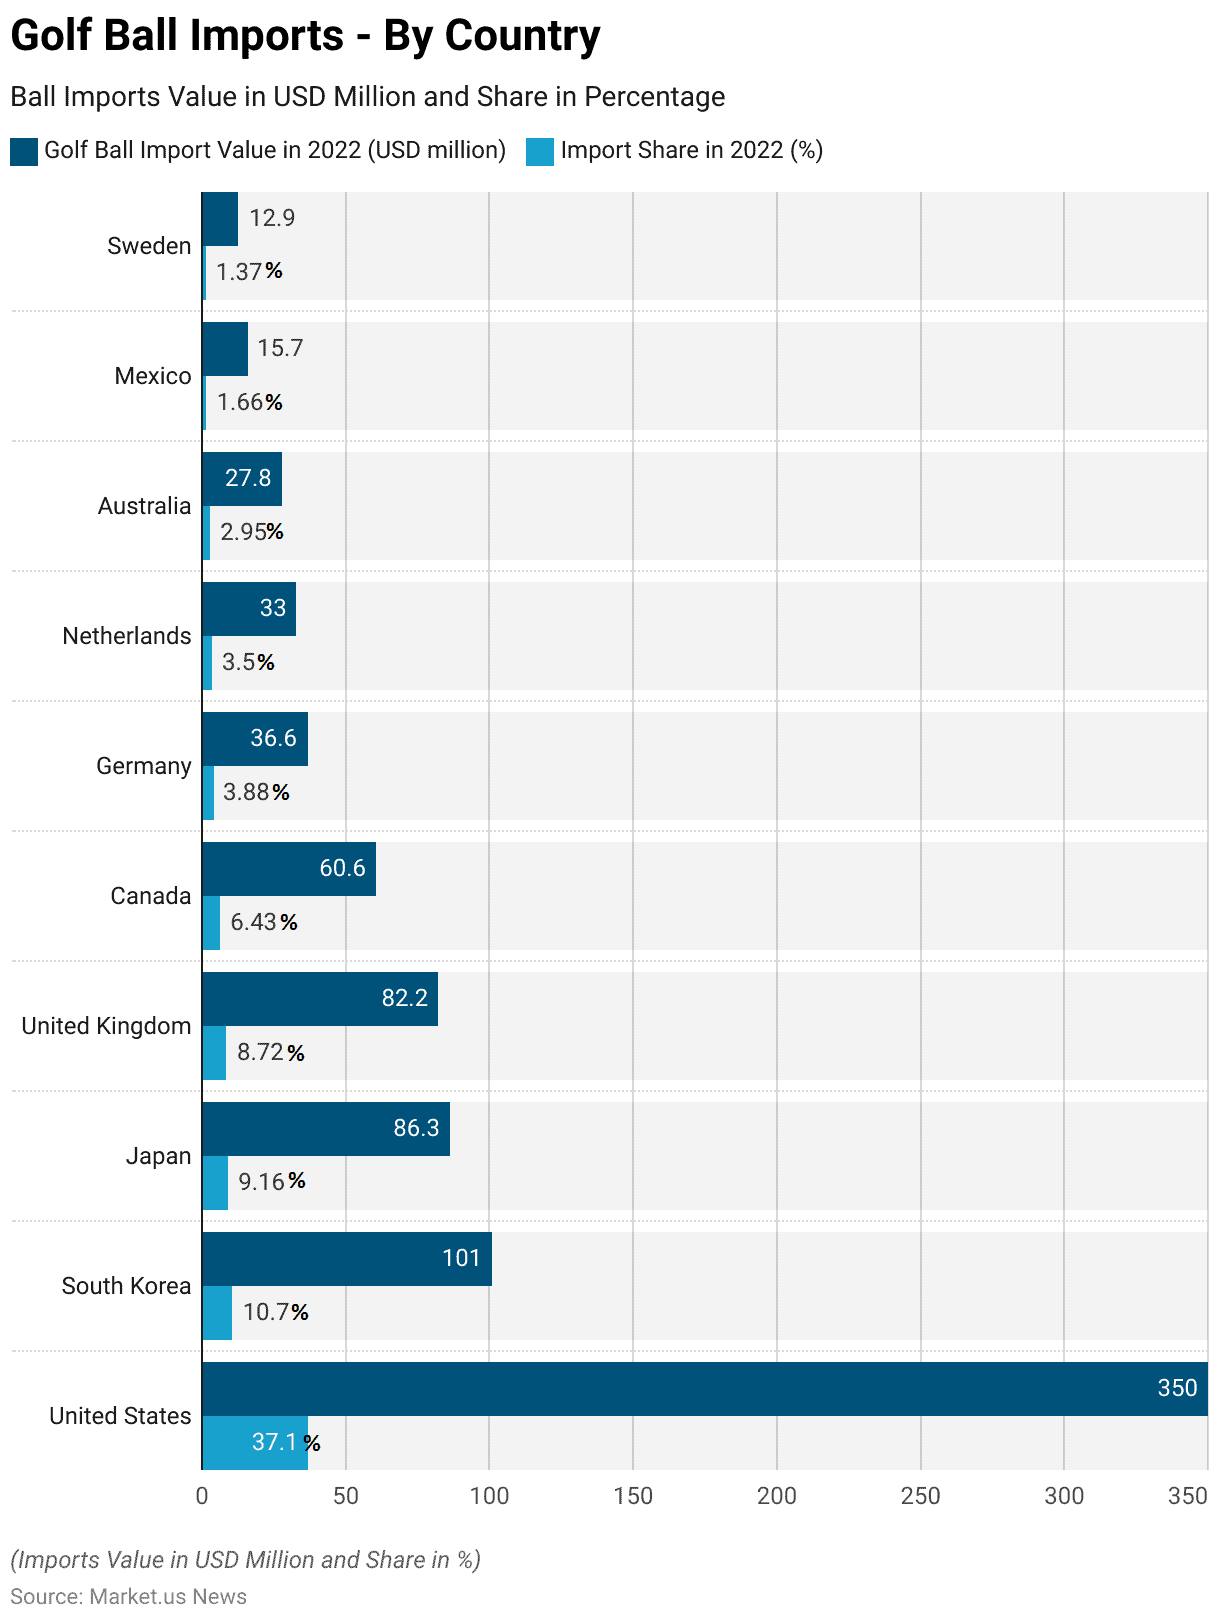
- In 2022, the United States dominated the global golf ball import market with a total import value of USD 350 million, accounting for 37.1% of the market share.
- South Korea followed, importing golf balls worth USD 101 million, which represented 10.7% of the market.
- Japan imported golf balls valued at USD 86.3 million, capturing 9.16% of the market share. While the United Kingdom’s imports stood at USD 82.2 million, or 8.72%.
- Canada imported USD 60.6 million worth of golf balls, making up 6.43% of the market.
- Germany and the Netherlands imported USD 36.6 million (3.88%) and USD 33 million (3.5%), respectively.
- Australia imported golf balls worth USD 27.8 million, representing 2.95% of the market share, while Mexico’s imports totaled USD 15.7 million (1.66%).
- Sweden had an import value of USD 12.9 million, accounting for 1.37% of the market.
- This data illustrates the significant demand for golf balls across these countries in 2022.
(Source: OEC World)
Value of Golf Ball Imported to Countries in Europe – By Country Statistics
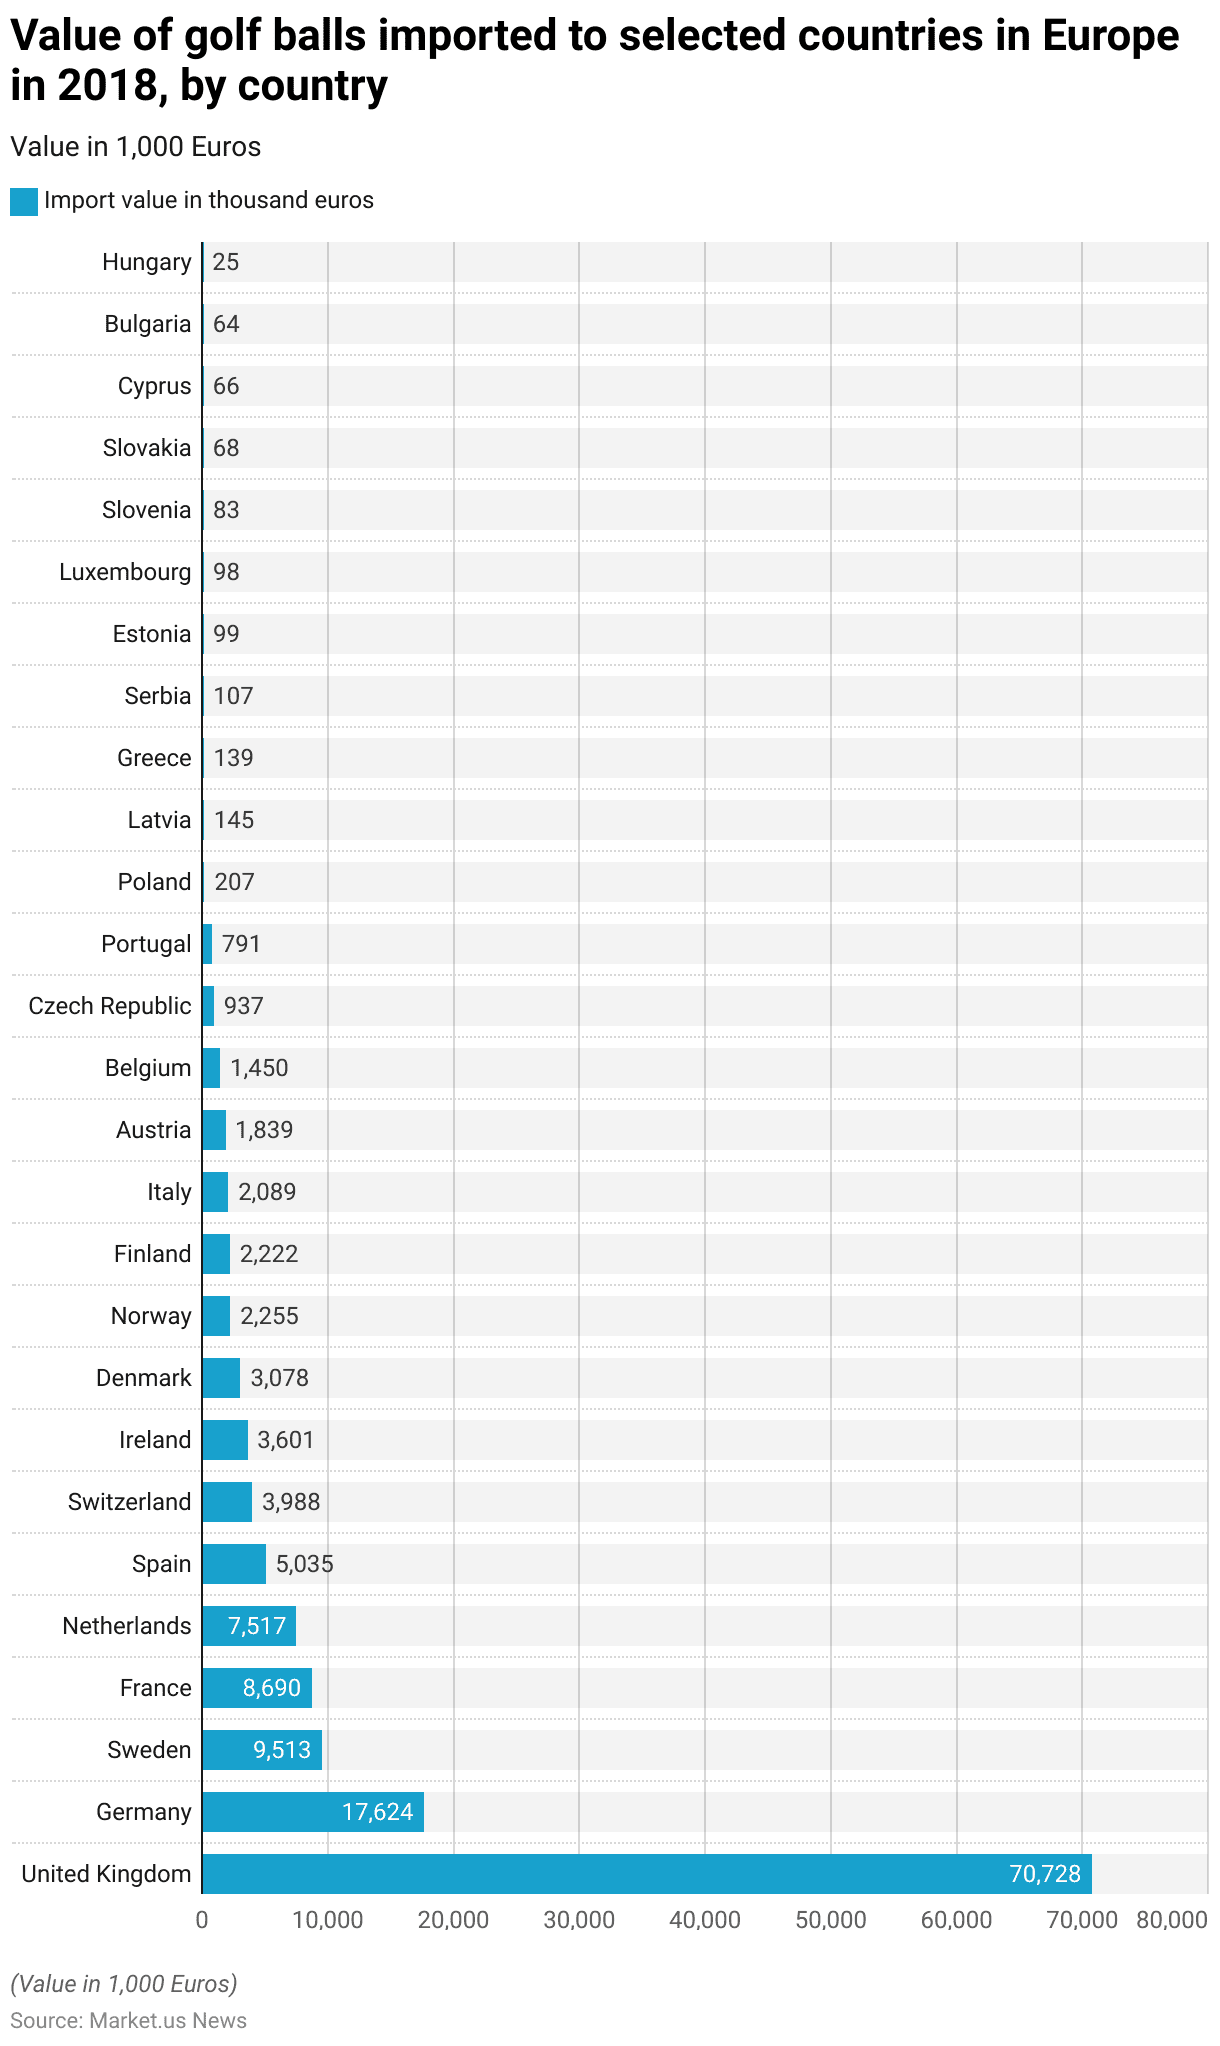
- In 2018, the value of golf ball imports to selected European countries varied significantly, with the United Kingdom leading the way at 70,728 thousand euros.
- Germany followed with an import value of 17,624 thousand euros, while Sweden imported golf balls worth 9,513 thousand euros.
- France’s import value stood at 8,690 thousand euros, and the Netherlands imported golf balls worth 7,517 thousand euros.
- Spain and Switzerland reported import values of 5,035 thousand euros and 3,988 thousand euros, respectively.
- Ireland’s imports amounted to 3,601 thousand euros, Denmark’s to 3,078 thousand euros, and Norway’s to 2,255 thousand euros.
- Finland imported golf balls valued at 2,222 thousand euros, and Italy’s import value was 2,089 thousand euros.
- Austria and Belgium had import values of 1,839 thousand euros and 1,450 thousand euros, respectively.
- Other notable import values included the Czech Republic with 937 thousand euros, Portugal with 791 thousand euros, and Poland with 207 thousand euros.
- Latvia and Greece reported import values of 145 thousand euros and 139 thousand euros, respectively, while Serbia’s imports were valued at 107 thousand euros.
- Estonia, Luxembourg, and Slovenia had import values of 99 thousand euros, 98 thousand euros, and 83 thousand euros, respectively.
- Slovakia and Cyprus reported import values of 68 thousand euros and 66 thousand euros, while Bulgaria and Hungary imported golf balls worth 64 thousand euros and 25 thousand euros, respectively.
- This data highlights the diverse demand for golf balls across various European countries.
(Source: Statista)
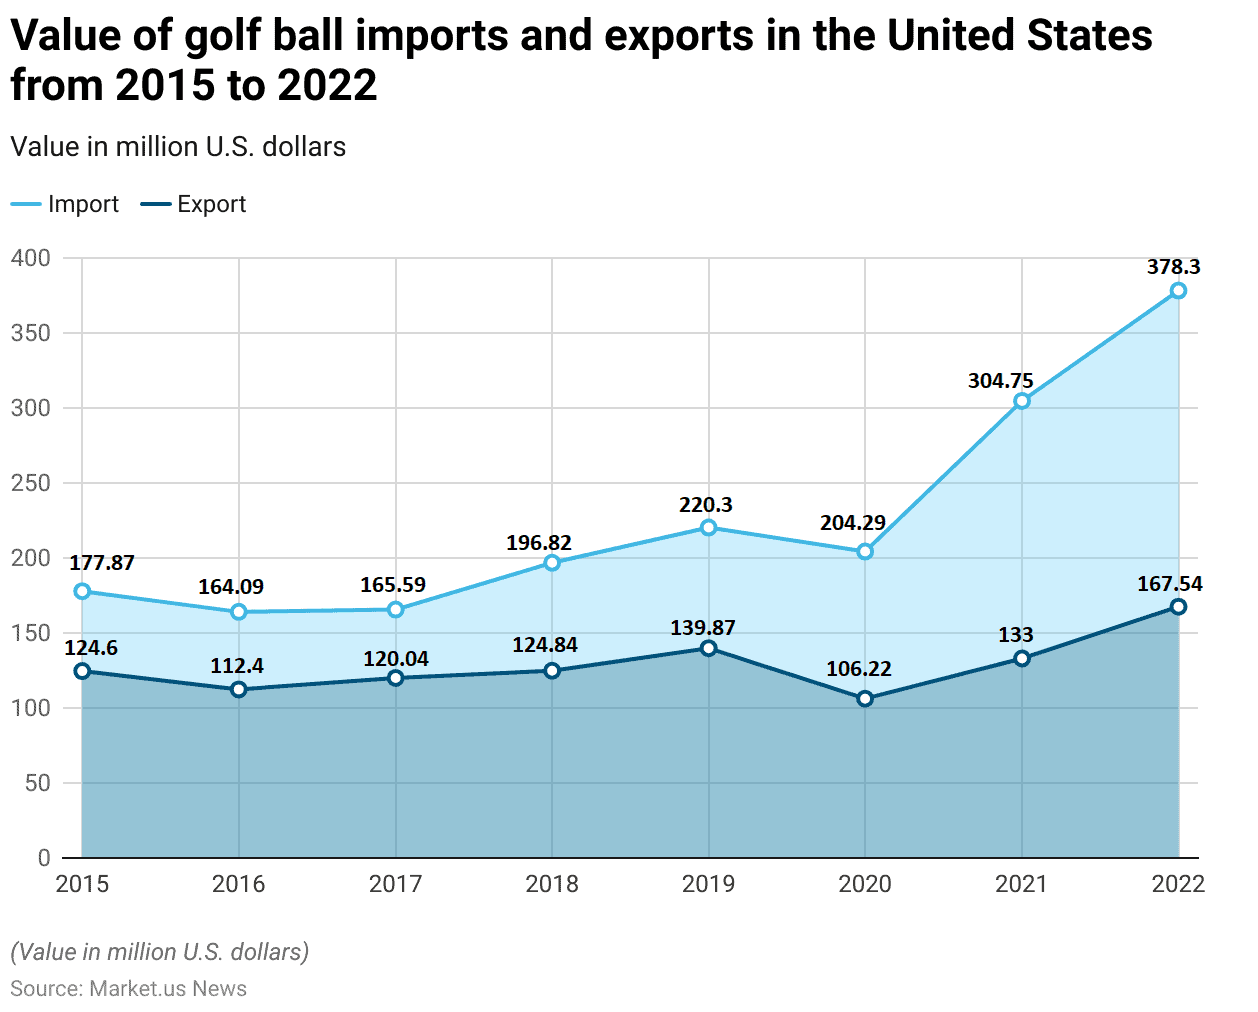
Value of Golf Ball Imports and Exports in The United States Statistics
- From 2015 to 2022, the value of golf ball imports and exports in the United States exhibited notable fluctuations.
- In 2015, the U.S. imported golf balls worth USD 177.87 million and exported USD 124.6 million.
- The following year, imports slightly decreased to USD 164.09 million, while exports also dropped to USD 112.4 million.
- In 2017, imports were valued at USD 165.59 million, with exports at USD 120.04 million.
- The import value increased significantly in 2018 to USD 196.82 million, accompanied by a slight rise in exports to USD 124.84 million.
- This upward trend in imports continued, reaching USD 220.3 million in 2019, while exports increased to USD 139.87 million.
- In 2020, imports saw a minor decline to USD 204.29 million, with exports decreasing to USD 106.22 million.
- However, 2021 marked a significant surge in imports, rising to USD 304.75 million, with exports also increasing to USD 133 million.
- By 2022, the U.S. golf ball imports peaked at USD 378.3 million, while exports reached USD 167.54 million.
- This data reflects the dynamic nature of the U.S. golf ball trade over the eight years.
(Source: Statista)
Golf Ball Sales Compared to Other Golf Accessories
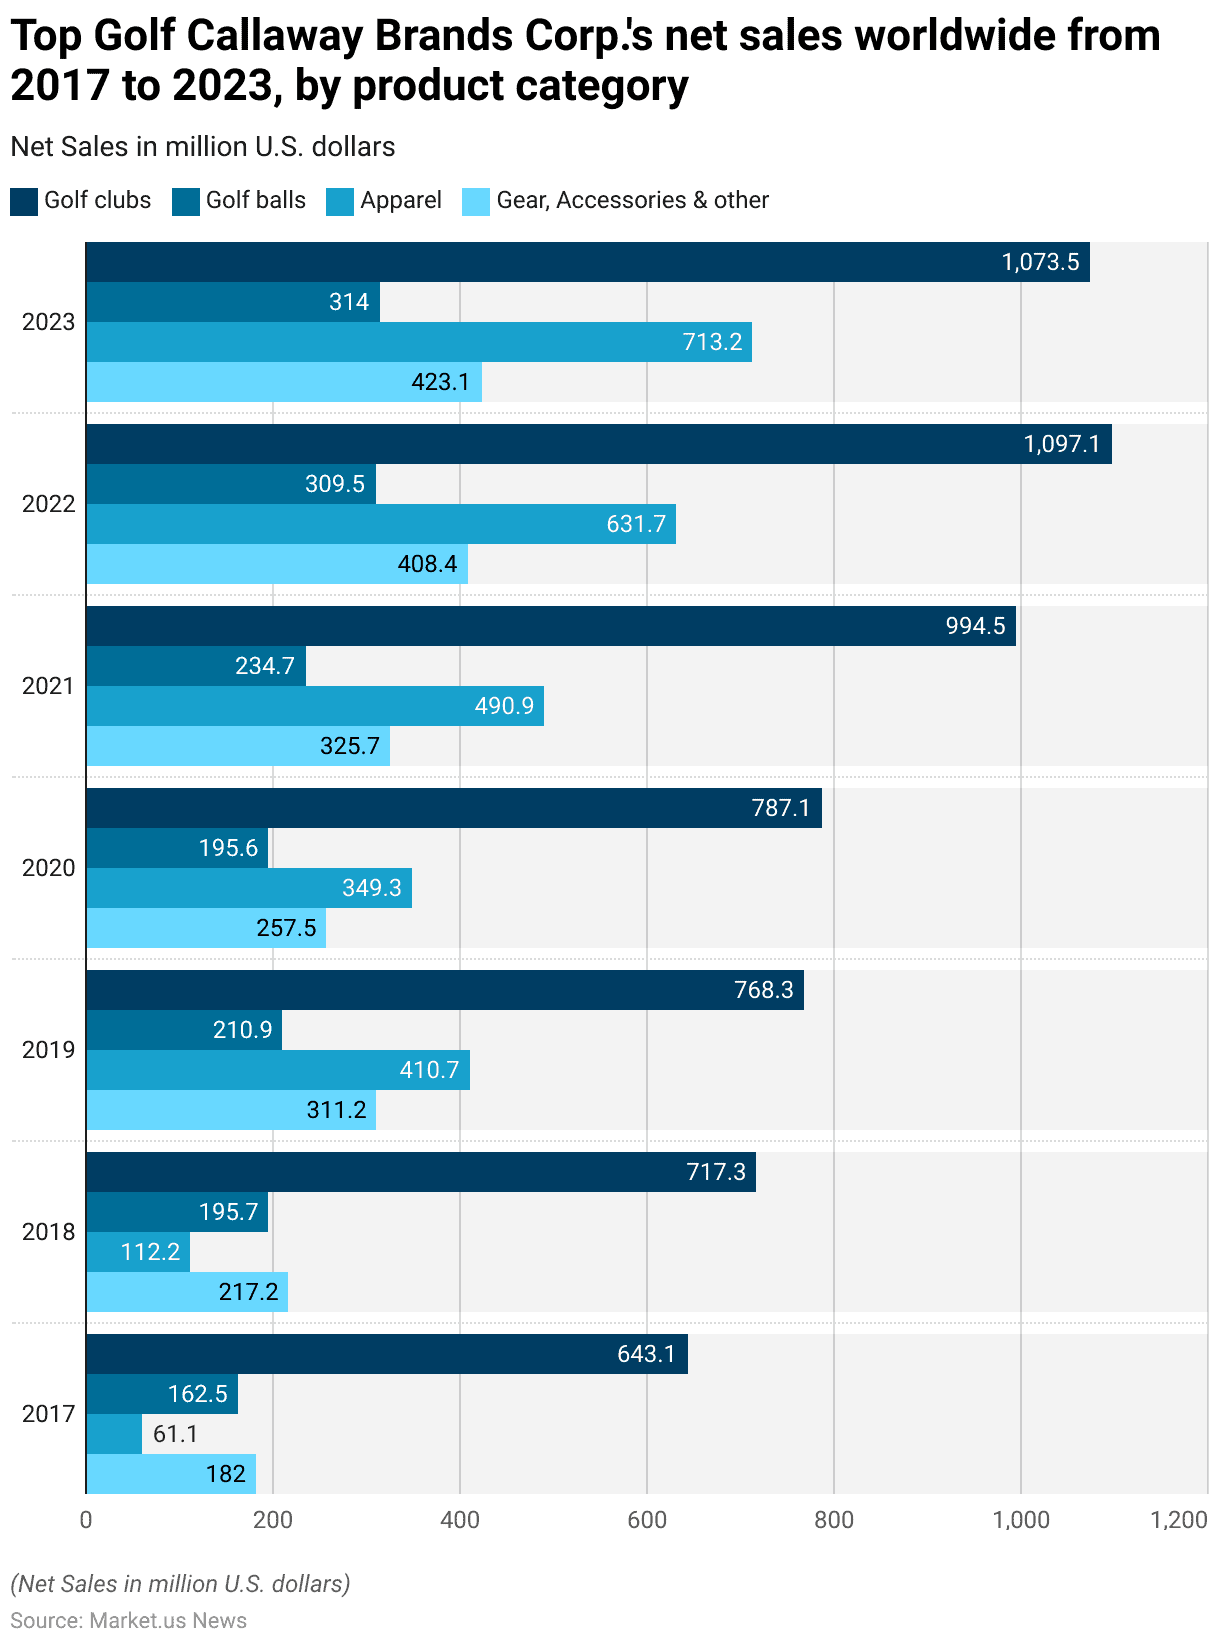
Topgolf Callaway Brands Corp.’s Net Sales Worldwide – By Product Category
- From 2017 to 2023, Topgolf Callaway Brands Corp. experienced substantial growth in net sales across various product categories.
- In 2017, the company reported net sales of USD 643.1 million for golf clubs, USD 162.5 million for golf balls, USD 61.1 million for apparel, and USD 182 million for gear, accessories, and other products.
- The following year, net sales increased to USD 717.3 million for golf clubs, USD 195.7 million for golf balls, USD 112.2 million for apparel, and USD 217.2 million for gear, accessories, and other products.
- By 2019, sales further rose to USD 768.3 million for golf clubs, USD 210.9 million for golf balls, USD 410.7 million for apparel, and USD 311.2 million for gear, accessories, and other products.
- In 2020, despite a slight dip in golf ball sales to USD 195.6 million, golf club sales reached USD 787.1 million, apparel sales stood at USD 349.3 million, and gear, accessories, and other products totaled USD 257.5 million.
- The year 2021 marked a significant surge, with golf club sales jumping to USD 994.5 million, golf balls to USD 234.7 million, apparel to USD 490.9 million, and gear, accessories, and other products to USD 325.7 million.
- This growth trajectory continued in 2022, with net sales for golf clubs reaching USD 1,097.1 million, golf balls at USD 309.5 million, apparel at USD 631.7 million, and gear, accessories, and other products at USD 408.4 million.
- In 2023, the company reported slight variations, with the golf club’s sales at USD 1,073.5 million, golf balls at USD 314 million, apparel at USD 713.2 million, and gear, accessories, and other products at USD 423.1 million.
- This data underscores the robust expansion of Topgolf Callaway Brands Corp. across its diverse product range over the seven years.
(Source: Statista)
Revenue of Acushnet Holdings Corp. – By Segment
2014-2017
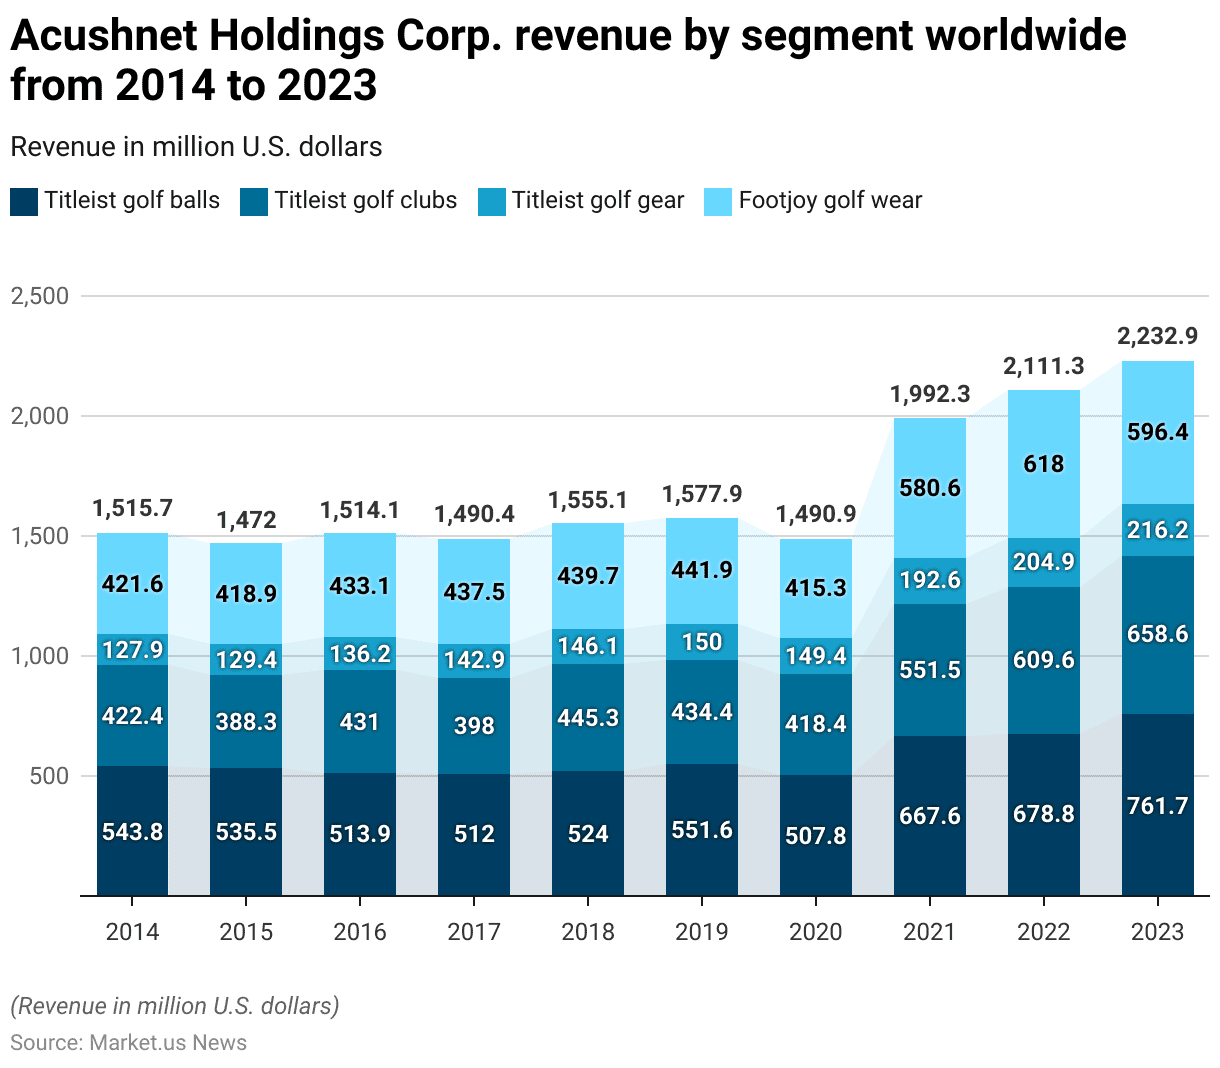
- From 2014 to 2023, Acushnet Holdings Corp. experienced notable fluctuations in revenue across its four primary segments: Titleist golf balls, Titleist golf clubs, Titleist golf gear, and FootJoy golf wear.
- In 2014, revenue from Titleist golf balls was USD 543.84 million. Titleist golf clubs generated USD 422.38 million. Titleist golf gear accounted for USD 127.88 million. and FootJoy golf wear brought in USD 421.63 million.
- The following year saw a slight decline in golf ball revenue to USD 535.47 million. At the same time, golf clubs and golf gear also decreased to USD 388.3 million and USD 129.41 million, respectively, with FootJoy golf wear slightly dropping to USD 418.85 million.
- In 2016, revenues rebounded for Titleist golf clubs and FootJoy golf wear, reaching USD 430.97 million and USD 433.06 million, respectively. Though Titleist golf balls declined to USD 513.9 million.
- The trend continued in 2017, with revenues for Titleist golf balls and clubs at USD 512.04 million and USD 397.99 million. Titleist golf gear and FootJoy golf wear saw increases to USD 142.91 million and USD 437.46 million, respectively.
2018-2023
- By 2018, Titleist golf ball revenue rose to USD 523.97 million, and Titleist golf clubs increased to USD 445.34 million. Titleist golf gear and FootJoy golf wear also saw growth, reaching USD 146.07 million and USD 439.68 million.
- The upward trajectory continued in 2019, with Titleist golf balls at USD 551.6 million, Titleist golf clubs at USD 434.4 million, Titleist golf gear at USD 150 million, and FootJoy golf wear at USD 441.9 million.
- The year 2020 brought a decline due to the global pandemic, with Titleist golf balls revenue falling to USD 507.8 million, golf clubs to USD 418.4 million, and FootJoy golf wear to USD 415.3 million, though Titleist golf gear remained relatively stable at USD 149.4 million.
- Recovery was evident in 2021, with significant increases across all segments: Titleist golf balls surged to USD 667.6 million, Titleist golf clubs to USD 551.5 million, Titleist golf gear to USD 192.6 million, and FootJoy golf wear to USD 580.6 million.
- This positive trend continued in 2022, with Titleist golf balls reaching USD 678.8 million, Titleist golf clubs at USD 609.6 million, Titleist golf gear at USD 204.9 million, and FootJoy golf wear at USD 618 million.
- By 2023, the growth persisted, with Titleist golf balls achieving USD 761.7 million, Titleist golf clubs at USD 658.6 million, and Titleist golf gear at USD 216.2 million, though FootJoy golf wear saw a slight decrease to USD 596.4 million.
- This data highlights Acushnet Holdings Corp.’s resilience and growth in the golf equipment and apparel market over the past decade.
(Source: Statista)
Key Spending/Investments
Global Spending On Golf Sponsorships
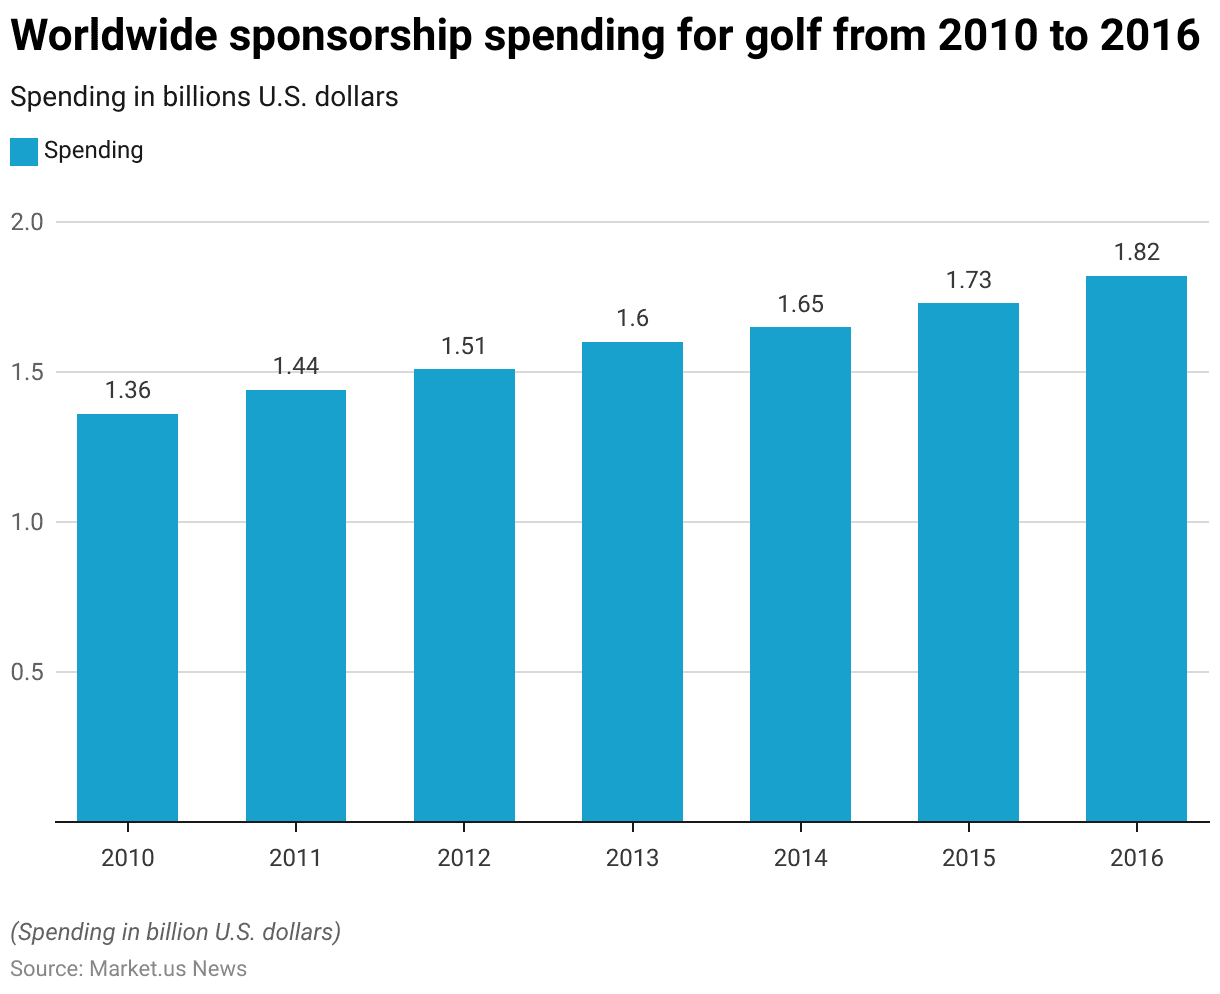
- From 2010 to 2016, worldwide sponsorship spending for golf experienced a consistent upward trend.
- In 2010, the total sponsorship spending was USD 1.36 billion.
- This figure rose to USD 1.44 billion in 2011 and further increased to USD 1.51 billion in 2012.
- The growth continued in 2013, reaching USD 1.6 billion.
- By 2014, sponsorship spending had grown to USD 1.65 billion, followed by an increase to USD 1.73 billion in 2015.
- The upward trajectory culminated in 2016, with sponsorship spending reaching USD 1.82 billion.
- This period demonstrates a steady increase in financial investment in the sport, reflecting its growing popularity and commercial appeal globally.
(Source: Statista)
Regulations for Golf Balls
- Golf ball regulations are primarily governed by the United States Golf Association (USGA) and the Royal and Ancient Golf Club of St Andrews (R&A), ensuring consistency and fairness in the sport globally.
- According to these regulations, a standard golf ball must have a diameter of at least 1.68 inches (42.67 mm) and weigh no more than 1.62 ounces (45.93 grams). The ball must also be symmetrical and adhere to specific distance and velocity performance standards under controlled testing conditions.
- However, regulations are universally recognized, meaning a conforming golf ball in the United States will meet the same standards in other countries. Including those governed by the R&A in Europe and beyond.
- Additionally, the dimples on a golf ball, which are crucial for aerodynamics, must be symmetrical to prevent unfair advantages in ball flight.
- These comprehensive guidelines help maintain the integrity of the game across different levels of play and ensure that all players compete under the same conditions.
(Source: GolfBalls.com, USGA)
Recent Developments
Acquisitions and Mergers:
- Callaway Golf acquires Topgolf: In early 2023, Callaway Golf completed its $2.6 billion acquisition of Topgolf, a global sports entertainment company. This merger aims to expand Callaway’s market reach by combining its golf equipment expertise with Topgolf’s entertainment venues, enhancing brand visibility and customer engagement.
- Titleist acquires KJUS: Titleist, a leading golf ball manufacturer, acquired KJUS, a premium golf apparel brand, for $150 million in mid-2023. This acquisition is expected to strengthen Titleist’s presence in the high-end golf market by offering a comprehensive range of golf products.
New Product Launches:
- Titleist Pro V1 2023 Edition: In late 2023, Titleist introduced the latest edition of its Pro V1 golf ball. This new version features enhanced aerodynamics, improved distance, and better greenside control. Aiming to maintain its position as the top choice for professional and amateur golfers.
- Callaway Chrome Soft X LS: Callaway launched the Chrome Soft X LS in early 2024, designed for lower spin and longer distance. This golf ball targets players seeking maximum speed and distance without sacrificing feel and control.
Funding:
- OnCore Golf raises $20 million: OnCore Golf, a company known for its innovative golf ball technology, secured $20 million in a funding round in 2023 to expand its product line and enhance its manufacturing capabilities, focusing on bringing advanced materials and designs to the market.
- Snell Golf secures $10 million: Snell Golf, a direct-to-consumer golf ball company, raised $10 million in early 2024 to increase production capacity and develop new golf ball models, aiming to offer high-performance balls at competitive prices.
Technological Advancements:
- Advanced Materials: Advances in materials science are being applied to golf ball manufacturing, including the use of graphene and other advanced polymers to enhance durability, distance, and control, providing better performance for players.
- AI-Driven Design: AI and machine learning are being used to optimize golf ball design, improving aerodynamics and performance characteristics by analyzing vast amounts of data and simulating various conditions.
Market Dynamics:
- Growth in Golf Ball Market: The global golf ball market is projected to grow at a CAGR of 5.3% from 2023 to 2028. Driven by increasing participation in golf, technological advancements in golf equipment, and rising disposable incomes allowing for premium product purchases.
- Rise in Women Golfers: There is a significant increase in the number of women golfers, leading to a growing demand for golf balls tailored to their needs. Such as lower compression balls that offer better feel and distance for slower swing speeds.
Regulatory and Strategic Developments:
- USGA and R&A Equipment Standards: The USGA and R&A updated their equipment standards in early 2024 to ensure that new golf ball technologies comply with the rules of golf. Promoting fairness and consistency in the sport.
- Sustainability Initiatives: Golf ball manufacturers are increasingly focusing on sustainability by developing eco-friendly materials and recycling programs to reduce the environmental impact of golf ball production and disposal.
Research and Development:
- Enhanced Durability: R&D efforts are focusing on improving the durability of golf balls. Making them more resistant to cuts and scuffs while maintaining performance, and ensuring longer-lasting products for consumers.
- Performance Tracking: Researchers are developing golf balls equipped with embedded sensors that can track performance metrics such as spin rate, launch angle, and distance, providing players with valuable data to improve their game.
Conclusion
Golf Ball Statistics – In summary, the golf ball market is expanding globally, fueled by rising participation in the sport, especially in Asia-Pacific and Latin America.
Technological advancements in aerodynamics and materials are enhancing ball performance, catering to diverse golfer needs.
There’s a notable shift towards eco-friendly designs amid growing environmental awareness. Competition among major brands remains fierce, with differentiation through innovation and strategic partnerships.
Consumer demand favors customized options and balls that optimize distance and control. Looking forward, the market shows promising growth opportunities driven by innovation, demographic trends, and increasing disposable incomes in emerging markets.
FAQs
The standard diameter of a golf ball is 1.68 inches (42.67 mm), and it must weigh no more than 1.62 ounces (45.93 grams) according to USGA and R&A regulations.
The number of dimples on a golf ball typically ranges from 300 to 500, with most balls having around 336 dimples. The exact number can vary based on the manufacturer and model.
Golf balls are usually made from a combination of rubber and synthetic materials. The core is often made of solid or liquid rubber, while the outer layer is made from urethane or surlyn to provide durability and control.
Dimples on a golf ball create turbulence in the air around the ball, reducing drag and allowing it to travel farther. They also help in stabilizing the ball’s flight, making it less susceptible to wind and other environmental factors.
A two-piece golf ball consists of a solid rubber core and a durable outer cover. Making it ideal for beginners and players seeking distance. Multi-layer balls, including three-piece and four-piece designs. It has additional layers that provide better control and spin, favored by more advanced players.


