Table of Contents
- Introduction
- Editor’s Choice
- Heat Pump Market Statistics
- Manufacturing of Heat Pump Statistics
- Sales of Heat Pump Statistics
- Heat Pump Air-Source statistics
- Geothermal Heat Pump Statistics
- Key Export Statistics
- Key Import Statistics
- Heat Pumps Cost Statistics
- Heat Pump Efficiency Statistics
- Key Investment Statistics
- Environmental Impact
- Regulations for Heat Pumps
- Recent Developments
- Conclusion
- FAQs
Introduction
Heat Pump Statistics: Heat pumps are efficient systems that transfer heat rather than generate it. Using a refrigeration cycle similar to that in air conditioners.
They can be categorized into air source, ground source, and water source types, each extracting heat from different sources.
Air source heat pumps take heat from the outside air, while ground source and water source heat pumps extract heat from the ground or water bodies.
These systems offer the dual benefits of heating and cooling and are known for their energy efficiency and reduced carbon footprint.
However, they can have high initial costs, and their effectiveness can vary depending on climate and installation quality.
Editor’s Choice
- By 2032, the global heat pump market revenue is projected to achieve USD 151.3 billion.
- The global heat pump market is segmented by application into residential, commercial, and industrial sectors. The residential sector dominates the market, accounting for 80% of the total market share.
- In 2022, China dominated the global heat pump manufacturing capacity, which accounted for 50 GW of production capacity.
- In the United States, heat pump sales increased from 23 GW in 2019 to 30 GW in 2022 before slightly declining to 26 GW in 2023.
- In 2018, China was the largest exporter of heating and cooling equipment and parts. With an export value of USD 16.5 billion, representing 33.7% of the global market.
- In 2018, the United States was the largest importer of heating and cooling equipment and parts. With an import value of USD 8.92 billion, accounting for 18.3% of the global market.
- A gas tank water heater emits approximately 1,433 kilograms of carbon dioxide equivalent per unit each year. While a heat pump water heater produces just 519 kilograms of carbon dioxide equivalent annually.
Heat Pump Market Statistics
Global Heat Pump Market Size Statistics
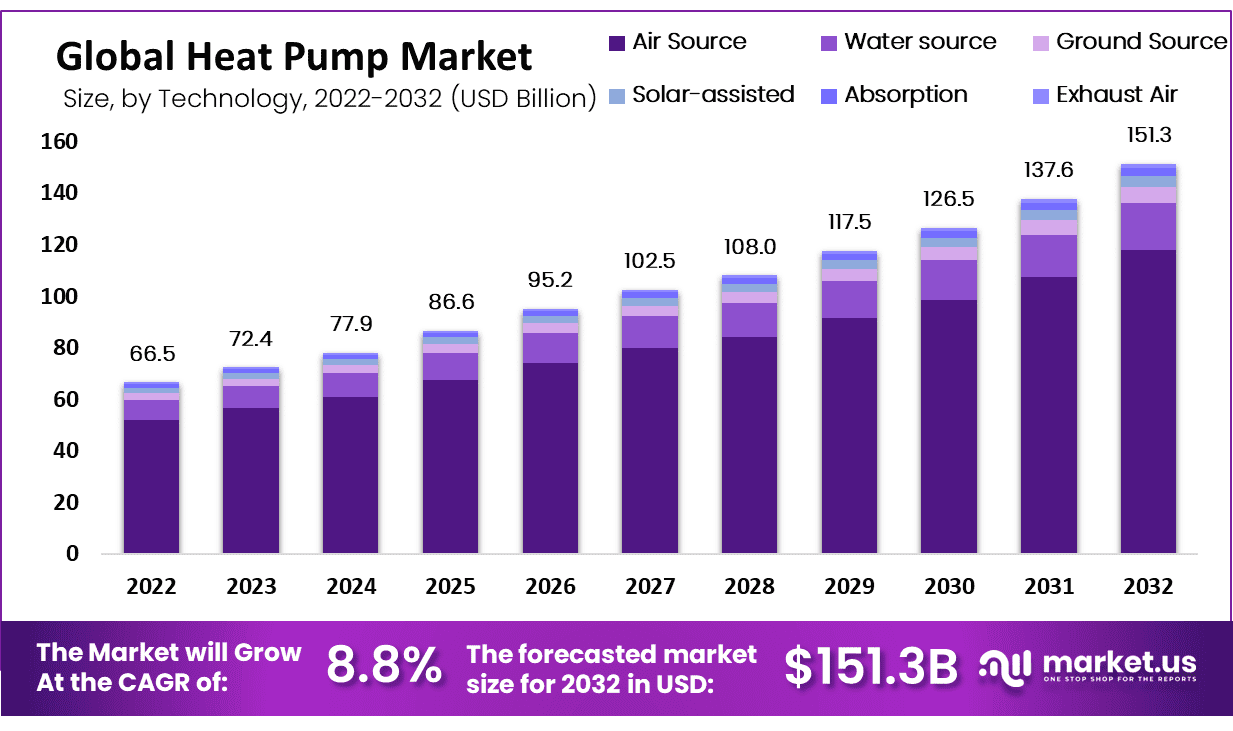
- The global heat pump market revenue was valued at USD 66.5 billion in 2022 and is expected to exhibit consistent growth in the coming years at a CAGR of 8.80%.
- In 2023, the market is projected to reach USD 72.4 billion, followed by an increase to USD 77.9 billion in 2024.
- By 2025, the market revenue is anticipated to grow further to USD 86.6 billion, reaching USD 95.2 billion in 2026.
- The upward trend continues, with estimates suggesting that the market will attain USD 102.5 billion in 2027, USD 108.0 billion in 2028, and USD 117.5 billion in 2029.
- By 2030, the global heat pump market is forecasted to generate USD 126.5 billion, and by 2031, it is expected to rise to USD 137.6 billion.
- Finally, by 2032, the market is projected to achieve USD 151.3 billion, reflecting steady and robust growth over the forecast period.
(Source: market.us)
Global Heat Pump Market Size – By Technology Statistics
2022-2024
- The global heat pump market, segmented by technology, showed significant growth across various segments from 2022 to 2027.
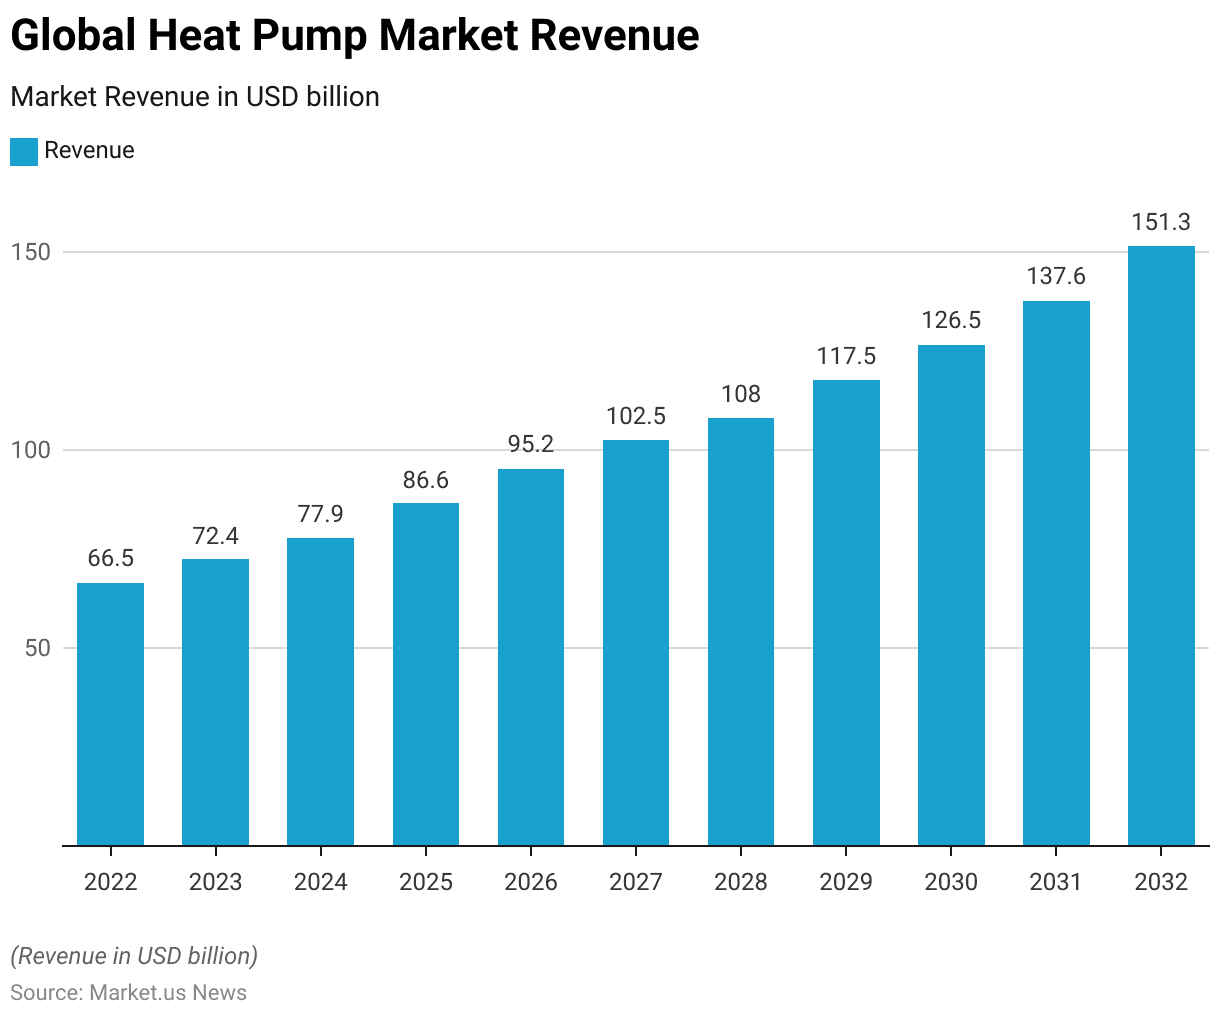
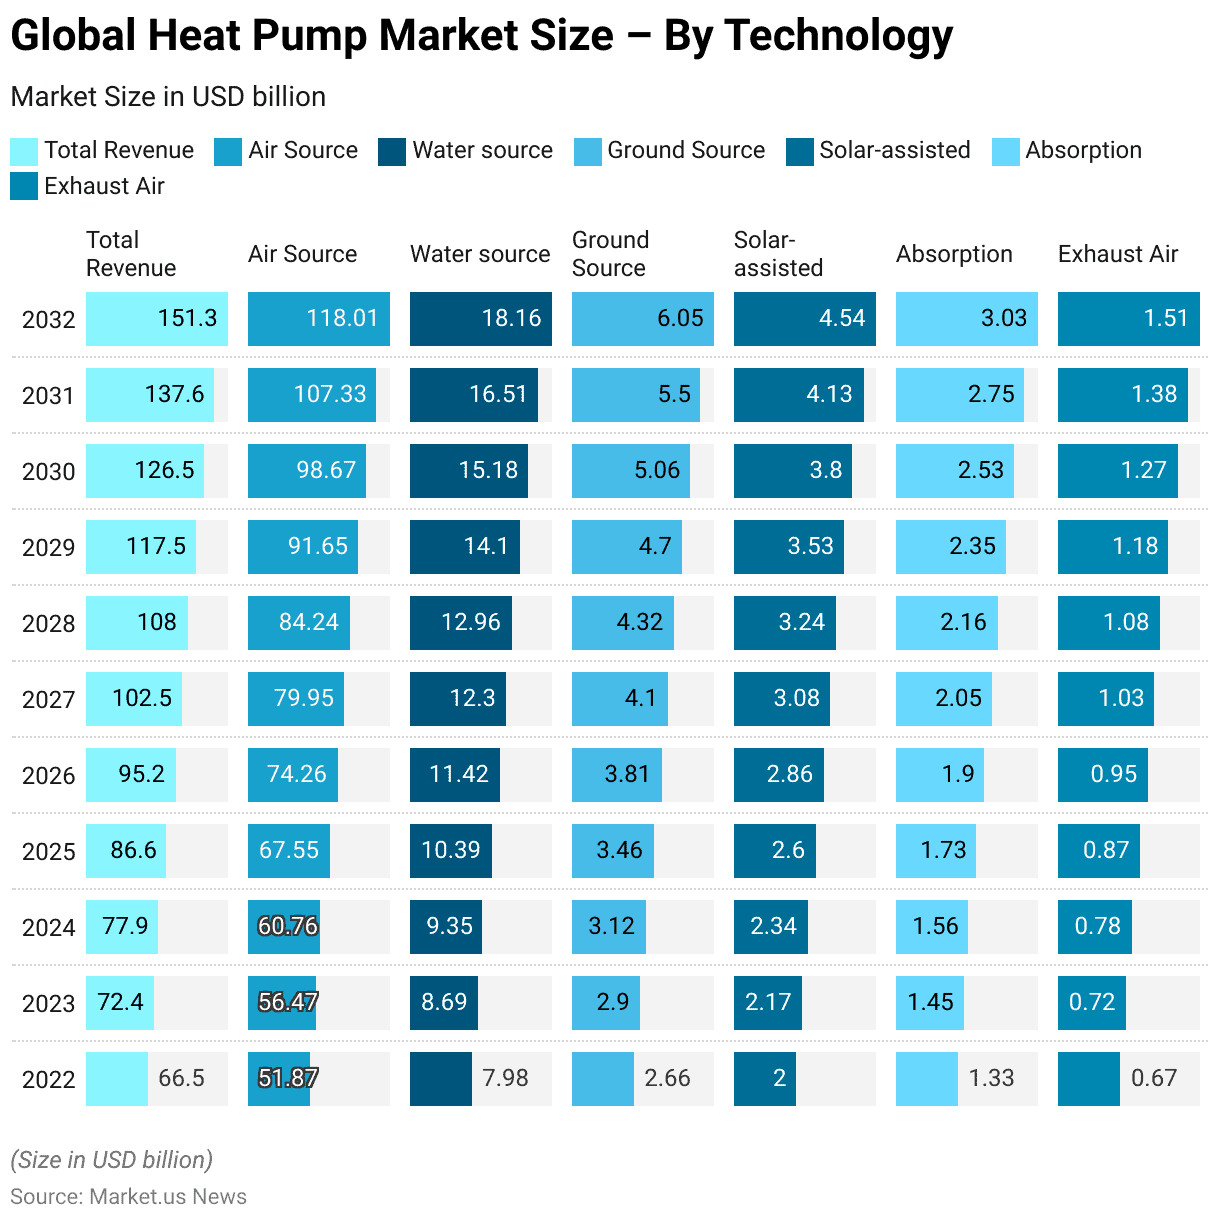
- In 2022, the total market revenue stood at USD 66.5 billion, with air-source heat pumps accounting for USD 51.87 billion. Water-source heat pumps at USD 7.98 billion, and ground-source heat pumps at USD 2.66 billion.
- Solar-assisted heat pumps contributed USD 2.00 billion. While absorption and exhaust air heat pumps accounted for USD 1.33 billion and USD 0.67 billion, respectively.
- In 2023, the market grew to USD 72.4 billion, with air source heat pumps reaching USD 56.47 billion, water source at USD 8.69 billion, and ground source at USD 2.90 billion.
- Solar-assisted, absorption, and exhaust air heat pumps saw modest increases. Reaching USD 2.17 billion, USD 1.45 billion, and USD 0.72 billion, respectively.
- By 2024, the total market revenue rose to USD 77.9 billion, driven by air source heat pumps at USD 60.76 billion. Water sources at USD 9.35 billion, and ground sources at USD 3.12 billion.
- Solar-assisted heat pumps reached USD 2.34 billion, with absorption at USD 1.56 billion and exhaust air heat pumps at USD 0.78 billion.
2025-2027
- In 2025, the market expanded to USD 86.6 billion, with air source, water source, and ground source heat pumps contributing USD 67.55 billion, USD 10.39 billion, and USD 3.46 billion, respectively.
- Solar-assisted heat pumps reached USD 2.60 billion. Absorption at USD 1.73 billion, and exhaust air heat pumps at USD 0.87 billion.
- By 2026, the market grew further to USD 95.2 billion, with air source heat pumps at USD 74.26 billion, water source at USD 11.42 billion, and ground source at USD 3.81 billion.
- Solar-assisted heat pumps reached USD 2.86 billion. Absorption at USD 1.90 billion, and exhaust air heat pumps at USD 0.95 billion.
- The trend continued in 2027, with total market revenue reaching USD 102.5 billion. Driven by air source at USD 79.95 billion, water source at USD 12.30 billion, and ground source at USD 4.10 billion.
- Solar-assisted heat pumps grew to USD 3.08 billion, absorption to USD 2.05 billion, and exhaust air heat pumps to USD 1.03 billion.
2028-2030
- By 2028, the market reached USD 108.0 billion, with air source heat pumps at USD 84.24 billion, water sources at USD 12.96 billion, and ground sources at USD 4.32 billion.
- Solar-assisted heat pumps contributed USD 3.24 billion, absorption reached USD 2.16 billion, and exhaust air heat pumps accounted for USD 1.08 billion.
- In 2029, the total market revenue grew to USD 117.5 billion, driven by air source heat pumps at USD 91.65 billion, water source at USD 14.10 billion, and ground source at USD 4.70 billion.
- Solar-assisted heat pumps reached USD 3.53 billion, absorption at USD 2.35 billion, and exhaust air heat pumps at USD 1.18 billion.
- By 2030, the market expanded to USD 126.5 billion, with air source heat pumps at USD 98.67 billion, water sources at USD 15.18 billion, and ground sources at USD 5.06 billion.
- Solar-assisted heat pumps reached USD 3.80 billion, absorption at USD 2.53 billion, and exhaust air heat pumps at USD 1.27 billion.
2031-2032
- In 2031, the market grew to USD 137.6 billion, with air source heat pumps at USD 107.33 billion, water source at USD 16.51 billion, and ground source at USD 5.50 billion.
- Solar-assisted heat pumps contributed USD 4.13 billion, absorption reached USD 2.75 billion, and exhaust air heat pumps accounted for USD 1.38 billion.
- By 2032, the global heat pump market is projected to reach USD 151.3 billion, with air-source heat pumps dominating at USD 118.01 billion, water sources at USD 18.16 billion, and ground sources at USD 6.05 billion.
- Moreover, Solar-assisted heat pumps are expected to generate USD 4.54 billion, absorption at USD 3.03 billion, and exhaust air heat pumps at USD 1.51 billion, reflecting strong growth across all segments.
(Source: market.us)
Global Heat Pump Market Share – By Application Statistics
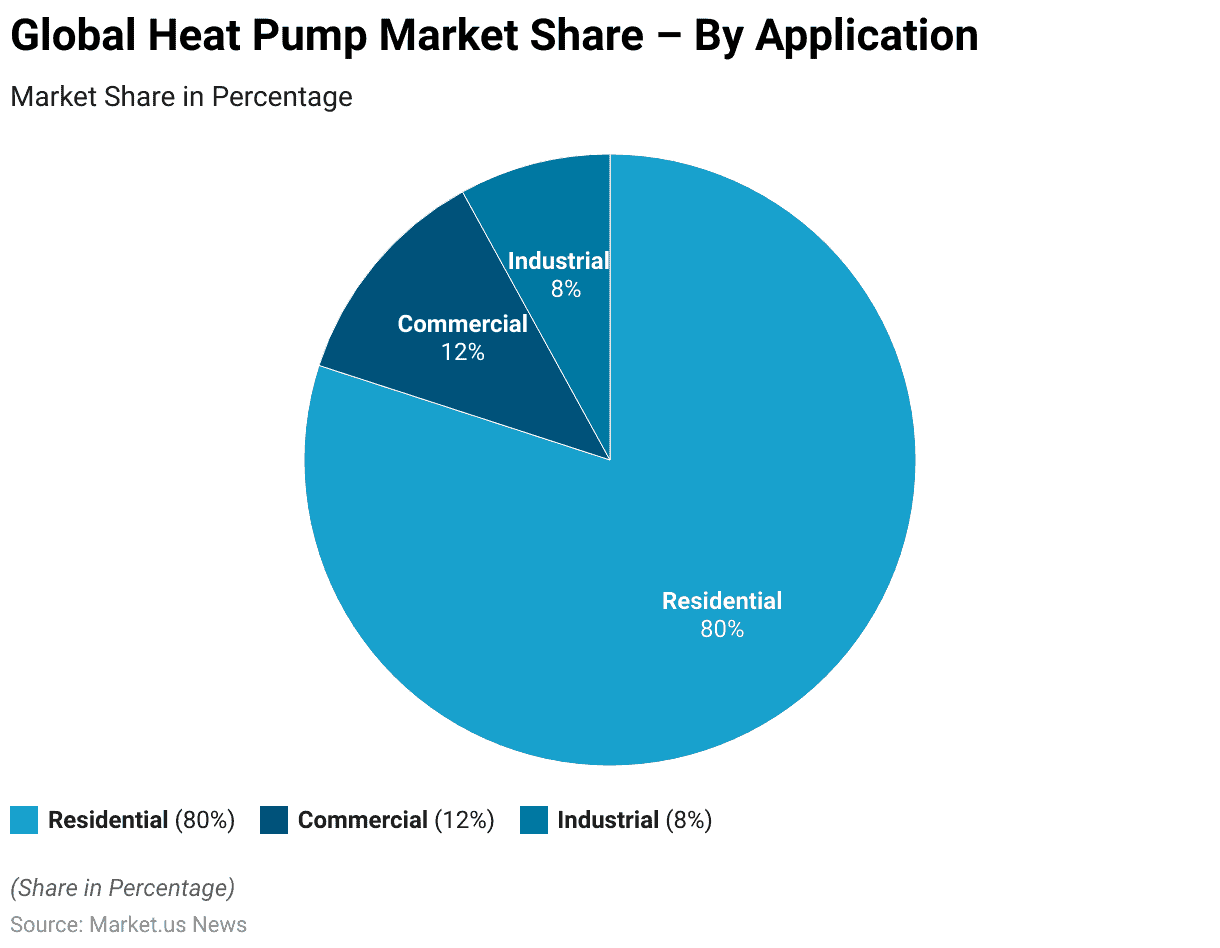
- The global heat pump market is segmented by application into residential, commercial, and industrial sectors.
- The residential sector dominates the market, accounting for 80% of the total market share.
- The commercial sector holds 12%, while the industrial sector comprises the remaining 8%.
- This distribution reflects the significant adoption of heat pump technology in residential settings, with commercial and industrial applications playing smaller yet important roles in the overall market.
(Source: market.us)
Manufacturing of Heat Pump Statistics
Heat Pump Manufacturing Capacity -By Region Statistics
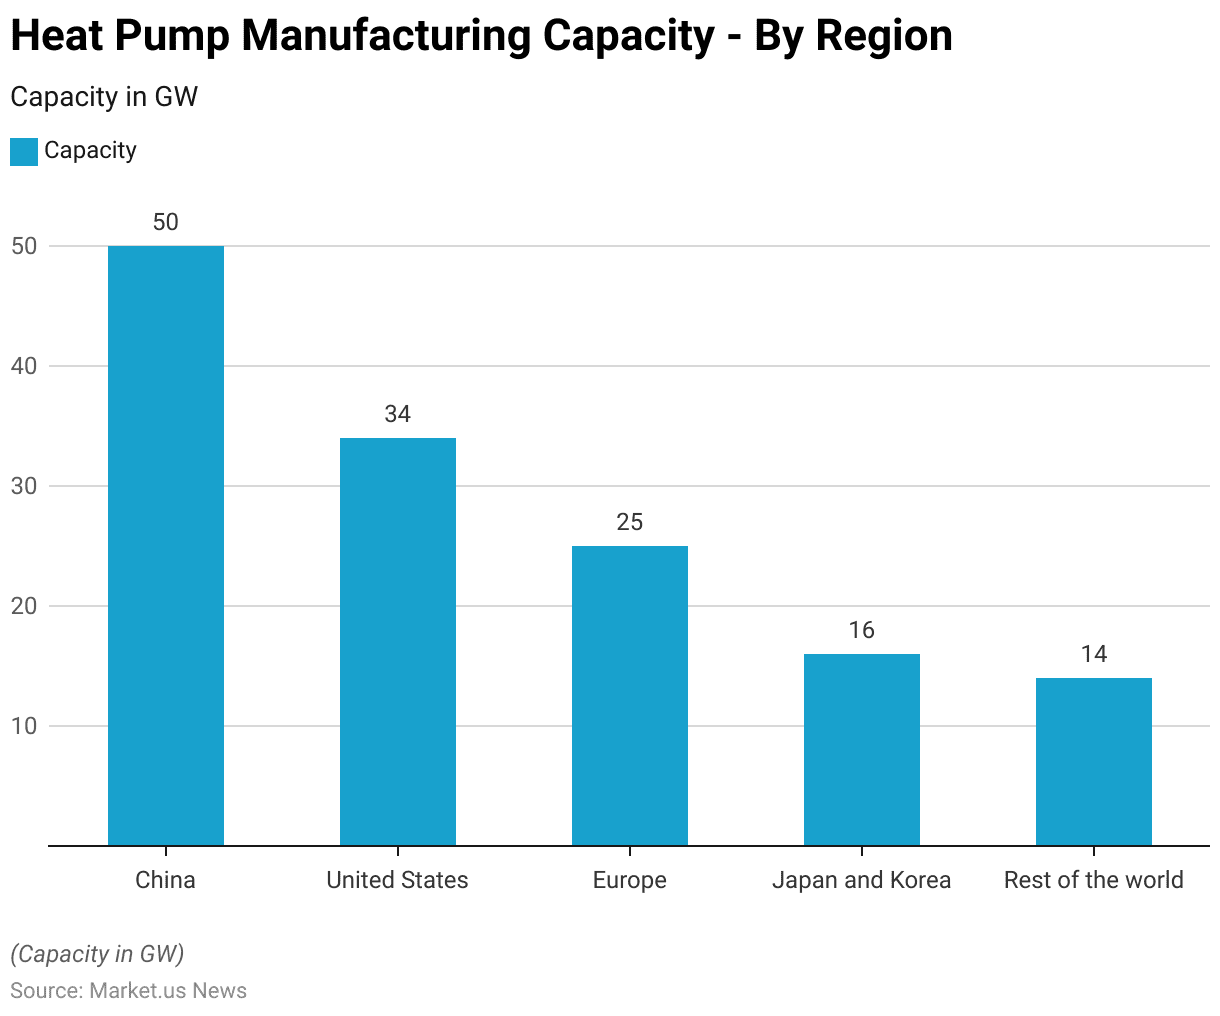
- In 2022, China dominated the global heat pump manufacturing capacity, which accounted for 50 GW of production capacity.
- The United States followed with a capacity of 34 GW, while Europe contributed 25 GW.
- Japan and Korea collectively accounted for 16 GW of the global production capacity.
- The rest of the world combined contributed an additional 14 GW.
- This distribution underscores the significant role of China and the United States in heat pump manufacturing, with Europe, Japan, Korea, and other regions also contributing to the global supply.
(Source: International Energy Agency)
Sales of Heat Pump Statistics
Heat Pump Sales – By Country/Region Statistics
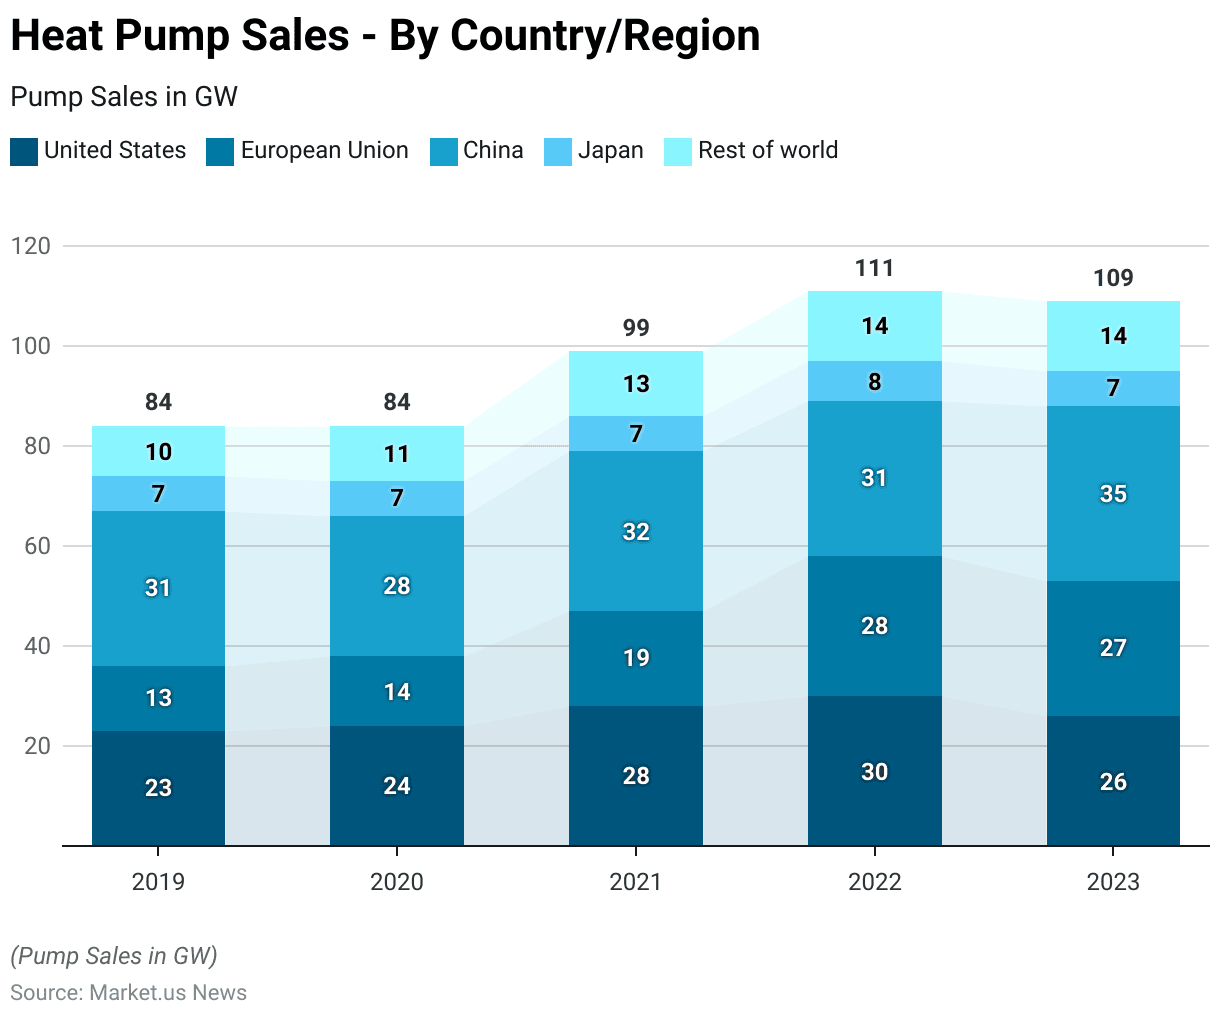
- From 2019 to 2023, heat pump sales in different regions exhibited varying trends.
- In the United States, sales increased from 23 GW in 2019 to 30 GW in 2022, before slightly declining to 26 GW in 2023.
- The European Union saw consistent growth, with sales rising from 13 GW in 2019 to a peak of 28 GW in 2022, followed by a slight decline to 27 GW in 2023.
- In China, sales fluctuated, starting at 31 GW in 2019, dipping to 28 GW in 2020, and then increasing to 35 GW by 2023.
- Japan maintained relatively stable sales during this period, with figures hovering around 7 to 8 GW.
- Meanwhile, the rest of the world experienced a steady increase in heat pump sales, growing from 10 GW in 2019 to 14 GW in both 2022 and 2023.
- These trends reflect region-specific factors influencing heat pump adoption.
(Source: International Energy Agency)
Heat Pump Sales as Share of All Heating System Sales Worldwide Statistics
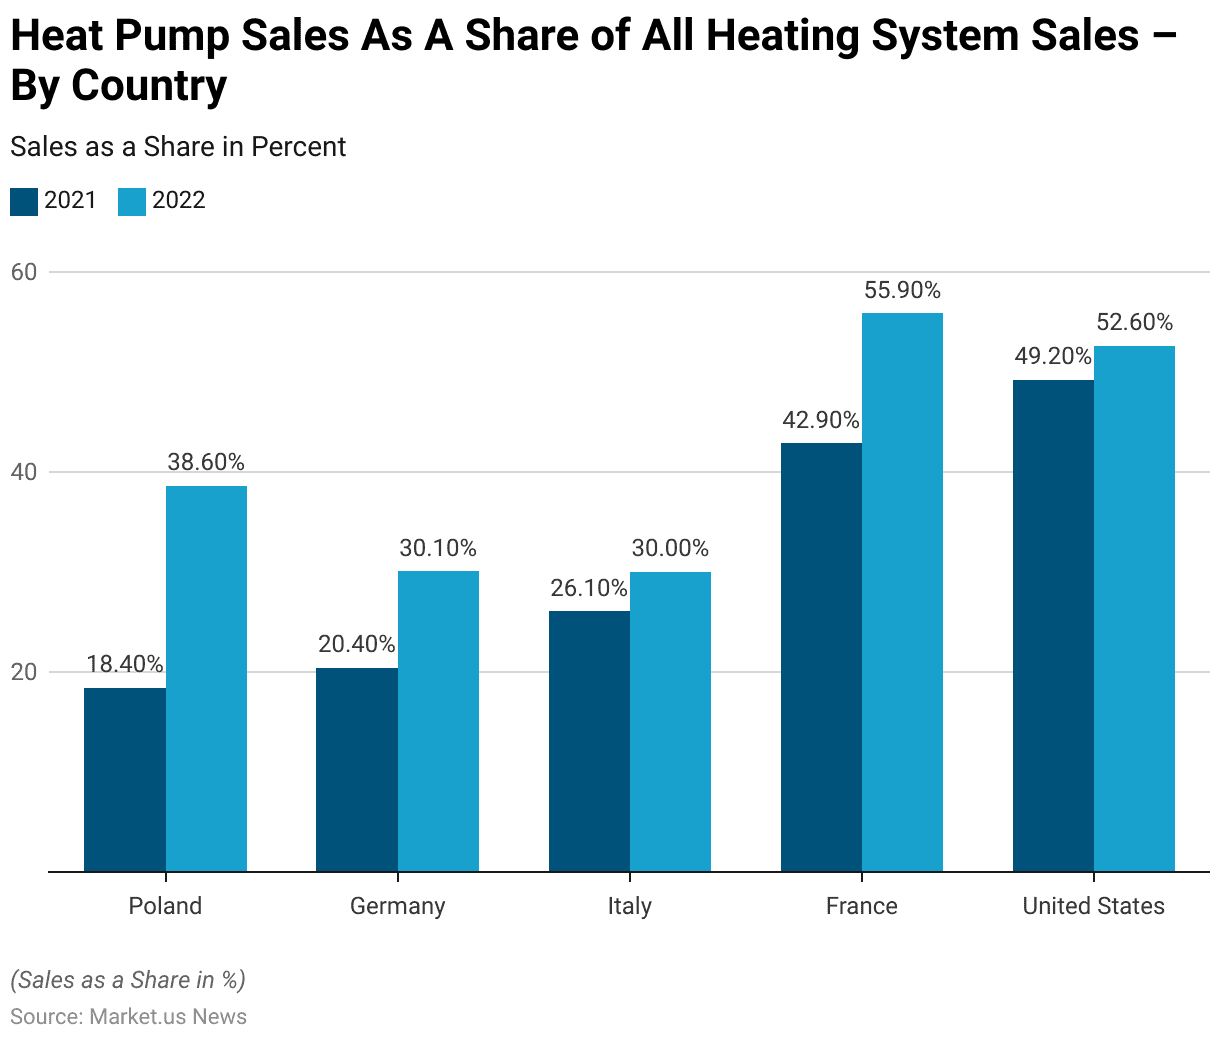
- From 2021 to 2022, heat pump sales as a share of all heating system sales increased significantly across several key countries.
- In Poland, the share rose from 18.4% in 2021 to 38.6% in 2022.
- Germany saw an increase from 20.4% to 30.1% over the same period.
- Italy experienced a rise from 26.1% in 2021 to 30% in 2022.
- In France, heat pump sales surged from 42.9% in 2021 to 55.9% in 2022, while in the United States, the share increased from 49.2% to 52.6%.
- These increases highlight the growing adoption of heat pumps as a preferred heating system in these regions.
(Source: Statista)
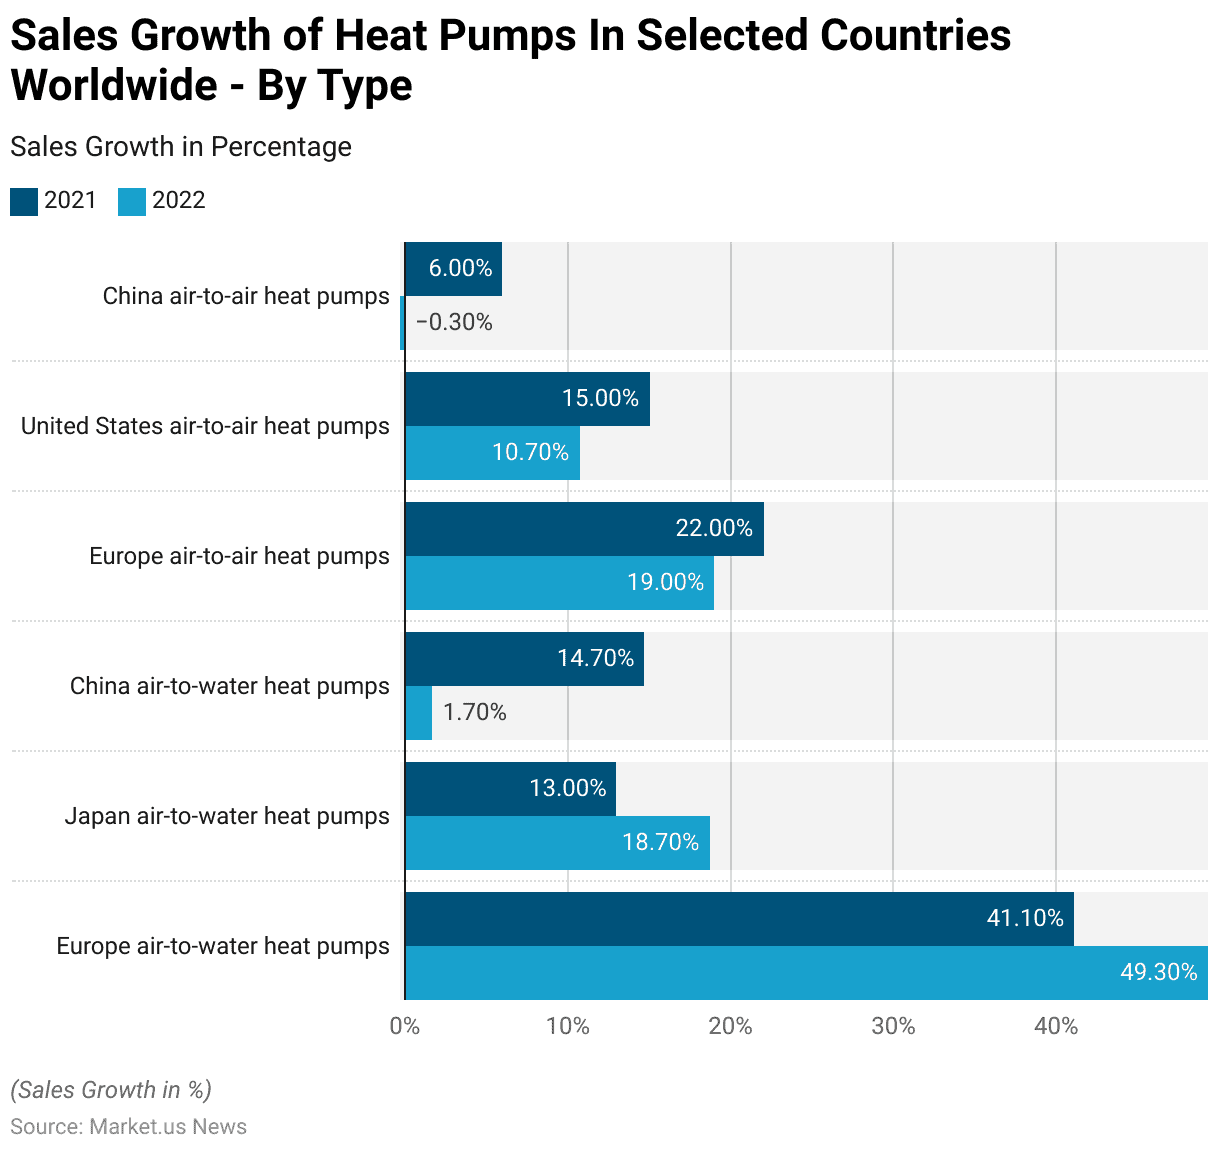
Sales Growth of Heat Pumps Worldwide- By Type Statistics
- In 2022, the sales of heat pumps in buildings showed varying growth rates across different regions and types.
- Europe saw a significant rise in air-to-water heat pump sales, increasing from 41.1% in 2021 to 49.3% in 2022.
- Similarly, Japan’s air-to-water heat pump sales grew from 13% to 18.7% over the same period.
- In contrast, China’s air-to-water heat pump sales declined sharply, dropping from 14.7% in 2021 to just 1.7% in 2022.
- For air-to-air heat pumps, Europe experienced a slight decline, with growth decreasing from 22% in 2021 to 19% in 2022.
- In the United States, air-to-air heat pump sales also saw a decline in growth, from 15% in 2021 to 10.7% in 2022.
- China, however, witnessed a more significant decrease in air-to-air heat pump sales, with growth rates dropping from 6% in 2021 to -0.3% in 2022, indicating a negative growth trend in that segment.
(Source: Statista)
Heat Pump Air-Source statistics
Air-Source Heat Pumps Shipments Statistics
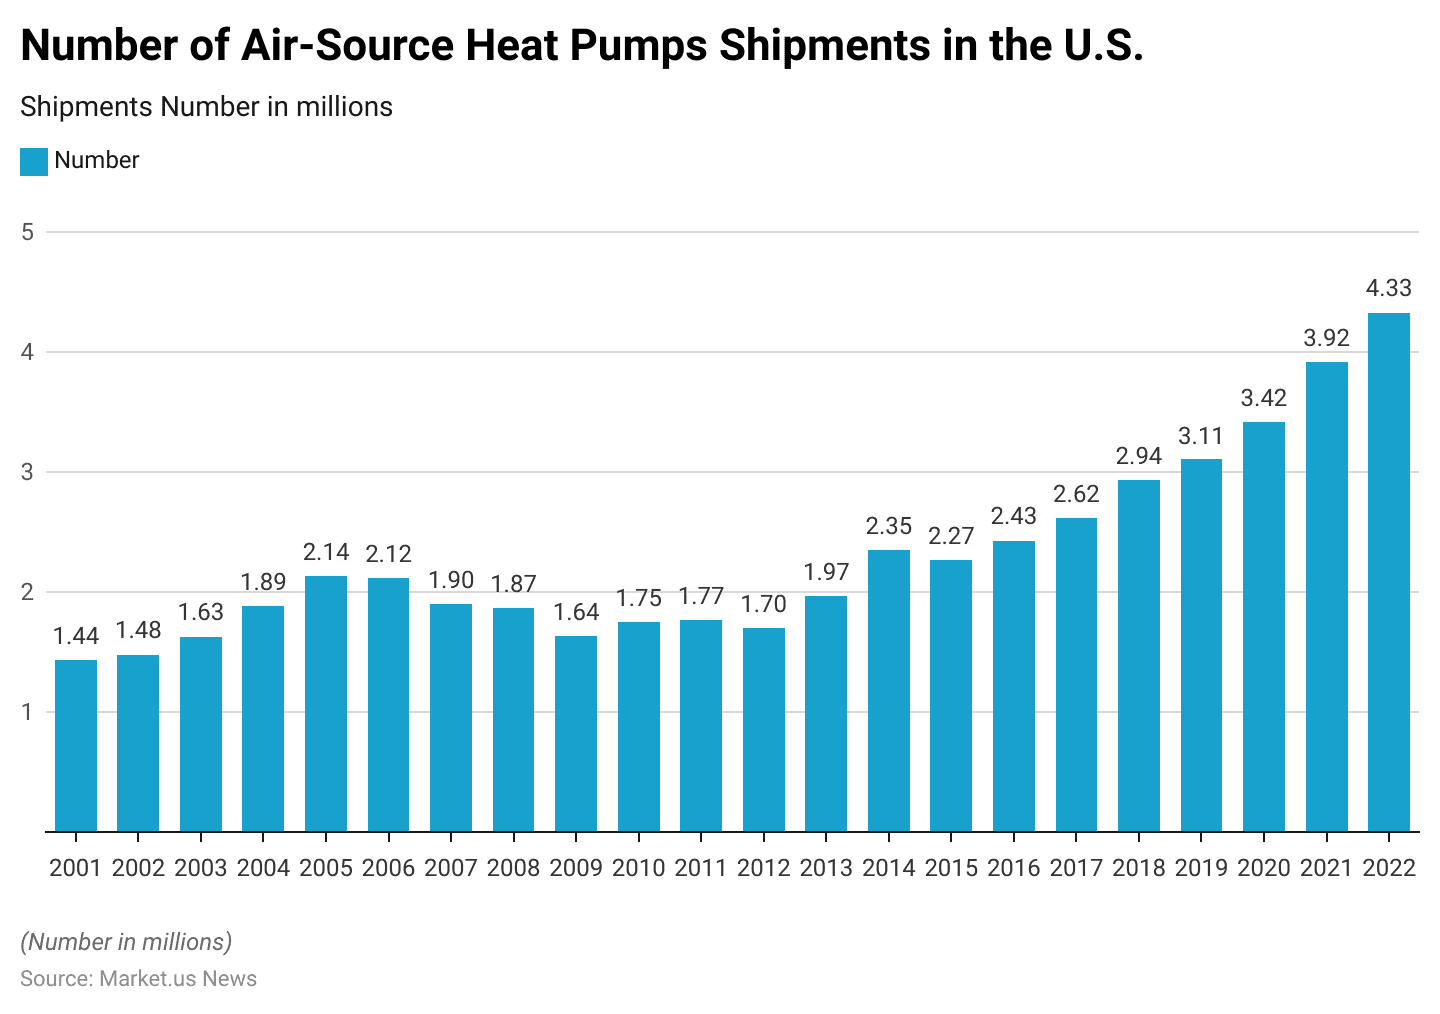
- From 2001 to 2022, the total air-source heat pump shipments in the United States showed a steady upward trend.
- In 2001, shipments totaled 1.44 million units, increasing to 1.48 million in 2002 and 1.63 million in 2003.
- The market continued to grow, reaching 1.89 million units in 2004 and surpassing 2 million shipments in 2005 with 2.14 million units.
- A slight decline followed, with 2.12 million shipments in 2006 and 1.9 million in 2007.
- The downward trend persisted through 2008 and 2009, with shipments decreasing to 1.87 million and 1.64 million, respectively.
- In 2010, the market began to recover, with 1.75 million shipments, followed by a gradual increase to 1.77 million in 2011 and a slight decline to 1.7 million in 2012.
- By 2013, shipments rose to 1.97 million, and the growth accelerated in the following years, reaching 2.35 million units in 2014 and 2.27 million in 2015.
- The trend continued, with 2.43 million units shipped in 2016, 2.62 million in 2017, and 2.94 million in 2018.
- From 2019 onwards, shipments exceeded 3 million units, with 3.11 million units shipped in 2019, increasing to 3.42 million in 2020.
- In 2021, shipments surged to 3.92 million units, and by 2022, they reached a record high of 4.33 million units, marking sustained growth over the two decades.
(Source: Statista)
Air-Source Heat Pumps and Air-Furnaces Shipments Statistics
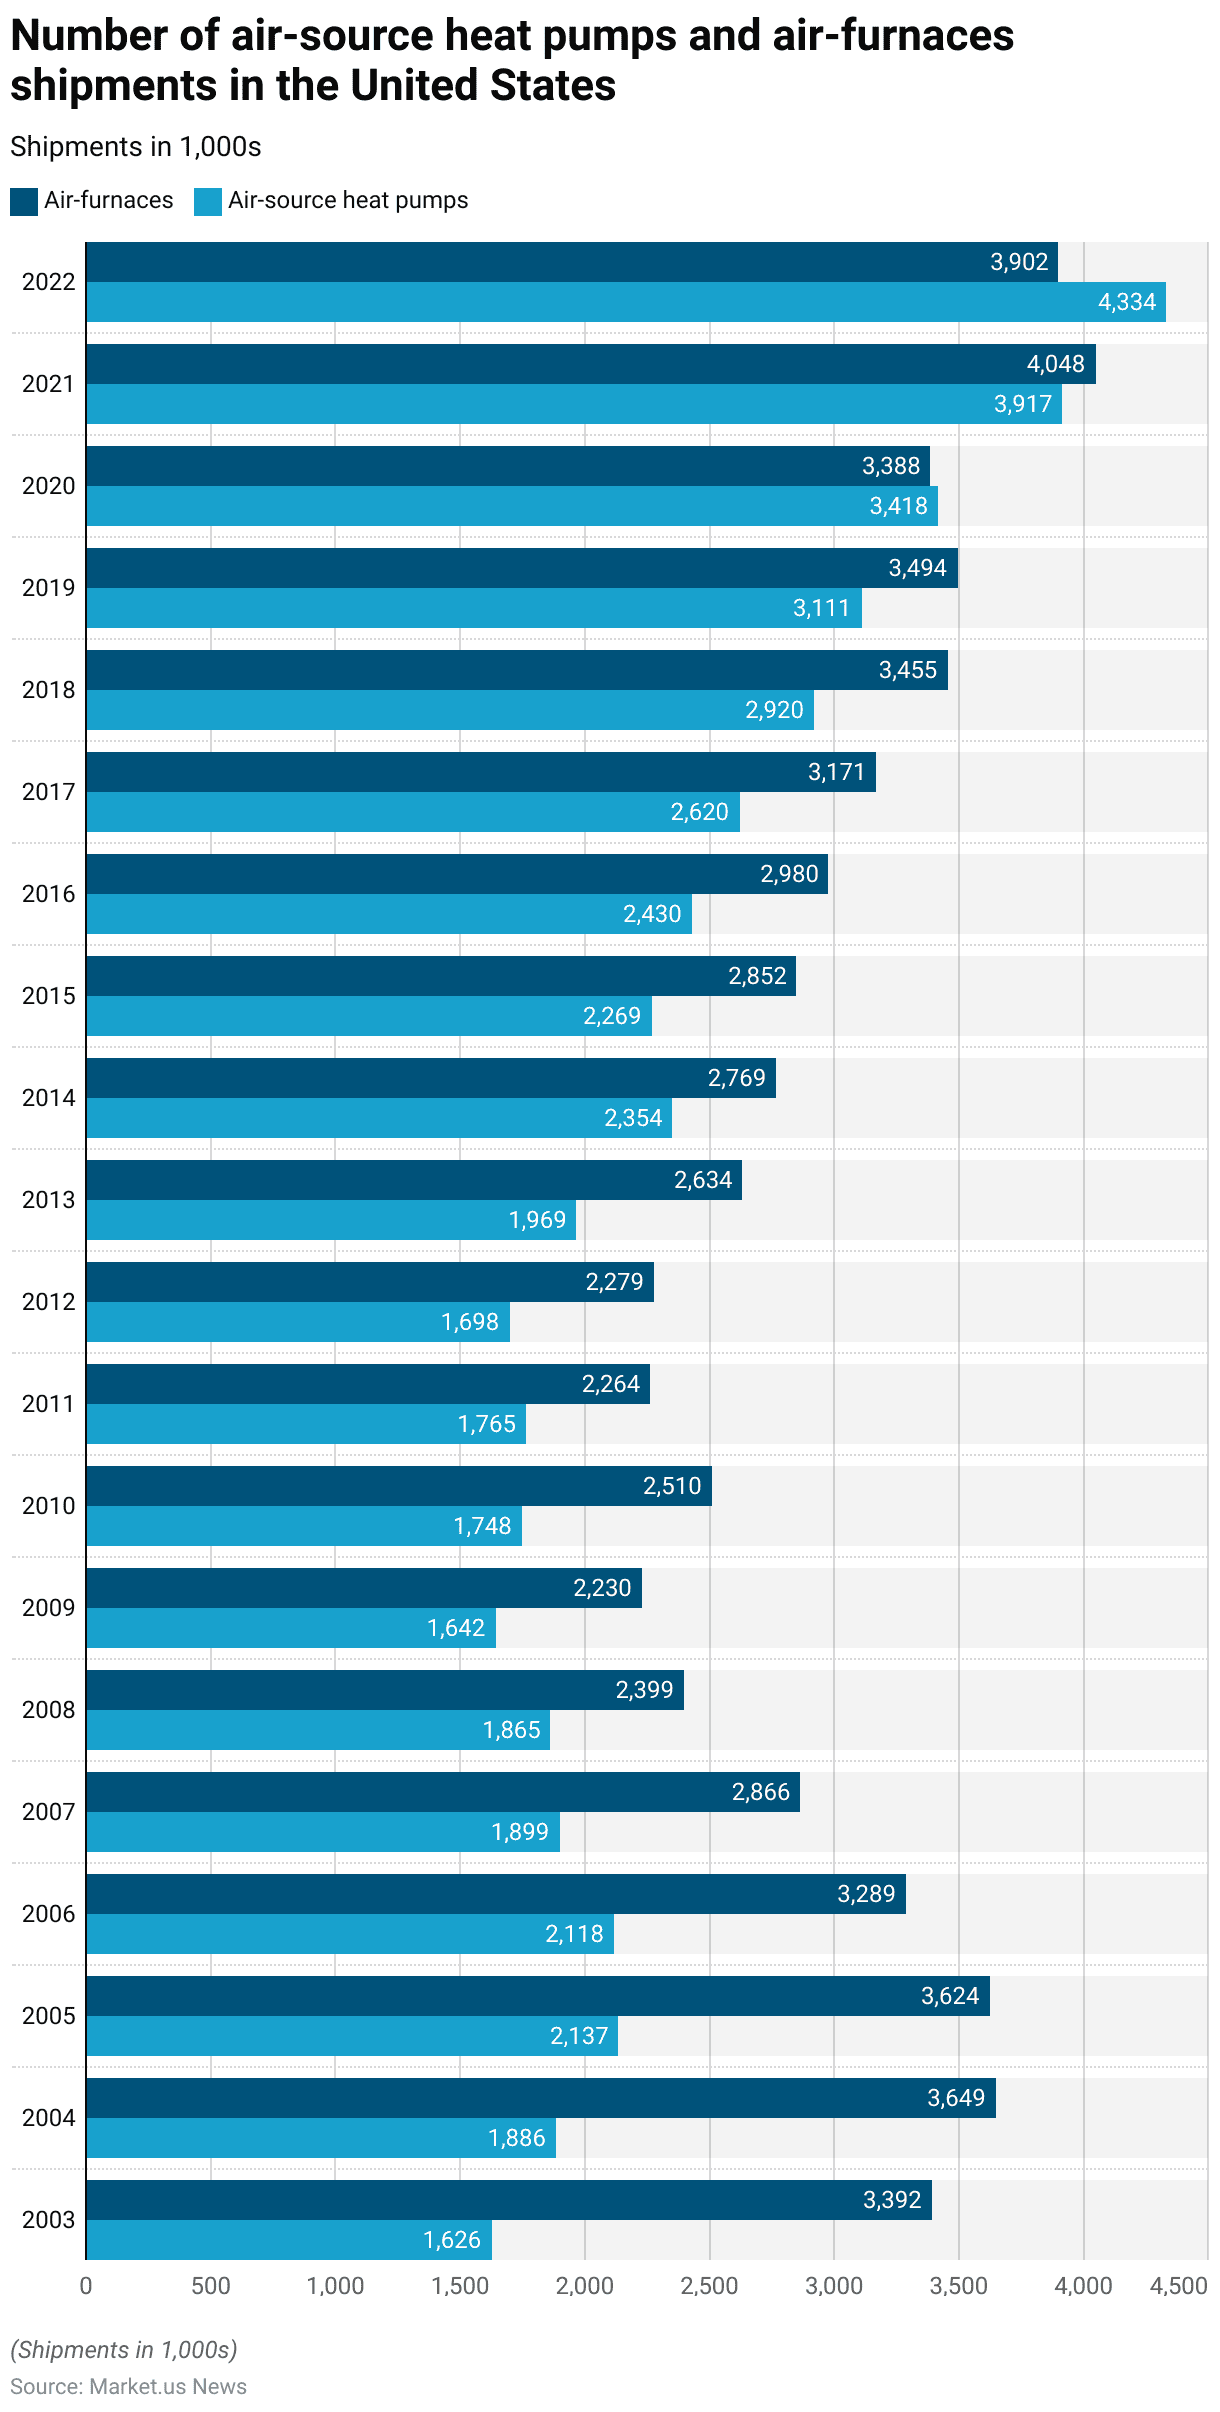
- From 2003 to 2022, the shipments of air-source heat pumps and air furnaces in the United States demonstrated varying trends.
- In 2003, air furnace shipments stood at 3.39 million units, while air-source heat pumps accounted for 1.63 million units.
- Over the years, air furnace shipments fluctuated, reaching a peak of 3.65 million units in 2004 before experiencing a gradual decline in the following years, bottoming out at 2.23 million units in 2009.
- This trend reversed, with air-furnace shipments recovering to 4.05 million units by 2021 before decreasing slightly to 3.90 million units in 2022.
- In contrast, air-source heat pump shipments experienced steady growth during this period. Starting at 1.63 million units in 2003, shipments increased annually, peaking at 4.33 million units in 2022.
- Notable milestones include surpassing 2 million units in 2005, reaching 2.92 million units in 2018, and exceeding 3 million units in 2019.
- The market for air-source heat pumps continued to expand rapidly, outpacing air-furnaces in 2020 with 3.42 million units compared to 3.39 million air-furnaces.
- By 2022, air-source heat pump shipments had significantly overtaken air furnaces, reflecting a growing preference for this technology.
(Source: Statista)
Geothermal Heat Pump Statistics
Sales Volume of Geothermal Heat Pumps in the United Kingdom Statistics
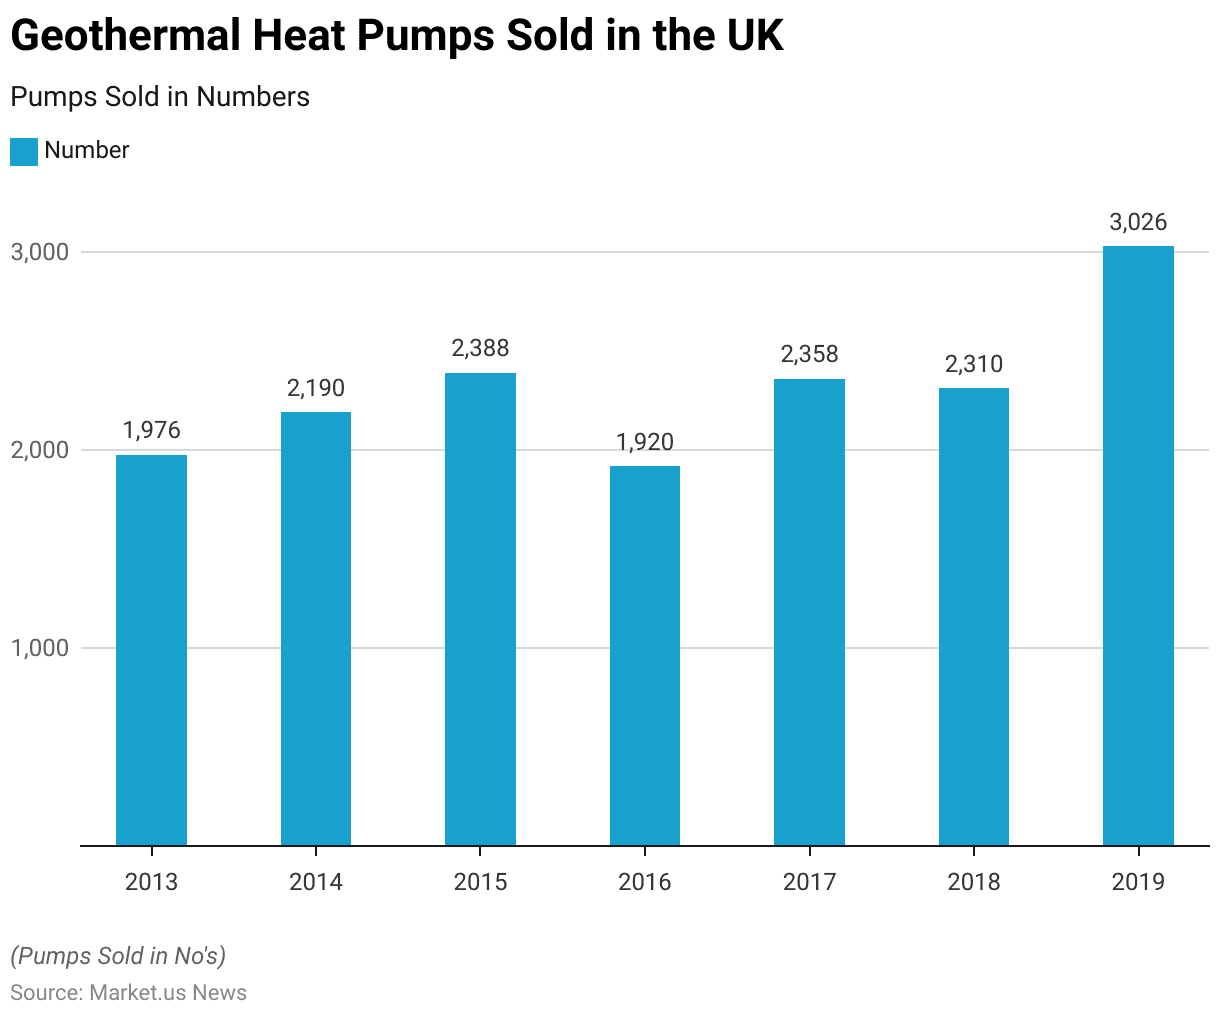
- The sales volume of geothermal heat pumps in the United Kingdom saw fluctuations between 2013 and 2019.
- In 2013, a total of 1,976 geothermal heat pumps were sold, with an increase to 2,190 units in 2014.
- This upward trend continued in 2015, with sales reaching 2,388 units.
- However, there was a decline in 2016, as sales dropped to 1,920 units.
- The market rebounded in the following years, with 2,358 units sold in 2017 and 2,310 units in 2018.
- By 2019, geothermal heat pump sales saw a significant increase, reaching 3,026 units, marking the highest sales volume in this period.
(Source: Statista)
Sales Volume of Geothermal Heat Pumps in Germany Statistics
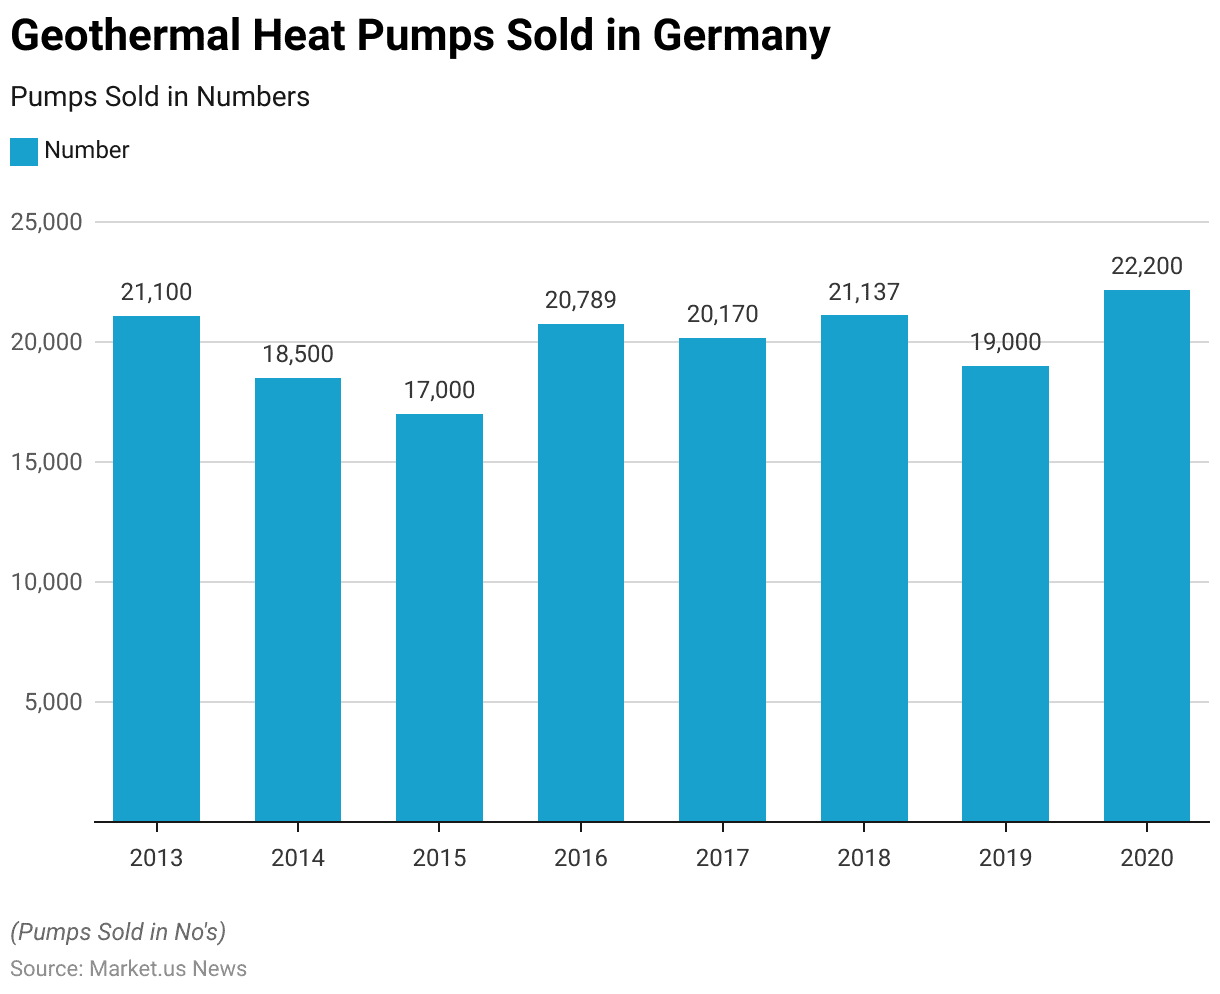
- Geothermal heat pump sales in Germany fluctuated between 2013 and 2020.
- In 2013, 21,100 units were sold, but sales dropped to 18,500 units in 2014 and further to 17,000 units in 2015.
- The market rebounded in 2016, with 20,789 units sold, followed by a slight decrease to 20,170 units in 2017.
- In 2018, sales increased again to 21,137 units before falling to 19,000 units in 2019.
- However, by 2020, geothermal heat pump sales in Germany reached their highest point during this period, with 22,200 units sold.
(Source: Statista)
Key Export Statistics
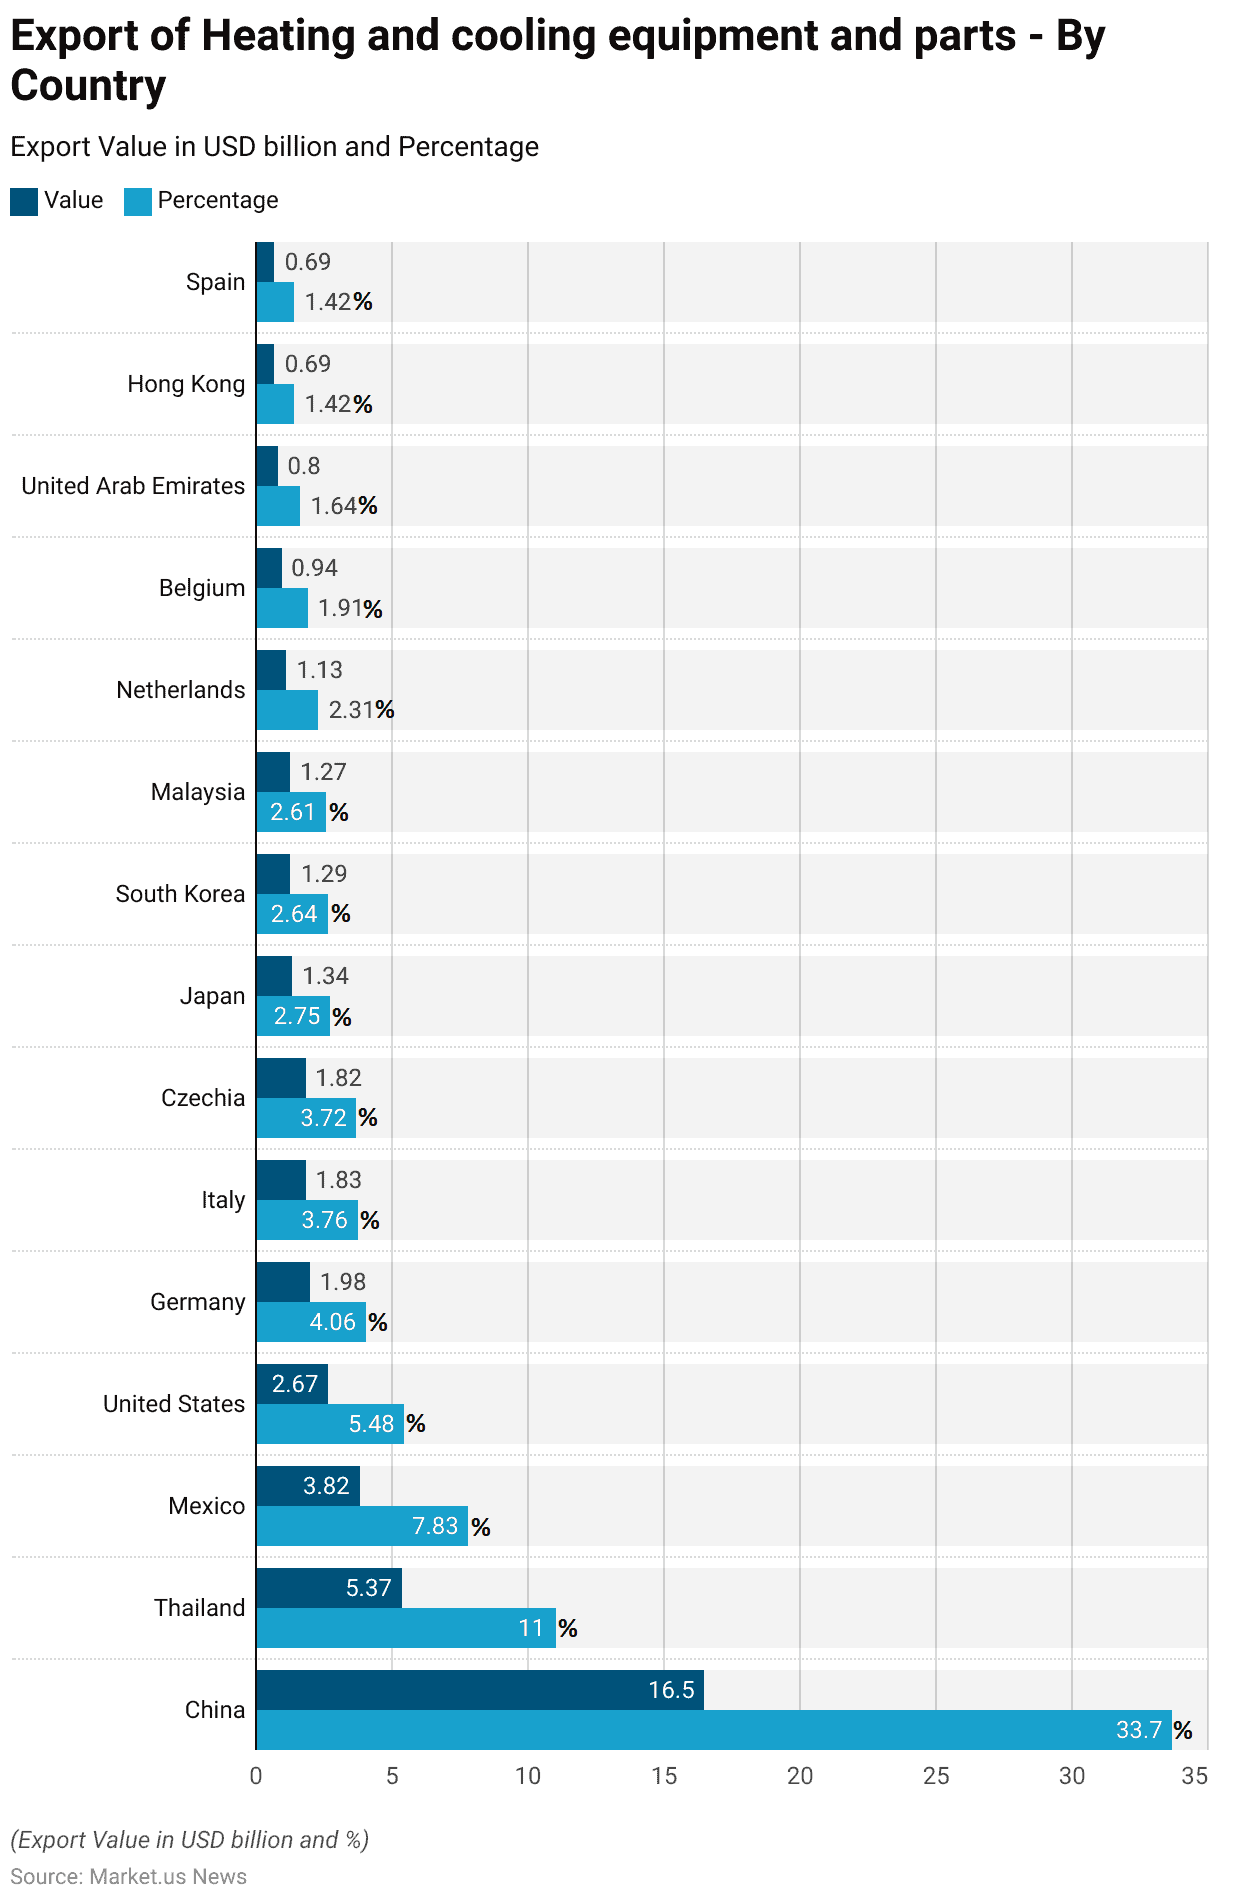
- In 2018, China was the largest exporter of heating and cooling equipment and parts, with an export value of USD 16.5 billion, representing 33.7% of the global market.
- Thailand followed with USD 5.37 billion in exports, accounting for 11% of the total.
- Mexico ranked third, with exports totaling USD 3.82 billion, or 7.83%.
- The United States exported USD 2.67 billion worth of equipment, capturing 5.48% of the market.
- Germany contributed USD 1.98 billion in exports, representing 4.06%, while Italy and Czechia each exported around USD 1.83 billion, holding 3.76% and 3.72% shares, respectively.
- Japan’s exports were valued at USD 1.34 billion, making up 2.75%, and South Korea followed closely with USD 1.29 billion, or 2.64%.
- Malaysia, the Netherlands, and Belgium each held between 1.91% and 2.61% of the market.
- At the same time, the United Arab Emirates, Hong Kong, and Spain each accounted for about 1.42% to 1.64% of the global export value.
(Source: The Observatory of Economic Complexity)
Key Import Statistics
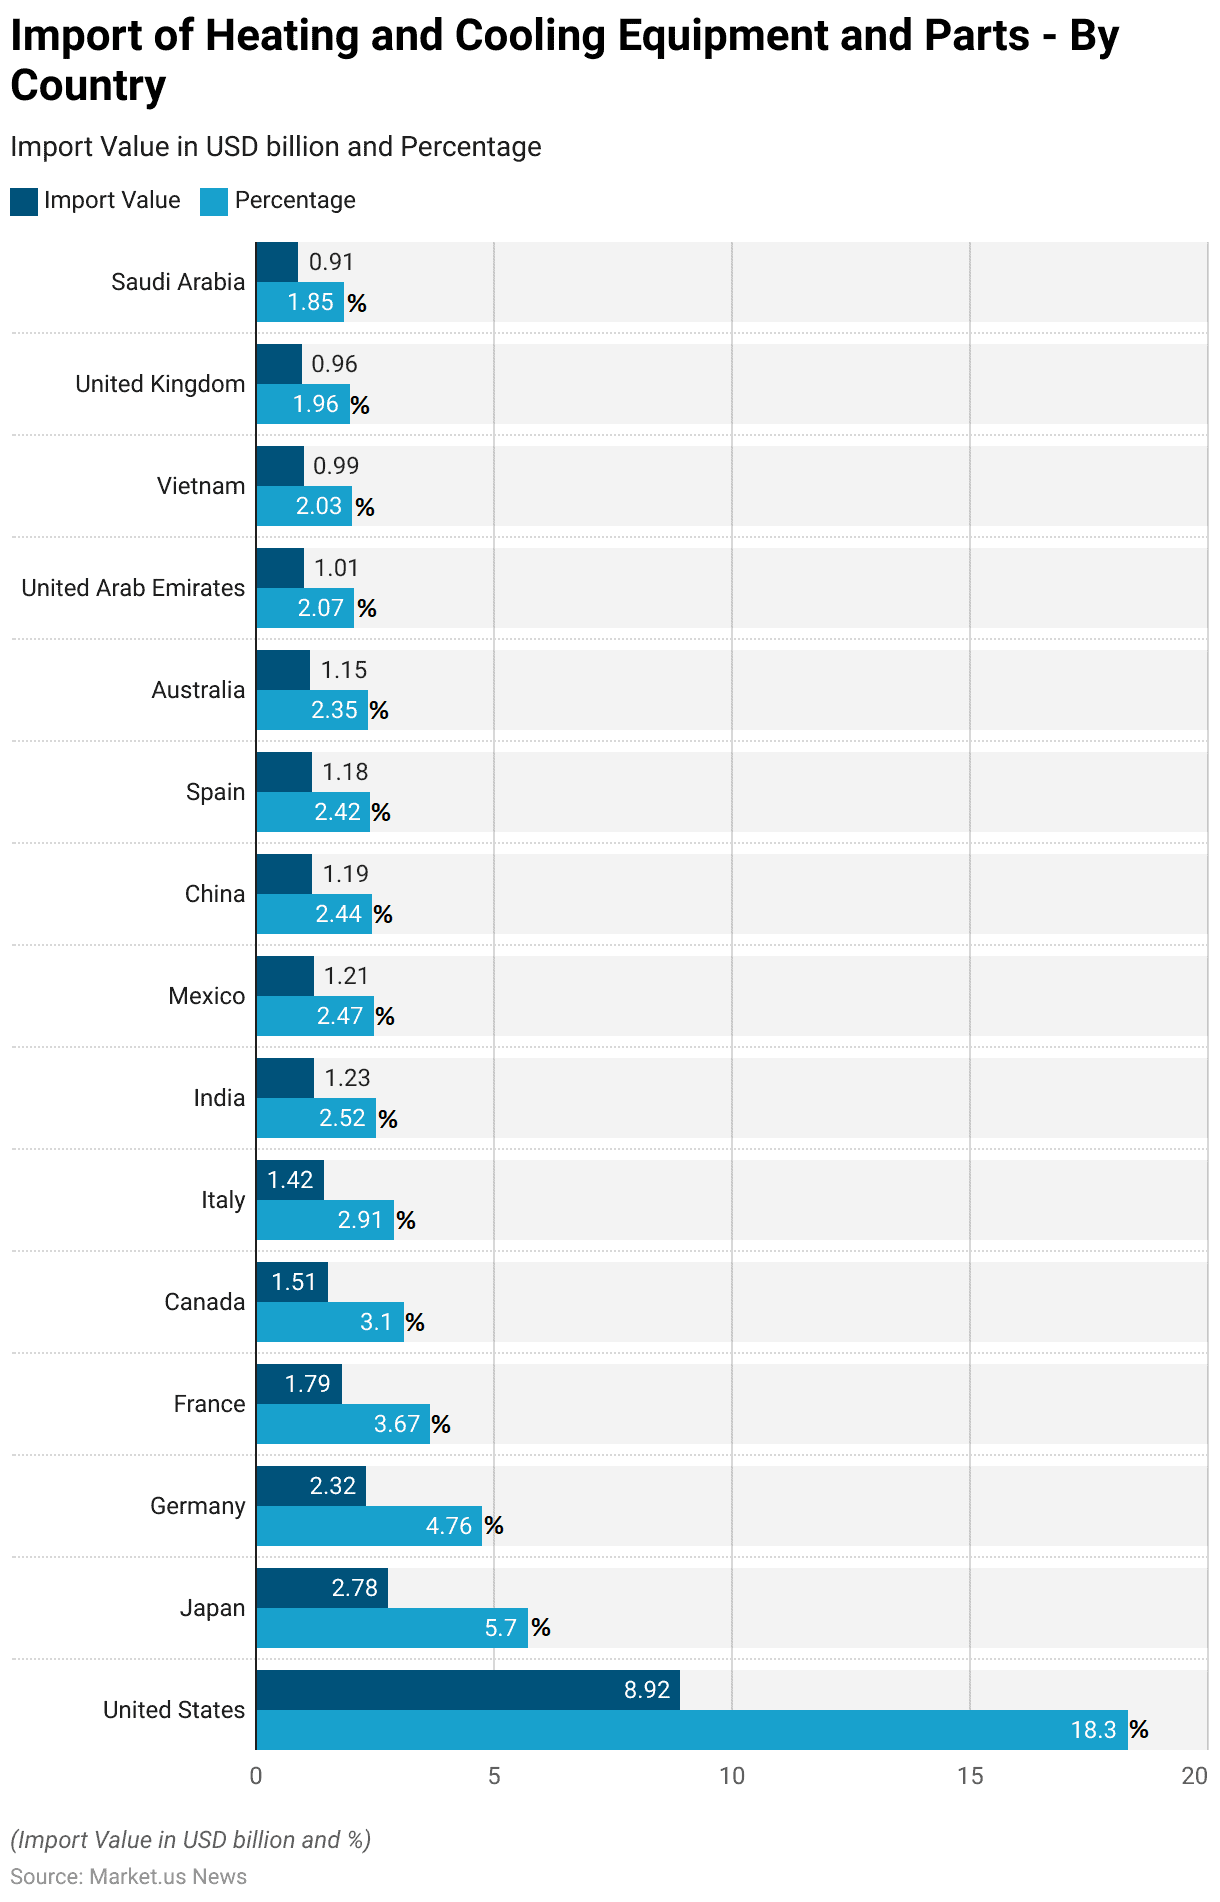
- In 2018, the United States was the largest importer of heating and cooling equipment and parts, with an import value of USD 8.92 billion, accounting for 18.3% of the global market.
- Japan followed with USD 2.78 billion, representing 5.7%, while Germany imported USD 2.32 billion, or 4.76% of the total.
- France imported USD 1.79 billion (3.67%), and Canada brought in USD 1.51 billion (3.1%).
- Italy’s imports amounted to USD 1.42 billion, representing 2.91%, and India followed with USD 1.23 billion (2.52%).
- Mexico and China each imported around USD 1.21 billion and USD 1.19 billion, accounting for 2.47% and 2.44% of global imports, respectively.
- Spain and Australia imported USD 1.18 billion (2.42%) and USD 1.15 billion (2.35%), respectively.
- Further, other notable importers included the United Arab Emirates with USD 1.01 billion (2.07%), Vietnam at USD 0.992 billion (2.03%), the United Kingdom with USD 0.957 billion (1.96%), and Saudi Arabia with USD 0.905 billion (1.85%).
(Source: The Observatory of Economic Complexity)
Heat Pumps Cost Statistics
Cost Comparison of Air Source and Ground Source Heat Pumps
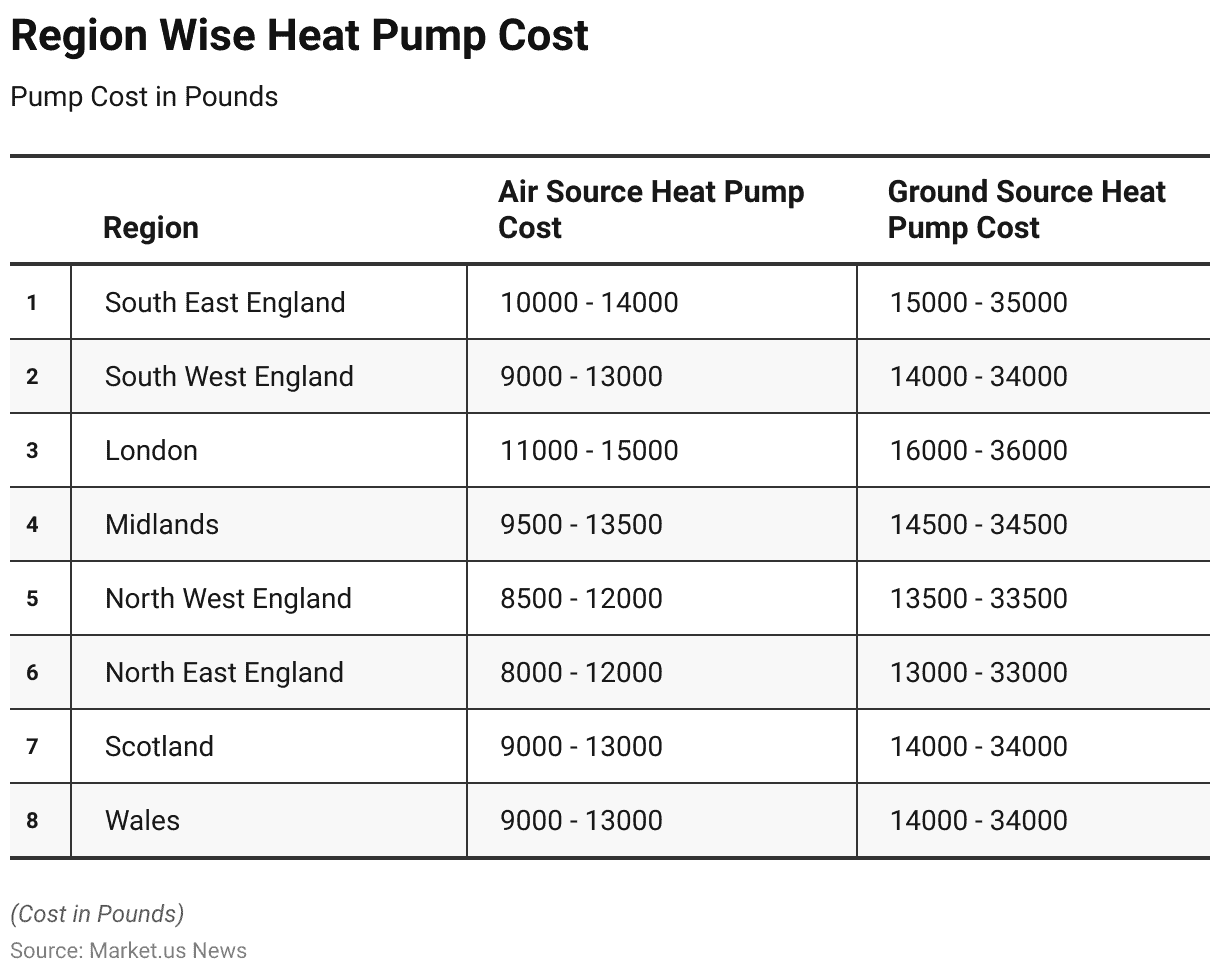
- The cost of air-source and ground-source heat pumps varies across different regions in the UK.
- In the South East of England, air-source heat pumps range from £10,000 to £14,000, while ground-source heat pumps are priced between £15,000 and £35,000.
- In the South West, air-source heat pumps cost between £9,000 and £13,000, with ground-source options ranging from £14,000 to £34,000.
- In London, air-source heat pumps are more expensive, ranging from £11,000 to £15,000, while ground-source heat pumps are priced between £16,000 and £36,000.
- In the Midlands, air-source heat pump costs range from £9,500 to £13,500, while ground-source options are priced between £14,500 and £34,500.
- In the North West, air-source heat pumps cost between £8,500 and £12,500, with ground-source heat pumps priced from £13,500 to £33,500.
- In the North East, air-source heat pumps are slightly more affordable, ranging from £8,000 to £12,000, while ground-source heat pumps cost between £13,000 and £33,000.
- In Scotland and Wales, the costs are similar, with air-source heat pumps priced between £9,000 and £13,000 and ground-source heat pumps ranging from £14,000 to £34,000 in both regions.
- These figures highlight the regional differences in the cost of heat pump installation across the UK.
(Source: green match)
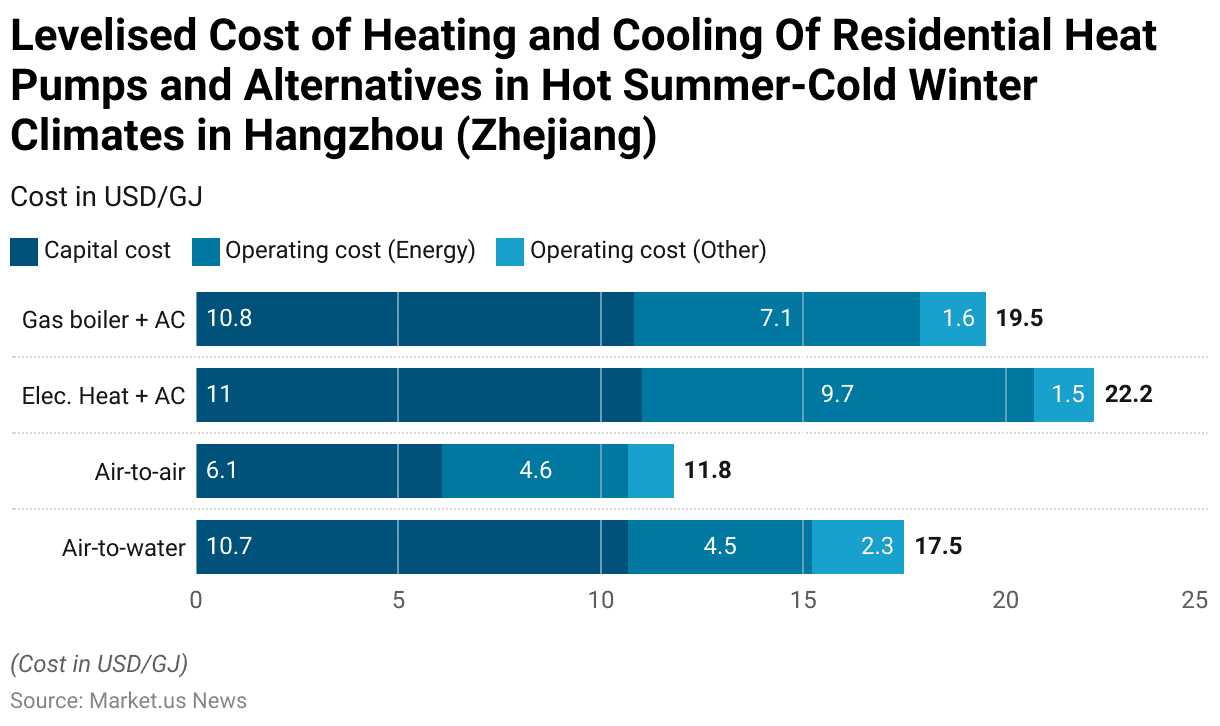
Levelised Cost of Heating and Cooling of Residential Heat Pumps and Alternatives in Hot Summer-Cold Winter Climates in Hangzhou (Zhejiang)
- The levelized cost of heating and cooling for residential heat pumps and alternatives in hot summer-cold winter climates in Hangzhou (Zhejiang) varies across different systems.
- Air-to-water heat pumps have a capital cost of USD 10.7 per GJ, with operating costs of USD 4.5 for energy and USD 2.3 for other expenses.
- Air-to-air heat pumps have a lower capital cost of USD 6.1, with operating costs of USD 4.6 for energy and USD 1.1 for other costs.
- Electric heating systems combined with air conditioning incur the highest costs, with a capital cost of USD 11.0, operating energy costs of USD 9.7, and USD 1.5 for other costs.
- Gas boilers paired with air conditioning have a capital cost of USD 10.8, along with operating costs of USD 7.1 for energy and USD 1.6 for other expenses.
- These figures illustrate the cost differences between various heating and cooling systems in such climates.
(Source: International Energy Agency)
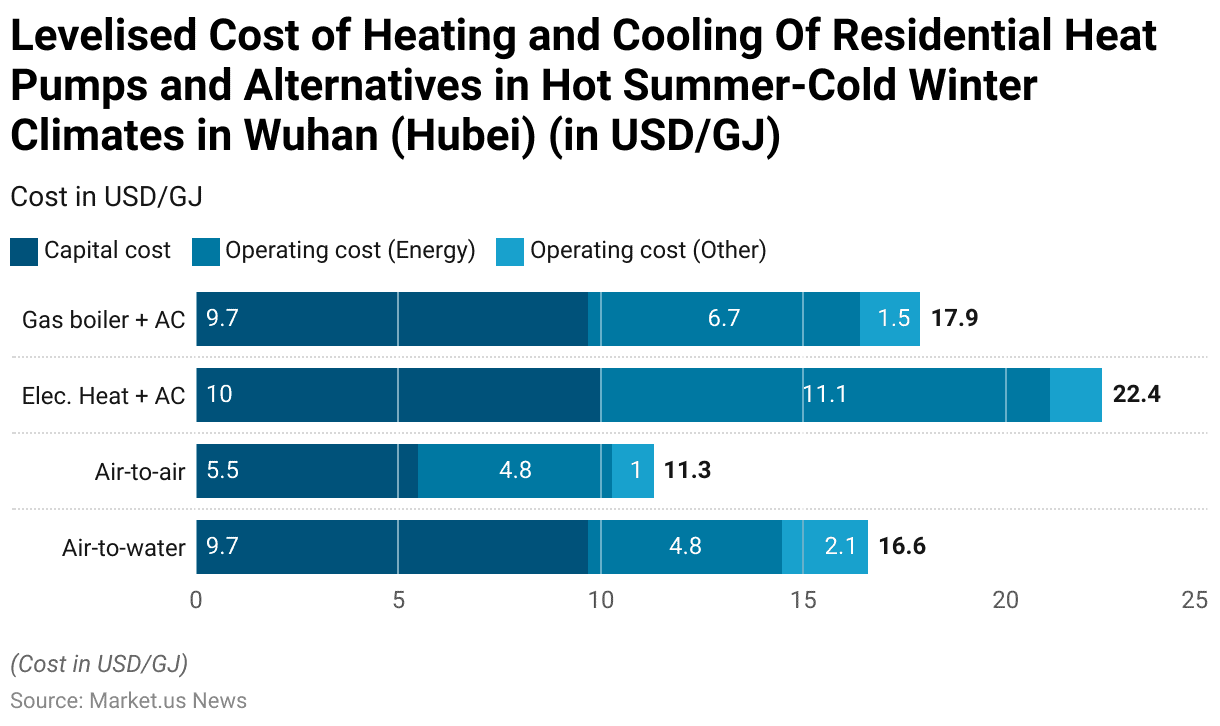
Levelised Cost of Heating and Cooling of Residential Heat Pumps and Alternatives in Hot Summer-Cold Winter Climates in Wuhan (Hubei)
- In hot summer-cold winter climates in Wuhan (Hubei), the levelized cost of heating and cooling for residential systems varies depending on the technology used.
- Air-to-water heat pumps have a capital cost of USD 9.7 per GJ, with operating costs of USD 4.8 for energy and USD 2.1 for other costs.
- Air-to-air heat pumps are more affordable, with a capital cost of USD 5.5 and, operating costs of USD 4.8 for energy and USD 1.0 for other expenses.
- Electric heating systems combined with air conditioning carry the highest operating energy cost, with a capital cost of USD 10.0, energy costs of USD 11.1, and other costs of USD 1.3.
- Gas boilers paired with air conditioning have a capital cost of USD 9.7, with energy costs of USD 6.7 and other costs amounting to USD 1.5.
- These figures highlight the cost-effectiveness of different heating and cooling solutions in this specific climate.
(Source: International Energy Agency)
Heat Pump Efficiency Statistics
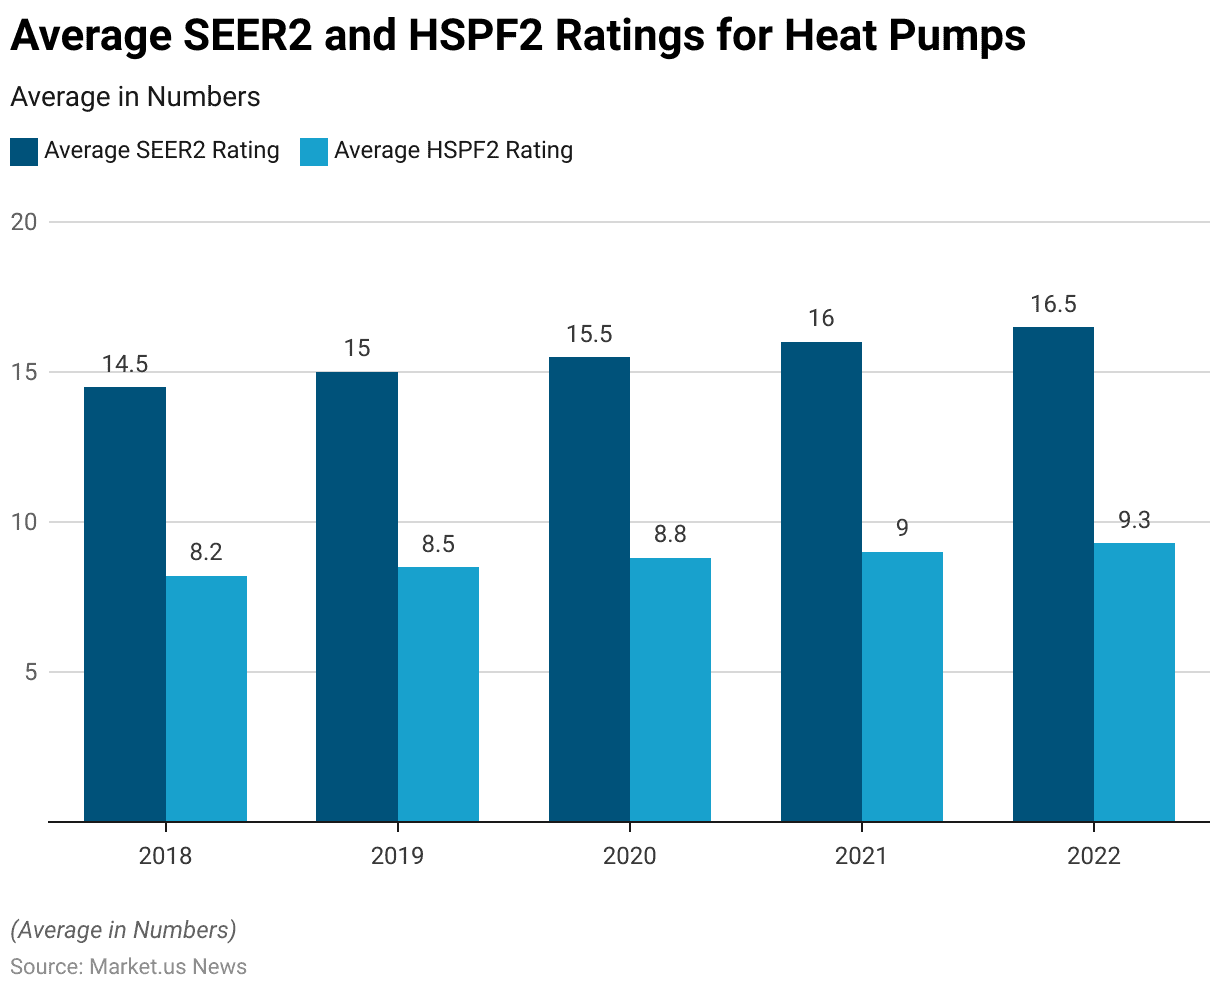
SEER2 and HSPF2 Ratings
- The average SEER2 and HSPF2 ratings for heat pumps have shown a steady increase from 2018 to 2022.
- In 2018, the average SEER2 rating was 14.5, with an average HSPF2 rating of 8.2.
- By 2019, these figures had risen to 15 and 8.5, respectively.
- The upward trend continued in 2020, with the average SEER2 reaching 15.5 and the HSPF2 increasing to 8.8.
- In 2021, the average SEER2 rating grew to 16, while the HSPF2 rating rose to 9.
- Finally, in 2022, the average SEER2 rating reached 16.5, with the HSPF2 rating increasing to 9.3.
- This consistent improvement reflects advancements in heat pump efficiency over the years.
(Source: The SEER2 Guide)
Energy Efficiency of Heating Pumps Compared to Conventional Heating Technologies
- In terms of energy efficiency, heat pumps significantly outperform conventional heating technologies such as high-efficiency gas boilers.
- A high-efficiency gas boiler operates with an energy efficiency of around 90%, meaning it converts 90% of the energy consumed into heat.
- In contrast, modern heat pumps, such as those with an HSPF2 rating of 9.3 (as of 2022), can achieve energy efficiency levels exceeding 200%.
- Further, it means that for every unit of electricity consumed, the heat pump produces more than twice the amount of heat, making it a far more efficient option for heating compared to conventional gas boilers.
(Source: International Energy Agency)
Key Investment Statistics
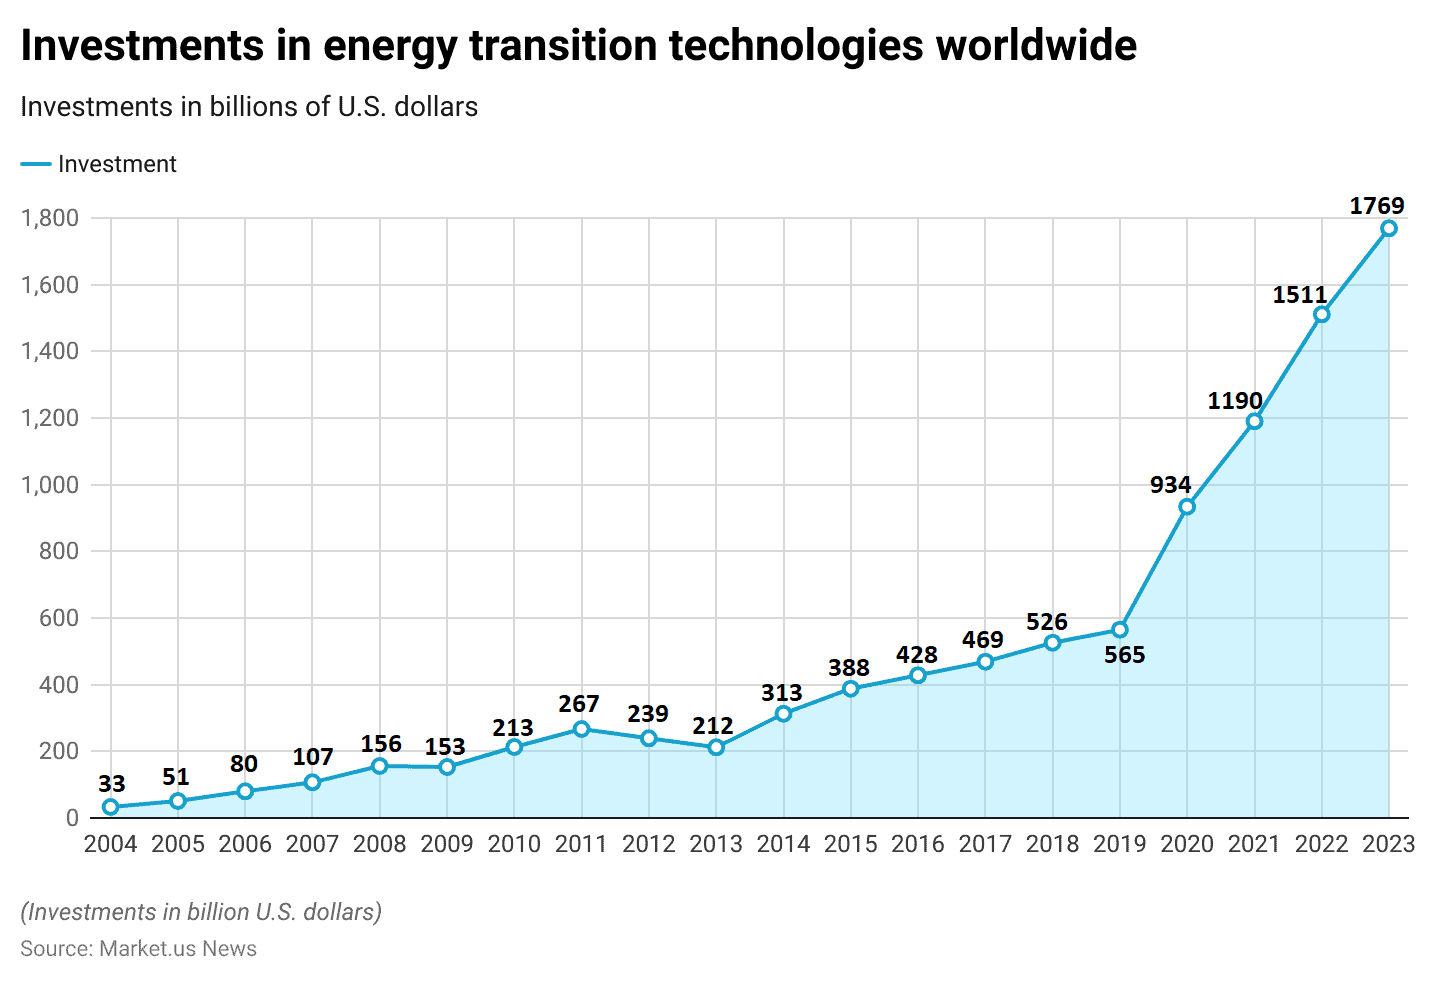
Investments in Energy Transition Technologies Worldwide
- Global investments in energy transition technologies have seen a remarkable increase between 2004 and 2023.
- In 2004, investments amounted to USD 33 billion, which steadily grew to USD 51 billion in 2005 and USD 80 billion in 2006.
- By 2007, investments had risen to USD 107 billion, continuing to increase to USD 156 billion in 2008 and USD 153 billion in 2009.
- The following years saw further growth, with USD 213 billion invested in 2010, USD 267 billion in 2011, and USD 239 billion in 2012.
- From 2013 to 2015, investments fluctuated slightly, with USD 212 billion in 2013, USD 313 billion in 2014, and USD 388 billion in 2015.
- Meanwhile, investments continued to rise in subsequent years, reaching USD 428 billion in 2016, USD 469 billion in 2017, and USD 526 billion in 2018. By 2019, investments had grown to USD 565 billion.
- The most significant increases occurred in the 2020s. In 2020, investments jumped to USD 934 billion, followed by a substantial rise to USD 1,190 billion in 2021.
- This upward trend continued, with USD 1,511 billion invested in 2022 and a projected USD 1,769 billion in 2023.
- This data highlights the growing commitment to energy transition technologies worldwide over the past two decades.
(Source: Statista)
Leading Countries for Electrified Heat Investments
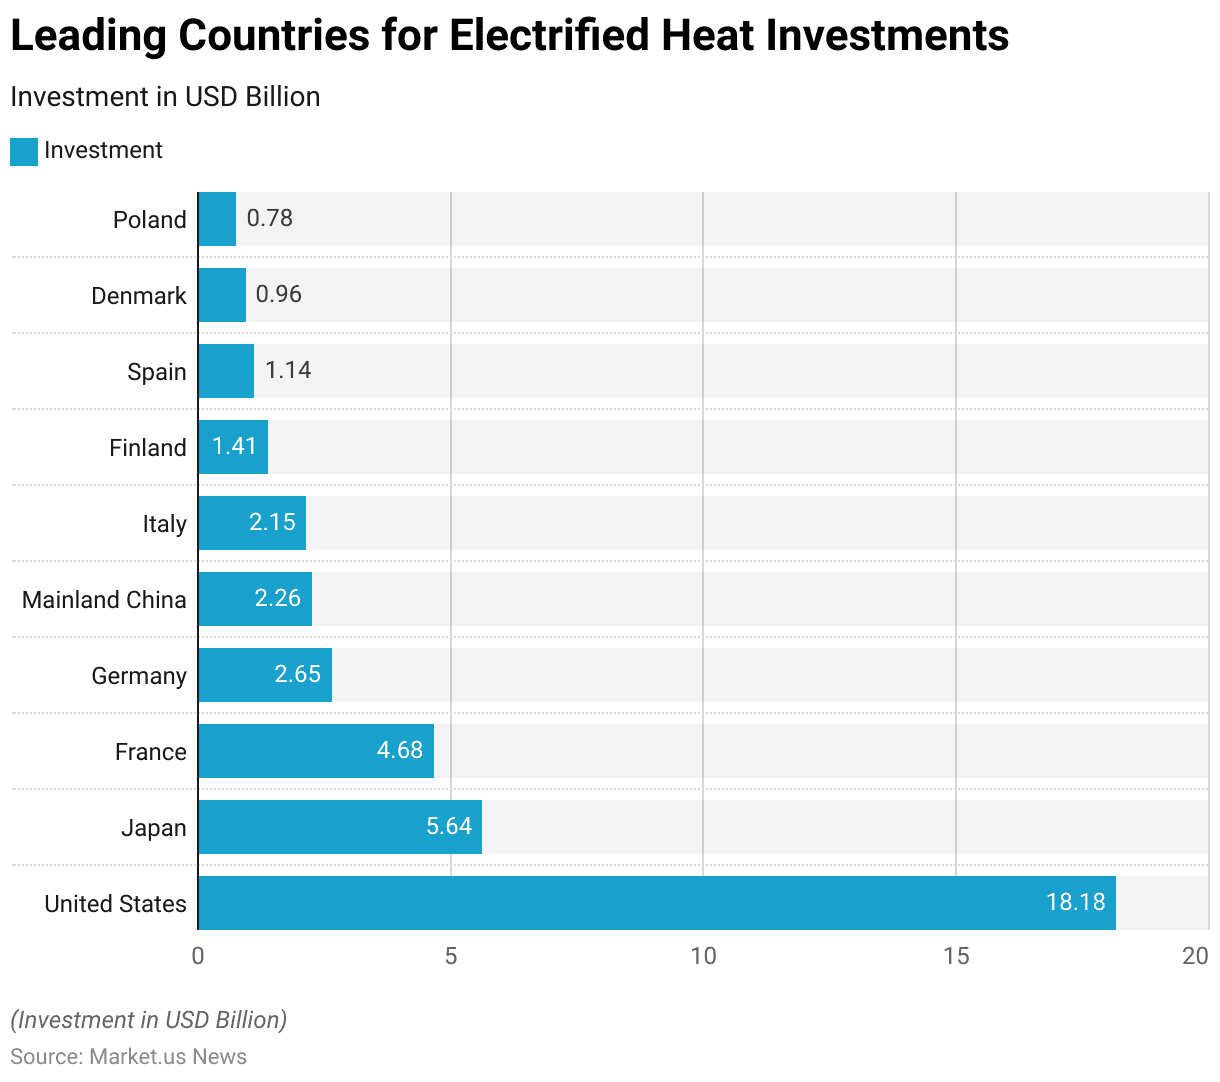
- In 2021, the United States led global electrified heat investments, with a total of USD 18.18 billion, making it the largest contributor.
- Japan followed with USD 5.64 billion in investments, while France invested USD 4.68 billion in electrified heat technologies.
- Germany contributed USD 2.65 billion, and Mainland China invested USD 2.26 billion.
- Italy followed closely with USD 2.15 billion. Finland invested USD 1.41 billion, while Spain contributed USD 1.14 billion.
- Denmark’s investments reached USD 0.96 billion, and Poland rounded out the list with USD 0.78 billion in electrified heat investments.
- This data highlights the global focus on electrification of heating, with the United States playing a leading role.
(Source: Statista)
Transforming Energy Scenario Cumulative Investments Worldwide
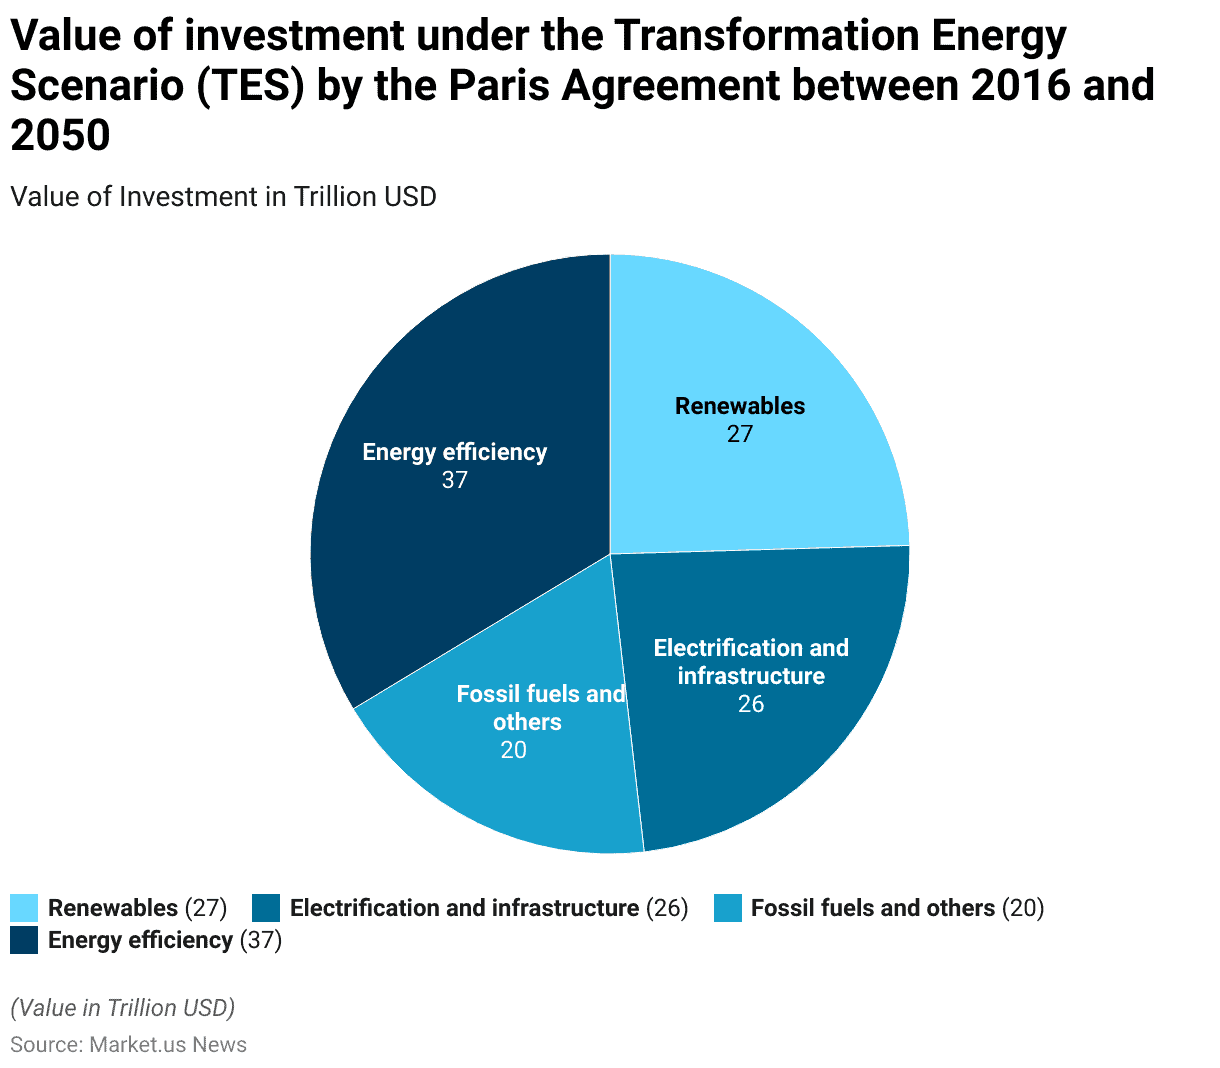
- Further, Under the Transformation Energy Scenario (TES) in alignment with the Paris Agreement, global investments between 2016 and 2050 are expected to reach significant levels across various sectors.
- Investments in renewables are projected to total USD 27 trillion, while electrification and infrastructure will see USD 26 trillion in investments.
- Fossil fuels and other related areas are expected to attract USD 20 trillion.
- The largest investment will be in energy efficiency, amounting to USD 37 trillion.
- These figures highlight the substantial financial commitment required to meet global climate goals and transition to a sustainable energy future.
(Source: Statista)
Environmental Impact
Annual Emissions of Heat Pump Water Heater & Gas Tank Water Heater Units Statistics
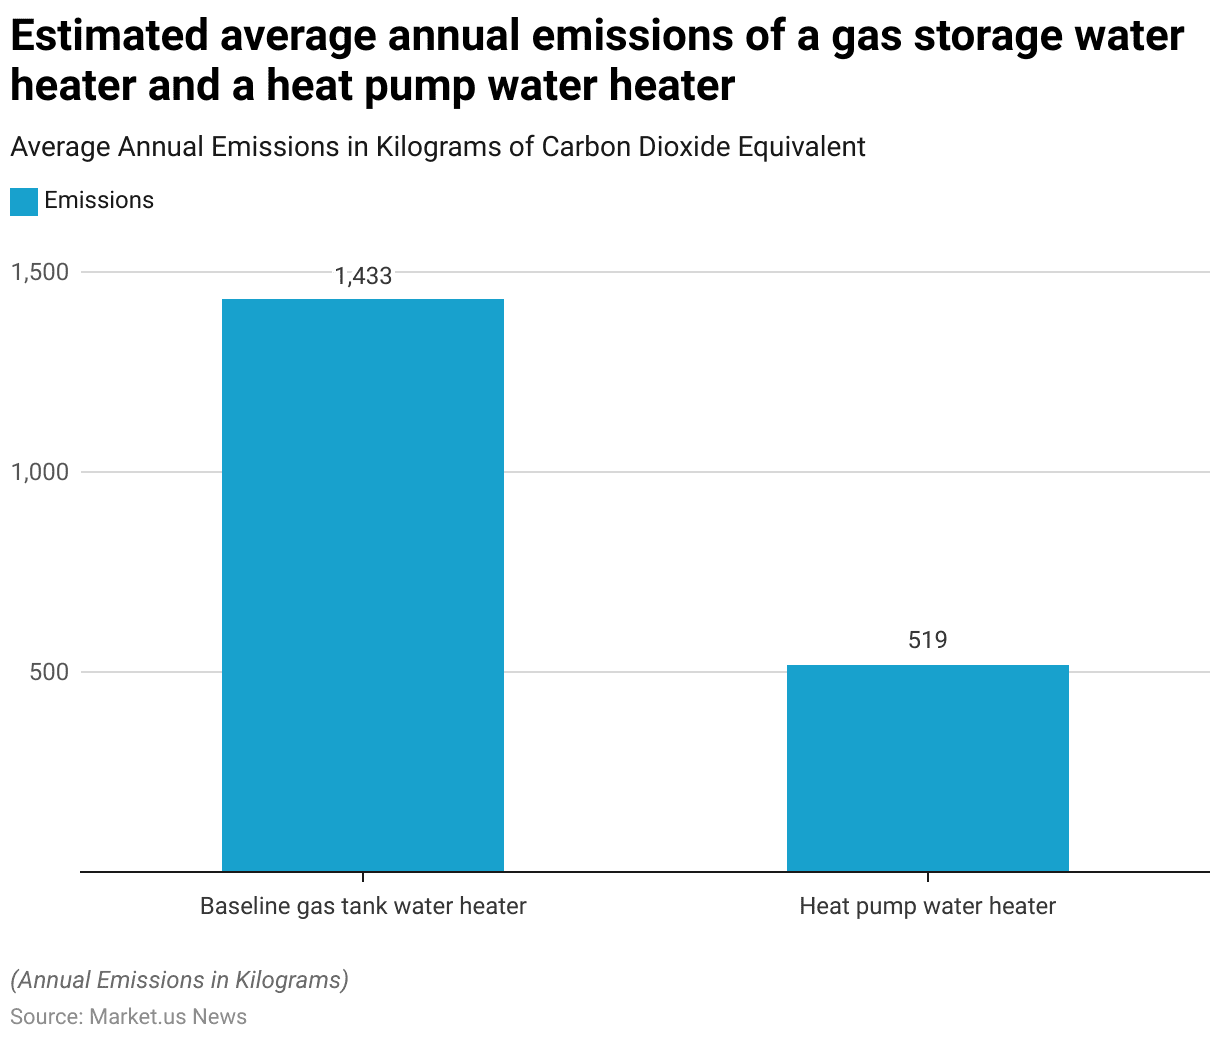
- As of 2023, the estimated average annual emissions from a baseline gas tank water heater are significantly higher than those of a heat pump water heater.
- Moreover, a gas tank water heater emits approximately 1,433 kilograms of carbon dioxide equivalent per unit each year, while a heat pump water heater produces just 519 kilograms of carbon dioxide equivalent annually.
- This demonstrates the substantial environmental benefits of using heat pump technology, which generates less than half the emissions of conventional gas water heaters.
(Source: Statista)
Carbon Emissions Reduction of Buildings by Replacing Gas Furnaces with Heat Pump Statistics
- In 2021, replacing gas furnaces with heat pumps in buildings across the United States resulted in significant carbon emissions reductions, both on day one and over a 15-year lifespan, with variations depending on the state.
- In California, emissions could be reduced by 92% over 15 years and 72% on day one. Florida saw reductions of 79% over 15 years and 60% on day one, while Texas achieved 86% and 57%, respectively.
- Arizona recorded 80% over 15 years and 54% on day one, with Nevada close behind at 73% and 54%.
- Further, other notable states include Washington, which saw a 90% reduction over 15 years and 52% on day one, and New York, where reductions reached 84% over 15 years and 41% on day one.
- Further, Vermont showed a 75% reduction over 15 years and 52% on day one, and Oregon achieved 85% and 41%. In states such as Georgia, Alabama, and South Carolina, the reductions were around 70% over 15 years and 40% on day one.
More Insights
- In the Midwest, Iowa reduced emissions by 72% over 15 years and 45% on day one, while Minnesota achieved 73% and 34%.
- Other states, such as Kentucky, Oklahoma, and Pennsylvania, saw reductions of approximately 60% over 15 years and 30-39% on day one.
- In the northeastern United States, Rhode Island reduced emissions by 79% over 15 years and 27% on day one, while Massachusetts achieved 66% and 25%.
- Overall, states with higher renewable energy contributions saw greater reductions, with states such as Wyoming, Ohio, Indiana, and Wisconsin achieving smaller immediate reductions, ranging from 12% to 15% on day one, and larger reductions, between 56% and 67%, over 15 years.
- Moreover, these figures demonstrate the considerable potential for carbon emissions reduction through heat pump adoption across the US, with varying impacts depending on the state’s energy mix and climate.
(Source: Statista)

Regulations for Heat Pumps
- Heat pump regulations vary significantly by country, influenced by energy efficiency goals and decarbonization strategies.
- Overall, In the US, new regulations introduced in 2023 by the Department of Energy increased the minimum efficiency standards for split-system heat pumps to a 15 SEER (Seasonal Energy Efficiency Ratio) and an 8.8 HSPF (Heating Seasonal Performance Factor) nationwide.
- Meanwhile, the European Union is driving aggressive heat pump adoption under the Green Deal and REPowerEU plans, aiming to phase out gas boilers by 2029, with a target of 30 million additional heat pumps by 2030.
- In Washington State, new legislation requires heat pumps in all new homes starting from 2023, a move to curb carbon emissions from fossil-fuel-based heating.
- These policies are supported by financial incentives, such as rebates in the US and the EU’s Social Climate Fund, making heat pumps more accessible for residential and commercial use.
(Sources: HVAC.com, European Commission, Popular Science)
Recent Developments
Acquisitions and Mergers:
- Carrier acquires Giwee Group: In 2023, Carrier Global Corporation, a leading provider of HVAC systems, acquired Giwee Group, a Chinese heat pump manufacturer, for $400 million. This acquisition strengthens Carrier’s portfolio in energy-efficient heating solutions, particularly in the fast-growing Asian market.
- Daikin acquires AHT Cooling Systems: In 2023, Daikin Industries, a key player in the heat pump market, completed its $800 million acquisition of AHT Cooling Systems, expanding its reach in the refrigeration and heat pump segment, particularly in Europe and North America.
New Product Launches:
- Mitsubishi Electric’s new Ecodan heat pump: In 2024, Mitsubishi Electric launched its latest Ecodan heat pump, which is designed for both residential and commercial use. It offers enhanced energy efficiency, cutting down electricity usage by 20% compared to previous models, and meeting the rising demand for eco-friendly heating solutions.
- LG introduces Therma V R32 heat pump: In late 2023, LG launched the Therma V R32, an air-to-water heat pump featuring R32 refrigerant, known for its lower global warming potential. This product targets homeowners looking for high-efficiency heating systems while complying with environmental regulations.
Funding:
- Octopus Energy raises $600 million for heat pump installations: In 2023, Octopus Energy, a UK-based renewable energy provider, secured $600 million in funding to scale its heat pump installation services across Europe. Further, this funding will enable the company to install 30,000 heat pumps annually as part of Europe’s push toward renewable energy
- Viessmann receives $500 million for R&D in heat pump technology: In early 2024, Viessmann, a leading German heating systems manufacturer, raised $500 million to expand its research and development into more efficient and sustainable heat pump solutions, particularly for colder climates.
Technological Advancements:
- Hybrid Heat Pumps: Hybrid heat pump systems, which combine the benefits of both electric heat pumps and traditional boilers, are gaining traction. By 2025, hybrid heat pumps are expected to account for 15% of the global heat pump market, driven by the need for flexible heating solutions in regions with variable climates.
- AI-Powered Heat Pumps: Meanwhile, AI is being integrated into heat pump systems to optimize energy usage and efficiency based on real-time data. It is projected that by 2025, 20% of new heat pumps will incorporate AI-driven features to reduce energy consumption and improve performance.
Market Dynamics:
- Growth in Heat Pump Market: This growth is driven by the increasing adoption of energy-efficient heating solutions in both residential and commercial sectors, particularly in Europe and North America.
- Rising Demand for Renewable Heating Solutions: Particularly, governments across Europe and the U.S. are promoting the installation of heat pumps through incentives and rebates to reduce reliance on fossil fuels. Further, By 2025, heat pumps are expected to make up 40% of new residential heating installations in Europe, reflecting the growing focus on sustainability.
Conclusion
Heat Pump Statistics – Heat pumps are a highly efficient and eco-friendly alternative to traditional heating and cooling systems, offering both heating and cooling with minimal energy use.
They can significantly reduce carbon emissions, especially in regions with clean electricity grids, and provide long-term savings despite higher upfront costs.
Moreover, as demand for energy-efficient solutions grows, heat pumps are becoming essential for reducing building emissions and achieving climate goals, making them a key technology in the global shift toward sustainability.
FAQs
A heat pump is a device that transfers heat from one location to another, providing both heating and cooling for buildings by using electricity efficiently.
It extracts heat from the air, ground, or water and moves it into or out of your home, depending on whether you need heating or cooling.
Yes, heat pumps are highly energy efficient, often achieving over 200% efficiency, meaning they provide more energy in heating or cooling than they consume.
There are three main types: air-source heat pumps, ground-source (geothermal) heat pumps, and water-source heat pumps.
Yes, modern heat pumps are designed to operate efficiently even in cold climates, though performance can vary based on outdoor temperature and the specific heat pump model.


