Table of Contents
- Introduction
- Editor’s Choice
- Home Decor Market Statistics
- Key Companies Operating in the Home Decor Industry Statistics
- Revenue Generation Through Various Home Decor Products Statistics
- Home Decor Furniture Statistics
- Home Decor Textiles Statistics
- Home Decor Floor Covering Statistics
- Users Demographics of Home Décor Consumers
- Favorite Home Decor Styles Statistics
- Home Decor Expenditure and Spending Statistics
- Intention of Interior Decoration or Renovation Works
- Consumer Satisfaction Statistics
- Investment Trends
- Home Decor Industry Challenges Statistics
- Upcoming Trends
- Recent Home Decor Innovations Statistics
- Recent Developments
- Conclusion
- FAQs
Introduction
Home Decor Statistics: Home decor involves a blend of design principles and elements that shape the aesthetic and functionality of interior spaces.
Key principles include balance, harmony, proportion, rhythm, contrast, and emphasis, creating visually appealing and cohesive environments.
Essential design elements include color, texture, pattern, line, shape, and space, each contributing to the overall look and feel of a room.
Key components such as furniture, lighting, accessories, walls, floors, and textiles play crucial roles in defining the space.
Various style types, including traditional, modern, contemporary, rustic, industrial, and bohemian. Offer different approaches to decor, allowing for personalized and functional design solutions.
Editor’s Choice
- The global home decor market revenue reached USD 128.31 billion in 2023.
- By 2029, the candles segment is projected to reach USD 13.15 billion. Carpets and rugs USD 58.50 billion, curtains USD 53.65 billion, and decorations USD 36.38 billion. Indicating sustained growth across all product categories in the global home decor market.
- The global home decor market is distributed across various channels, with specialty stores capturing the largest share at 46%.
- The global home decor market is led by the United States. Which generates USD 35,440 million in revenue, making it the largest contributor.
- As of 2018, the majority of customers in China’s home decoration industry fell within the age group of 31-40 years, accounting for 51.50% of respondents.
- Between 2018 and 2020, U.S. consumer satisfaction with their furniture and home décor experienced noticeable shifts. In 2018, 13% of consumers reported being extremely satisfied. A figure that dropped to 9% in 2019 but then surged to 25% in 2020.
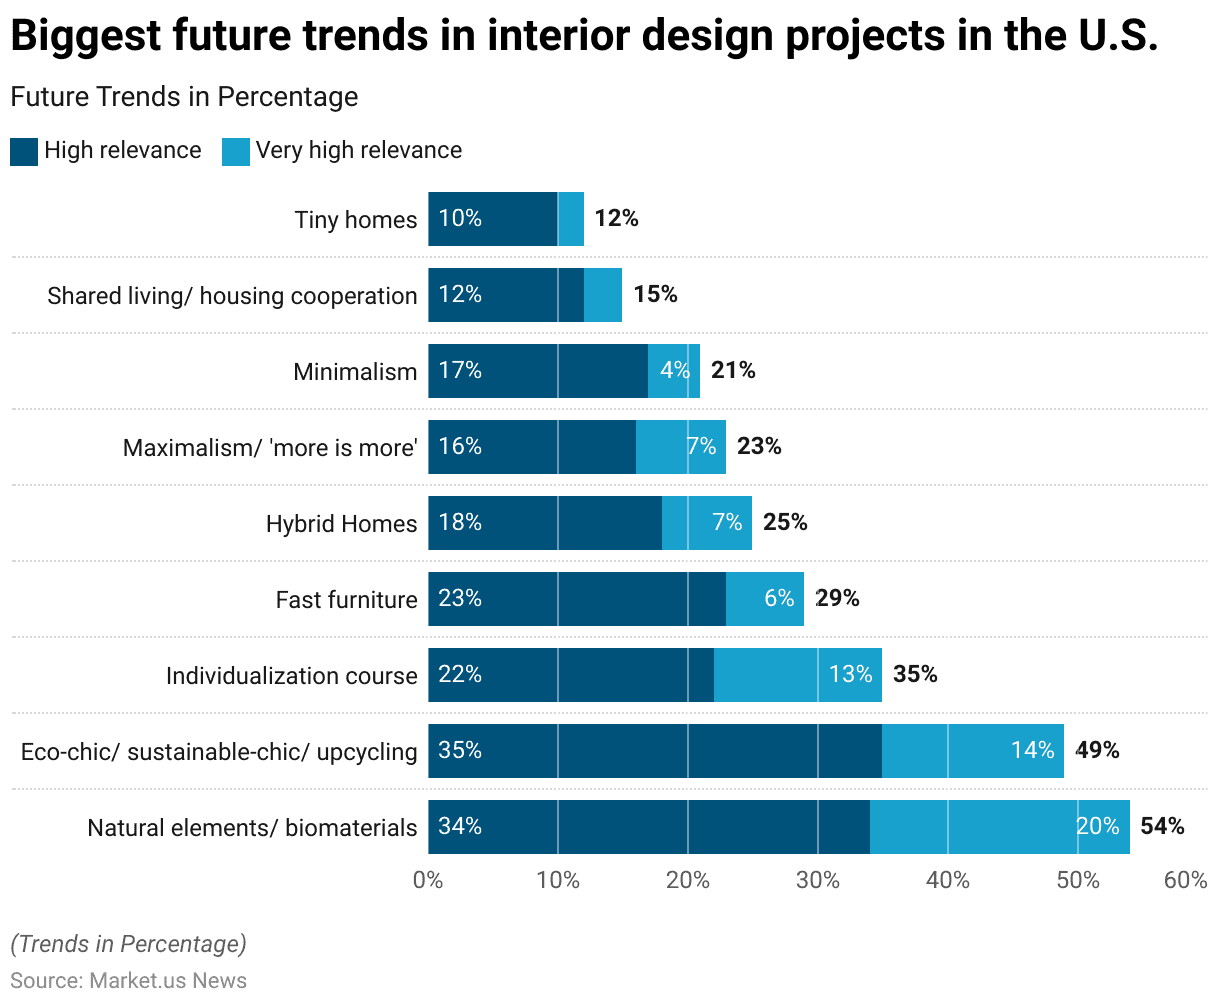
- In 2021, U.S. interior designers predicted several key trends that would shape the industry in the next one to two years. Natural elements and biomaterials were seen as highly relevant by 34% of respondents, with 20% considering them to have very high relevance.
Home Decor Market Statistics
Global Home Decor Market Size Statistics
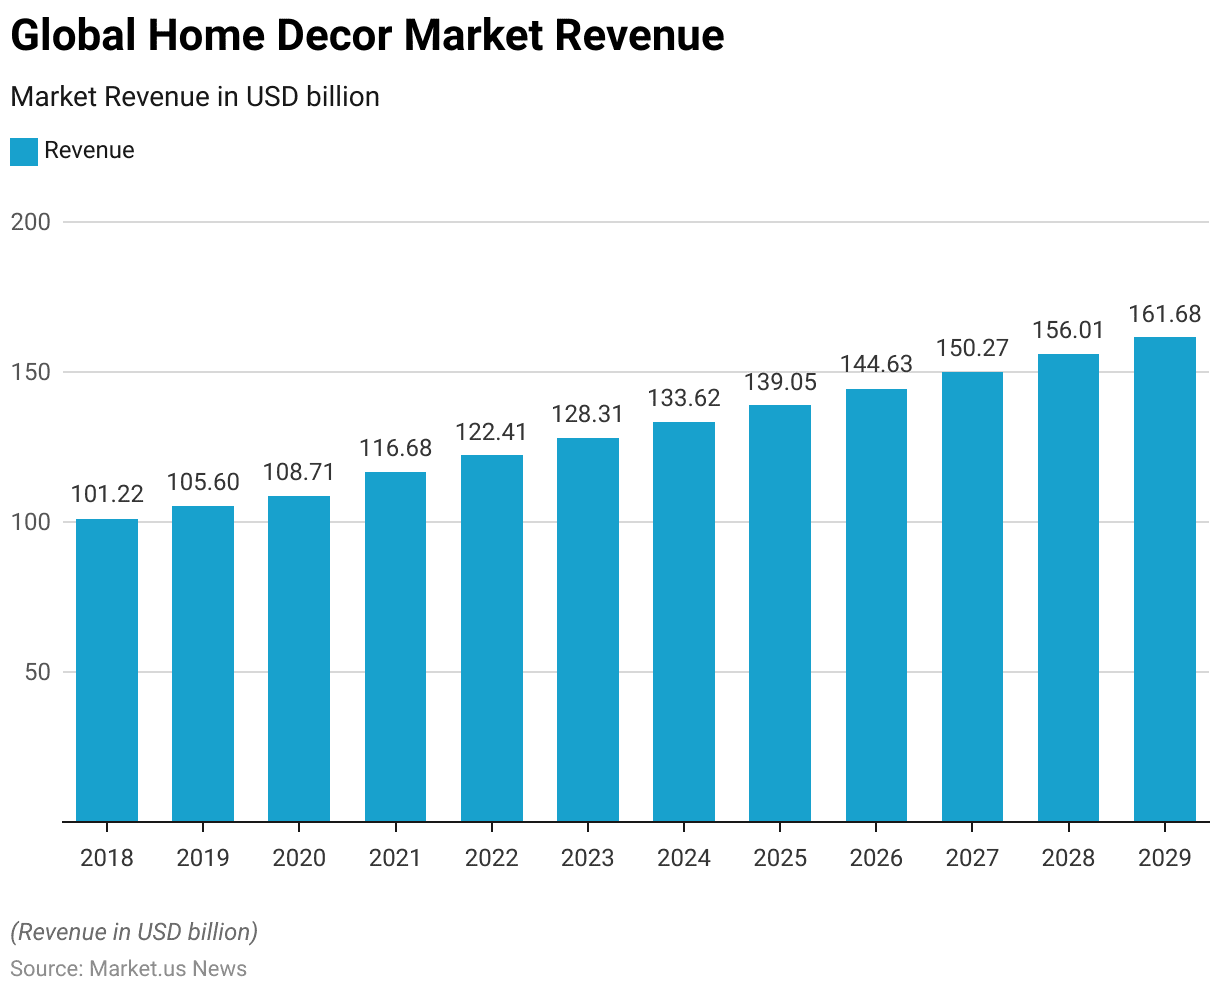
- The global home decor market has exhibited consistent growth over the years at a CAGR of 3.89%. Starting at USD 101.22 billion in 2018 and reaching USD 105.60 billion in 2019.
- This upward trend continued in 2020, with the market reaching USD 108.71 billion. Followed by significant growth in 2021, where revenue increased to USD 116.68 billion.
- In 2022, the market further expanded to USD 122.41 billion, and projections for 2023 anticipate a revenue of USD 128.31 billion.
- The forecasted growth is expected to persist in the coming years. With revenues estimated to reach USD 133.62 billion in 2024, USD 139.05 billion in 2025, and USD 144.63 billion in 2026.
- By 2027, the market is projected to generate USD 150.27 billion. Followed by USD 156.01 billion in 2028, ultimately culminating in USD 161.68 billion by 2029.
- However, This steady growth underscores the increasing consumer demand and interest in home decor. Reflecting a positive outlook for the industry in the coming decade.
(Source: Statista)
Global Home Decor Market Size – By Product Type Statistics
2018-2023
- The global home decor market, segmented by product type, has shown steady growth across various categories from 2018 to 2023.
- In 2018, the candles segment generated USD 8.69 billion, while carpets and rugs contributed USD 39.43 billion. Curtains accounted for USD 30.50 billion, and decorations added USD 22.60 billion.
- By 2019, the market saw moderate increases, with candles reaching USD 9.01 billion, and carpets and rugs at USD 41.10 billion. Curtains at USD 31.76 billion, and decorations rising to USD 23.73 billion.
- In 2020, despite economic challenges, candles generated USD 8.86 billion. Carpets and rugs USD 42.87 billion, curtains USD 32.21 billion, and decorations USD 24.77 billion.
- Significant growth followed in 2021, with candles at USD 10.39 billion. Carpets and rugs at USD 44.76 billion, curtains at USD 35.25 billion, and decorations at USD 26.28 billion.
- By 2022, candles accounted for USD 10.22 billion, carpets and rugs USD 46.77 billion. Curtains USD 37.81 billion, and decorations USD 27.61 billion.
- Further, the forecast for 2023 estimates candles at USD 10.72 billion, carpets and rugs at USD 48.71 billion, curtains at USD 40.04 billion, and decorations at USD 28.84 billion.
2024-2029
- Projections for 2024 indicate continued growth, with candles expected to reach USD 11.11 billion, carpets and rugs USD 50.27 billion, curtains USD 42.14 billion, and decorations USD 30.10 billion.
- By 2025, candles are projected to reach USD 11.51 billion. Carpets and rugs USD 51.87 billion, curtains USD 44.31 billion, and decorations USD 31.36 billion.
- Further growth is anticipated in 2026, with candles estimated at USD 11.92 billion. Carpets and rugs at USD 53.51 billion, curtains at USD 46.58 billion, and decorations at USD 32.62 billion.
- The upward trend continues in 2027, with candles reaching USD 12.33 billion, carpets and rugs at USD 55.17 billion, curtains at USD 48.89 billion, and decorations at USD 33.88 billion.
- In 2028, candles are expected to generate USD 12.75 billion, carpets and rugs USD 56.84 billion, curtains USD 51.28 billion, and decorations USD 35.14 billion.
- By 2029, the candles segment is projected to reach USD 13.15 billion, carpets and rugs USD 58.50 billion, curtains USD 53.65 billion, and decorations USD 36.38 billion. Indicating sustained growth across all product categories in the global home decor market.
(Source: Statista)

Global Home Decor Market Share – By Distribution Channel Statistics
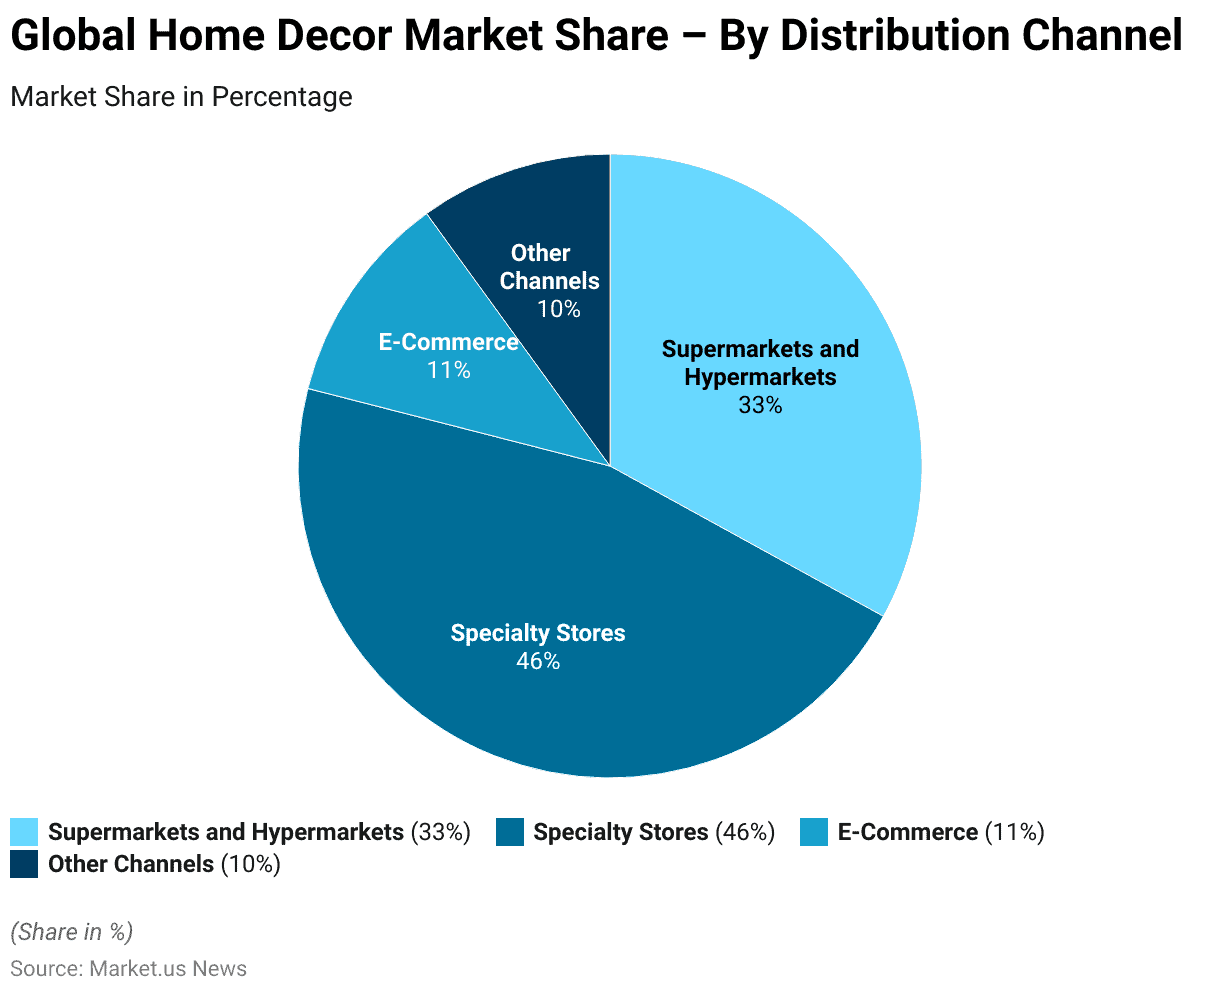
- However, the global home decor market is distributed across various channels, with specialty stores capturing the largest share at 46%.
- Supermarkets and hypermarkets follow, accounting for 33% of the market share.
- E-commerce platforms, which have seen significant growth due to the rise of online shopping, contribute 11% to the market.
- Other distribution channels, including smaller and niche outlets. Make up the remaining 10% of the market share.
- This distribution reflects the diverse purchasing behaviors of consumers. With a notable preference for specialty stores when it comes to home decor products.
(Source: market.us)
Regional Analysis of the Global Home Decor Market Statistics
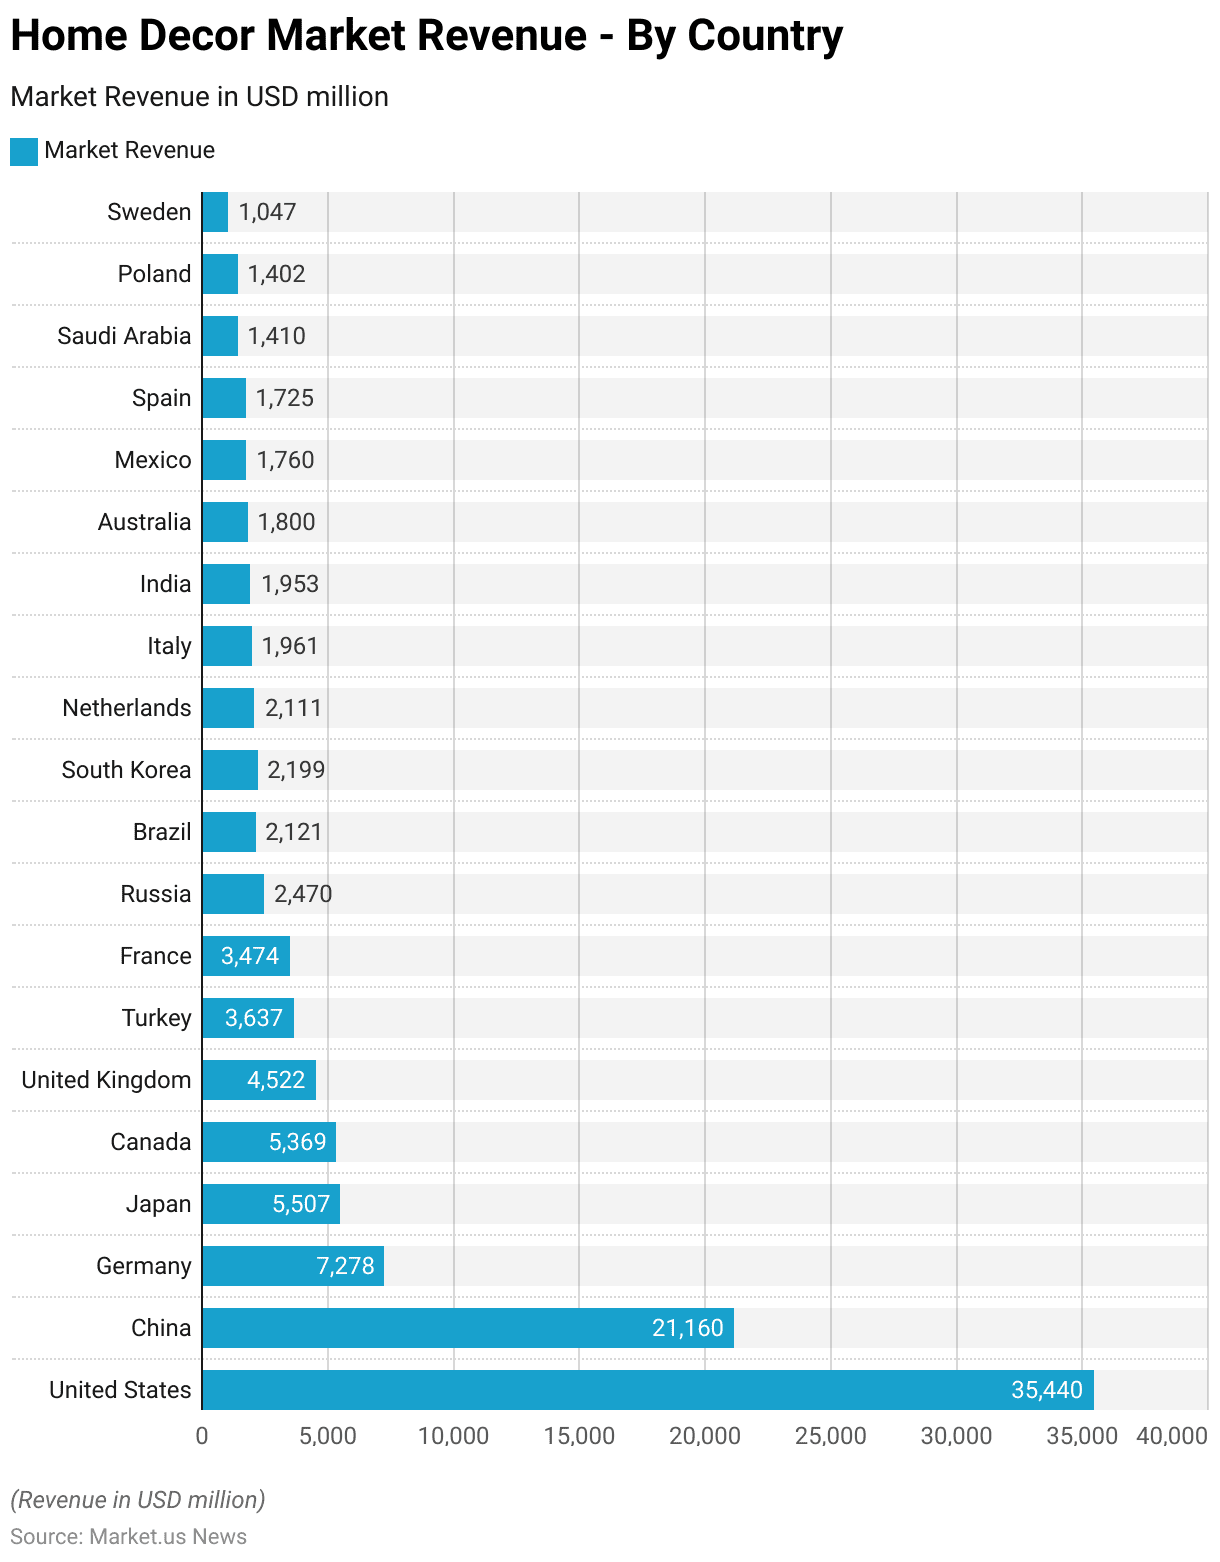
- The global home decor market is led by the United States. Which generates USD 35,440 million in revenue, making it the largest contributor.
- China follows closely with USD 21,160 million, indicating its strong position in the market.
- Germany ranks third with USD 7,278 million, while Japan and Canada contribute USD 5,507 million and USD 5,369 million, respectively.
- The United Kingdom holds a significant share at USD 4,522 million. Followed by Turkey at USD 3,637 million and France at USD 3,474 million.
- Other key countries in the home decor market include Russia. With USD 2,470 million; Brazil, at USD 2,121 million; and South Korea, generating USD 2,199 million.
- The Netherlands contributes USD 2,111 million, while Italy and India are nearly equivalent. With revenues of USD 1,961 million and USD 1,953 million, respectively.
- Australia adds USD 1,800 million, and Mexico generates USD 1,760 million.
- Spain follows with USD 1,725 million, while Saudi Arabia and Poland contribute USD 1,410 million and USD 1,402 million, respectively.
- Lastly, Sweden accounts for USD 1,047 million in revenue, rounding out the key players in the global home decor market.
(Source: Statista)
Key Companies Operating in the Home Decor Industry Statistics
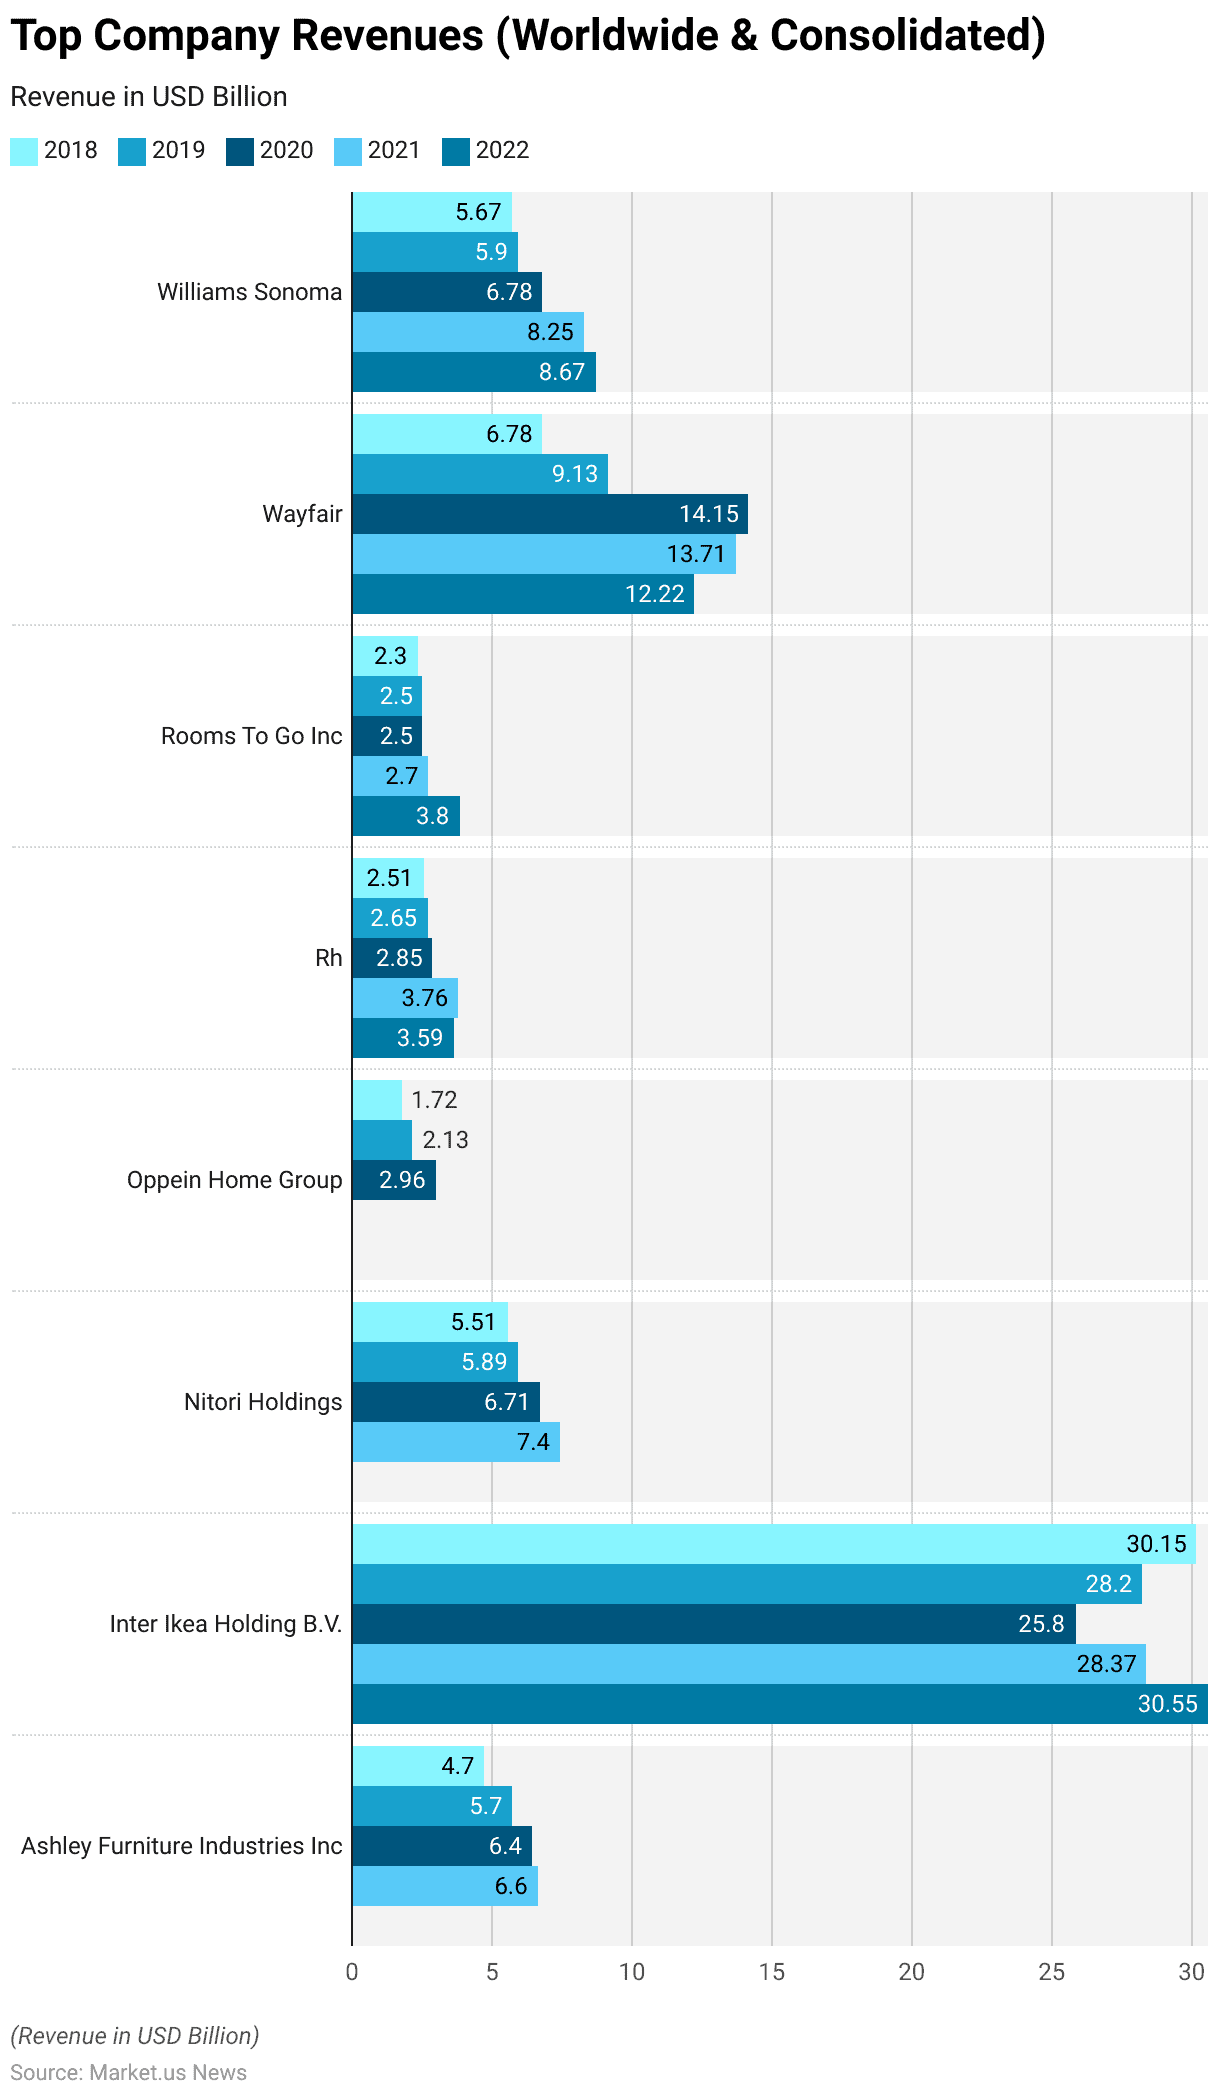
- The leading companies in the global home decor industry have shown varying growth trajectories from 2018 to 2022.
- However, Ashley Furniture Industries Inc. reported steady revenue growth. Starting at USD 4.7 billion in 2018 and increasing to USD 6.6 billion by 2021.
- Inter Ikea Holding B.V. remained the dominant player despite a slight dip in 2020. With revenues fluctuating from USD 30.15 billion in 2018 to USD 30.55 billion in 2022.
- Nitori Holdings also exhibited consistent growth, from USD 5.51 billion in 2018 to USD 7.4 billion in 2021.
- Oppein Home Group saw its revenues grow from USD 1.72 billion in 2018 to USD 2.96 billion in 2020.
- Rh, another key player, experienced a gradual increase from USD 2.51 billion in 2018 to USD 3.76 billion in 2021, though it slightly decreased to USD 3.59 billion in 2022.
- Moreover, Rooms to Go Inc. recorded stable performance, with a significant jump in 2022, reaching USD 3.8 billion from USD 2.3 billion in 2018.
- Wayfair experienced rapid growth, particularly in 2020. When its revenue surged to USD 14.15 billion, before tapering off to USD 12.22 billion in 2022.
- Williams Sonoma also demonstrated strong growth, starting at USD 5.67 billion in 2018 and reaching USD 8.67 billion in 2022.
- Overall, these companies have contributed significantly to the expansion of the global home decor market. Each shows resilience and adaptability in a competitive industry.
(Source: Statista)
Revenue Generation Through Various Home Decor Products Statistics
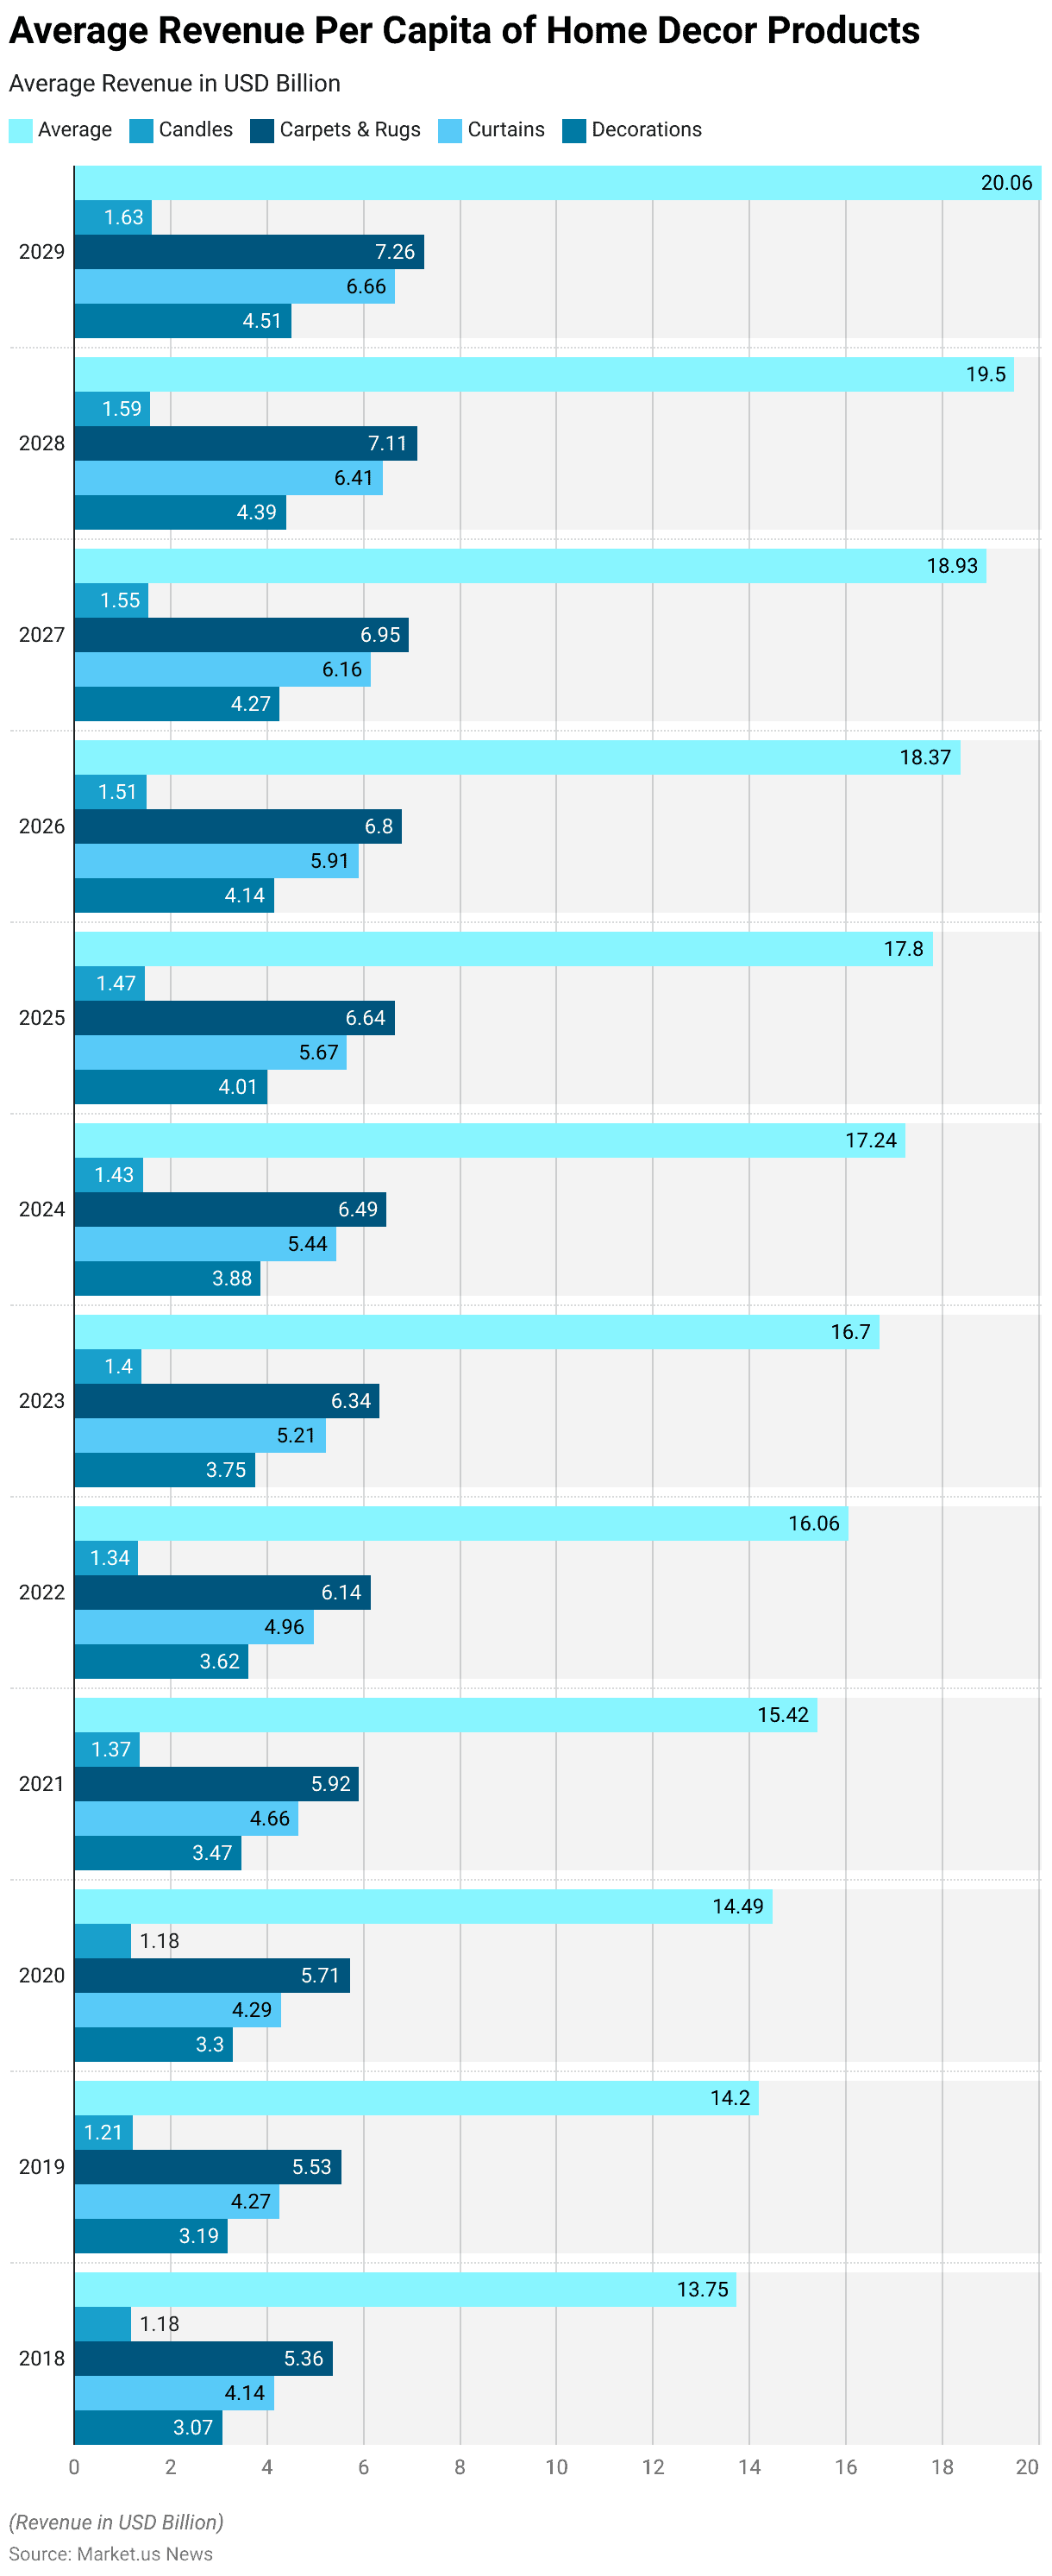
- The revenue generation through home décor products has shown a steady increase in average revenue per capita from 2018 to 2029.
- In 2018, the total average revenue per capita was USD 13.75, with candles contributing USD 1.18, carpets and rugs USD 5.36, curtains USD 4.14, and decorations USD 3.07.
- By 2019, the total average revenue rose to USD 14.20, driven by slight increases in all categories, including candles at USD 1.21, carpets and rugs at USD 5.53, curtains at USD 4.27, and decorations at USD 3.19.
- In 2020, the average revenue per capita increased to USD 14.49. With a small decline in candles at USD 1.18, carpets and rugs saw growth. Reaching USD 5.71, along with curtains and decorations at USD 4.29 and USD 3.30, respectively.
- A notable jump occurred in 2021, with the total average reaching USD 15.42, candles rising to USD 1.37, carpets and rugs to USD 5.92, curtains to USD 4.66, and decorations to USD 3.47.
- By 2022, the average per capita revenue grew to USD 16.06. With candles at USD 1.34, carpets and rugs at USD 6.14, curtains at USD 4.96, and decorations at USD 3.62.
- The upward trend continued in 2023 with a total average of USD 16.70, and further increases are forecasted for 2024. With a projected total of USD 17.24 and candles, carpets, curtains, and decorations contributing USD 1.43, USD 6.49, USD 5.44, and USD 3.88, respectively.
- Projections for 2025 suggest a total average revenue of USD 17.80, continuing to rise steadily to USD 20.06 by 2029.
- During this period, candles are expected to reach USD 1.63, carpets and rugs USD 7.26, curtains USD 6.66, and decorations USD 4.51. Reflecting a consistent growth trajectory across all product categories in the home décor market.
(Source: Statista)
Home Decor Furniture Statistics
Global Furniture Market Size
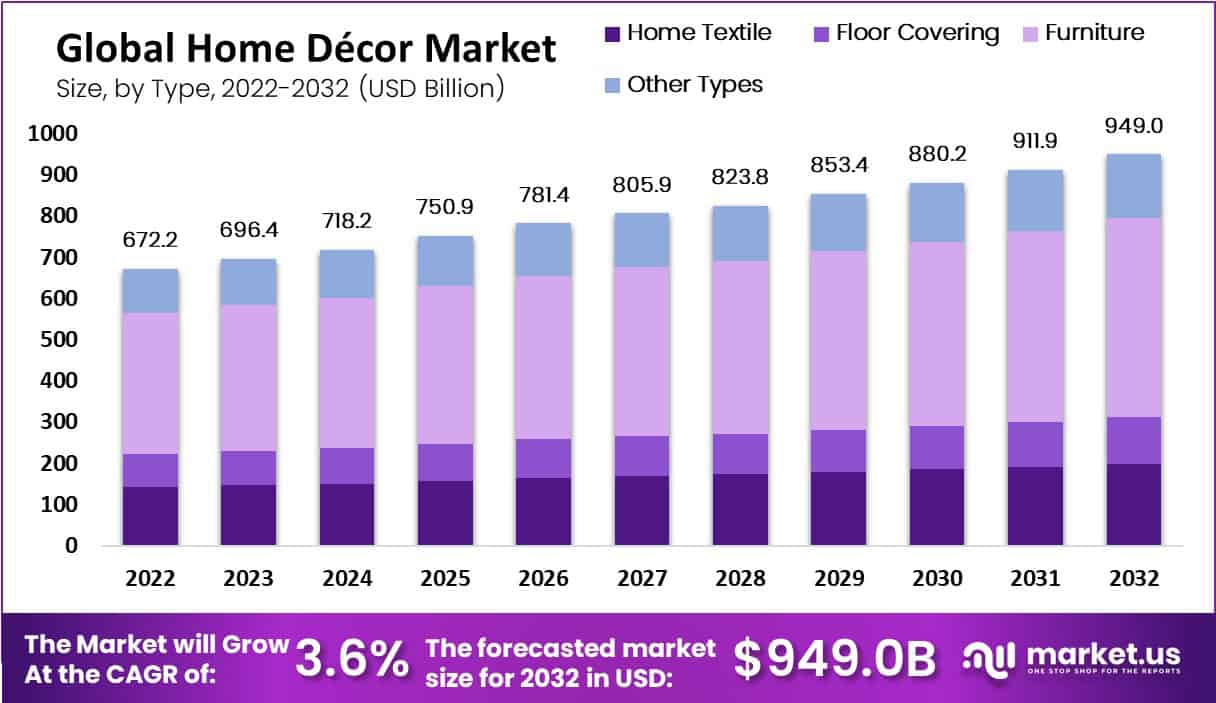
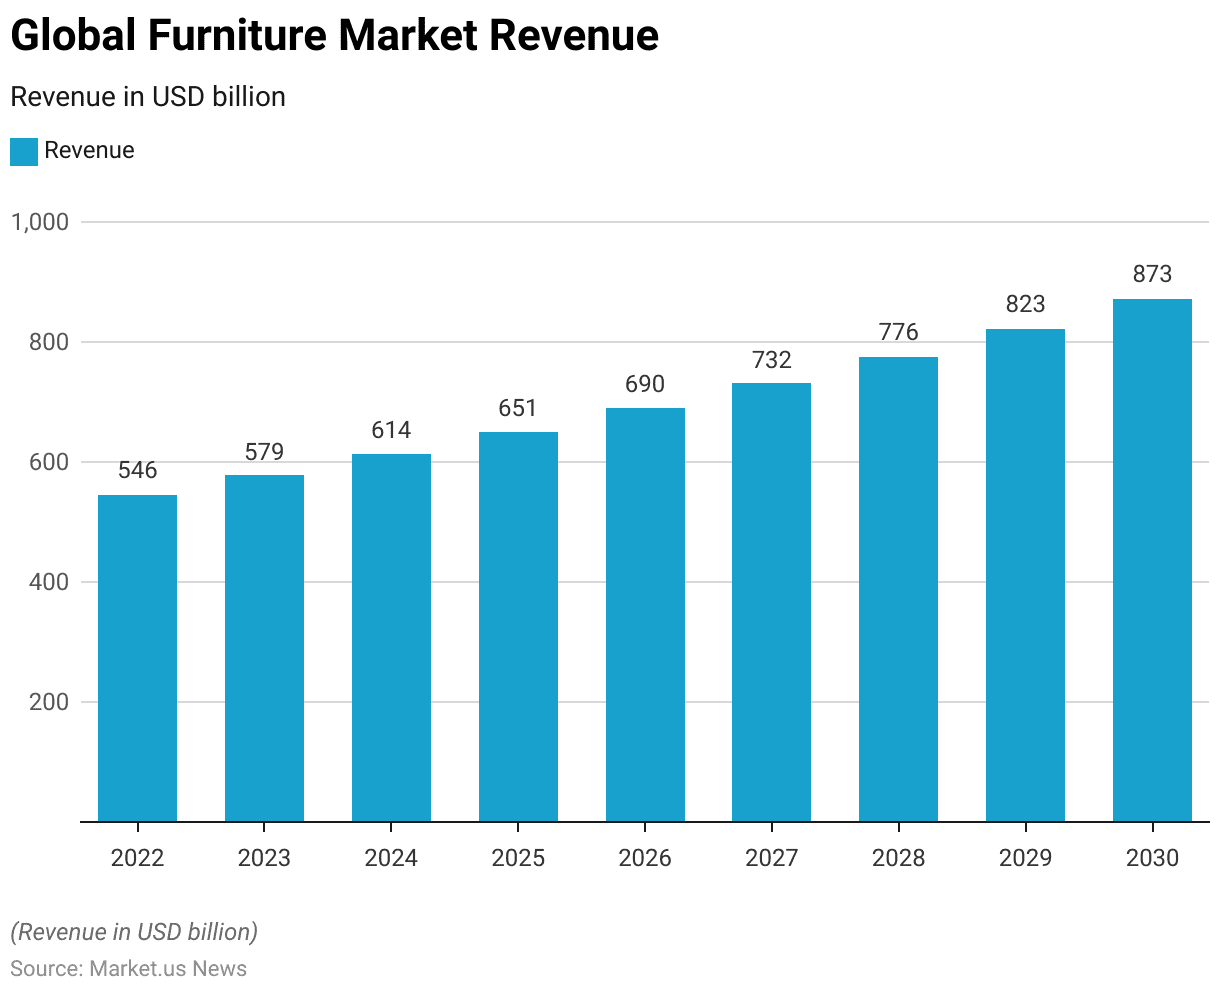
- The global furniture market has shown a robust growth trajectory, with revenues recorded at USD 546 billion in 2022.
- This upward trend is projected to continue, with the market expected to reach USD 579 billion in 2023 and USD 614 billion in 2024.
- The growth is set to accelerate in the following years, with anticipated revenues of USD 651 billion in 2025 and USD 690 billion in 2026.
- By 2027, the market is forecasted to generate USD 732 billion, and by 2028, it will likely reach USD 776 billion.
- The market is expected to continue its expansion, reaching USD 823 billion by 2029 and culminating at USD 873 billion by 2030.
- This consistent growth highlights the increasing global demand for furniture products. Driven by factors such as urbanization, rising disposable incomes, and evolving consumer preferences.
(Source: Statista)
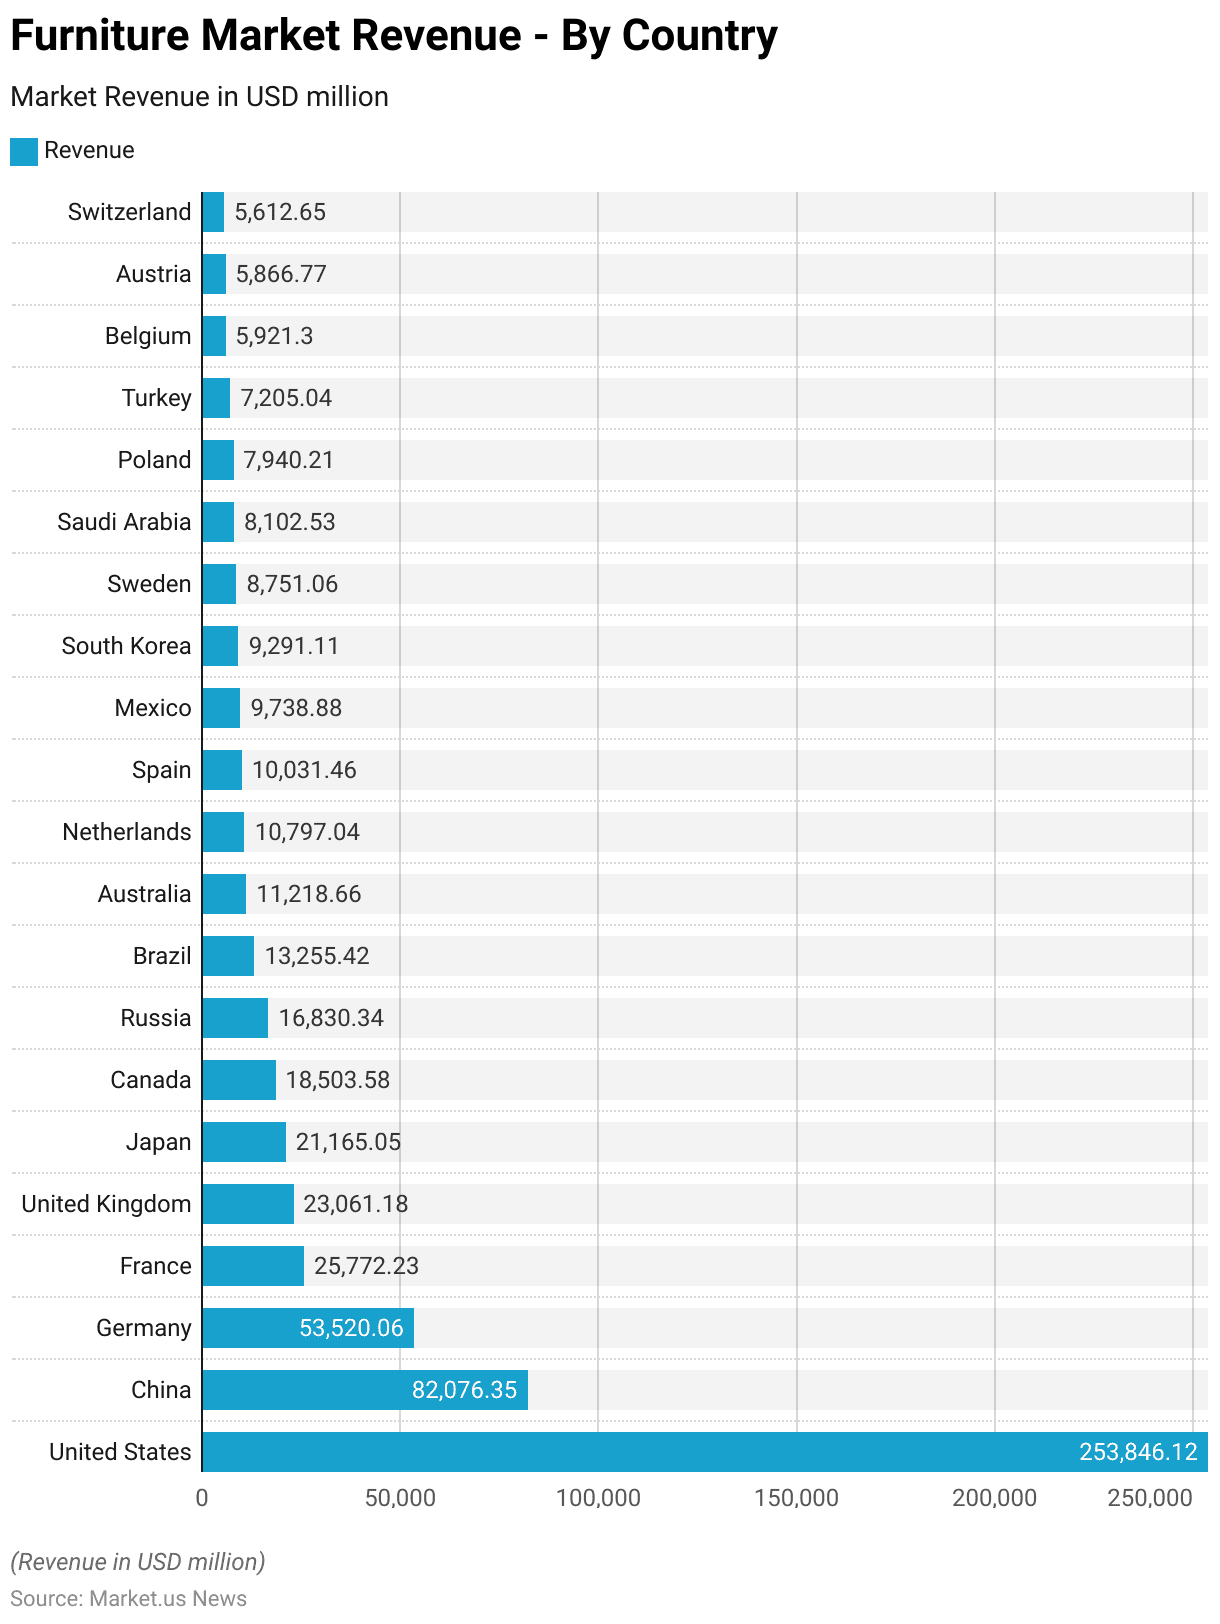
Furniture Market Revenue – By Country
- The global furniture market is dominated by the United States, which leads with a revenue of USD 253,846.12 million.
- China follows with a significant share of USD 82,076.35 million, while Germany ranks third, generating USD 53,520.06 million.
- Other key markets include France, with USD 25,772.23 million, and the United Kingdom, with USD 23,061.18 million.
- Japan and Canada also contribute substantially, with revenues of USD 21,165.05 million and USD 18,503.58 million, respectively.
- Russia and Brazil are prominent players, generating USD 16,830.34 million and USD 13,255.42 million.
- Australia and the Netherlands follow closely with revenues of USD 11,218.66 million and USD 10,797.04 million.
- Spain, Mexico, and South Korea also play important roles, contributing USD 10,031.46 million, USD 9,738.88 million, and USD 9,291.11 million, respectively.
- Sweden and Saudi Arabia generate revenues of USD 8,751.06 million and USD 8,102.53 million. While Poland, Turkey, and Belgium contribute USD 7,940.21 million, USD 7,205.04 million, and USD 5,921.30 million, respectively.
- Austria and Switzerland round out the market, with revenues of USD 5,866.77 million and USD 5,612.65 million.
- These figures underscore the widespread global demand for furniture, with leading markets continuing to expand.
(Source: Statista)
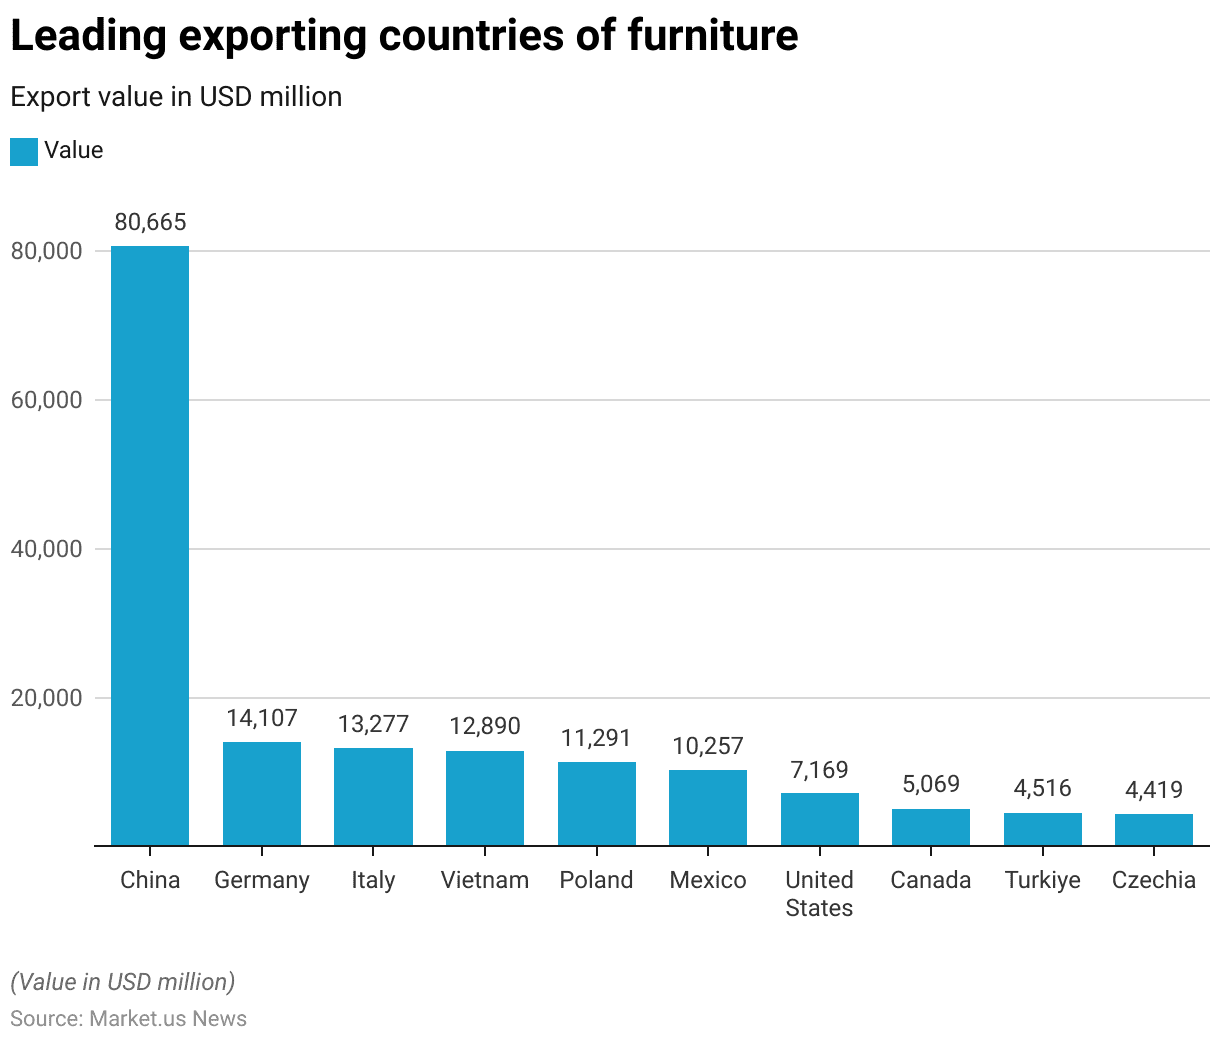
Leading Exporting Countries of Furniture Worldwide
- In 2022, China led the global furniture export market with a remarkable export value of USD 80,664.7 million, far surpassing other countries.
- Germany ranked second, exporting furniture worth USD 14,106.9 million. Followed closely by Italy with USD 13,277.0 million.
- Vietnam and Poland were also key players in the furniture export market. With export values of USD 12,889.6 million and USD 11,291.3 million, respectively.
- Mexico contributed USD 10,257.3 million in furniture exports. While the United States exported USD 7,169.4 million.
- Canada’s export value stood at USD 5,069.1 million, followed by Türkiye at USD 4,515.7 million and Czechia at USD 4,419.0 million.
- These figures highlight the significant contributions of these countries to the global furniture export market in 2022.
(Source: Statista)
Home Decor Textiles Statistics
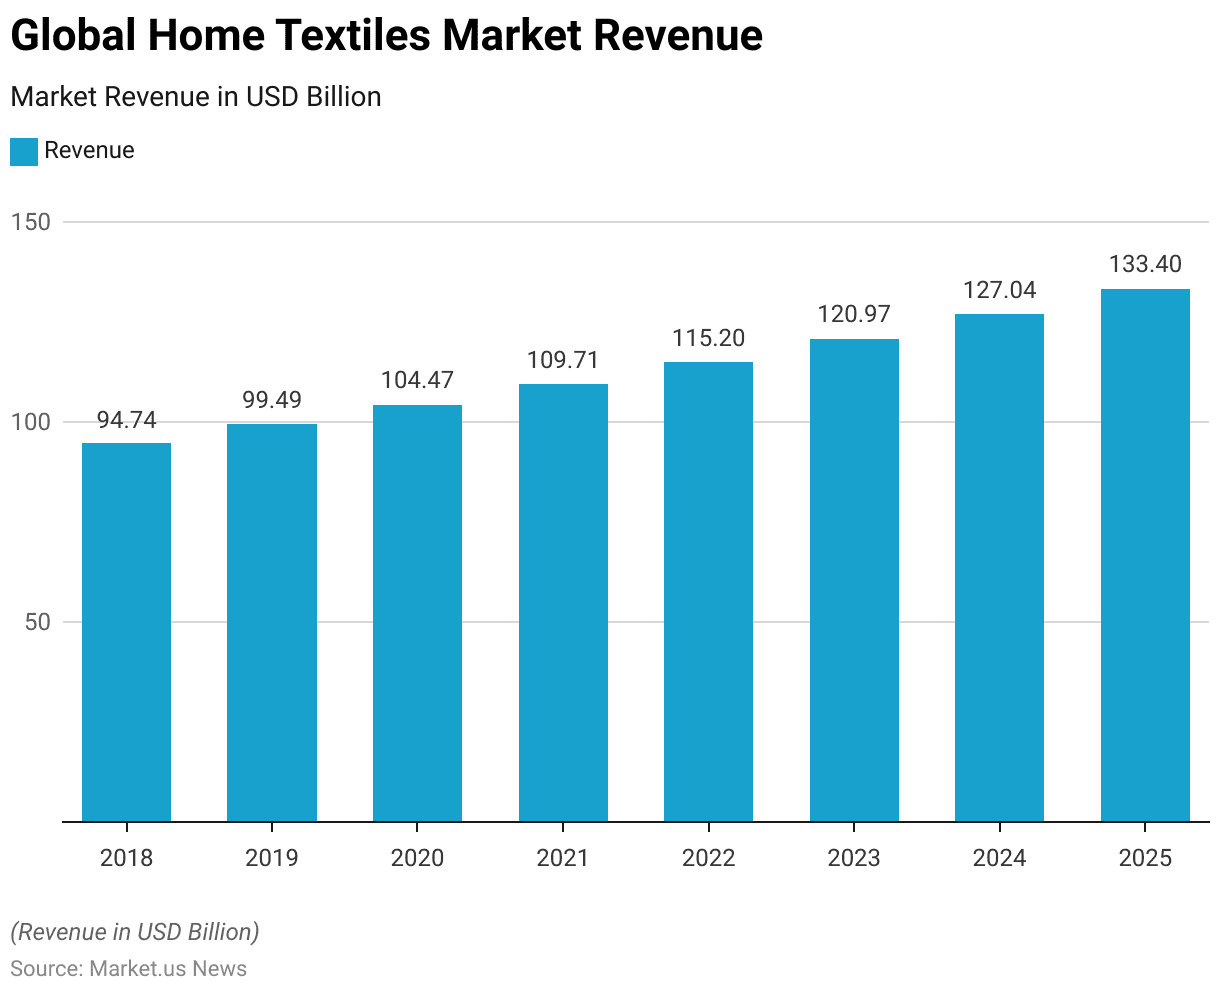
Global Home Decor Textiles Market Size Statistics
- The global home textiles market has shown consistent growth from 2018 to 2025.
- In 2018, the market revenue was USD 94.74 billion, increasing to USD 99.49 billion in 2019.
- This upward trend continued in 2020, with the market reaching USD 104.47 billion.
- By 2021, the market expanded further to USD 109.71 billion, followed by USD 115.2 billion in 2022.
- In 2023, the market is projected to grow to USD 120.97 billion. With further growth anticipated in 2024, reaching USD 127.04 billion.
- By 2025, the global home textiles market is expected to achieve USD 133.4 billion. Reflecting a steady rise in demand for home textile products.
(Source: Statista)
Production of Textile Fibers
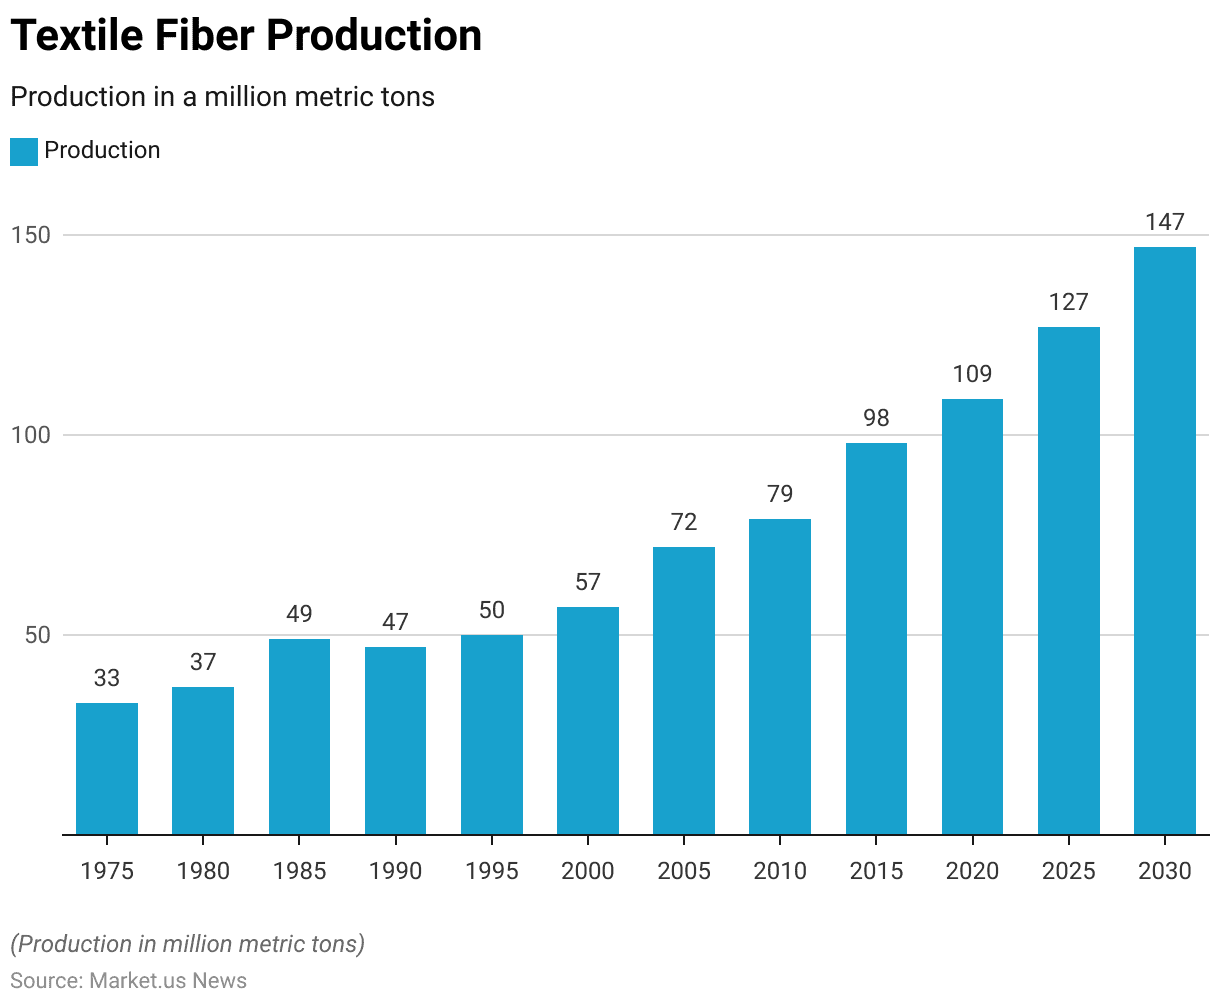
- The global production of textile fibers has shown significant growth from 1975 to 2020. With projections indicating continued expansion through 2030.
- In 1975, global textile fiber production stood at 33 million metric tons, increasing to 37 million metric tons by 1980.
- This upward trend continued, with production reaching 49 million metric tons in 1985 and slightly decreasing to 47 million metric tons in 1990.
- By 1995, production had increased to 50 million metric tons and further grew to 57 million metric tons in 2000.
- The growth accelerated in the following years, with global textile fiber production reaching 72 million metric tons in 2005 and 79 million metric tons by 2010.
- This expansion continued in 2015, when production reached 98 million metric tons, and in 2020, the global production stood at 109 million metric tons.
- Forecasts for future production suggest that by 2025, global textile fiber production will rise to 127 million metric tons and further increase to 147 million metric tons by 2030. Highlighting the continuous and substantial growth in the textile industry.
(Source: Statista)
Home Decor Floor Covering Statistics
Global Home Decor Floor Covering Market Size Statistics
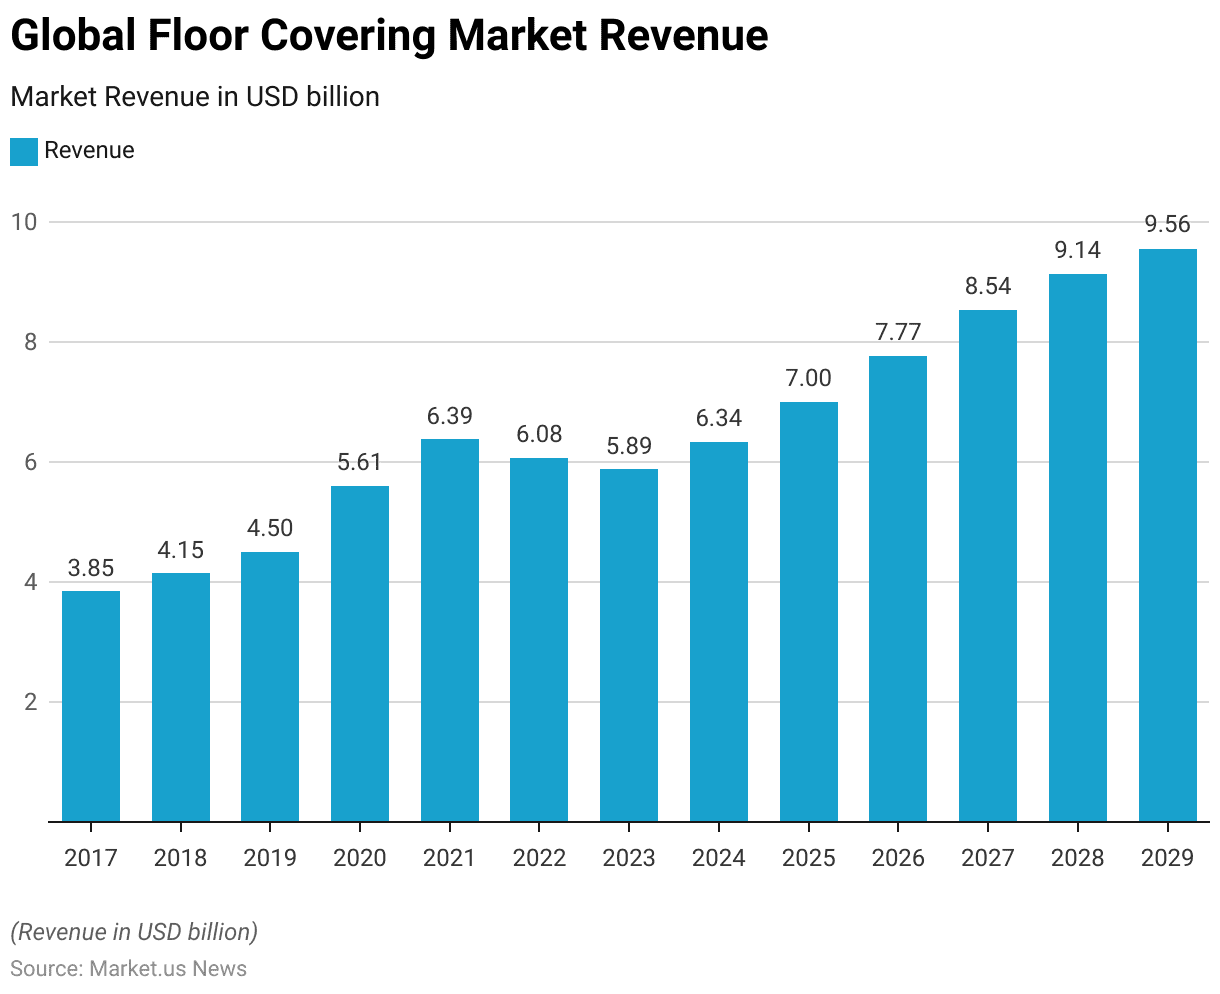
- The global floor-covering market has experienced consistent growth from 2017 to 2029.
- In 2017, the market revenue stood at USD 3.85 billion, rising to USD 4.15 billion in 2018 and reaching USD 4.50 billion in 2019.
- A notable surge occurred in 2020 when the market grew to USD 5.61 billion. Followed by further expansion in 2021, with revenues reaching USD 6.39 billion.
- However, a slight decline was observed in 2022, when the market decreased to USD 6.08 billion.
- In 2023, the market is projected to experience a moderate dip, reaching USD 5.89 billion. Before bouncing back in 2024 with an estimated revenue of USD 6.34 billion.
- The upward trend is expected to continue, with the market forecasted to reach USD 7.00 billion in 2025, USD 7.77 billion in 2026, and USD 8.54 billion in 2027.
- By 2028, the global floor-covering market is expected to generate USD 9.14 billion in revenue, and further growth will push it to USD 9.56 billion by 2029.
- This sustained growth reflects the increasing demand for floor-covering products across the globe.
(Source: Statista)
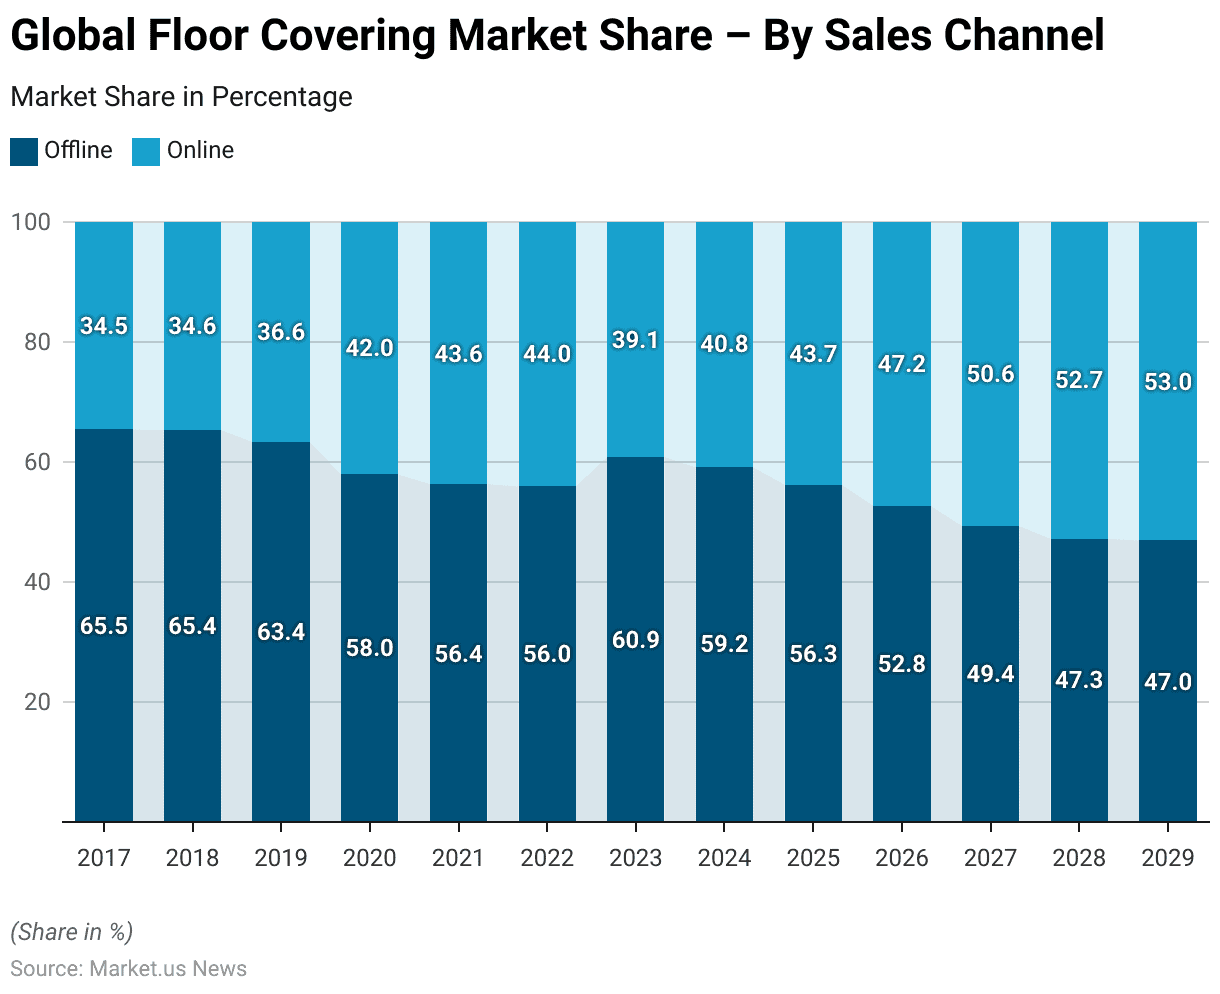
Global Home Decor Floor Covering Market Share – By Sales Channel Statistics
- The global floor-covering market has witnessed a notable shift in sales channels between 2017 and 2029, with a growing preference for online purchasing.
- In 2017, offline sales dominated the market, accounting for 65.5% of total sales, while online sales contributed 34.5%.
- This trend remained largely unchanged in 2018, with offline sales at 65.4% and online at 34.6%.
- However, by 2019, online sales began to grow, reaching 36.6%, while offline sales decreased to 63.4%.
- The shift became more pronounced in 2020, when online sales surged to 42%, while offline sales fell to 58%.
- By 2021, the gap narrowed further, with online sales reaching 43.6% and offline at 56.4%.
- In 2022, online sales continued to rise, capturing 44% of the market, while offline sales stabilized at 56%.
- The market experienced some fluctuations in 2023, with online sales declining slightly to 39.1%, but by 2024, the online channel had rebounded to 40.8%.
- Moreover, looking forward, the trend is expected to continue in favor of online channels, with projections showing online sales at 43.7% in 2025 and overtaking offline sales by 2026. Where online will make up 47.2% of the market.
- By 2027, online sales are anticipated to dominate, accounting for 50.6% of total sales, surpassing offline sales at 49.4%.
- This trend is expected to continue, with online channels contributing 52.7% in 2028 and increasing to 53%in 2029. Consumers increasingly opt for the convenience of online purchasing in the global floor-covering market.
(Source: Statista)
Home Decor Floor Covering Market Revenue – By Country Statistics
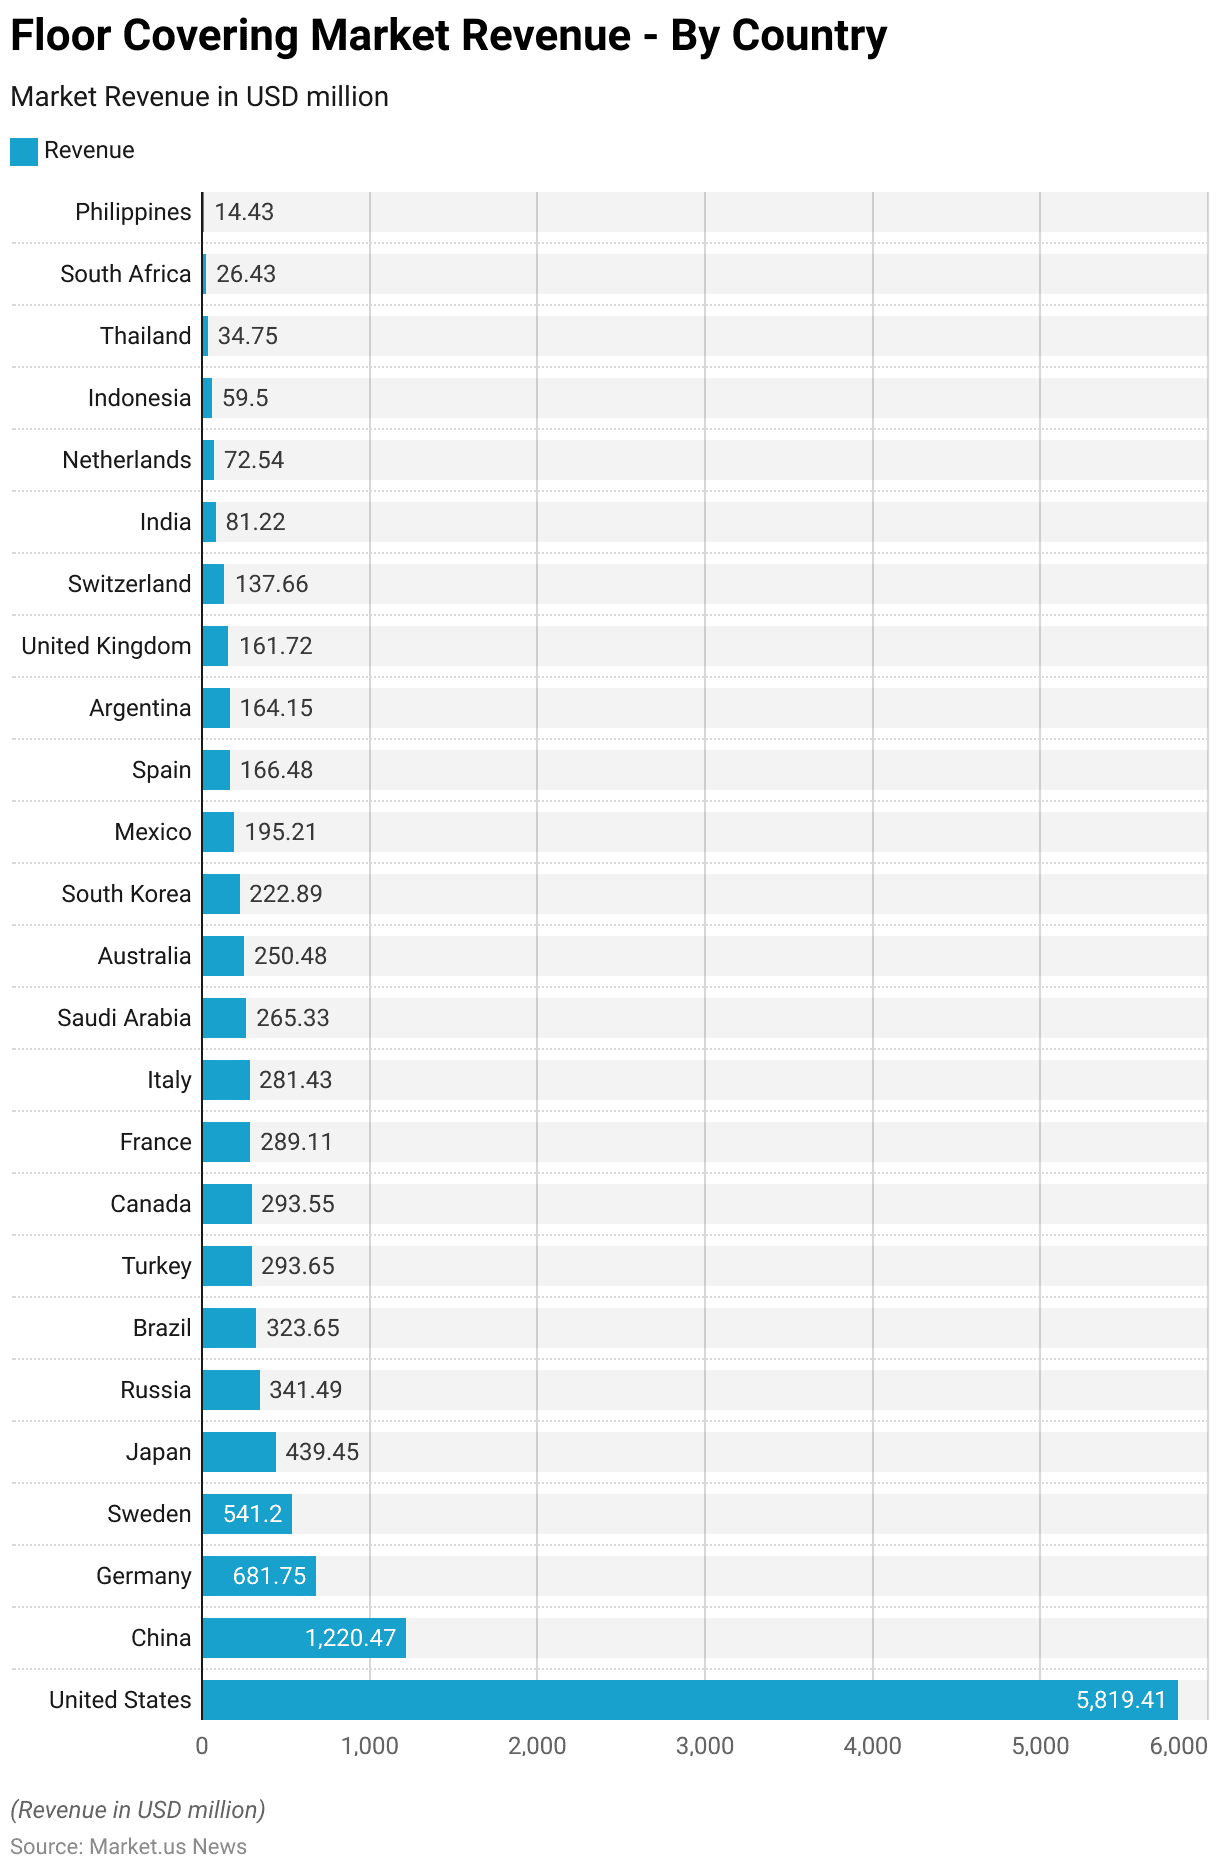
- In 2023, the global floor-covering market generated significant revenue across various countries.
- The United States led with a substantial USD 5,819.41 million, followed by China, which contributed USD 1,220.47 million.
- Germany secured third place with USD 681.75 million, while Sweden and Japan recorded USD 541.2 million and USD 439.45 million, respectively.
- Russia and Brazil added USD 341.49 million and USD 323.65 million to the market. While Turkey and Canada reported similar figures, contributing USD 293.65 million and USD 293.55 million.
- France and Italy also played prominent roles, generating USD 289.11 million and USD 281.43 million, respectively, while Saudi Arabia contributed USD 265.33 million.
- Australia’s market reached USD 250.48 million, and South Korea followed with USD 222.89 million.
- Mexico contributed USD 195.21 million, while Spain and Argentina added USD 166.48 million and USD 164.15 million, respectively.
- The United Kingdom recorded USD 161.72 million, and Switzerland reached USD 137.66 million in revenue.
- India contributed USD 81.22 million, while the Netherlands added USD 72.54 million.
- Indonesia, Thailand, South Africa, and the Philippines contributed smaller portions to the global market, with USD 59.5 million, USD 34.75 million, USD 26.43 million, and USD 14.43 million, respectively.
- These figures illustrate the widespread participation and varying contributions of countries to the global floor-covering market in 2023.
(Source: Statista)
Home Decor Floor Covering Users and Penetration Rate Statistics
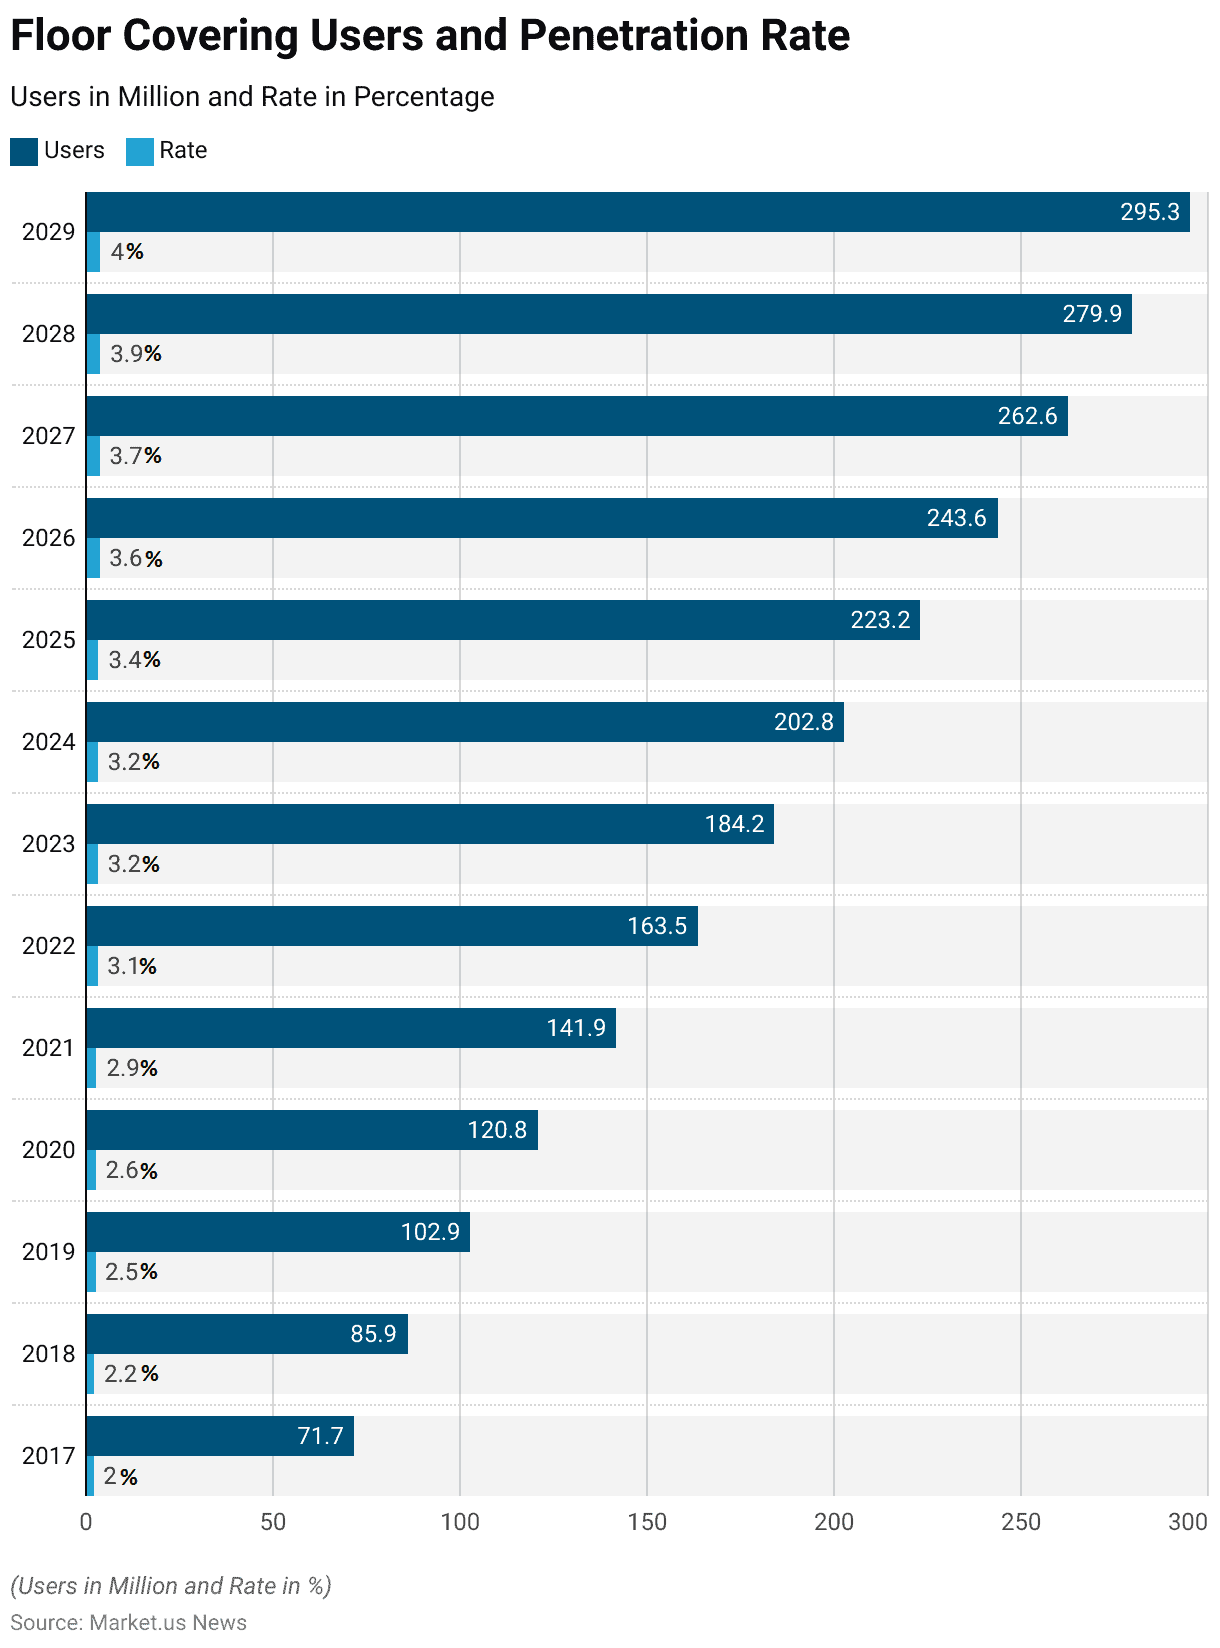
- The global floor-covering market has seen a steady increase in the number of users and penetration rate from 2017 to 2029.
- In 2017, there were 71.7 million users with a penetration rate of 2.0%.
- By 2018, the number of users grew to 85.9 million, raising the penetration rate to 2.2%.
- In 2019, user numbers increased further to 102.9 million, with the penetration rate climbing to 2.5%.
- The trend continued in 2020, with 120.8 million users and a penetration rate of 2.6%.
- By 2021, the user base expanded to 141.9 million, and the penetration rate rose to 2.9%.
- In 2022, the number of users reached 163.5 million, with the penetration rate increasing to 3.1%.
- In 2023, the number of users is projected to grow to 184.2 million, with a penetration rate of 3.2%, which will remain the same in 2024, with 202.8 million users.
- Further growth is expected in the following years, with the number of users forecasted to reach 223.2 million by 2025, with a penetration rate of 3.4%, and 243.6 million users by 2026, with a penetration rate of 3.6%.
- In 2027, users are projected to number 262.6 million, with a penetration rate of 3.7%.
- By 2028, the number of users is expected to rise to 279.9 million, with a penetration rate of 3.9%, culminating in 295.3 million users by 2029, with a penetration rate of 4.0%.
- This consistent growth reflects the increasing adoption of floor-covering products globally.
(Source: Statista)
Users Demographics of Home Décor Consumers
Age
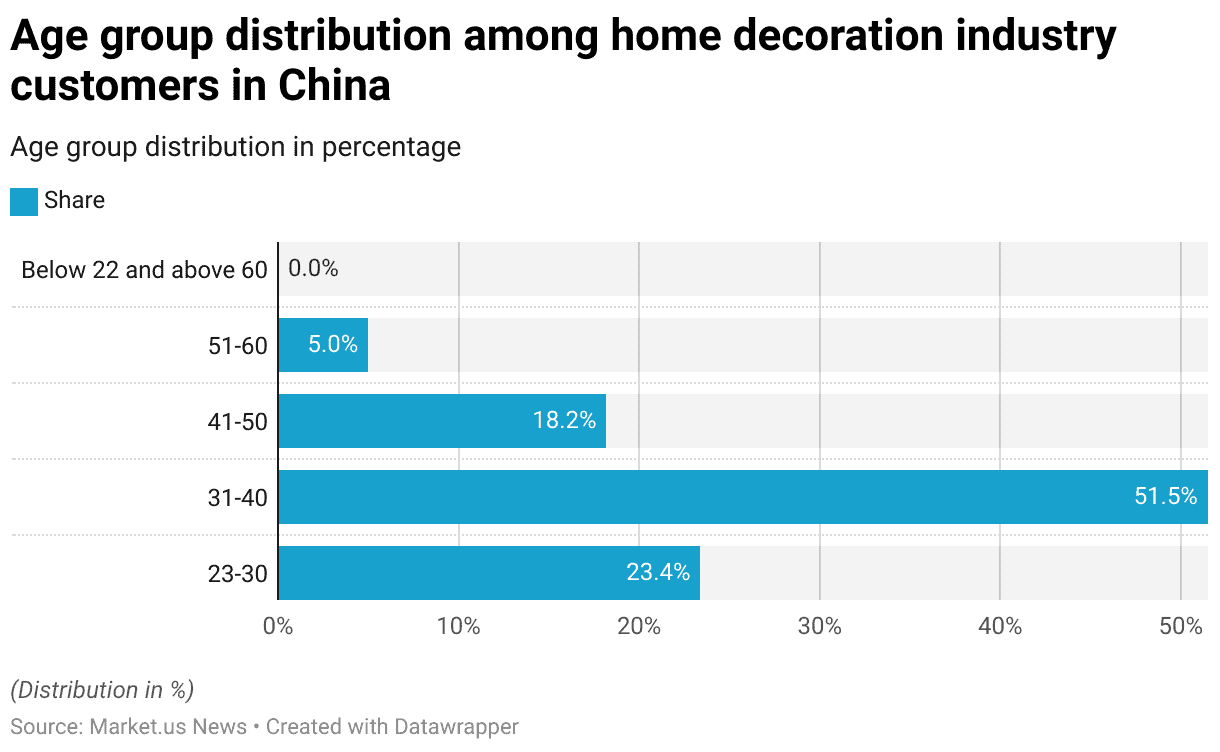
- As of 2018, the majority of customers in China’s home decoration industry fell within the age group of 31-40 years, accounting for 51.50% of respondents.
- The second largest group was those aged 23-30, representing 23.40% of the customer base.
- Individuals between the ages of 41-50 made up 18.20% of respondents, while those in the 51-60 age group contributed 5%.
- Notably, no respondents were recorded from age groups below 22 or above 60, indicating a concentration of home decoration customers in the younger to middle-aged demographic.
(Source: Statista)
Gender
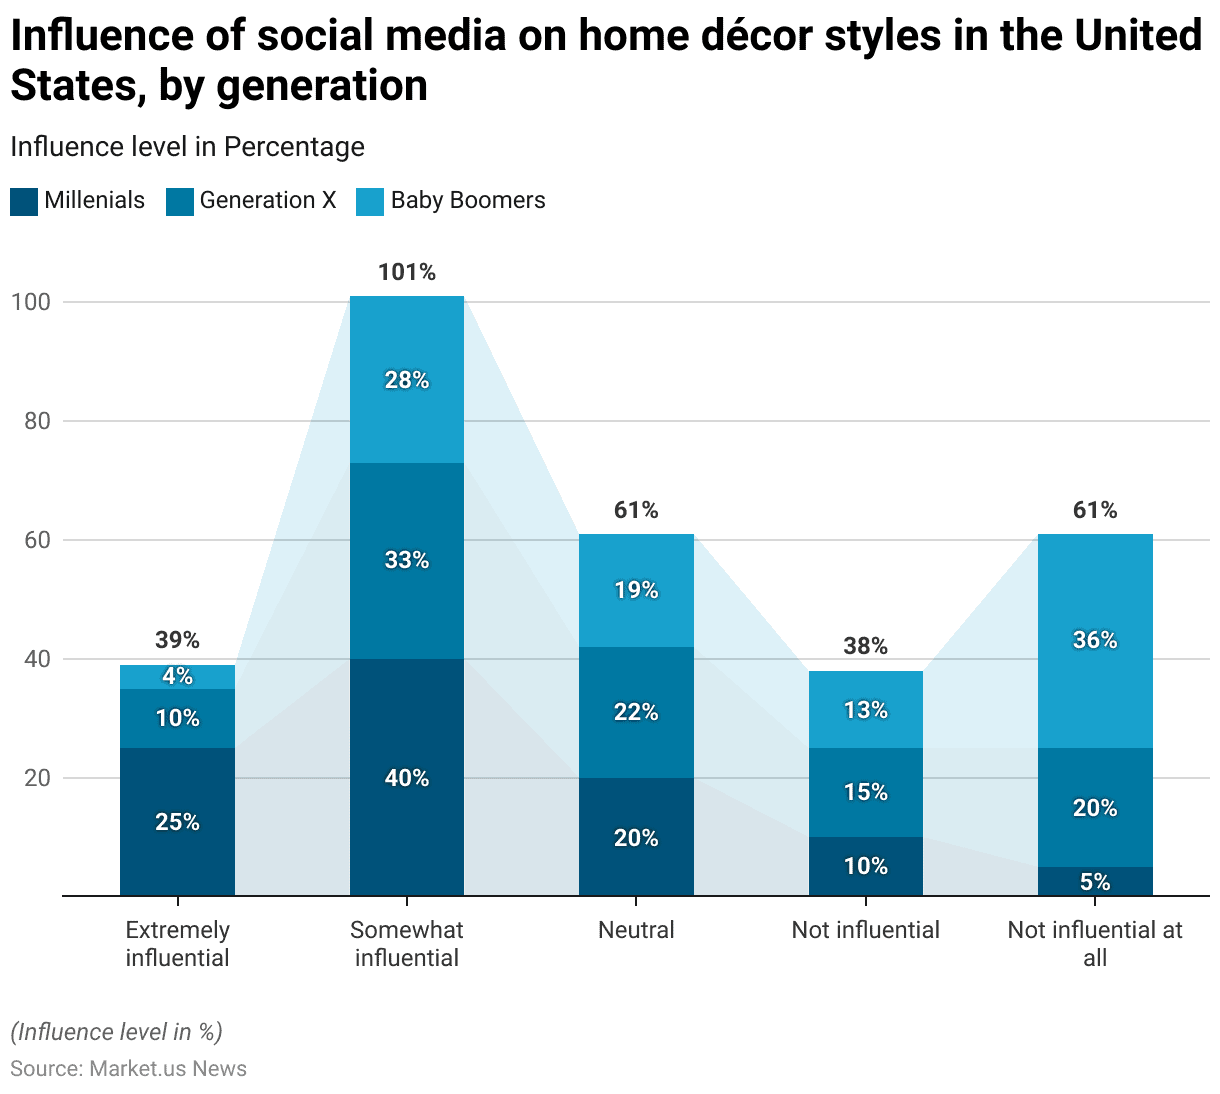
- In 2019, social media had varying levels of influence on home décor styles in the United States across different generations.
- Among Millennials, 25% found social media to be extremely influential, while 40% considered it somewhat influential.
- Another 20% of Millennials were neutral on its influence, with 10% seeing it as not influential and 5% finding it not influential at all.
- For Generation X, only 10% viewed social media as extremely influential, but 33% found it somewhat influential.
- About 22% were neutral, and 15% considered it not influential, while 20% believed social media was not influential at all.
- In contrast, Baby Boomers showed the least influence from social media, with only 4% finding it extremely influential and 28% considering it somewhat influential.
- A total of 19% remained neutral, while 13% saw it as not influential, and a significant 36% viewed social media as not influential at all.
- These figures highlight generational differences in how social media impacts home décor preferences.
(Source: Statista)
Gender
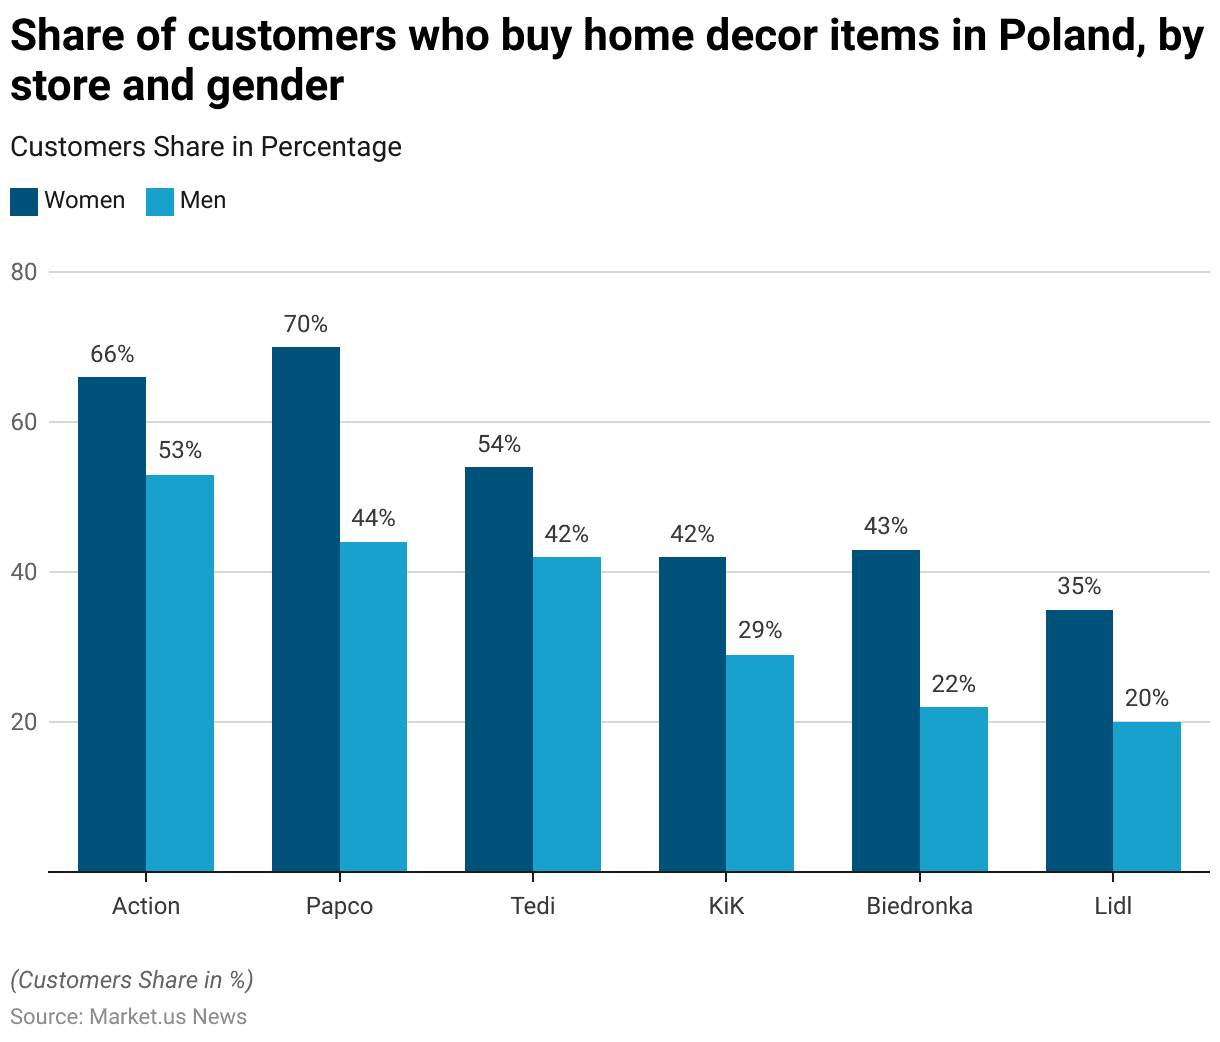
- In 2020, the purchasing of home décor products from discount chains in Poland showed notable gender differences. Women were the predominant customers across all chains.
- At Action, 66% of women made home décor purchases, compared to 53% of men.
- Papco saw the highest female customer share, with 70% of women purchasing home décor products, while 44% of men did the same.
- Tedi attracted 54% of women and 42% of men.
- At KiK, 42% of women purchased home décor, compared to 29% of men.
- Biedronka saw a similar trend, with 43% of female customers compared to just 22% of males.
- Lastly, Lidl had the smallest percentage of both female and male customers, with 35% of women and 20% of men purchasing home décor products.
- This data reflects a general trend of higher home décor purchases among women in Poland’s discount chains.
(Source: Statista)
Favorite Home Decor Styles Statistics
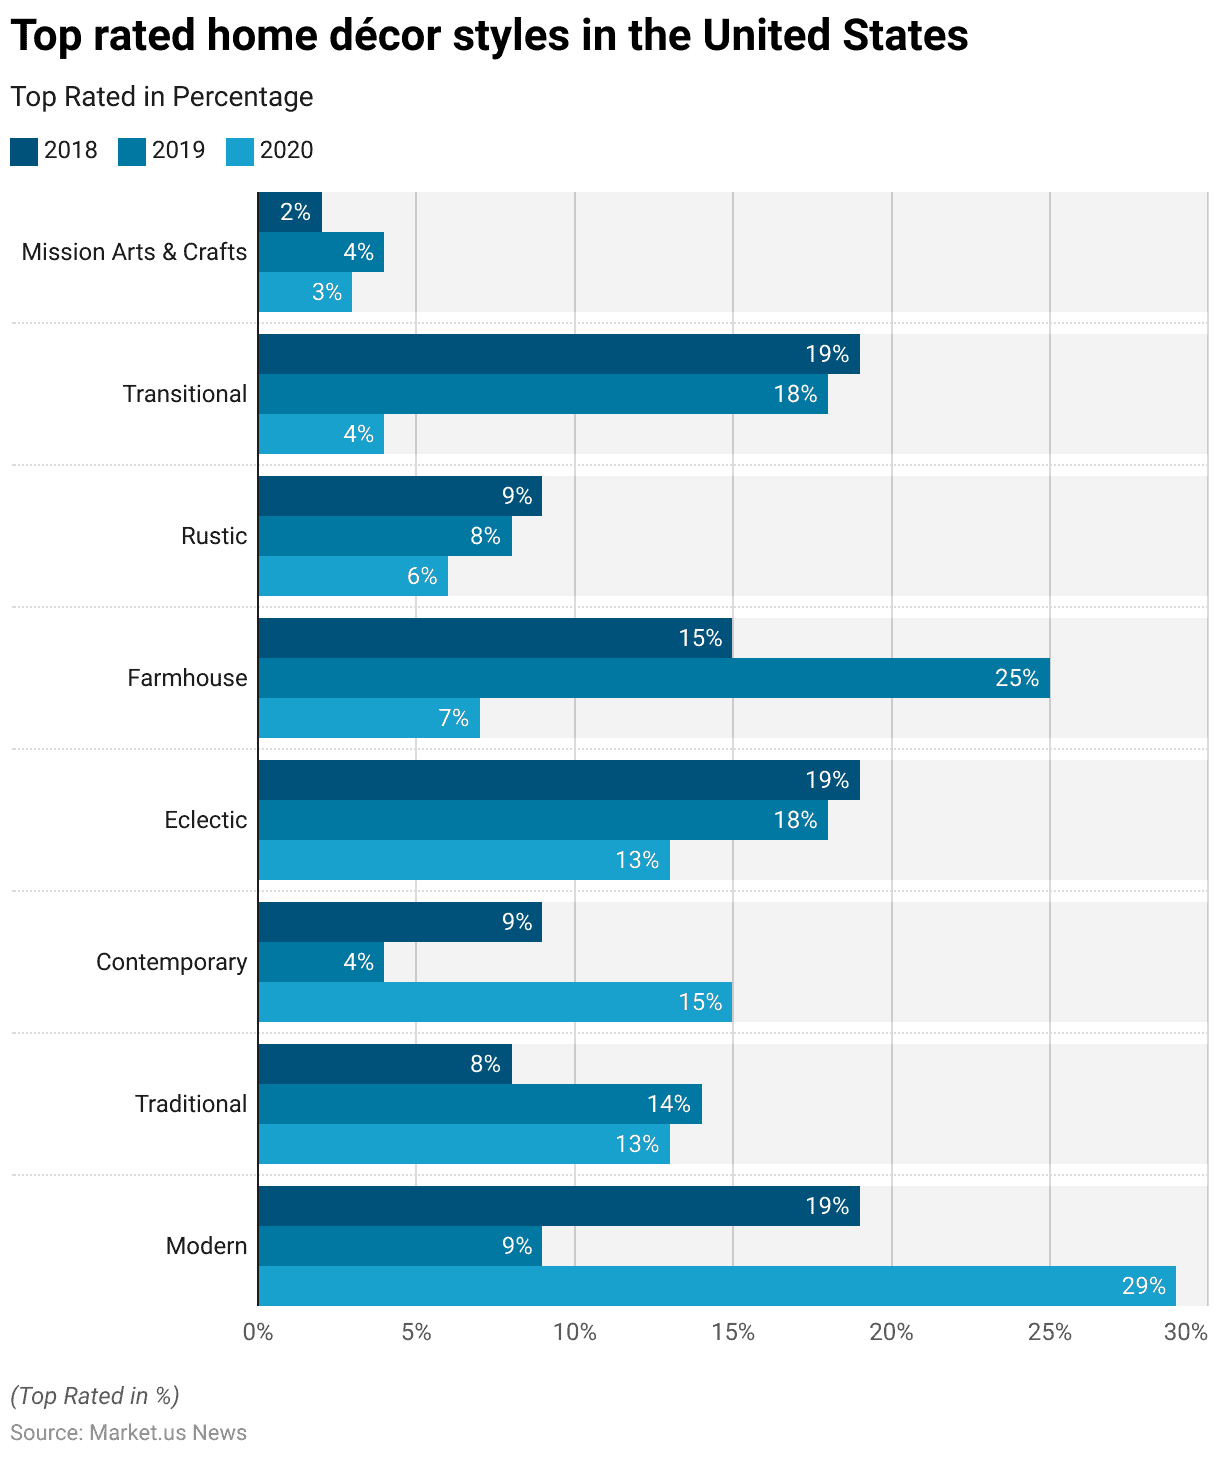
- From 2018 to 2020, home décor styles in the United States exhibited shifting trends in popularity.
- The Modern style saw a significant increase in preference, starting at 19% in 2018, dipping to 9% in 2019, and then rising sharply to 29% in 2020.
- Traditional style gained traction, growing from 8% in 2018 to 14% in 2019 and slightly declining to 13% in 2020.
- Contemporary style also gained popularity, beginning at 9% in 2018, dropping to 4% in 2019, but rising to 15% in 2020.
- The Eclectic style remained consistently popular, with 19% in 2018 and slightly decreasing to 18% in 2019 and 13% in 2020.
- Farmhouse style peaked in 2019 at 25%, up from 15% in 2018, but then saw a significant drop to 7% in 2020.
- Rustic style experienced a gradual decline, moving from 9% in 2018 to 8% in 2019 and down to 6% in 2020.
- Transitional style maintained a strong presence in 2018 and 2019, both at 19% and 18%, respectively, but saw a sharp decline to 4% in 2020.
- Lastly, Mission Arts & Crafts remained a niche preference, increasing slightly from 2% in 2018 to 4% in 2019 before dropping to 3% in 2020.
- These trends reflect the evolving preferences in home décor styles among American consumers over the three years.
(Source: Statista)
Home Decor Expenditure and Spending Statistics
Expenditure On Furniture
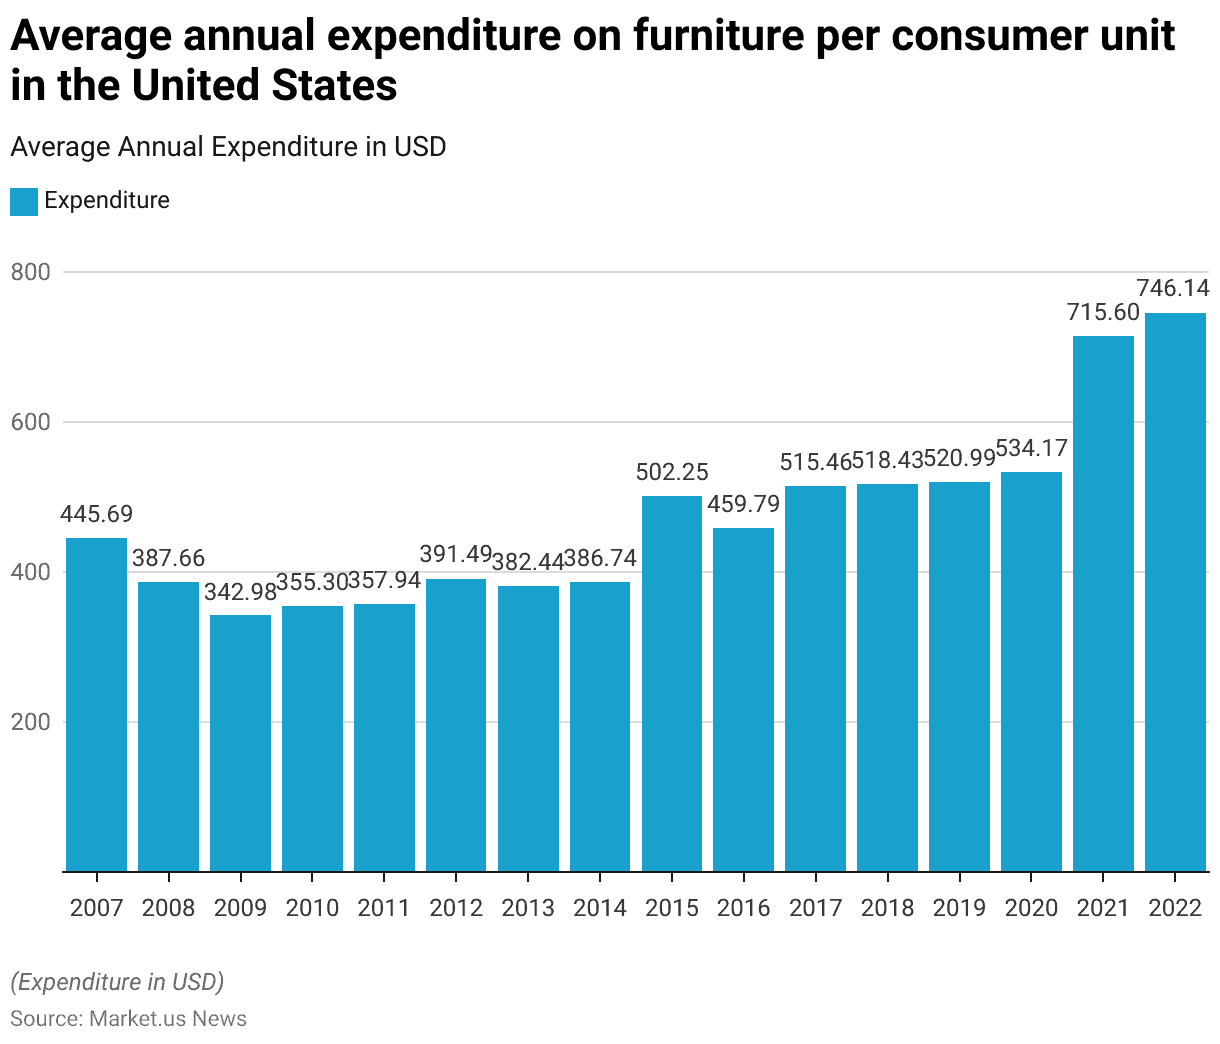
- The average annual expenditure on furniture per consumer unit in the United States has shown notable fluctuations from 2007 to 2022.
- In 2007, the average spending was USD 445.69, but it declined to USD 387.66 in 2008 and further dropped to USD 342.98 in 2009.
- The expenditure began to recover gradually, reaching USD 355.30 in 2010 and USD 357.94 in 2011.
- A more significant rise was seen in 2012, with an average expenditure of USD 391.49, followed by a slight decrease to USD 382.44 in 2013.
- From 2014 onwards, spending on furniture increased steadily, reaching USD 386.74 in 2014 and USD 502.25 in 2015.
- The trend continued, with USD 459.79 spent in 2016, USD 515.46 in 2017, and USD 518.43 in 2018.
- In 2019, the average expenditure rose to USD 520.99, and it continued upward to USD 534.17 in 2020.
- A sharp increase was observed in 2021, with average spending jumping to USD 715.60, and this upward trend continued in 2022, reaching an all-time high of USD 746.14.
- These figures reflect an overall growth in furniture expenditure among U.S. consumers over the 15 years, with particularly significant increases in the last few years.
(Source: Statista)
Expenditure On Household Furnishings and Equipment
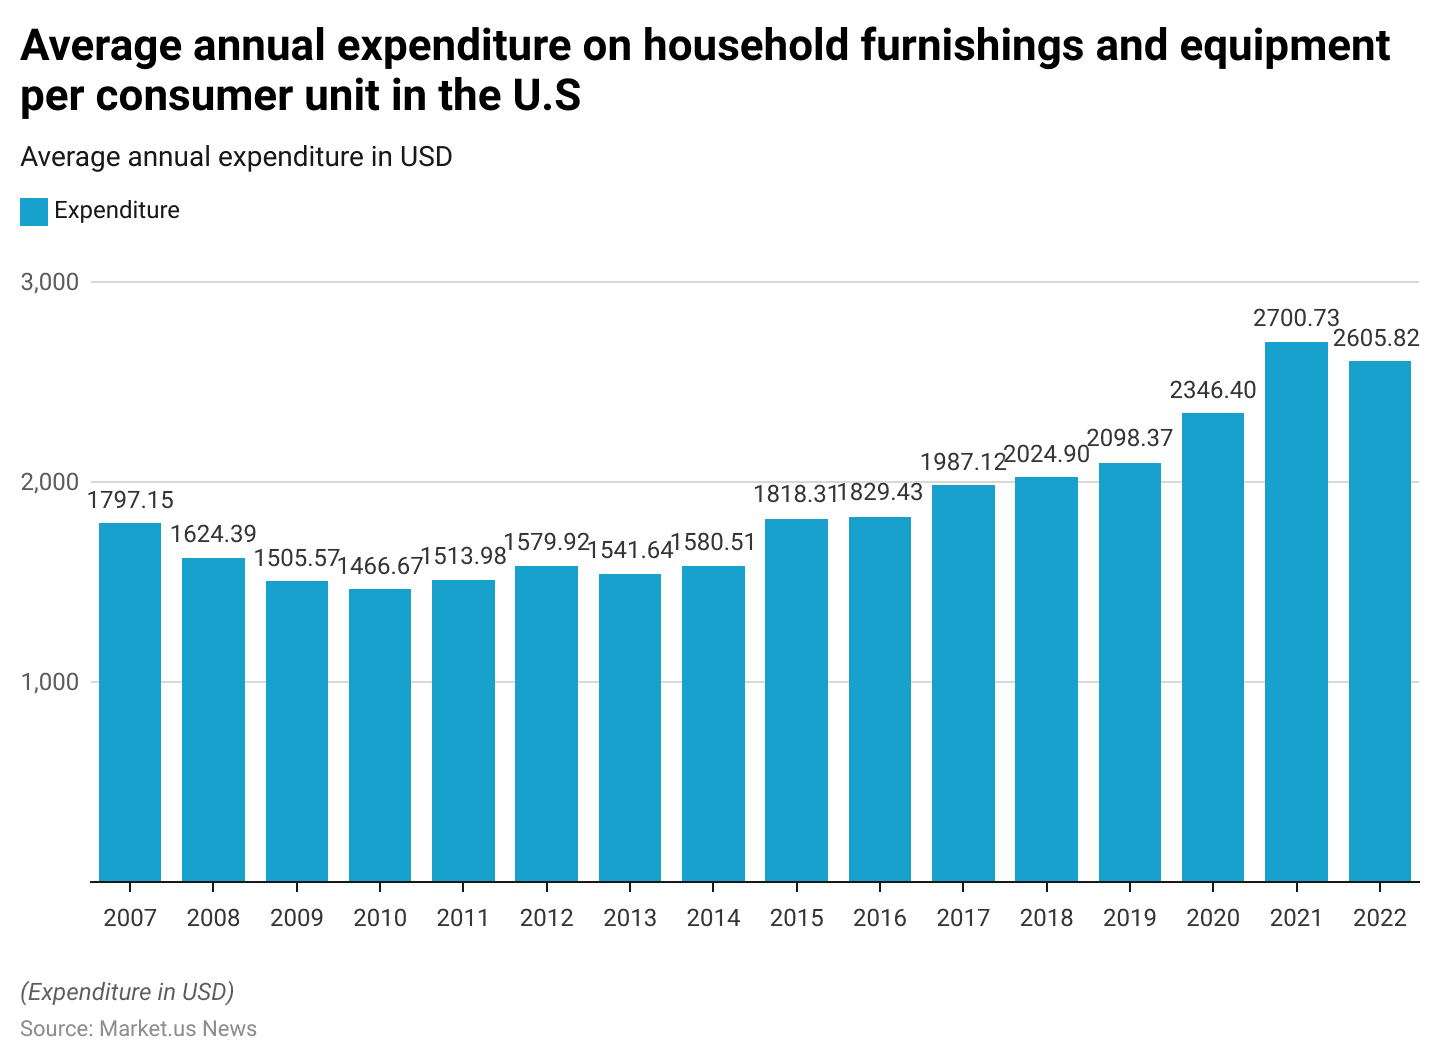
- The average annual expenditure on household furnishings and equipment per consumer unit in the United States has experienced both declines and growth from 2007 to 2022.
- In 2007, the average spending was USD 1,797.15, but it decreased in 2008 to USD 1,624.39 and continued to decline to USD 1,505.57 in 2009.
- In the following years, expenditure remained relatively stable, with USD 1,466.67 in 2010, USD 1,513.98 in 2011, and USD 1,579.92 in 2012.
- By 2013, spending had decreased slightly to USD 1,541.64 but increased again to USD 1,580.51 in 2014.
- In 2015, there was a notable increase in expenditure, reaching USD 1,818.31, and the upward trend continued in 2016 with USD 1,829.43.
- By 2017, spending had risen to USD 1,987.12 and further to USD 2,024.90 in 2018.
- Further, the average expenditure surpassed the USD 2,000 mark in 2019, with USD 2,098.37 spent on household furnishings and equipment.
- A significant surge occurred in 2020, with spending reaching USD 2,346.40, followed by a sharp rise in 2021 to USD 2,700.73.
- Although 2022 saw a slight decrease, the average expenditure remained high at USD 2,605.82.
- Overall, the data reflects a steady increase in spending on household furnishings and equipment over the 15 years, with notable growth, particularly in the last few years.
(Source: Statista)
Expenditure On Household Textiles
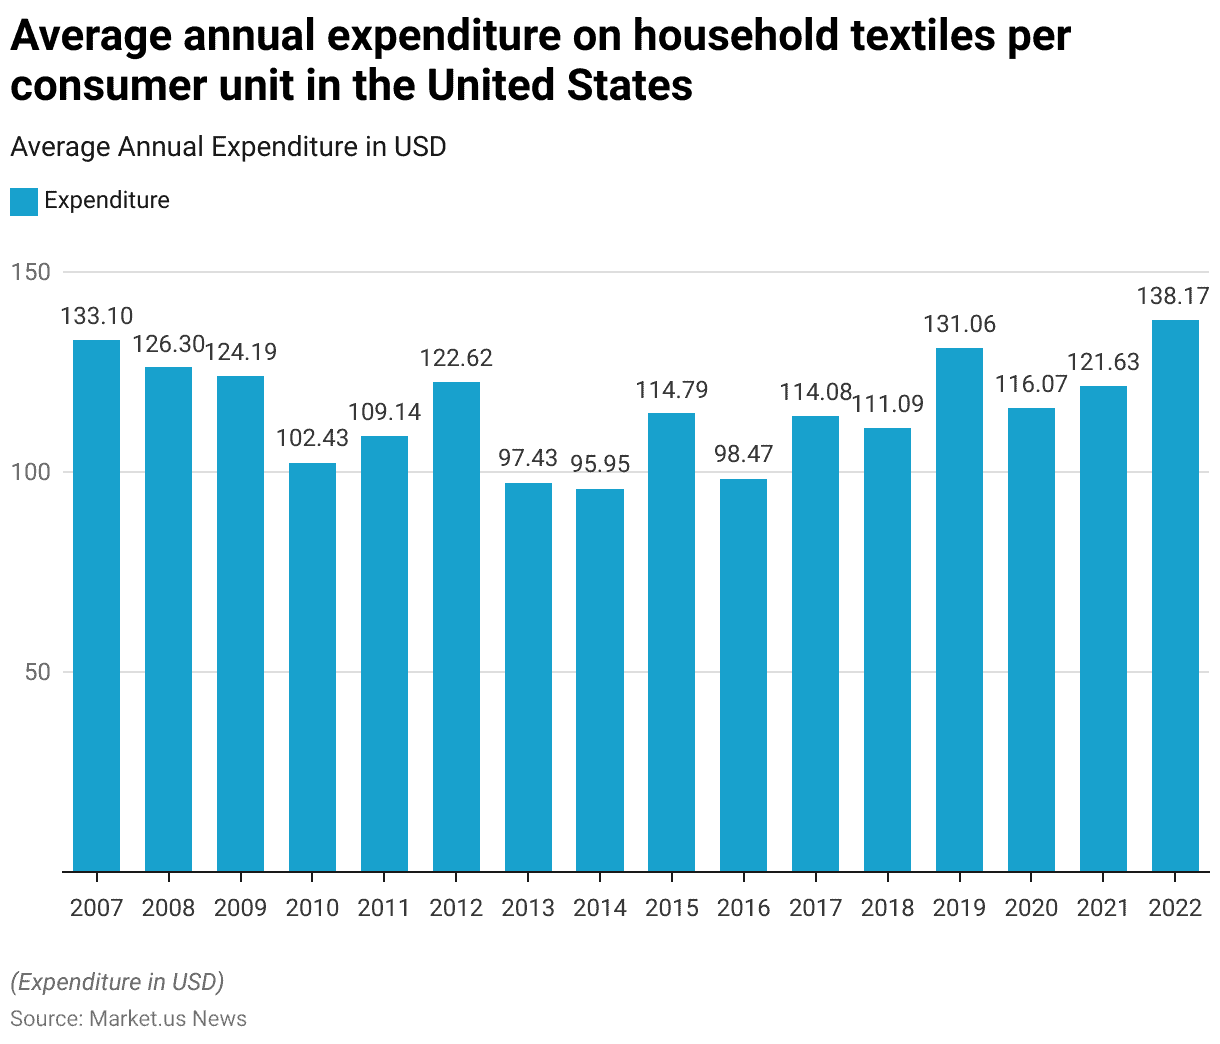
- The average annual expenditure on household textiles per consumer unit in the United States fluctuated between 2007 and 2022.
- In 2007, consumers spent an average of USD 133.10, which decreased to USD 126.30 in 2008 and further declined to USD 124.19 in 2009.
- The expenditure continued to drop to USD 102.43 in 2010 before slightly increasing to USD 109.14 in 2011.
- By 2012, spending on household textiles rose to USD 122.62, but it fell again to USD 97.43 in 2013 and further to USD 95.95 in 2014.
- In 2015, spending increased to USD 114.79, though it declined once more in 2016 to USD 98.47.
- The following years saw a rise, with USD 114.08 spent in 2017 and USD 111.09 in 2018.
- The upward trend continued in 2019, with an average expenditure of USD 131.06.
- In 2020, spending dipped slightly to USD 116.07 but increased to USD 121.63 in 2021, eventually reaching USD 138.17 in 2022, the highest during this period.
- Overall, the data shows that household textile expenditure has experienced fluctuations but generally increased in recent years.
(Source: Statista)
Change in Consumer Spending
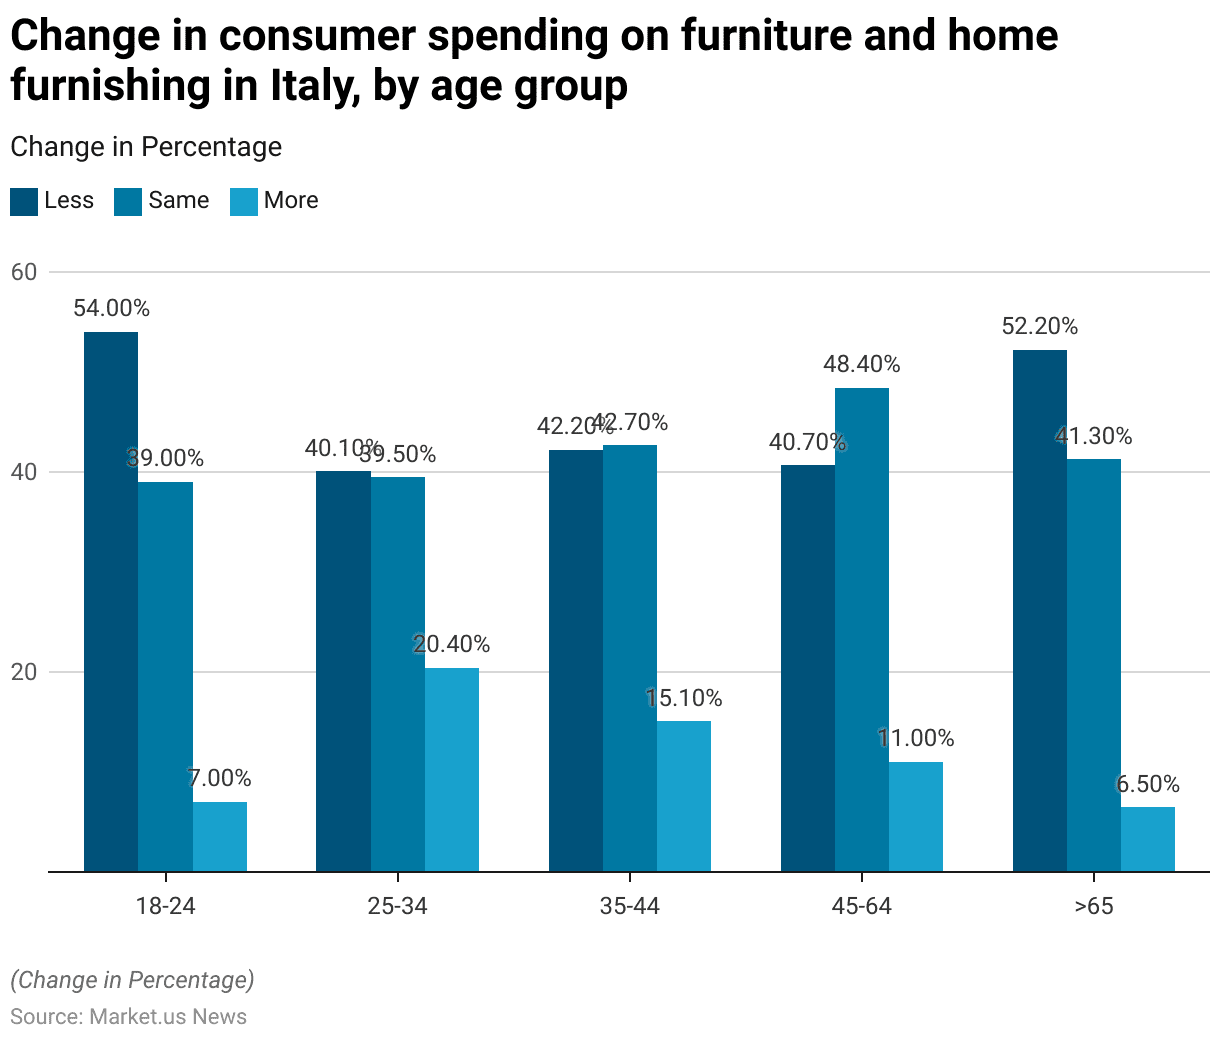
- In 2019, consumer spending on furniture and home furnishings in Italy varied significantly by age group.
- Among the 18-24 age group, 54% of respondents reported spending less, while 39% spent the same and only 7% spent more.
- In the 25-34 age bracket, 40.10% spent less, 39.50% maintained their spending, and 20.40% increased their expenditure.
- For those aged 35-44, 42.20% reported a decrease in spending, 42.70% kept it the same, and 15.10% spent more.
- In the 45-64 age group, 40.70% spent less, 48.40% spent the same, and 11% increased their spending.
- Among consumers aged 65 and above, 52.20% reduced their spending, 41.30% kept it unchanged, and 6.50% spent more.
- These figures reveal that younger consumers were more likely to reduce spending, with a noticeable difference in spending habits across age groups.
(Source: Statista)
Intention of Interior Decoration or Renovation Works
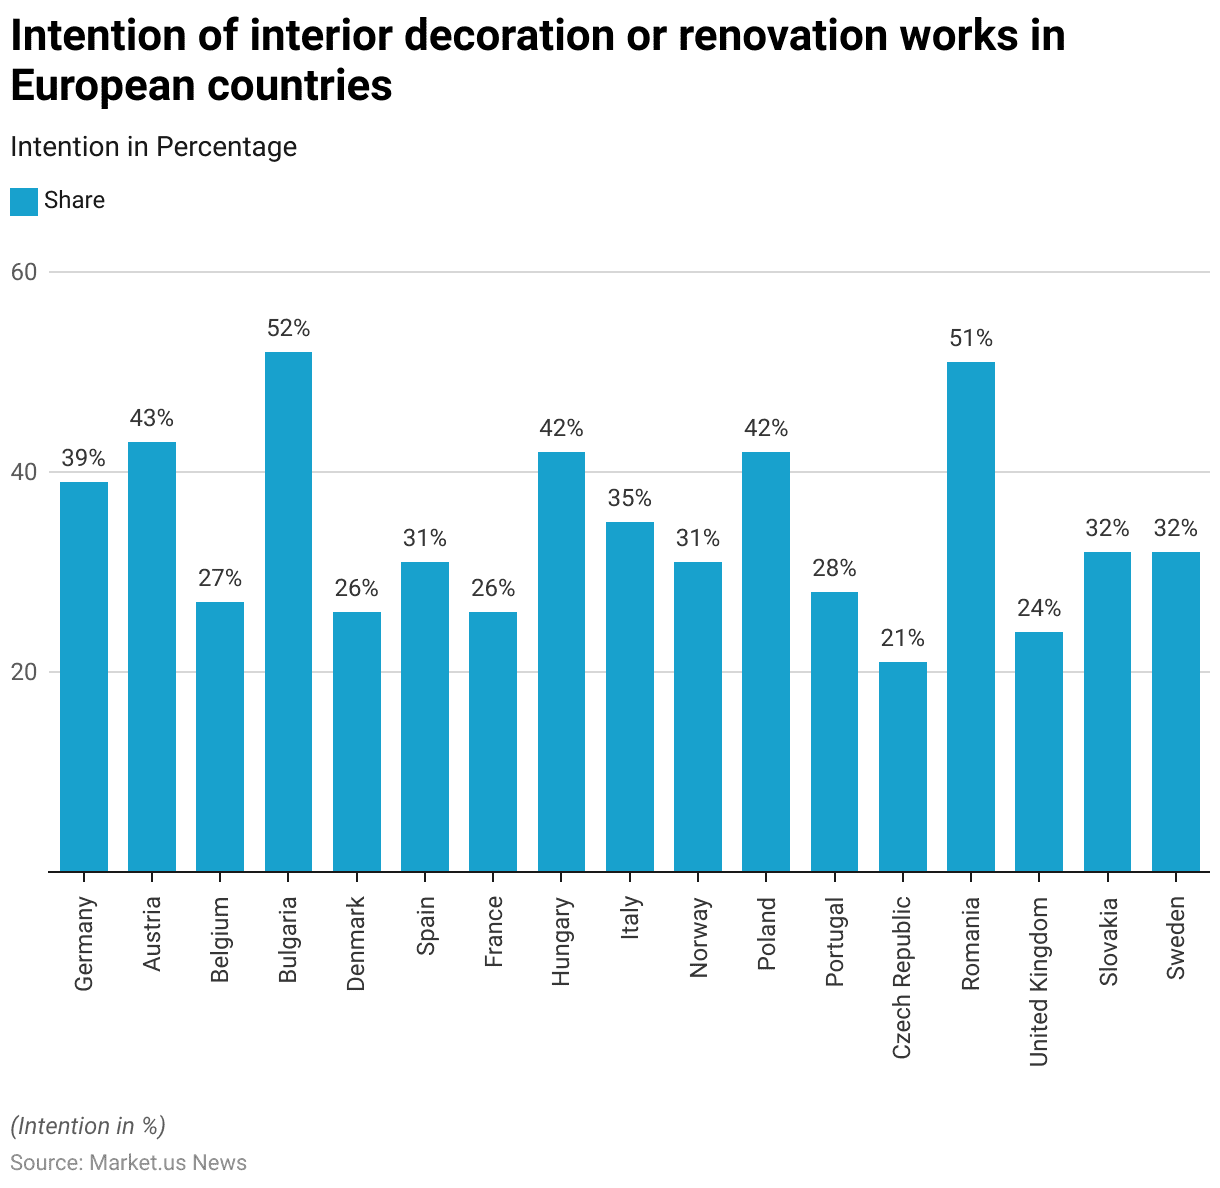
- In 2017, the intention to engage in home improvement or renovation works in the upcoming 12 months varied across European countries.
- Bulgaria had the highest percentage of respondents expressing intent, with 52% planning to undertake such projects, closely followed by Romania at 51%.
- Austria and Hungary both had strong responses, with 43% and 42%, respectively, indicating plans for home improvement, while 42% of respondents in Poland also planned to do so.
- Germany saw 39% of its population intending to engage in home improvement projects, while 35% of Italians expressed similar plans.
- In Spain and Norway, 31% of respondents were considering such activities, and 32% were in Slovakia and Sweden.
- In Belgium and Portugal, the figures were slightly lower, with 27% and 28% of respondents, respectively, indicating an intent to renovate.
- Meanwhile, only 26% of respondents in Denmark and France planned home improvements, with the Czech Republic recording the lowest intent at 21%.
- In the United Kingdom, 24% of respondents indicated plans for home improvement or renovation in the coming year.
- These statistics highlight varying levels of interest in home improvement across Europe during 2017.
(Source: Statista)
Consumer Satisfaction Statistics
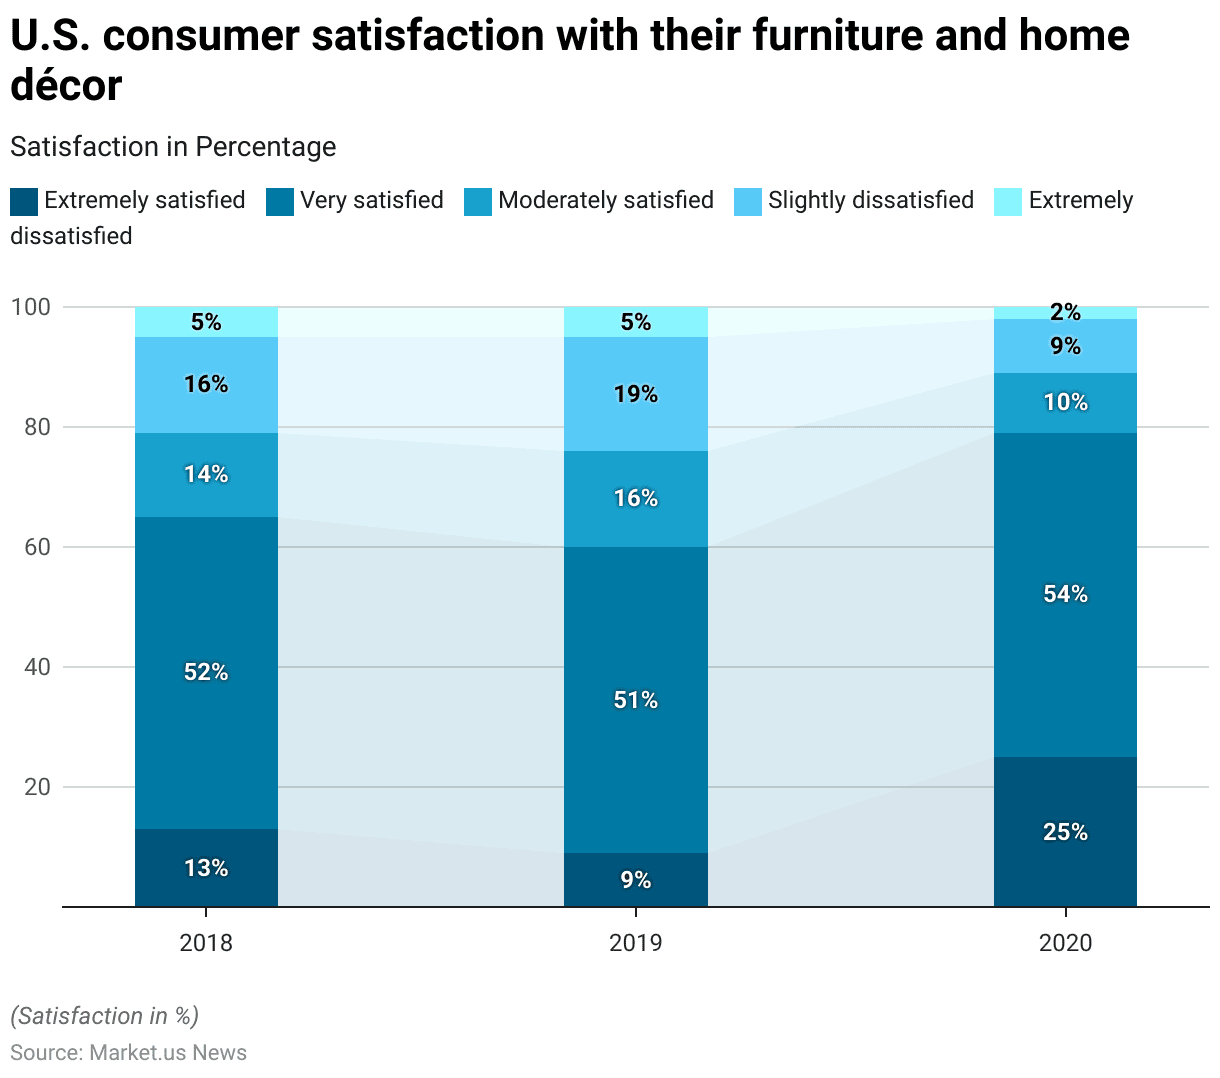
- Between 2018 and 2020, U.S. consumer satisfaction with their furniture and home décor experienced noticeable shifts.
- In 2018, 13% of consumers reported being extremely satisfied, a figure that dropped to 9% in 2019 but then surged to 25% in 2020.
- Further, the percentage of consumers who were very satisfied remained relatively stable, at 52% in 2018, 51% in 2019, and 54% in 2020.
- Moderate satisfaction saw slight variations, with 14% of consumers in 2018 feeling moderately satisfied, rising to 16% in 2019 before declining to 10% in 2020.
- The proportion of those who were slightly dissatisfied increased from 16% in 2018 to 19% in 2019, then dropped significantly to 9% in 2020.
- Lastly, extreme dissatisfaction remained low, at 5% in both 2018 and 2019, before decreasing to just 2% in 2020.
- Overall, consumer satisfaction showed improvement by 2020, with a notable increase in extreme satisfaction.
(Source: Statista)
Investment Trends
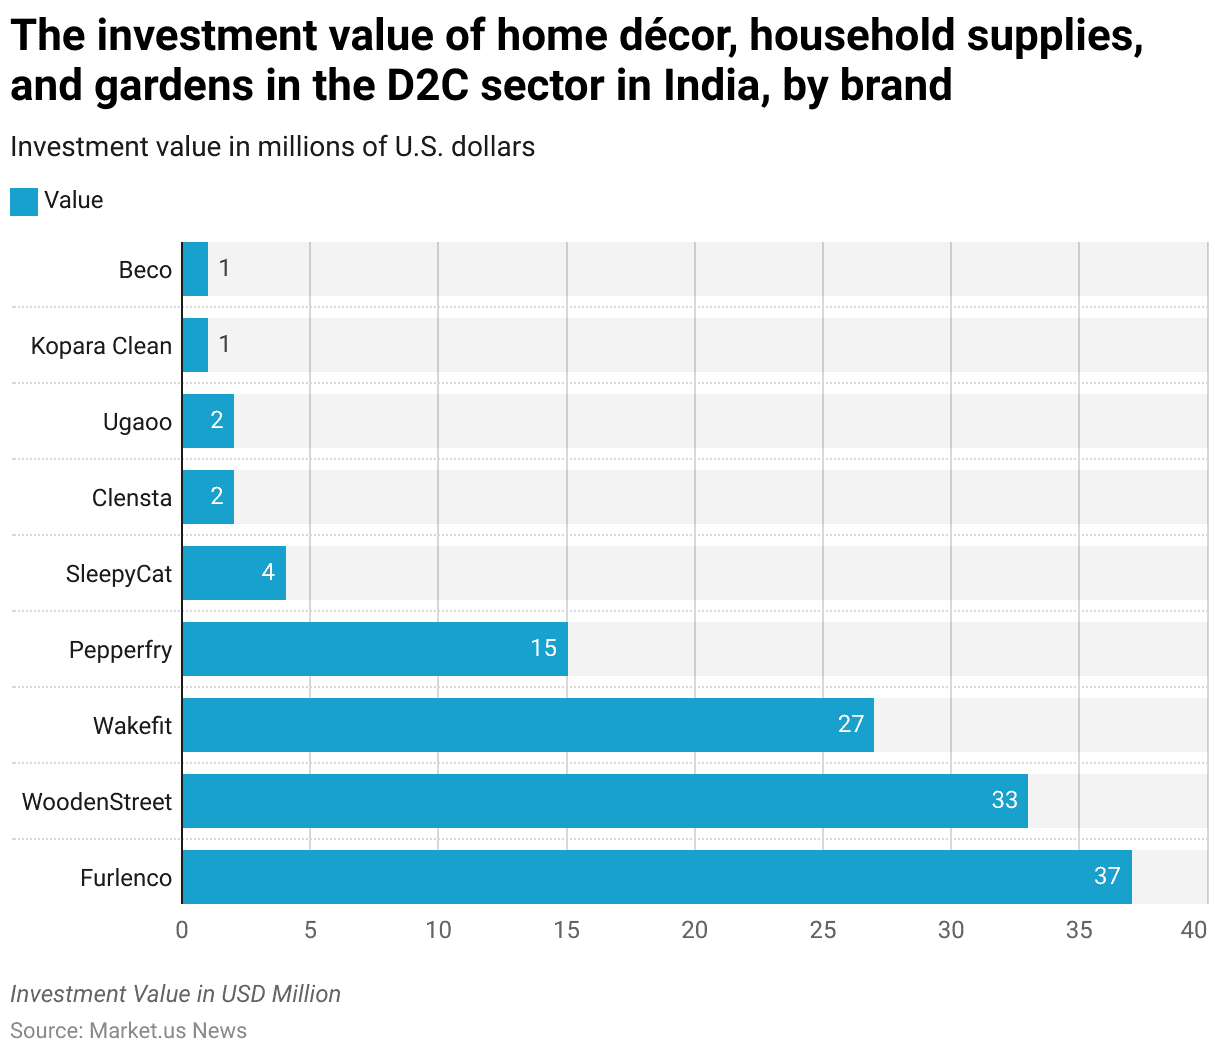
- Between January 2021 and April 2022, various brands in the home décor, household supplies, and garden sectors. Within India’s direct-to-consumer (D2C) market attracted significant investment.
- Further, furlenco led with an investment value of USD 37 million, followed closely by WoodenStreet, which secured USD 33 million.
- Wakefit received USD 27 million in investment, while Pepperfry attracted USD 15 million.
- SleepyCat garnered USD 4 million in funding, and both Clensta and Ugaoo each received USD 2 million.
- Kopara Clean and Beco each secured USD 1 million in investment during the same period.
- However, these investments highlight the growing interest and financial backing in India’s D2C home and lifestyle sectors.
(Source: Statista)
Home Decor Industry Challenges Statistics
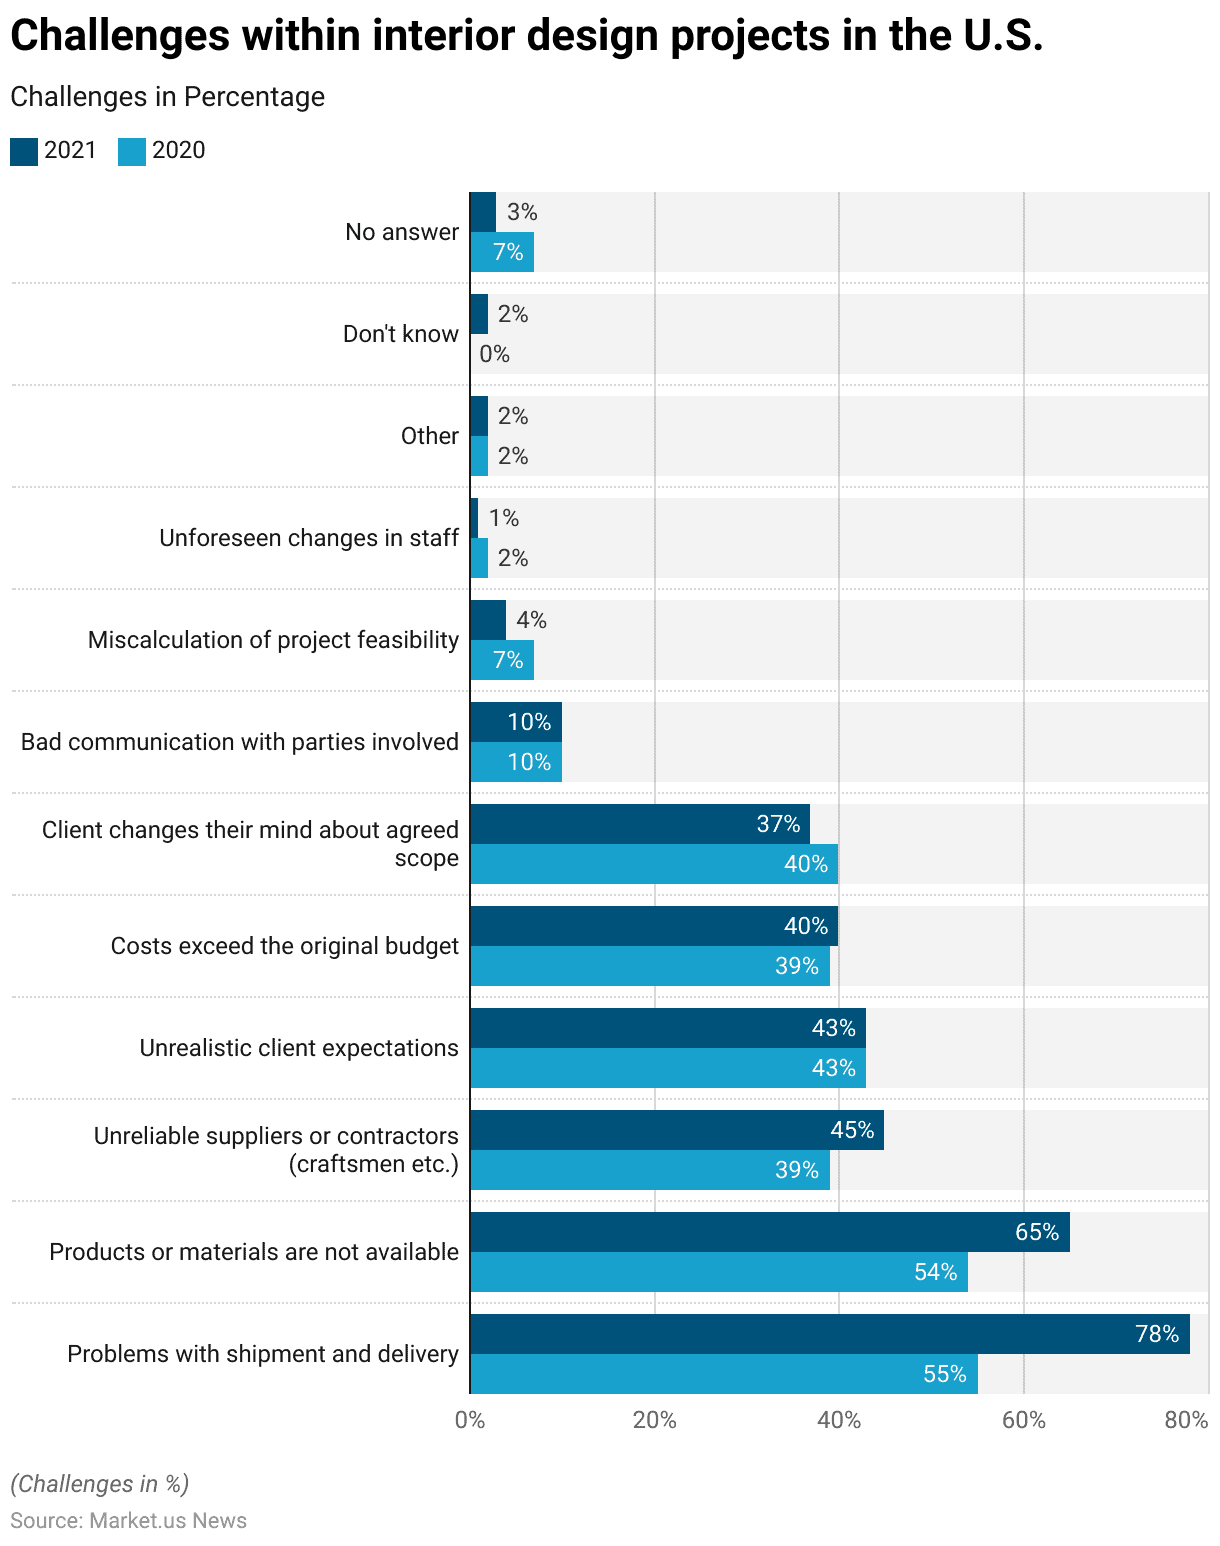
- In 2020 and 2021, interior design projects in the U.S. encountered several common challenges.
- Moreover, the most significant issue in 2021 was problems with shipment and delivery, reported by 78% of respondents, up from 55% in 2020.
- Additionally, 65% of respondents in 2021 cited the unavailability of products or materials, an increase from 54% in 2020.
- Unreliable suppliers or contractors were mentioned by 45% of respondents in 2021, compared to 39% in 2020.
- Unrealistic client expectations remained constant, with 43% of respondents noting this issue in both years.
- The challenge of costs exceeding the original budget was reported by 40% in 2021, slightly higher than 39% in 2020.
- Client changes to the agreed project scope decreased slightly, from 40% in 2020 to 37% in 2021.
- Communication issues with involved parties remained consistent at 10% in both years.
- Other challenges, such as miscalculation of project feasibility, decreased from 7% in 2020 to 4% in 2021, and unforeseen changes in staff were reported by 2% in 2020 and 1% in 2021.
- Smaller issues like other challenges, unknown responses, and no answers showed minimal variations between the two years.
- Overall, the data highlights significant challenges, particularly in logistics, availability, and supplier reliability, impacting interior design projects in the U.S.
(Source: Statista)
Upcoming Trends
- In 2021, U.S. interior designers predicted several key trends that would shape the industry in the next one to two years.
- Natural elements and biomaterials were seen as highly relevant by 34% of respondents, with 20% considering them to have very high relevance.
- Eco-chic, sustainable-chic, and upcycling followed closely, with 35% rating them as highly relevant and 14% seeing them as very highly relevant.
- Individualization was expected to play a significant role, with 22% rating it as highly relevant and 13% as very highly relevant.
- Fast furniture, known for its affordability and quick production, was noted by 23% as highly relevant, though only 6% saw it as very highly relevant.
- Hybrid homes, which combine work and living spaces, were rated as highly relevant by 18%, with 7% seeing them as very highly relevant.
- Maximalism, or the “more is more” approach, was seen as highly relevant by 16% and very highly relevant by 7%.
- At the same time, minimalism had similar ratings, with 17% finding it highly relevant and 4% considering it very highly relevant.
- Shared living and housing cooperation were seen as trends by 12% of respondents, with 3% rating it as very highly relevant.
- Tiny homes were considered highly relevant by 10% of respondents, though only 2% viewed them as very highly relevant.
- These insights suggest that sustainability, natural elements, and individualization will be among the most influential trends in upcoming interior design projects.
(Source: Statista)
Recent Home Decor Innovations Statistics
- The home decor market has seen exciting innovations in 2023, with key trends focusing on sustainability, smart home technology, and bold design choices.
- Companies such as Dyson have introduced multifunctional tools like the V15s Detect Submarine, a vacuum and wet mop combo, streamlining home cleaning tasks.
- Eco-consciousness continues to drive innovation, with brands like Vitamix launching the Eco 5 FoodCycler, an electric composter that reduces kitchen waste by 90%.
- In design, there is a growing interest in using vintage and handcrafted pieces, offering a sense of heritage while supporting sustainability.
- Curved furniture and sculptural decor are becoming more prevalent, blending aesthetics with functionality.
- Additionally, smart home features, such as Leviton’s whole-home energy monitors, are enhancing home management by providing real-time energy data through mobile apps.
- These innovations reflect a trend toward combining technology with personalized, eco-friendly decor choices.
(Sources: Bob Vila, MyDomaine, Better Homes & Gardens)
Recent Developments
Acquisitions and Mergers:
- Wayfair acquires Perigold: In 2023, Wayfair, a major online retailer of home goods, acquired Perigold, a luxury home decor brand, for $150 million. This acquisition expands Wayfair’s portfolio in the high-end home decor market. Allowing it to offer more exclusive and premium products to its customers.
- Etsy acquires Depop: In mid-2023, Etsy, the online marketplace for handmade and vintage items, acquired Depop. A social shopping app popular among younger consumers, for $1.6 billion. This acquisition enhances Etsy’s reach in the home decor market by appealing to a broader, younger demographic interested in unique and personalized decor items.
New Product Launches:
- IKEA launches “Sustainable Living” Collection: In 2024, IKEA introduced its new “Sustainable Living” home decor collection. Featuring products made from recycled materials and designed with energy efficiency in mind. This launch aligns with the growing consumer demand for eco-friendly home decor solutions.
- Target launches “Hearth & Hand with Magnolia” expansion: In late 2023, Target expanded its popular “Hearth & Hand with Magnolia” home decor line, created in partnership with Chip and Joanna Gaines. The expansion includes new seasonal items and furniture, catering to the continued trend of farmhouse and rustic home decor styles.
Funding:
- Pepperfry raises $40 million for expansion: In 2023, Pepperfry, an Indian online furniture and home decor retailer. Raised $40 million to expand its operations and increase its offline presence with more physical experience centers across India. The funding will also be used to enhance its logistics and supply chain capabilities.
- Made.com secures $70 million for international growth: In 2024, Made.com, a UK-based online furniture and home decor retailer, secured $70 million in funding to accelerate its international expansion across Europe and enter new markets in the United States. This funding will also support the development of its digital platform.
Technological Advancements:
- Augmented Reality (AR) in Home Decor: AR is increasingly being used in the home decor industry to help customers visualize products in their own spaces before making a purchase. By 2025, over 40% of home decor retailers are expected to offer AR features on their websites or apps. Enhancing the shopping experience and reducing return rates.
- Smart Home Integration: The integration of smart technology into home decor products is on the rise, with more consumers looking for connected devices that blend seamlessly with their interiors. By 2025. Smart home decor products are projected to account for 25% of the home decor market, driven by innovations in lighting, furniture, and accessories.
Market Dynamics:
- Growth in Home Decor Market: The market is driven by increasing consumer spending on home improvement, the rise of e-commerce, and the growing trend of DIY home decor projects.
- Rising Demand for Sustainable and Eco-Friendly Products: As consumers become more environmentally conscious, there is a growing demand for sustainable and eco-friendly home decor products. By 2025, sustainable home decor products are expected to represent 30% of the market. As more brands introduce eco-conscious collections consumers prioritize sustainability in their purchasing decisions.
Conclusion
Home Decor Statistics – The home decor industry has exhibited consistent growth, driven by evolving consumer preferences, technological advancements, and increased demand for sustainable, personalized, and functional living spaces.
As trends shift towards natural elements, eco-chic designs, and the integration of smart technology, the industry is expected to continue expanding.
However, emerging themes such as individualization, hybrid homes, hybrid workplaces, and sustainability highlight a consumer base that prioritizes both aesthetics and environmental consciousness.
Further, with the global market’s steady expansion, fueled by a combination of economic factors and changing lifestyles. The home decor industry remains a dynamic and promising sector for future development.
FAQs
Home decor refers to the aesthetic components used to make a home more visually appealing and comfortable. This includes furniture, artwork, lighting, textiles, and accessories used to style different spaces within a home.
Current trends include eco-friendly and sustainable designs, the use of natural elements like wood and plants, minimalist aesthetics, smart home integrations, and personalization through unique and eclectic decor items.
Essential elements of home decor include furniture, textiles (like rugs, curtains, and cushions), lighting, wall art, decorative accessories, and functional storage solutions. Each element should complement your overall design theme.
Modern decor refers to a design style from the early to mid-20th century, characterized by clean lines, minimalism, and natural materials. Contemporary decor refers to current trends, which can change over time. Often blending various styles with an emphasis on simplicity and functionality.
Fast furniture refers to affordable, mass-produced furniture that’s often made to follow the latest trends. While cost-effective, it typically lacks the durability and sustainability of higher-quality pieces, and it may be replaced more frequently.


