Table of Contents
- Introduction
- Editor’s Choice
- Home Improvement Services Market Statistics
- Top Home Improvement Service Projects Statistics
- Leading Hardware and Home Improvement Retailers – By Retail Sales Statistics
- Motivation Behind Home Improvement Statistics
- Planned Home-Related Activities Among Homeowners
- Average Home Improvements Renovation Budget Statistics
- Return on Investment (ROI) from Home Renovation
- Top Funding Sources Among Home Renovators
- Length of Home Renovation Projects
- Home Remodeling Projects with the Highest Cost Recovered
- Home Improvement Remodeling Projects with the Lowest Cost Recovered Statistics
- Home Improvement Challenges and Statistics
- Adoption of Smart Technology in Home Improvement Statistics
- Recent Developments
- Conclusion
- FAQs
Introduction
Home Improvement Statistics: The home improvement industry, a crucial part of construction, thrives due to urbanization, higher incomes, and changing lifestyles.
Renovations, remodeling, and upgrades by homeowners, contractors, and specialized providers shape this vibrant sector.
It includes various areas like interior and exterior renovations, energy-efficient updates, and smart home integration.
Influenced by demographic changes, housing markets, and technological progress. Major retailers such as Home Depot and Lowe’s dominate alongside smaller suppliers.
Advancements like AR tools and smart home tech revolutionize project planning. Despite challenges like economic uncertainty and labor shortages. The industry holds promise, driven by urbanization, tech innovation, and sustainability, offering opportunities for stakeholders.
Editor’s Choice
- The global home improvement services market revenue reached USD 381.9 billion in 2023.
- By 2033, the market is anticipated to achieve USD 391.38 billion in offline revenue and USD 260.92 billion in online revenue.
- In 2020, among the most popular home service projects among households in the United States. Interior painting was undertaken by 35% of households, indicating a strong preference for refreshing and updating home interiors.
- In 2022, among the leading hardware and home improvement retailers in the United States. Home Depot led the industry with retail sales amounting to USD 145.94 billion. Highlighting its extensive market reach and consumer preference.
- According to the 2022 Remodeling Impact Report by the NAR. A substantial 83% of homeowners had already intended to renovate, irrespective of the pandemic.
- From 2020 to 2021, homeowners’ median spending increased by 20%, climbing from $15,000 to $18,000.
- Among homeowners who have finished their projects this year, primary obstacles encompassed locating suitable professionals (45%). Acquiring products and materials (34%), and adhering to budgetary constraints (28%).

Home Improvement Services Market Statistics
Global Home Improvement Services Market Size Statistics
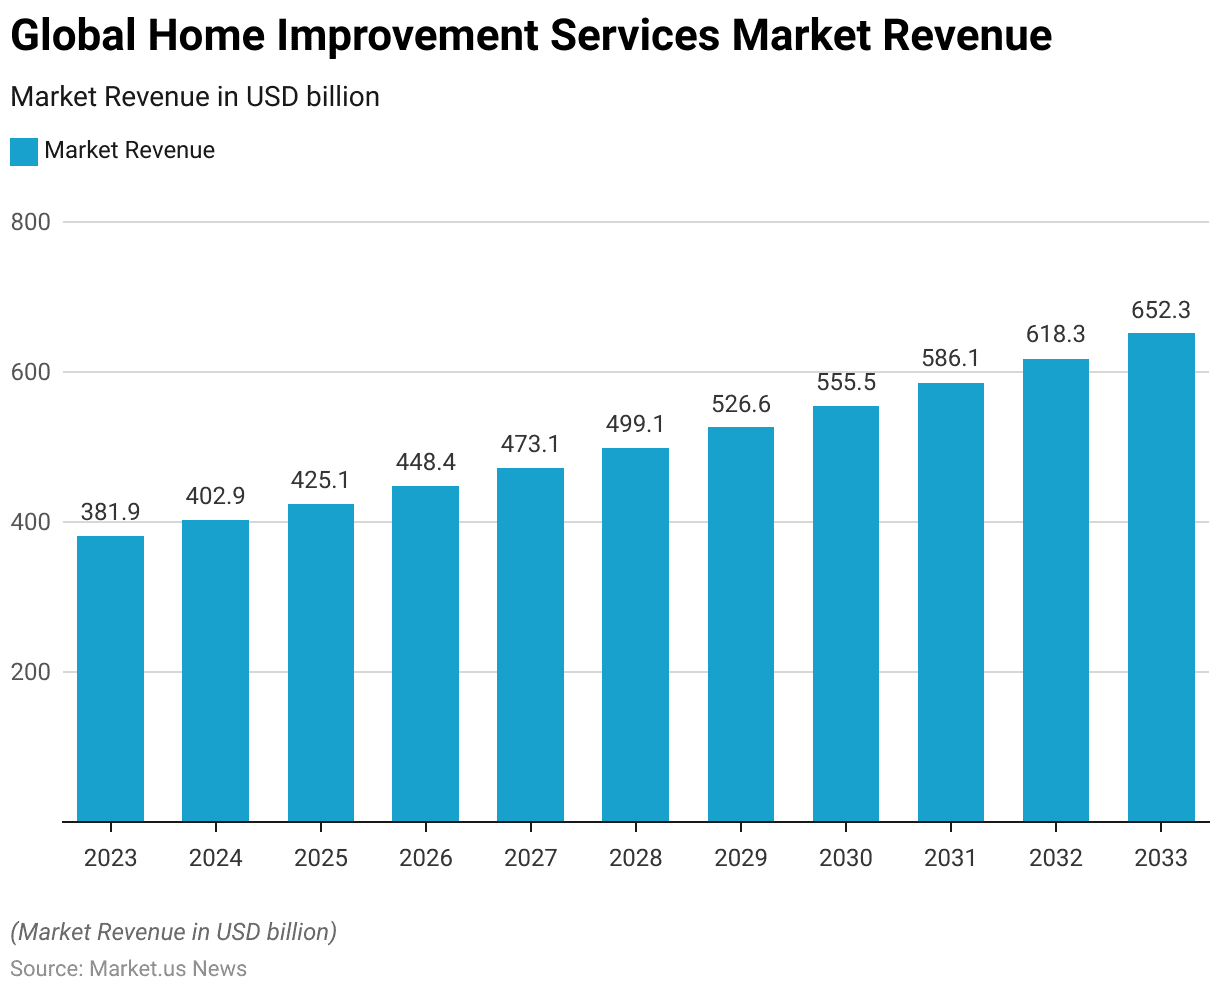
- The global home improvement services market has demonstrated a steady growth trajectory at a CAGR of 5.50%. With revenue increasing from USD 381.9 billion in 2023 to USD 402.9 billion in 2024.
- This upward trend is projected to continue, reaching USD 425.1 billion in 2025 and USD 448.4 billion in 2026.
- By 2027, market revenue is anticipated to rise to USD 473.1 billion, followed by USD 499.1 billion in 2028.
- The market is expected to maintain its growth momentum. With revenues hitting USD 526.6 billion in 2029 and USD 555.5 billion in 2030.
- Looking further ahead, the market is forecasted to achieve USD 586.1 billion in 2031, USD 618.3 billion in 2032, and USD 652.3 billion by 2033.
- This consistent growth underscores the increasing demand and investment in home improvement services globally.
(Source: market.us)
Global Home Improvement Services Market Size – By Deployment Statistics
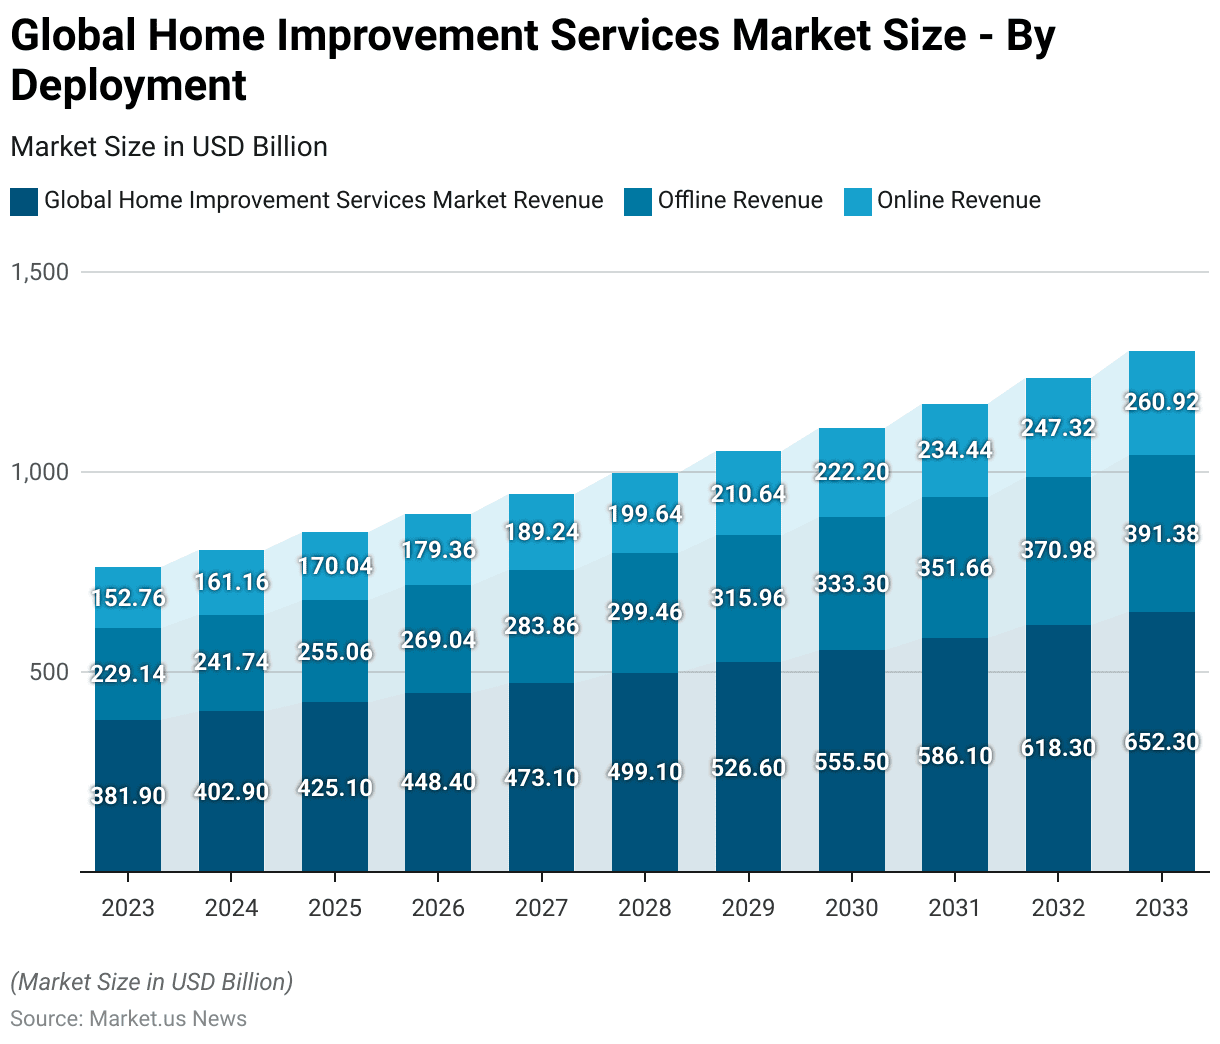
- The global home improvement services market is experiencing significant growth. The total market revenue is projected to increase from USD 381.9 billion in 2023 to USD 652.3 billion by 2033.
- This growth is evident in both offline and online segments. In 2023, offline revenue accounted for USD 229.14 billion, while online revenue was USD 152.76 billion. By 2024, these figures are expected to rise to USD 241.74 billion offline and USD 161.16 billion online.
- The trend continues, with offline revenues projected at USD 255.06 billion in 2025 and USD 269.04 billion in 2026. The corresponding online revenues of USD 170.04 billion and USD 179.36 billion.
- By 2027, offline and online revenues are anticipated to reach USD 283.86 billion and USD 189.24 billion, respectively.
- The market is set to expand further, with offline revenues hitting USD 299.46 billion in 2028 and online revenues reaching USD 199.64 billion. This growth persists through 2029, with offline revenues at USD 315.96 billion and online revenues at USD 210.64 billion.
- By 2030, these figures are expected to rise to USD 333.3 billion offline and USD 222.2 billion online. The upward trajectory continues, with projections for 2031 showing USD 351.66 billion in offline revenue and USD 234.44 billion in online revenue.
- In 2032, offline and online revenues are forecasted to reach USD 370.98 billion and USD 247.32 billion, respectively.
- By 2033, the market is anticipated to achieve USD 391.38 billion in offline revenue and USD 260.92 billion in online revenue. This consistent growth reflects the increasing consumer demand for both offline and online home improvement services.
(Source: market.us)
Top Home Improvement Service Projects Statistics
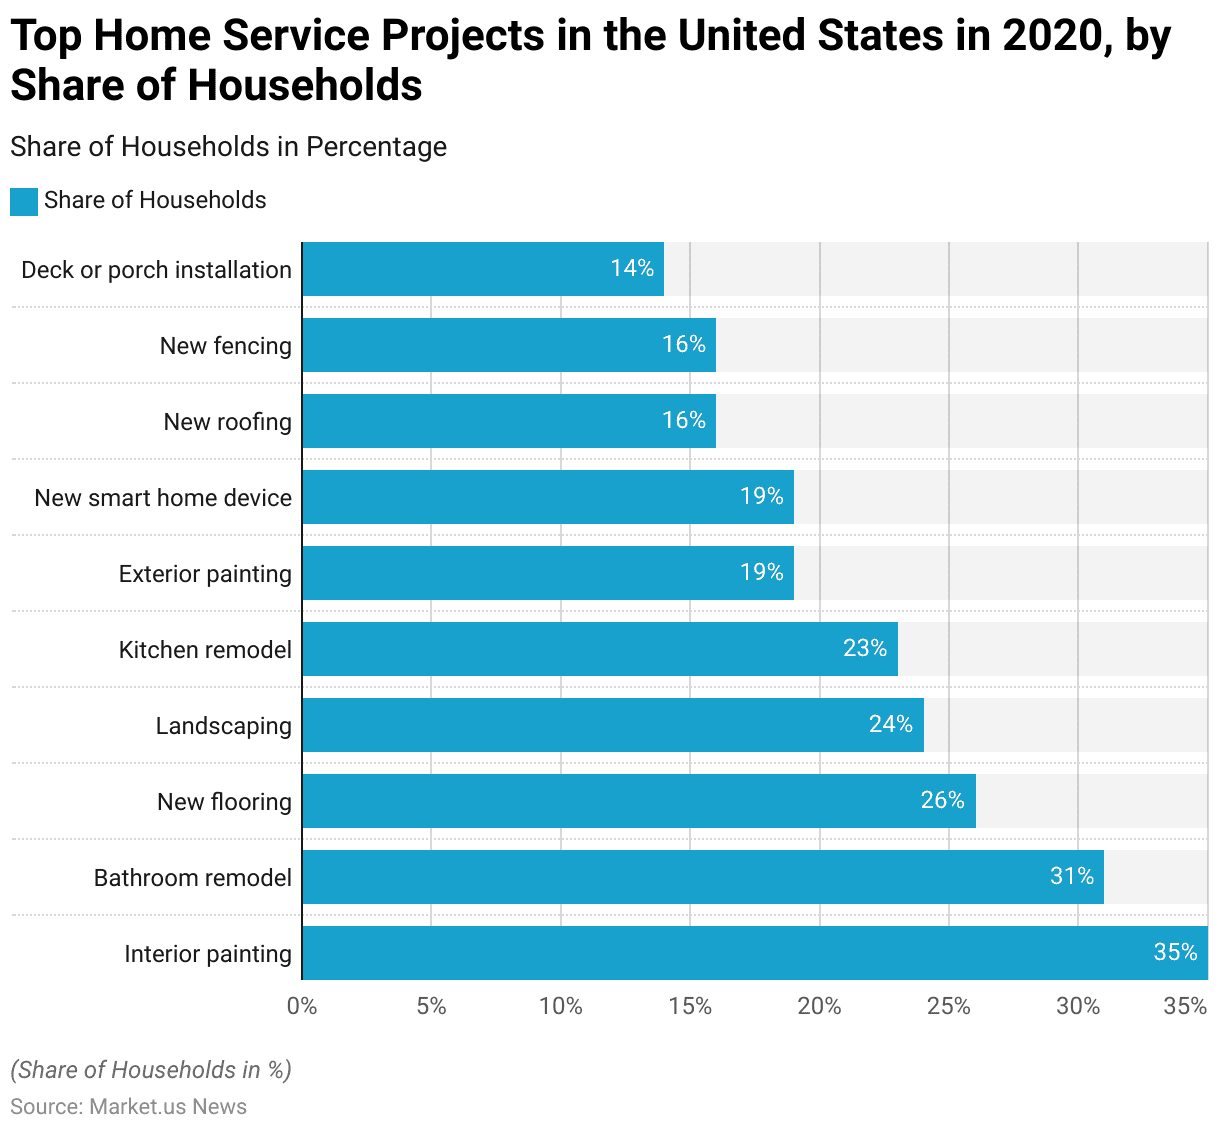
- In 2020, the most popular home service projects among households in the United States were diverse, reflecting a range of interior and exterior improvements.
- Leading the list, interior painting was undertaken by 35% of households. Indicating a strong preference for refreshing and updating home interiors. Bathroom remodels followed closely, with 31% of households opting for this project. Highlighting the importance of modernizing and enhancing bathroom spaces.
- New flooring installations were chosen by 26% of households, emphasizing the desire for upgraded and stylish flooring options. Landscaping projects were completed by 24% of households, showing significant interest in improving outdoor aesthetics and functionality.
- Kitchen remodels, a critical area for home value and enjoyment, were undertaken by 23% of households.
- Exterior painting projects were carried out by 19% of households, aligning with efforts to enhance curb appeal. Similarly, 19% of households invested in new smart home devices. Reflecting a growing trend toward home automation and advanced technology integration.
- New roofing projects were completed by 16% of households, addressing essential home maintenance and protection. New fencing installations also accounted for 16% of household projects, contributing to improved privacy and security.
- Finally, deck or porch installations were undertaken by 14% of households, underscoring the desire for enhanced outdoor living spaces. These trends illustrate the varied focus of American households on both aesthetic and functional home improvements in 2020.
(Source: Statista)
Leading Hardware and Home Improvement Retailers – By Retail Sales Statistics
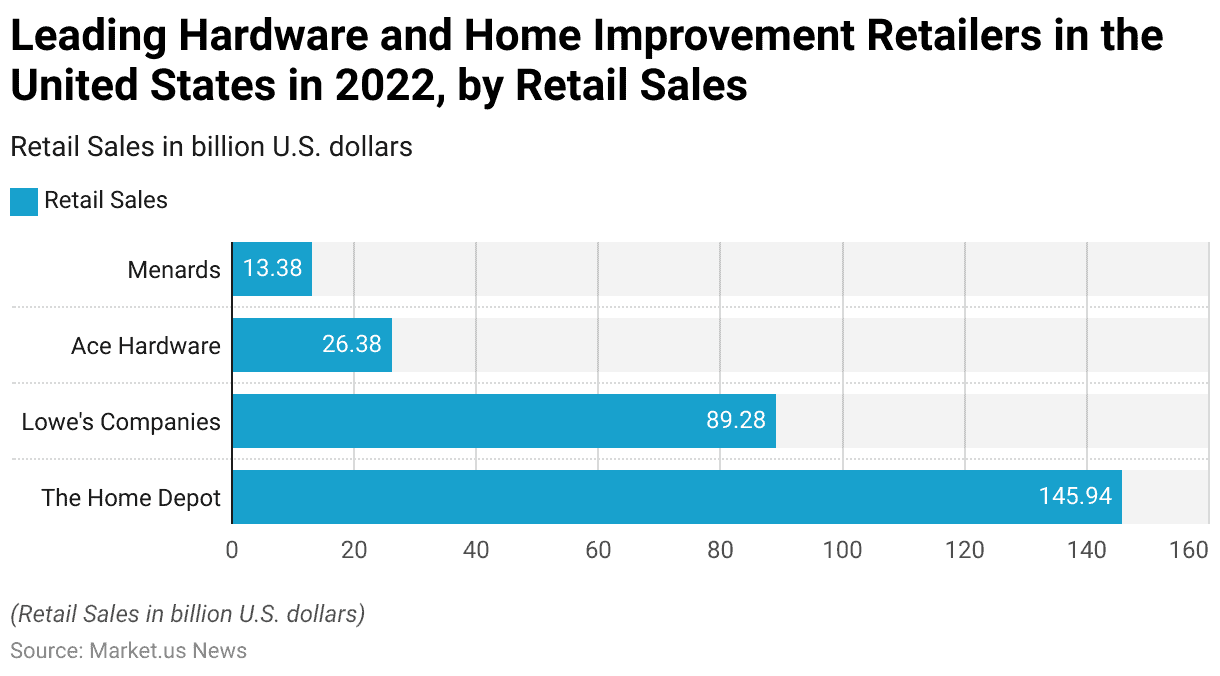
- In 2022, the leading hardware and home improvement retailers in the United States demonstrated substantial market dominance through impressive retail sales figures.
- The Home Depot led the industry with retail sales amounting to USD 145.94 billion. Highlighting its extensive market reach and consumer preference.
- Lowe’s Companies followed as the second-largest retailer, generating USD 89.28 billion in sales. Reflecting its strong presence in the home improvement sector.
- Ace Hardware secured the third position with retail sales of USD 26.38 billion, showcasing its significant footprint in the market.
- Menards also maintained a prominent position, achieving USD 13.38 billion in retail sales.
- These figures underscore the robust performance and competitive landscape of the leading hardware and home improvement retailers in the United States.
(Source: Statista)
Motivation Behind Home Improvement Statistics
- The global situation itself didn’t solely drive the surge in home renovations during the pandemic.
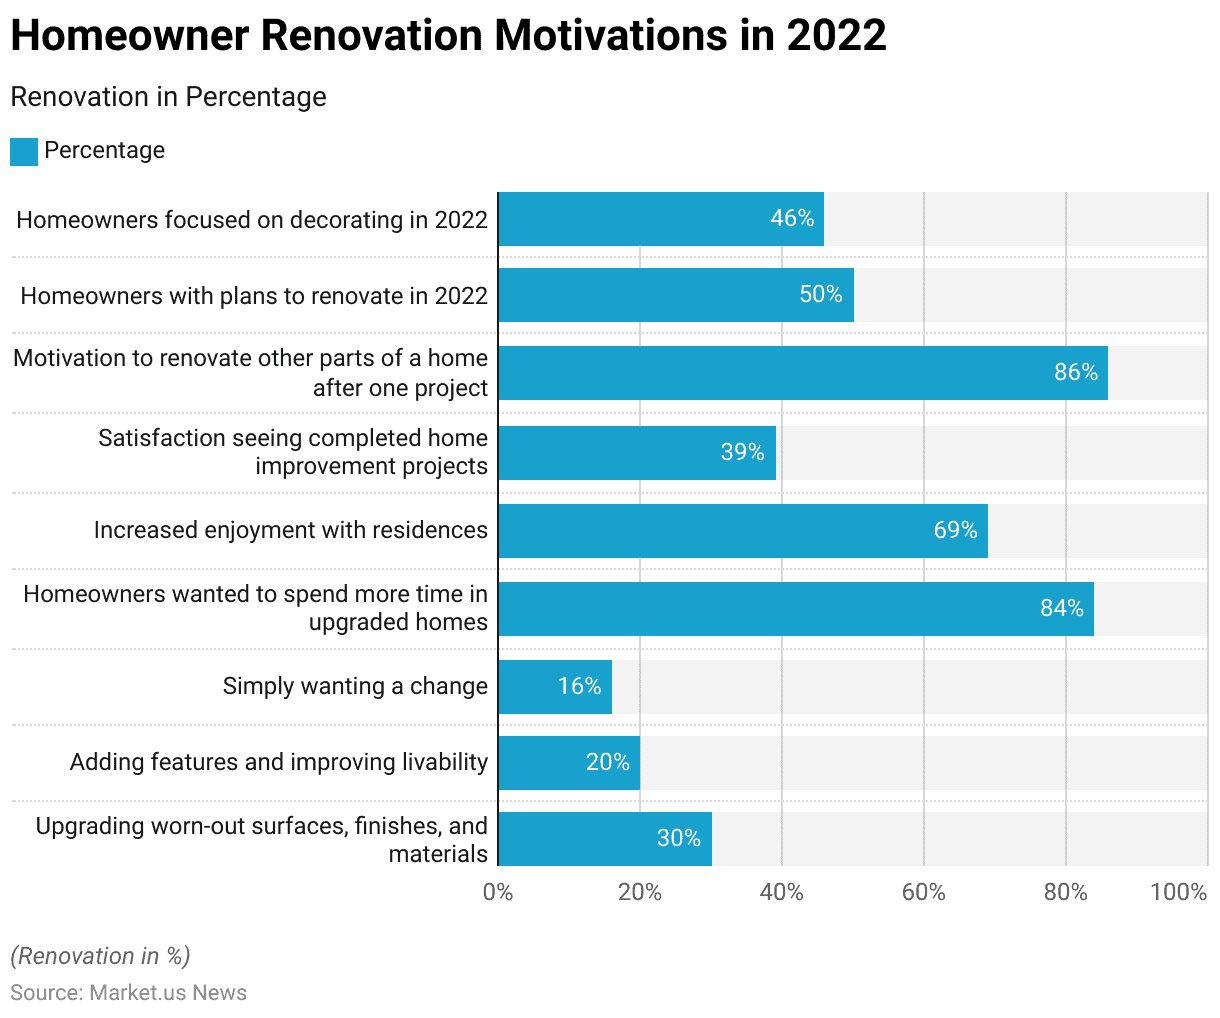
- According to the 2022 Remodeling Impact Report by the NAR, a substantial 83% of homeowners had already intended to renovate, irrespective of the pandemic.
- Their motivations varied, with 30% aiming to upgrade worn-out surfaces, finishes, and materials, 20% seeking to add features and enhance livability, and 16% simply desiring change. The gratification derived from these home improvements significantly contributed to homeowners’ overall contentment with their living spaces.
- The NAR’s data revealed that 84% of homeowners expressed a desire to spend more time in their upgraded homes. While 69% reported heightened satisfaction with their residences.
- Moreover, 39% found fulfillment in witnessing the completion of their home improvement endeavors.
- Furthermore, the completion of renovations served as inspiration for further enhancements. Post-renovation, a remarkable 86% of homeowners felt motivated to undertake additional remodeling projects in other areas of their homes.
- This momentum persisted into 2022, with over half of respondents expressing intentions to renovate, while 46% were focused on decorating.
(Source: NAR’s 2022 Remodeling Impact Report)
Planned Home-Related Activities Among Homeowners
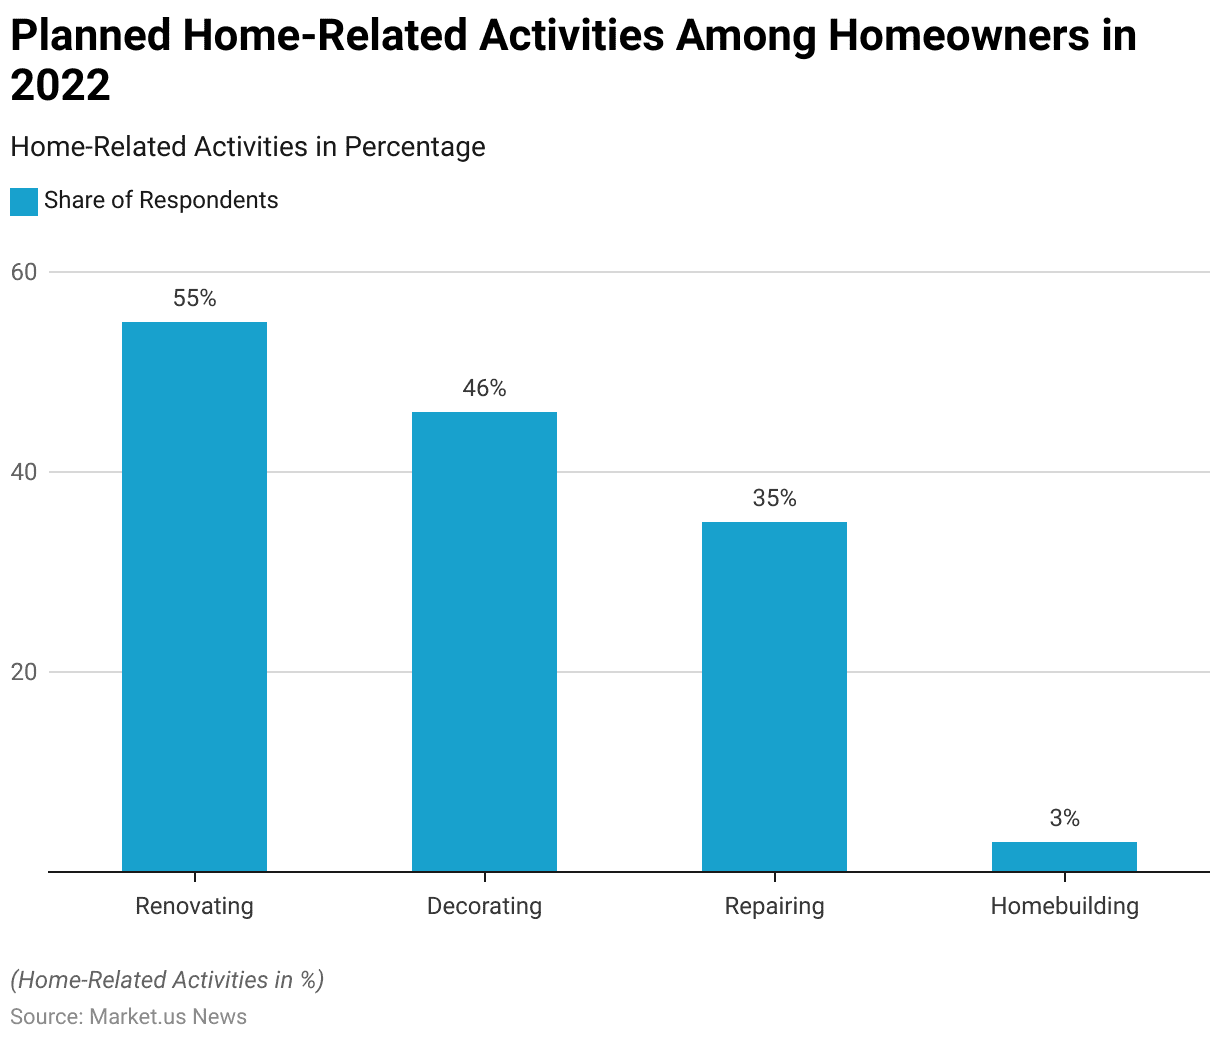
- In 2022, homeowners engaged in a variety of home-related activities. Reflecting their ongoing commitment to enhancing and maintaining their living spaces.
- Renovating was the most popular activity, with 55% of respondents planning to undertake renovation projects.
- Decorating followed, with 46% of homeowners intending to update their home interiors with new Homecare & Decor.
- Home repairs were also a significant focus, with 35% of respondents planning to address various maintenance issues.
- Additionally, 3% of homeowners expressed plans to build new homes. Indicating a smaller yet notable interest in new home construction.
- These planned activities underscore the diverse approaches homeowners are taking to improve their residences.
(Source: U.S. Houzz and Home Study)
Average Home Improvements Renovation Budget Statistics
- The 2022 U.S. Houzz and Home Study indicates a noticeable rise in home improvement budgets over recent years.
- From 2020 to 2021, homeowners’ median spending increased by 20%, climbing from $15,000 to $18,000. This marked the first uptick in planned renovation expenditures since 2018. However, projections from Houzz suggest a potential decrease in spending to $15,000 for 2022, although final figures have yet to be released.
- Moreover, spending patterns varied based on homeowners’ tenure. New home buyers, for instance, allocated up to $30,000 for renovations, twice the national median. Those who had owned their homes for one to five years spent an average of $19,000, while long-term homeowners residing in their homes for six or more years typically aligned with the national average of $15,000.
- In terms of project focus, interior room renovations took center stage in 2021. Kitchen renovations emerged as the most popular upgrade, commanding the highest budget allocation.
- According to Houzz, homeowners increased their investment in kitchen upgrades by 25% compared to 2020, with average spending rising from $12,000 to $15,000. Bathroom remodels, especially guest bathrooms, also experienced a notable uptick, with a 38% increase in spending observed.
- Additionally, other interior projects such as laundry and living rooms (33% increase) and guest bedrooms (28% increase) recorded higher-than-average spending levels.
(Source: U.S. Houzz and Home Study)
Return on Investment (ROI) from Home Renovation
Interior Remodeling ROI
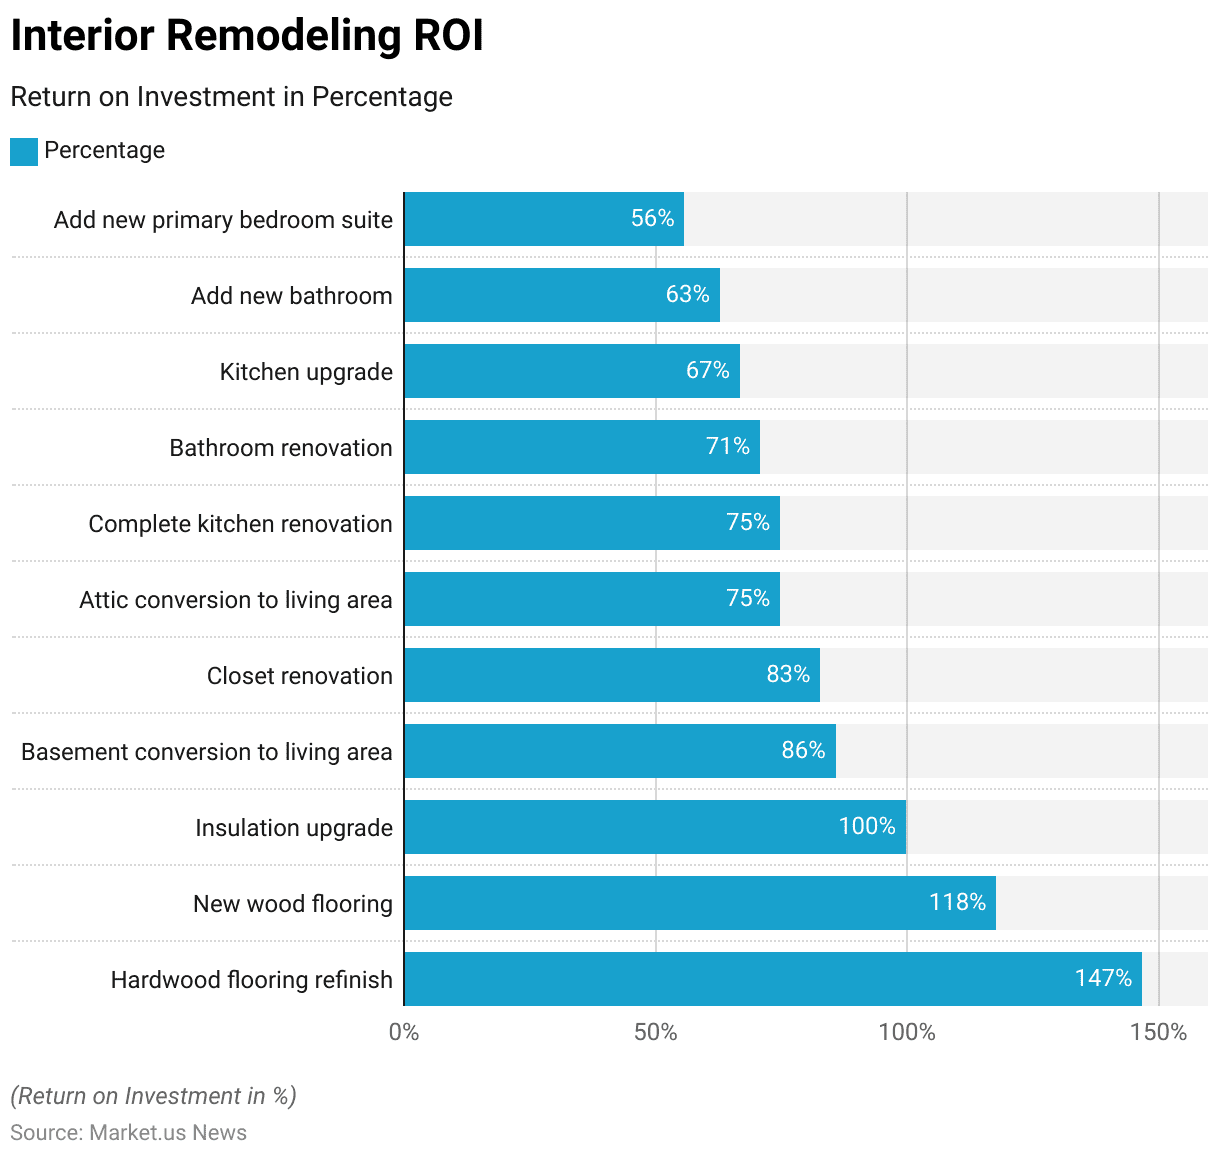
- In the realm of interior remodeling projects, various upgrades have been shown to yield significant returns on investment (ROI) for homeowners.
- Refinishing hardwood flooring leads the list with an impressive ROI of 147%, making it the most lucrative interior improvement.
- Installing new wood flooring follows with an ROI of 118%, demonstrating the high value added by enhancing flooring.
- An insulation upgrade offers a solid return as well, with an ROI of 100%.
- Converting a basement into a living area provides an ROI of 86%, while closet renovations yield an ROI of 83%.
- Attic conversions to living areas and complete kitchen renovations both deliver an ROI of 75%, showcasing their potential to enhance home value significantly.
- Bathroom renovations offer a return of 71%, and kitchen upgrades have an ROI of 67%, further highlighting the benefits of updating essential home areas.
- Adding a new bathroom presents an ROI of 63% while adding a new primary bedroom suite rounds out the list with an ROI of 56%.
- These figures illustrate the substantial financial benefits of investing in various interior remodeling projects.
(Source: National Association of Realtors)
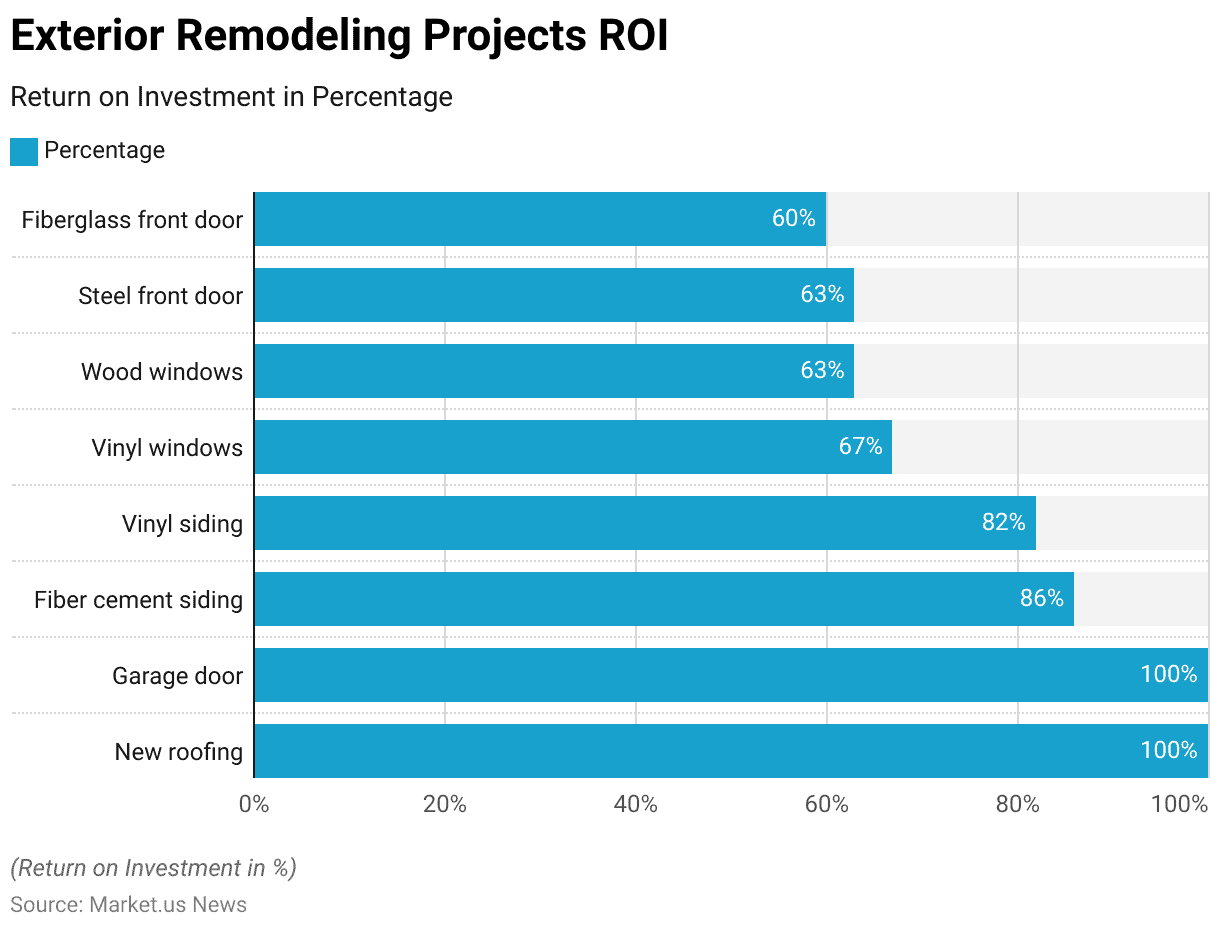
Exterior Remodeling Projects ROI
- Exterior remodeling projects can significantly enhance a home’s value, offering notable returns on investment (ROI).
- New roofing and garage door replacements top the list, each providing a complete ROI of 100%.
- Fiber cement siding installation offers an ROI of 86%, reflecting its durability and aesthetic appeal.
- Vinyl siding follows closely with an ROI of 82%, underscoring its cost-effectiveness and popularity.
- Upgrading to vinyl windows yields an ROI of 67%, while wood windows offer a return of 63%, indicating the added value of improved window installations.
- Replacing a steel front door also provides an ROI of 63%, contributing to enhanced curb appeal and security.
- Lastly, installing a fiberglass front door results in an ROI of 60%.
- These exterior improvements not only boost a home’s market value but also enhance its overall appearance and functionality.
(Source: National Association of Realtors)
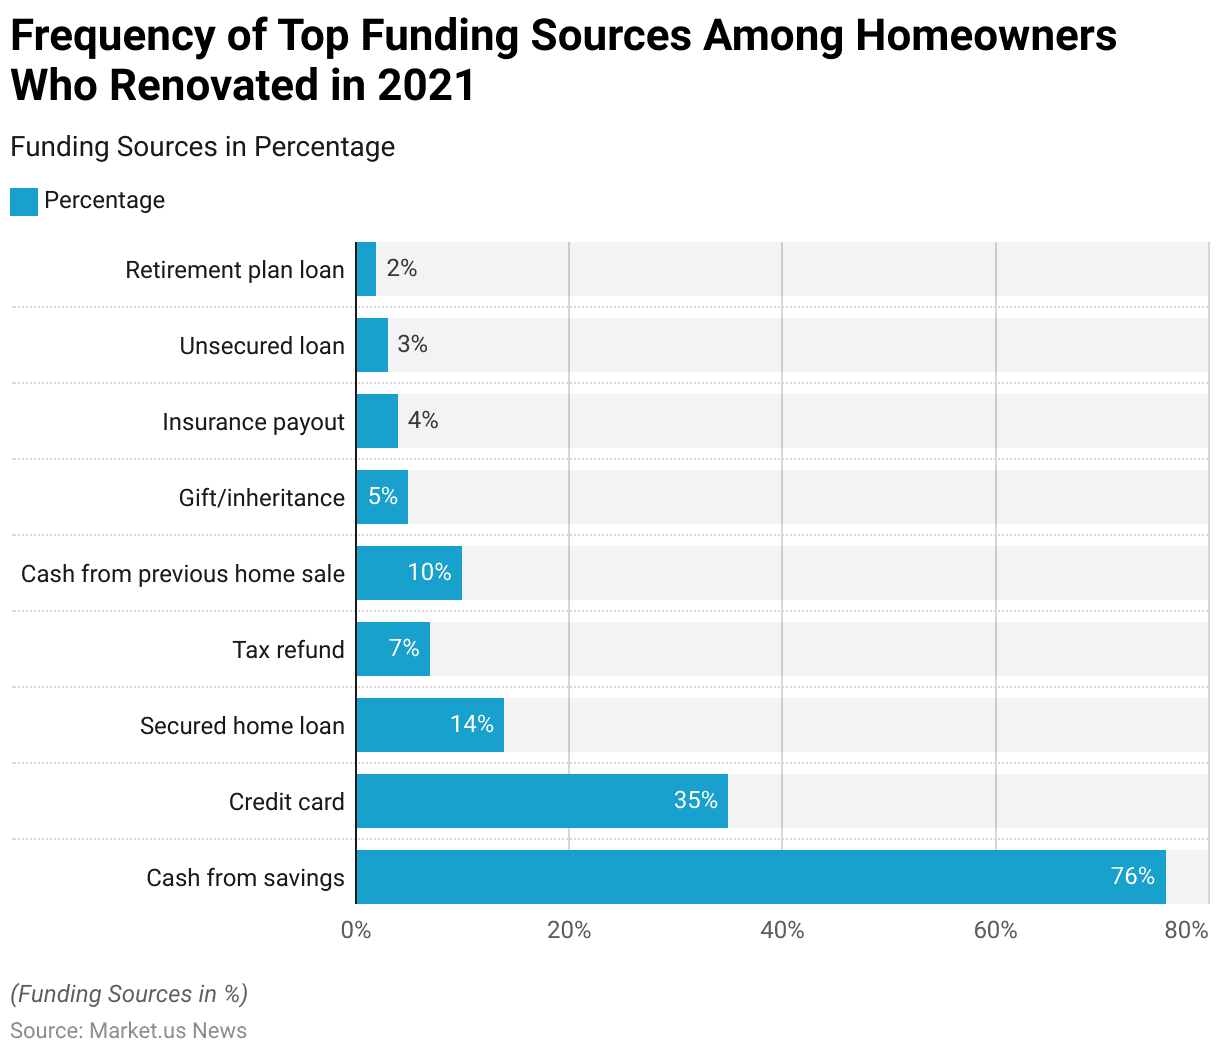
Top Funding Sources Among Home Renovators
- In 2021, homeowners who undertook renovation projects primarily funded these improvements through various sources.
- The most common funding source was cash from savings, utilized by 76% of respondents, indicating a strong preference for using personal funds.
- Credit cards were the second most popular choice, used by 35% of homeowners.
- Secured home loans accounted for 14% of the funding sources, showing a reliance on leveraging home equity.
- Tax refunds were used by 7% of respondents, while 10% funded their renovations with cash from previous home sales.
- Gifts or inheritances were utilized by 5% of homeowners, and insurance pay-outs accounted for 4%.
- Unsecured loans were a less common choice, used by 3% of respondents, and loans from retirement plans were the least used, at 2%.
- This data illustrates the diverse financial strategies homeowners employed to support their renovation endeavors in 2021.
(Source: U.S. Houzz and Home Study)
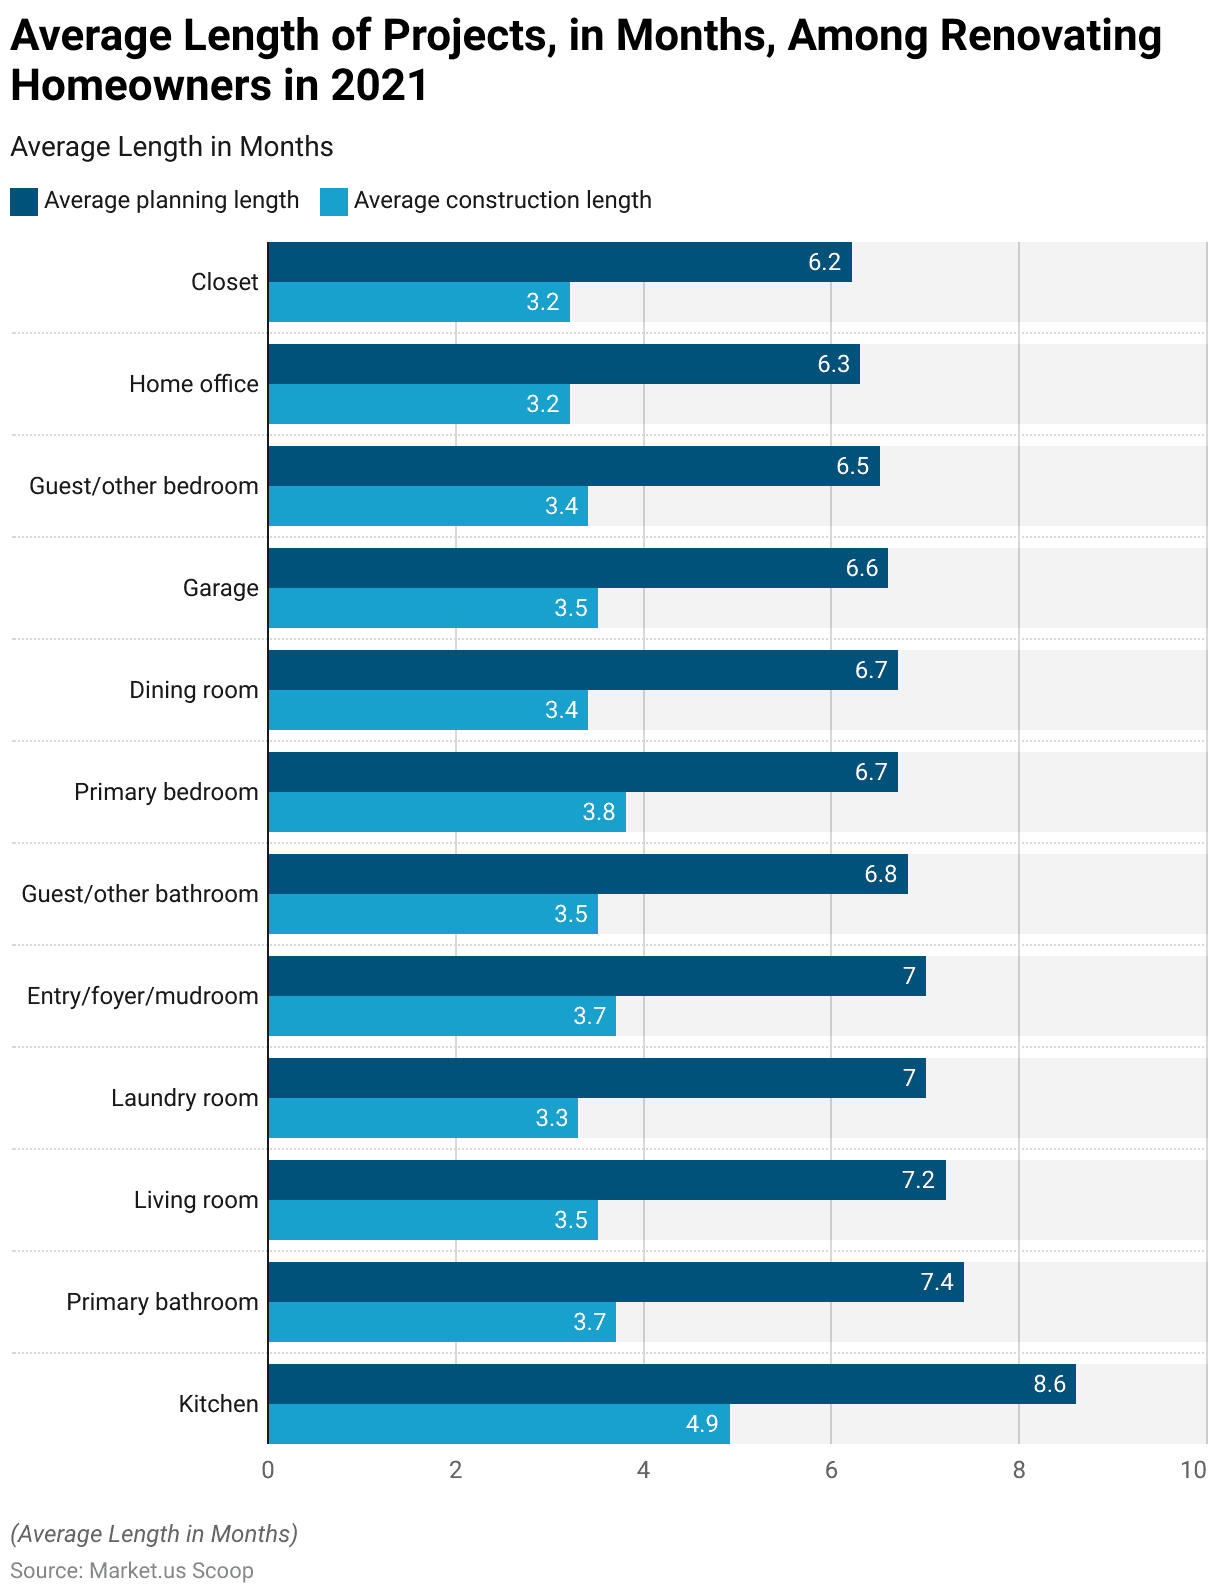
Length of Home Renovation Projects
- In 2021, the average length of home renovation projects among homeowners varied significantly depending on the type of project. Kitchen renovations required the longest time, with an average planning period of 8.6 months and a construction duration of 4.9 months.
- Primary bathroom projects followed, taking an average of 7.4 months to plan and 3.7 months to construct. Living room renovations had an average planning length of 7.2 months and a construction period of 3.5 months.
- Laundry room projects typically took 7.0 months to plan and 3.3 months to complete construction. Entry, foyer, and mudroom renovations shared the same planning period of 7.0 months but required 3.7 months for construction.
- Guest and other bathroom renovations averaged 6.8 months for planning and 3.5 months for construction, while primary bedroom projects needed 6.7 months for planning and 3.8 months for construction.
- Dining room renovations took 6.7 months to plan and 3.4 months to build. Garage renovations had an average planning length of 6.6 months and a construction duration of 3.5 months.
- Guest and other bedroom projects required 6.5 months for planning and 3.4 months for construction. Home office renovations had an average planning period of 6.3 months and took 3.2 months to complete.
- Lastly, closet renovations required an average of 6.2 months for planning and 3.2 months for construction. These timelines highlight the varying complexity and scope of different home renovation projects.
(Source: U.S. Houzz and Home Study)
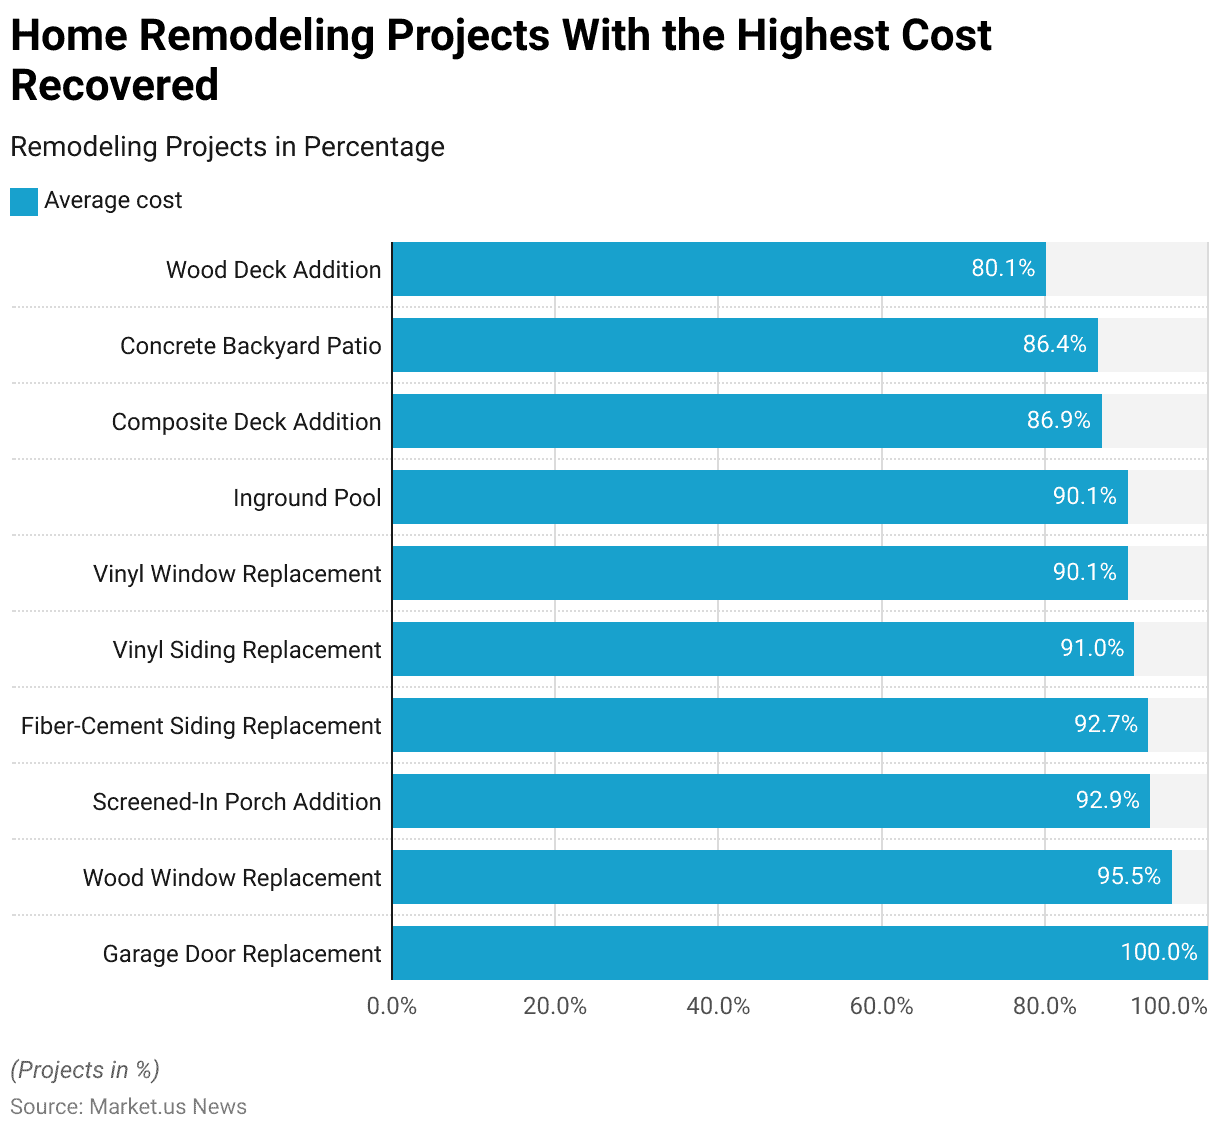
Home Remodeling Projects with the Highest Cost Recovered
- Home remodeling projects in 2022 varied significantly in terms of cost recovery, with some projects offering exceptionally high returns on investment.
- Garage door replacements topped the list, with homeowners recovering 100% of the costs.
- Wood window replacements followed closely, recouping 95.5% of their expenses.
- Adding a screened-in porch provided a substantial return, with 92.9% of the costs recovered.
- Fiber-cement siding replacements also proved valuable, with a 92.7% cost recovery rate.
- Vinyl siding replacements allowed homeowners to recover 91.0% of their investment, while both vinyl window replacements and in-ground pools had a cost recovery rate of 90.1%.
- Composite deck additions offered an 86.9% return, and concrete backyard patios provided an 86.4% cost recovery.
- Finally, wood deck additions yielded an 80.1% return on investment.
- These figures highlight the home remodeling projects that deliver the highest cost recovery, emphasizing their value to homeowners looking to enhance their properties.
(Source: Today’s Home Owner)
Home Improvement Remodeling Projects with the Lowest Cost Recovered Statistics
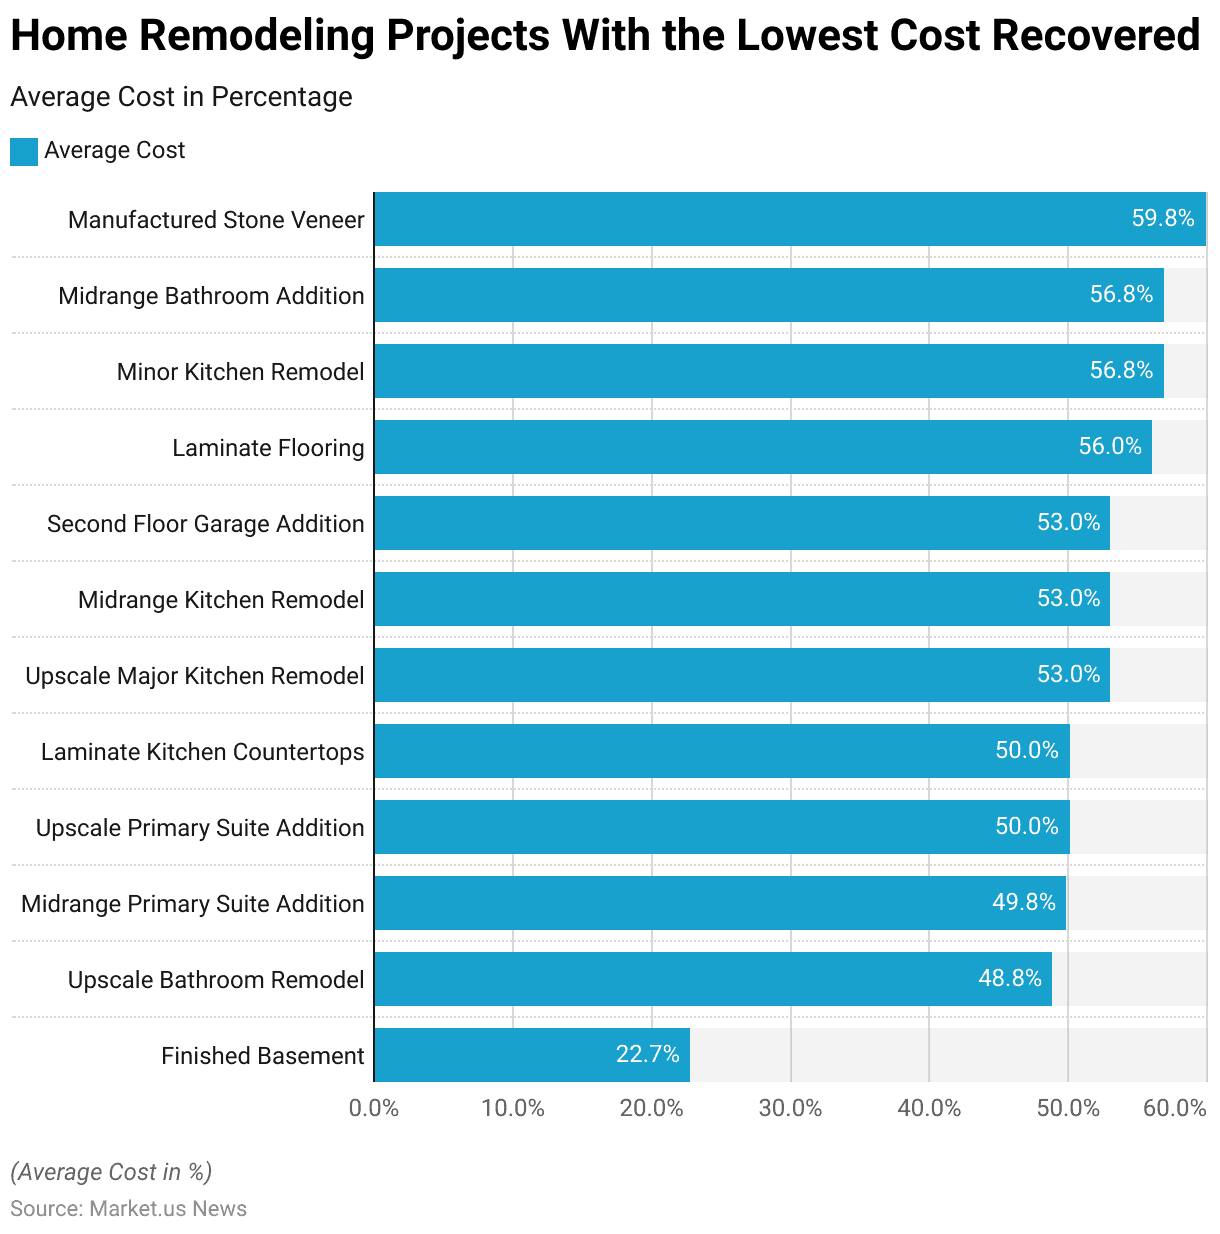
- In 2022, several home remodeling projects demonstrated lower cost recovery rates, making them less financially advantageous for homeowners.
- Finishing a basement yielded the lowest cost recovery, with only 22.7% of the expenses recouped.
- Upscale bathroom remodels provided a return of 48.8%, while midrange primary suite additions had a slightly higher cost recovery rate of 49.8%.
- Upscale primary suite additions and laminate kitchen countertops each recovered 50.0% of their costs.
- Upscale major kitchen remodels, midrange kitchen remodels, and second-floor garage additions all shared a cost recovery rate of 53.0%.
- Laminate flooring installations and minor kitchen remodels offered a slightly better return, with 56.0% and 56.8% of the costs recovered, respectively.
- Midrange bathroom additions also had a cost recovery rate of 56.8%.
- Manufactured stone veneer projects provided a higher return compared to the other projects in this category, with a cost recovery rate of 59.8%.
- These figures highlight the home remodeling projects with the lowest cost recovery, underscoring their limited financial return on investment.
(Source: Today’s Home Owner)
Home Improvement Challenges and Statistics
Basic Challenges
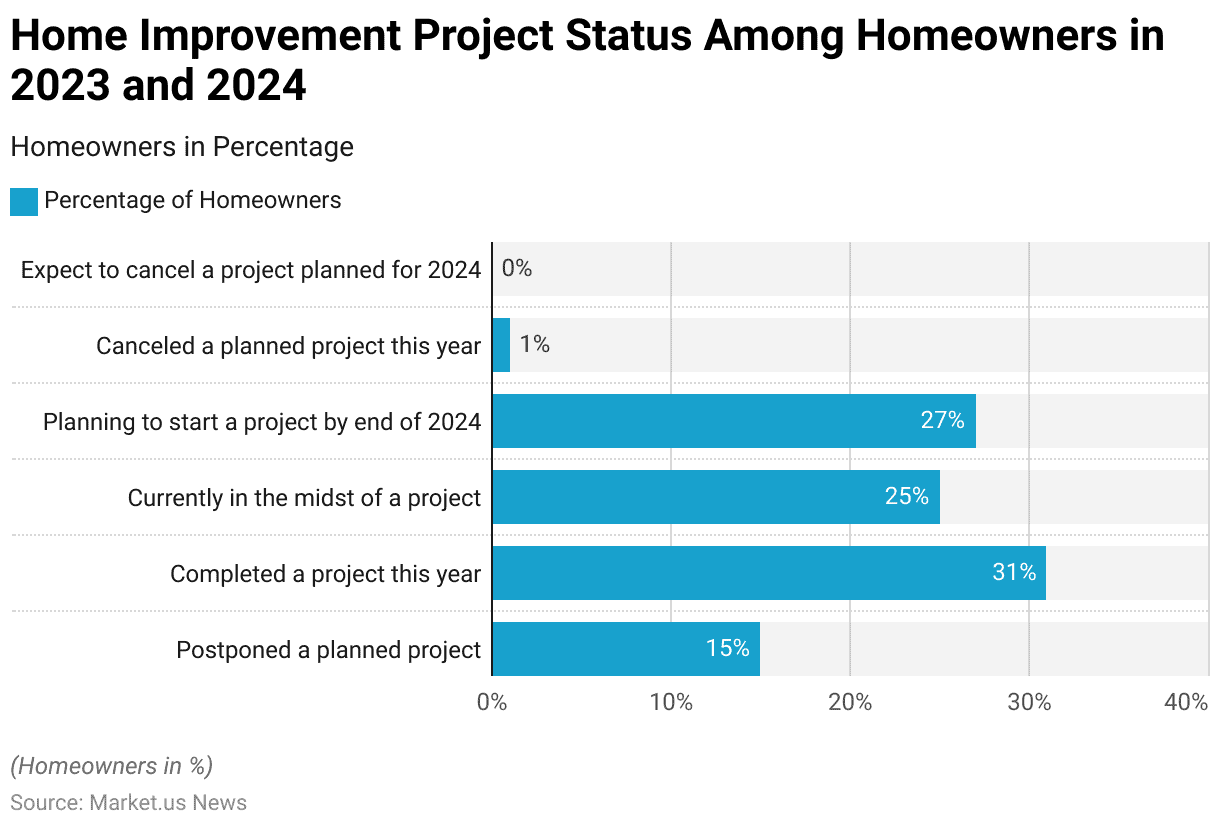
- In response to economic challenges, 15% of homeowners have opted to delay a home improvement project scheduled for either this year or 2024, as per a survey conducted by Houzz in August 2023 among over 2,500 homeowners.
- Conversely, nearly one-third of surveyed homeowners (31%) have already finalized a home improvement project this year.
- A quarter (25%) are presently engaged in a project, while over a quarter (27%) intend to commence a project by the conclusion of 2024.
- On the other hand, less than 1% abandoned a planned project for this year, and none anticipate canceling a project slated for 2024.
(Source: Houzz)
Biggest Remodeling Challenges Homeowners Face
- Among homeowners who have finished their projects this year, primary obstacles encompassed locating suitable professionals (45%), acquiring products and materials (34%), and adhering to budgetary constraints (28%).
- Additional prevalent challenges comprised difficulty envisioning the project pre-commencement (16%), maintaining project timelines (15%), and receiving prompt project-related communications (13%).
- Among the 15% of homeowners delaying their projects, predominant hurdles include securing appropriate professionals (50%), securing funding and financial resources (46%), adhering to budgetary limitations (25%), and sourcing suitable products and materials (25%).
(Source: Houzz)
Adoption of Smart Technology in Home Improvement Statistics
- The smart home market is experiencing significant growth, with 37 percent of all internet-connected homes now equipped with at least one smart home device.
- Adoption rates are expected to continue increasing as purchase intentions are at an all-time high.
- Additionally, a report commissioned by HIRI from global market firm predicts that the global smart home market will surpass $167 billion by 2025, a substantial rise from approximately $58.5 billion in 2020.
- As the market expands rapidly, companies are striving to innovate and enhance home technology integrations, envisioning advancements in smart controls for lighting, energy efficiency, and other areas.
(Source: Home Improvement Research Institute)
Recent Developments
Acquisitions:
- Canadian Tire’s Strategic Acquisitions: Canadian Tire Corporation announced a $3.4 billion investment over four years to enhance its omnichannel capabilities and drive long-term growth.
- This plan includes significant investments in their owned brands portfolio and partnerships to expand their product offerings.
- The company aims to launch over 12,000 new products by 2025 across various categories.
New Product Launches:
- Target’s New Store Formats and Product Lines: Target Corporation unveiled plans to invest $4 billion to $5 billion in 2023 to expand its store network and digital capabilities. This includes the introduction of new store formats, updates to 175 existing locations, and the launch of new product lines focused on affordability and customer experience. They also plan to roll out Drive Up Returns nationwide to enhance shopping convenience.
- Lowe’s Hometowns Program: Lowe’s launched the 2023 Lowe’s Hometowns impact program, a five-year, $100 million initiative aimed at transforming communities through various improvement projects. This program seeks public nominations for community projects that deserve funding and support from Lowe’s.
Funding:
- Home Improvement Product Market Expansion: The global home organization products market, encompassing items like bins, shelving, and modular units, is projected to grow from $12.0 billion in 2022 to $15.9 billion by 2030, at a CAGR of 3.6%.
- This growth is driven by increased home renovation activities and rising demand for DIY home improvement solutions.
Market Growth:
- Rising Home Improvement Sales: In the U.S., the home improvement market has seen significant growth.
- The leading chain, The Home Depot, generated $152.7 billion in sales in 2023, while Lowe’s achieved $86 billion.
- This growth is fueled by a surge in home renovation activities as homeowners seek to upgrade their existing homes rather than move due to high housing costs and shortages.
Innovation in Home Improvement:
- Smart Home Integration: Home improvement products are increasingly incorporating smart technology to enhance functionality and convenience.
- For instance, new smart home devices and systems are being integrated into home improvement projects, allowing homeowners to automate and control various aspects of their home environment more efficiently.
Conclusion
Home Improvement Statistics – In conclusion, the home improvement industry stands as a resilient and dynamic sector poised for sustained growth and innovation.
Fueled by evolving consumer preferences, technological advancements, and shifting demographics, demand for home improvement products and services remains strong.
To navigate challenges such as supply chain disruptions and fluctuating costs, industry players must prioritize resilience and agility while embracing digitalization and sustainable practices.
By fostering collaboration across the value chain and adapting to changing market dynamics, businesses can capitalize on emerging opportunities and secure long-term success in this thriving sector.
FAQs
Increasing curb appeal can be achieved through simple yet impactful measures like painting the front door, adding landscaping, updating outdoor lighting fixtures, and maintaining a tidy exterior.
Current trends in kitchen remodeling include open shelving, mixed material countertops (e.g., quartz and wood), smart appliances, sustainable materials, and multifunctional kitchen islands.
Renovations that typically yield high returns on investment include kitchen remodels, bathroom upgrades, adding a deck or patio, enhancing curb appeal with landscaping, and finishing basements or attic spaces to add usable square footage.
Eco-friendly home improvement options include installing energy-efficient windows, using sustainable building materials (e.g., bamboo flooring, recycled glass countertops), incorporating passive solar design principles, and investing in renewable energy sources like solar panels.
Permit requirements vary depending on the scope of the project and local building codes. Generally, major renovations such as additions, structural changes, and electrical or plumbing work require permits. It’s essential to check with your local building department to ensure compliance with regulations.


