Table of Contents
- Introduction
- Editor’s Choice
- Knife Market Overview
- Key Export Statistics
- Key Import Statistics
- Knife Price Statistics
- Knives and Cutting Blades for Machines and Mechanical Appliances
- Demographic Insights
- Consumer Preferences and Trends
- Crimes Committed Due to Knives and Related Challenges
- Criminal Justice Reforms for Knife Crimes Statistics
- Recent Developments
- Conclusion
- FAQs
Introduction
Knife Statistics: The knife industry encompasses a broad spectrum of products, including kitchen, outdoor, and specialty knives, each serving distinct consumer needs.
Key trends driving the market include growing demand for high-quality, precision-crafted knives, and technological advancements. Such as improved blade coatings and ergonomic designs, and a shift towards sustainable and eco-friendly materials.
Major players like Wüsthof, Victorinox, and Shun operate in the market with innovative designs and high-performance products.
The industry is supported by rising consumer interest in cooking and outdoor activities. However, challenges such as fluctuating raw material prices and intense competition persist.
Overall, the knife sector is evolving with advancements in materials and customization options, ensuring continued growth and diversification.
Editor’s Choice
- The global knife market generated a revenue of USD 4.2 billion in 2023.
- By 2032, the total market is forecasted to reach USD 7.1 billion, with fixed blades generating USD 2.76 billion, folding blades USD 2.30 billion, and side slides USD 2.04 billion. Reflecting a strong and consistent growth pattern across all segments.
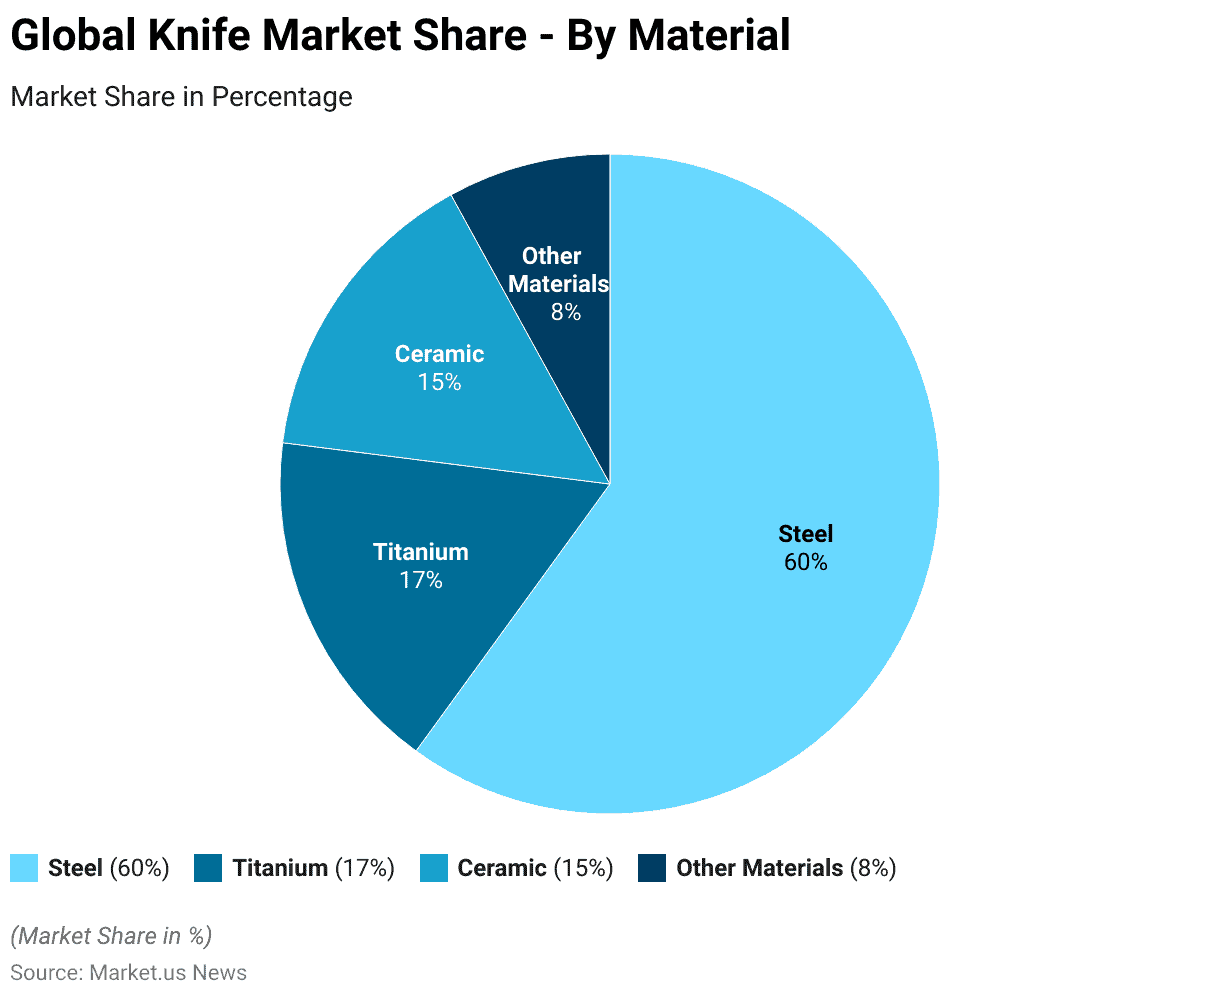
- The knife market, segmented by material, shows a clear dominance of steel. Which accounts for 60% of the total market share.
- In 2022, China was the largest exporter of knives. Accounting for 51% of the global market, with an export value of USD 1,870 million.
- In 2022, the United States was the largest importer of knives. Accounting for 27.5% of the global imports, with a value of USD 1,001 million.
- The list of the most expensive knives worldwide is led by “The Gem of the Orient,” which is valued at an astounding USD 2.1 million, making it the costliest knife globally.
- In the U.K., the Offensive Weapons Act (2019) introduced measures such as prohibiting the possession of certain knives in private and restricting the delivery of knives to individuals under 18.
Knife Market Overview
Global Knife Market Size Statistics
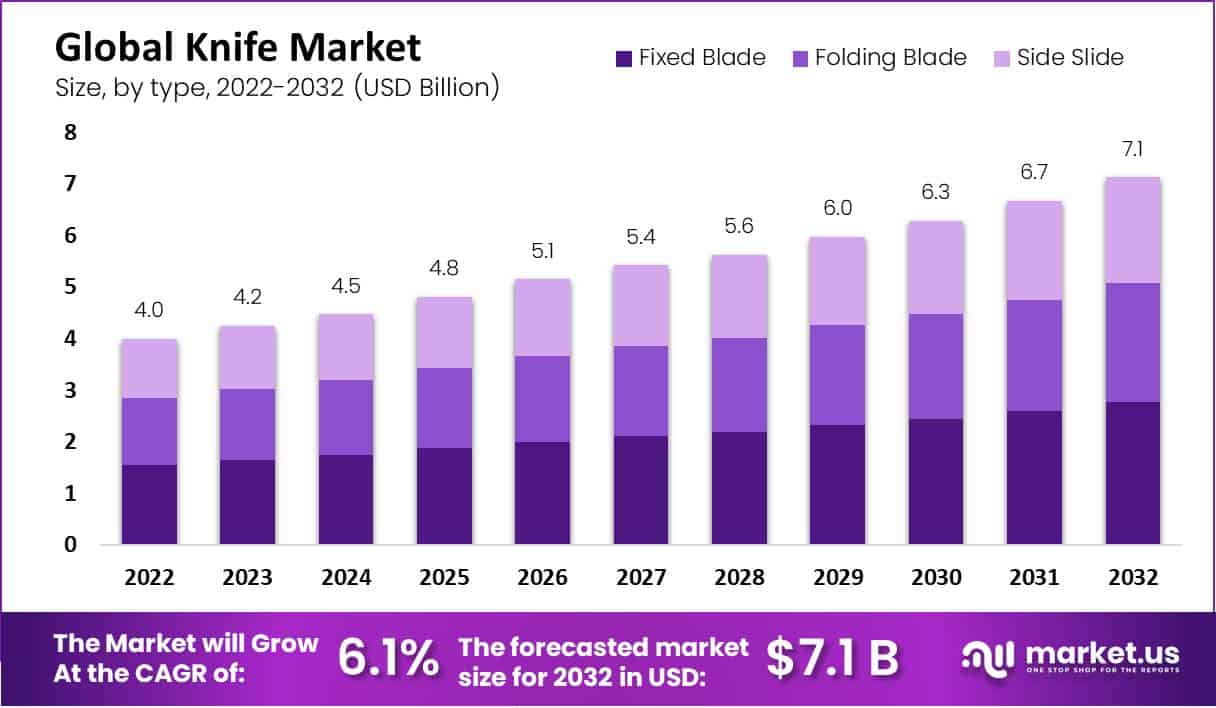
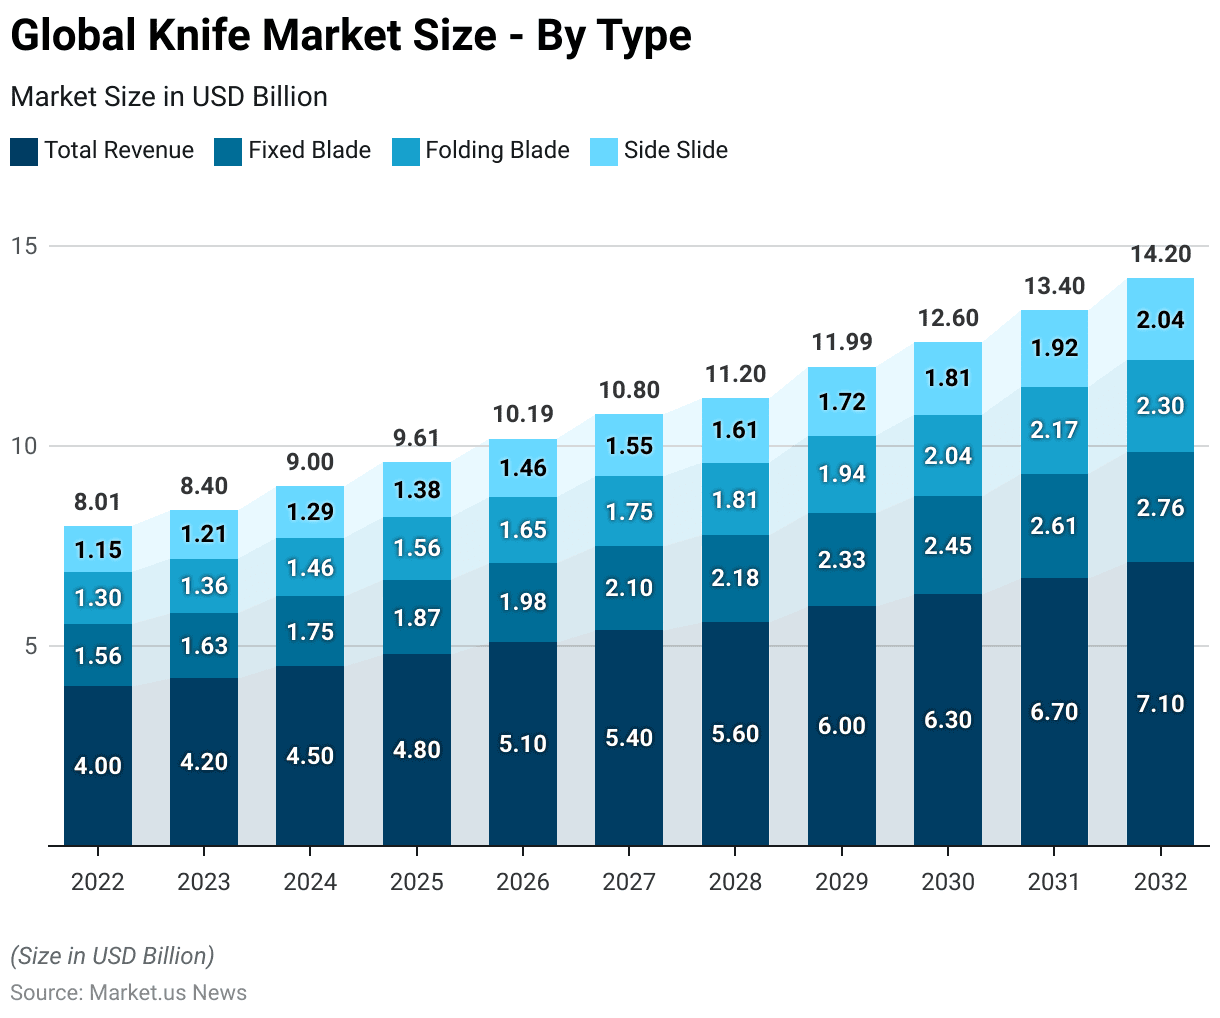
- The global knife market generated a revenue of USD 4.0 billion in 2022, and this figure is projected to experience consistent growth in the coming years at a CAGR of 6.10%.
- By 2023, revenue is expected to reach USD 4.2 billion, with further increases to USD 4.5 billion in 2024, USD 4.8 billion in 2025, and USD 5.1 billion by 2026.
- This upward trajectory is anticipated to continue, with the market forecasted to generate USD 5.4 billion in 2027, USD 5.6 billion in 2028, and USD 6.0 billion in 2029.
- By the end of the decade, the knife market is expected to reach USD 6.3 billion in 2030 and USD 6.7 billion in 2031, culminating in an estimated USD 7.1 billion in 2032.
- This steady growth reflects an optimistic outlook for the industry over the forecast period.
(Source: market.us)
Global Knife Market Size – By Type Statistics
2022-2028
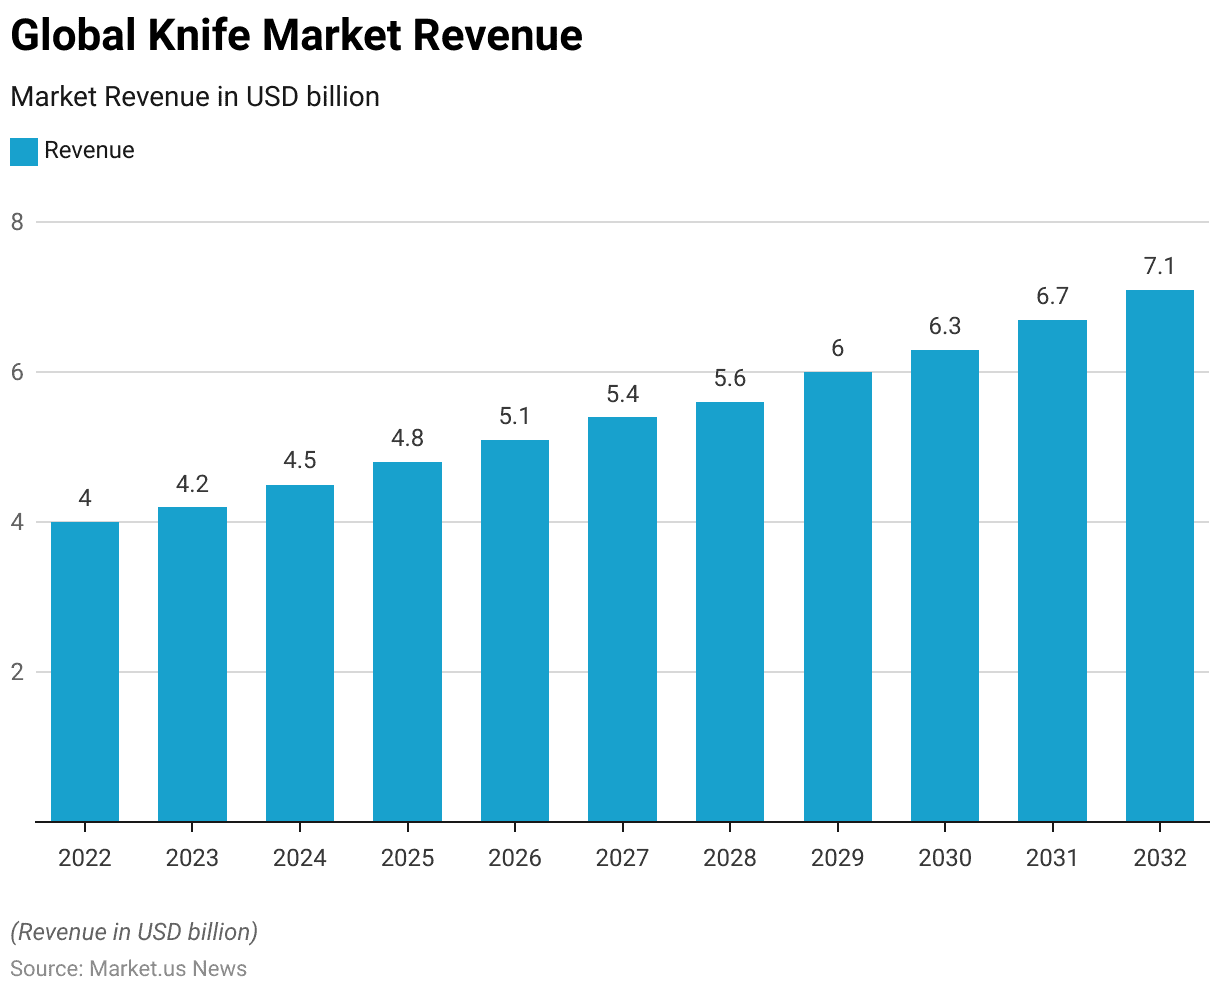
- The global knife market, segmented by type, demonstrates a steady growth trajectory from 2022 to 2028.
- In 2022, the market’s total revenue was USD 4.0 billion, with fixed blade knives contributing USD 1.56 billion, folding blades USD 1.30 billion, and side slide knives USD 1.15 billion.
- By 2023, the overall market increased to USD 4.2 billion, with fixed blades accounting for USD 1.63 billion, folding blades USD 1.36 billion, and side slide knives USD 1.21 billion.
- The market continued to expand, reaching USD 4.5 billion in 2024, with fixed blade sales at USD 1.75 billion, folding blades at USD 1.46 billion, and side slide knives at USD 1.29 billion.
- The upward trend is projected to persist, with the market expected to generate USD 4.8 billion in 2025, USD 5.1 billion in 2026, and USD 5.4 billion by 2027.
- Correspondingly, fixed blades will contribute USD 1.87 billion, USD 1.98 billion, and USD 2.10 billion, respectively. While folding blades and side slides will account for USD 1.56 billion, USD 1.65 billion, USD 1.75 billion, and USD 1.38 billion, USD 1.46 billion, and USD 1.55 billion, respectively, over the same period.
2029-2032
- By 2029, the total market size is projected to reach USD 6.0 billion, with fixed blades at USD 2.33 billion, folding blades at USD 1.94 billion, and side slides at USD 1.72 billion.
- Further growth will lead to a market size of USD 6.3 billion in 2030 and USD 6.7 billion in 2031, with fixed blades contributing USD 2.45 billion and USD 2.61 billion, folding blades at USD 2.04 billion and USD 2.17 billion, and side slide knives at USD 1.81 billion and USD 1.92 billion, respectively.
- By 2032, the total market is forecasted to reach USD 7.1 billion, with fixed blades generating USD 2.76 billion. Folding blades are USD 2.30 billion, and side slides are USD 2.04 billion, reflecting a strong and consistent growth pattern across all segments.
(Source: market.us)
Global Knife Market Share – By Material Statistics
- The knife market, segmented by material, shows a clear dominance of steel. Which accounts for 60% of the total market share.
- Titanium follows with 17%, reflecting its popularity in specialized and high-performance applications.
- Ceramic knives, known for their lightweight and sharpness, represent 15% of the market.
- Other materials, including composites and non-metallic options, collectively hold an 8% share.
- This distribution indicates a strong preference for traditional steel knives. While alternative materials like titanium and ceramic are gaining traction in niche segments.
(Source: market.us)
Key Export Statistics
Cutlery Exporting Leading Countries
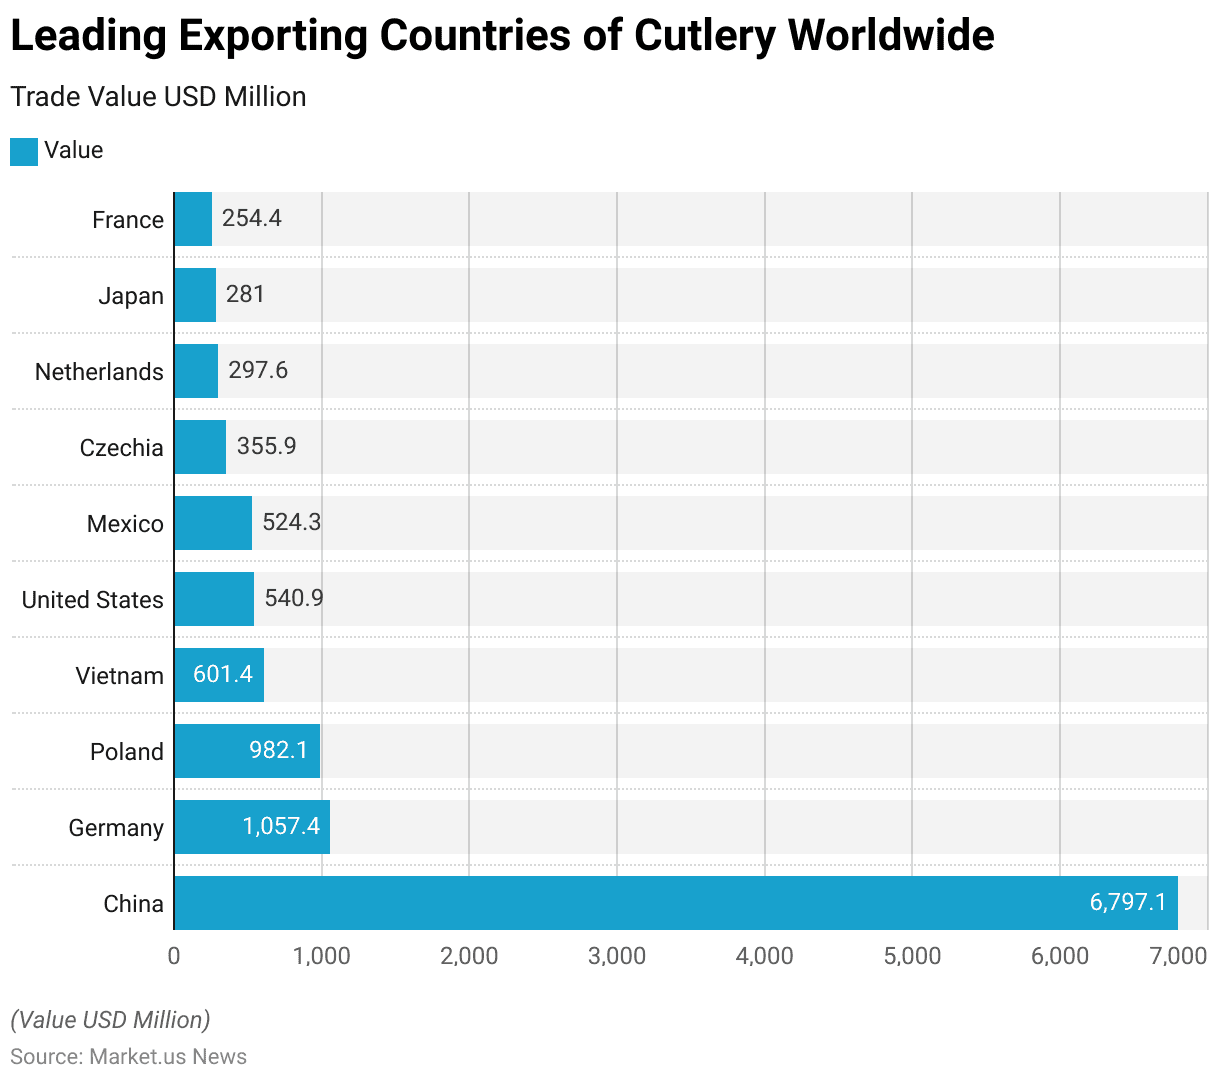
- In 2022, China was the leading exporter of cutlery worldwide, with a trade value of USD 6,797.1 million, dominating the global market.
- Germany ranked second, exporting cutlery worth USD 1,057.4 million. Followed by Poland with USD 982.1 million.
- Vietnam emerged as a significant player, with exports valued at USD 601.4 million, while the United States and Mexico contributed USD 540.9 million and USD 524.3 million, respectively.
- Other notable exporters included Czechia with USD 355.9 million. The Netherlands with USD 297.6 million, Japan with USD 281 million, and France with USD 254.4 million.
- These figures highlight China’s overwhelming lead in cutlery exports, with other countries playing important, though smaller, roles in the global market.
(Source: Statista)
Knife-Exporting Leading Countries Statistics
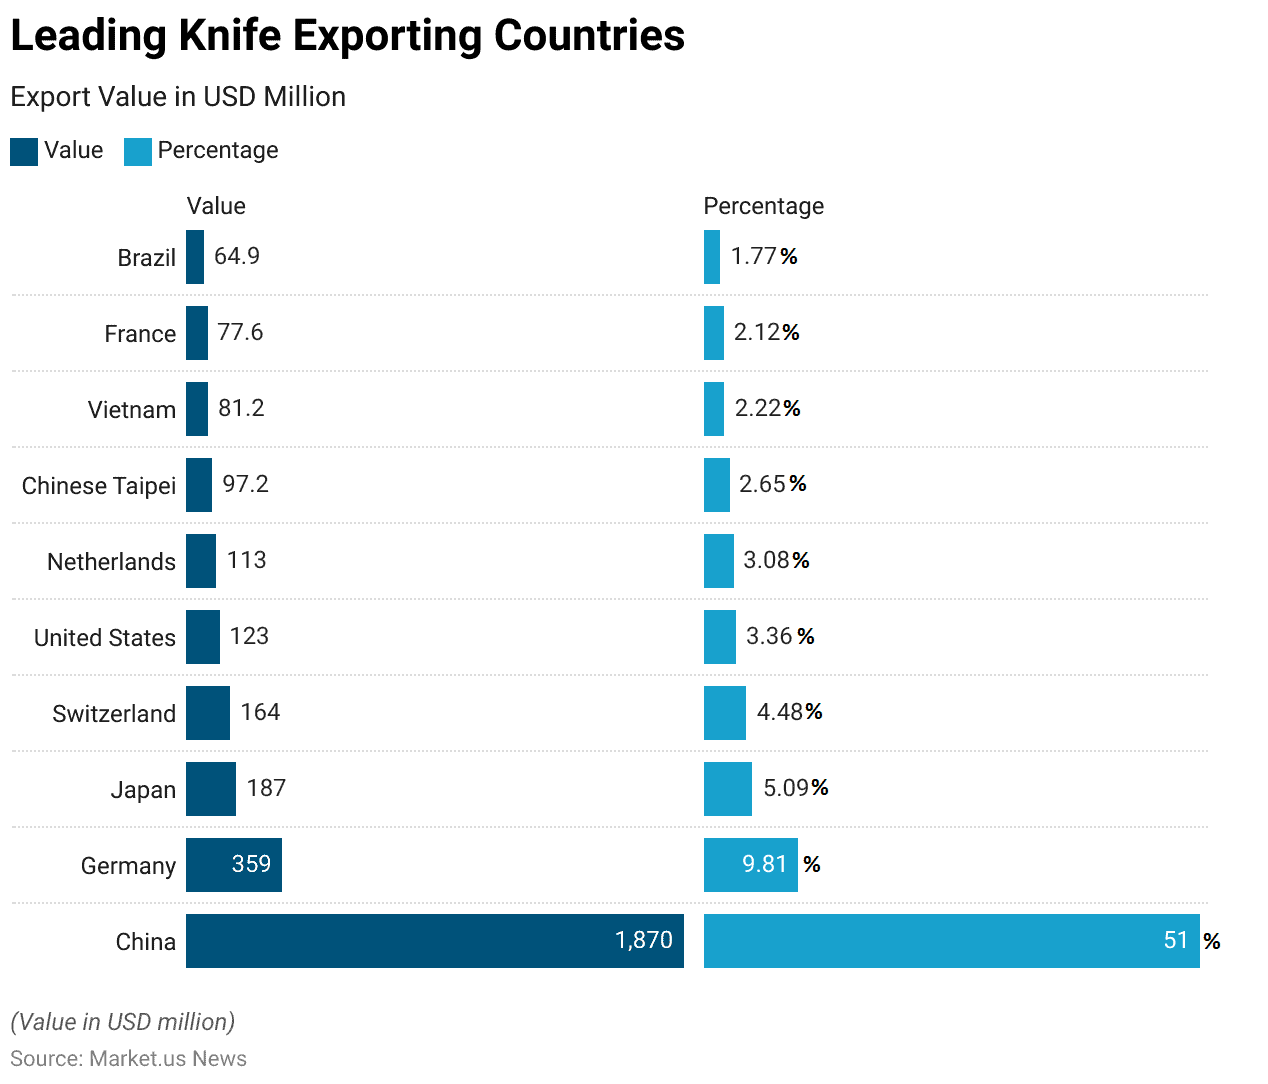
- In 2022, China was the largest exporter of knives, accounting for 51% of the global market, with an export value of USD 1,870 million.
- Germany followed, with exports totaling USD 359 million, representing 9.81% of the market.
- Japan held the third position, exporting USD 187 million worth of knives, contributing 5.09% to the global share.
- Switzerland and the United States were notable exporters as well, with values of USD 164 million (4.48%) and USD 123 million (3.36%), respectively.
- The Netherlands exported USD 113 million (3.08%), while Chinese Taipei, Vietnam, France, and Brazil contributed USD 97.2 million (2.65%), USD 81.2 million (2.22%), USD 77.6 million (2.12%), and USD 64.9 million (1.77%), respectively.
- This data highlights China’s dominant position in the global knife export market, with other countries holding smaller but significant shares.
(Source: The Observatory of Economic Complexity)
Leading Table Knife Exporting Countries Statistics
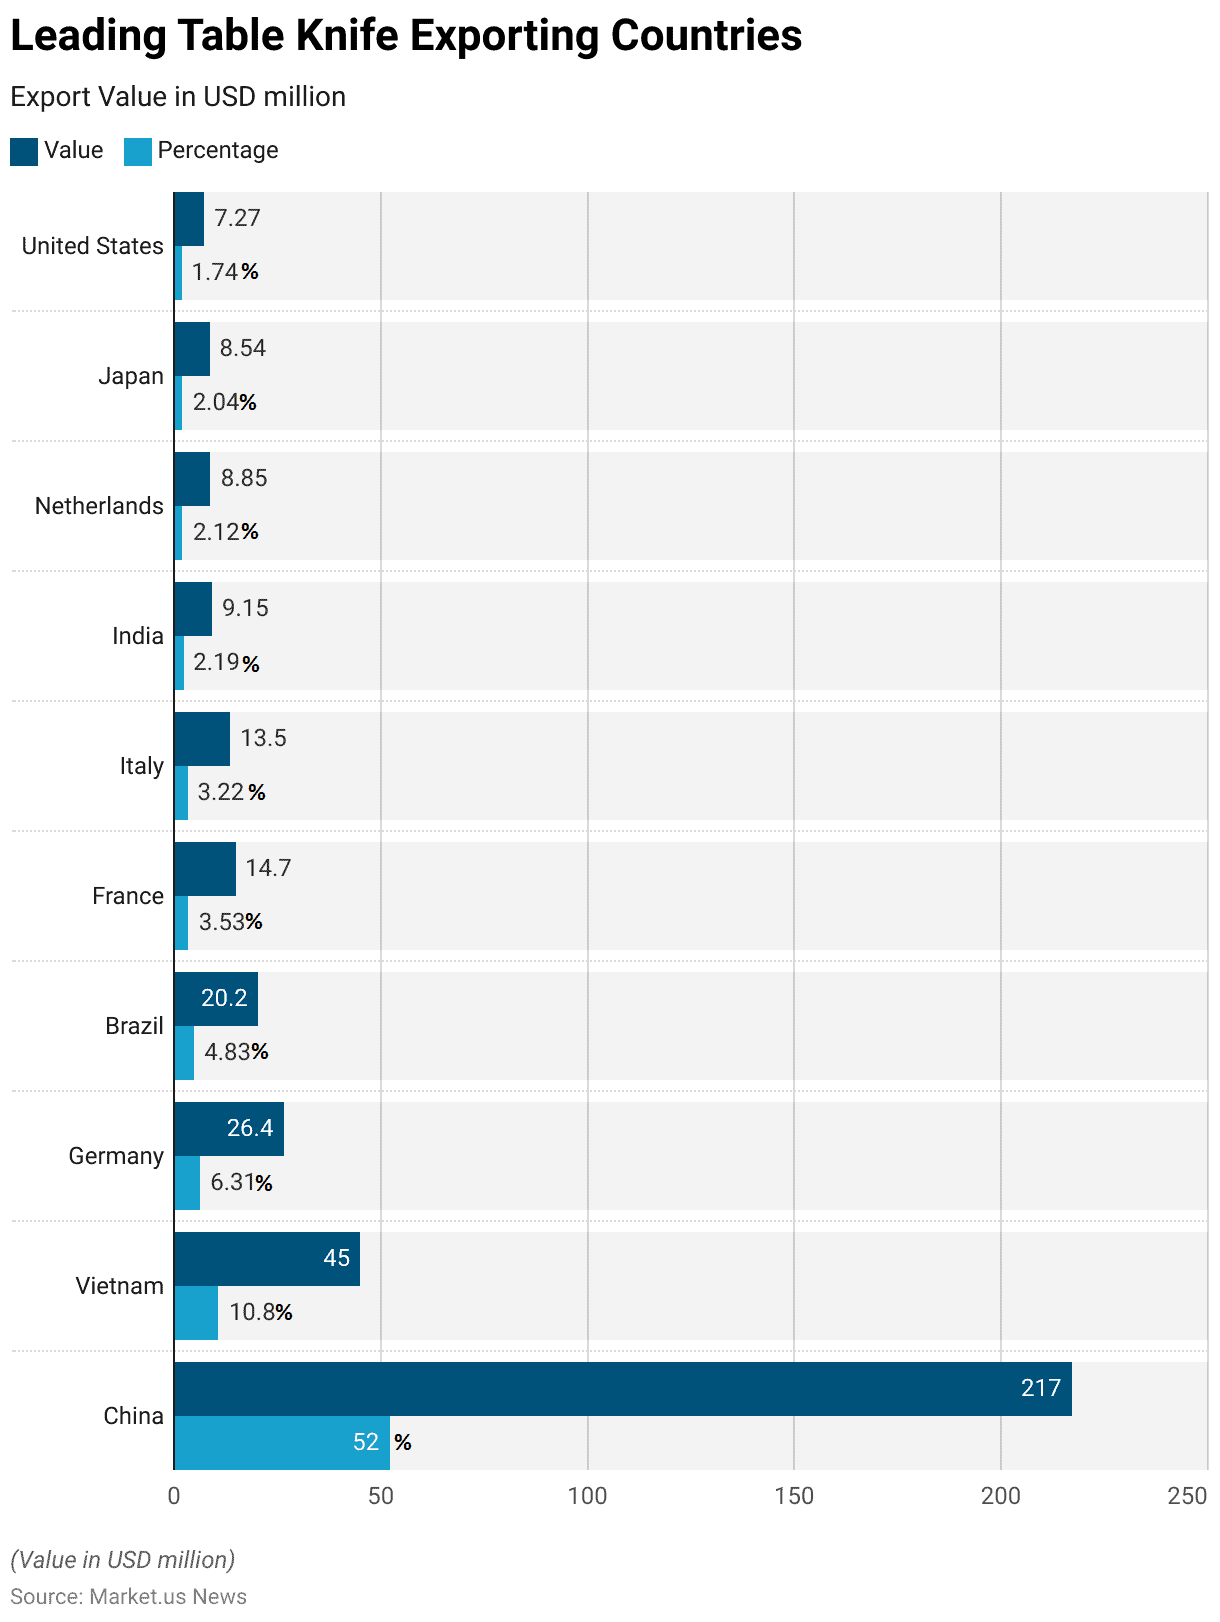
- In 2022, China dominated the global table knife export market, accounting for 52% of the total exports with a value of USD 217 million.
- Vietnam followed as the second-largest exporter, contributing USD 45 million or 10.8% of the market.
- Germany held a 6.31% share, exporting USD 26.4 million worth of table knives, while Brazil exported USD 20.2 million, representing 4.83% of the market.
- France and Italy also had notable shares, with exports valued at USD 14.7 million (3.53%) and USD 13.5 million (3.22%), respectively.
- Other key exporters included India (USD 9.15 million, 2.19%), the Netherlands (USD 8.85 million, 2.12%), Japan (USD 8.54 million, 2.04%), and the United States (USD 7.27 million, 1.74%).
- These figures highlight China’s overwhelming lead in the export of table knives, with other countries playing significant, though smaller, roles.
(Source: The Observatory of Economic Complexity)
Key Import Statistics
Cutlery Importing Leading Countries
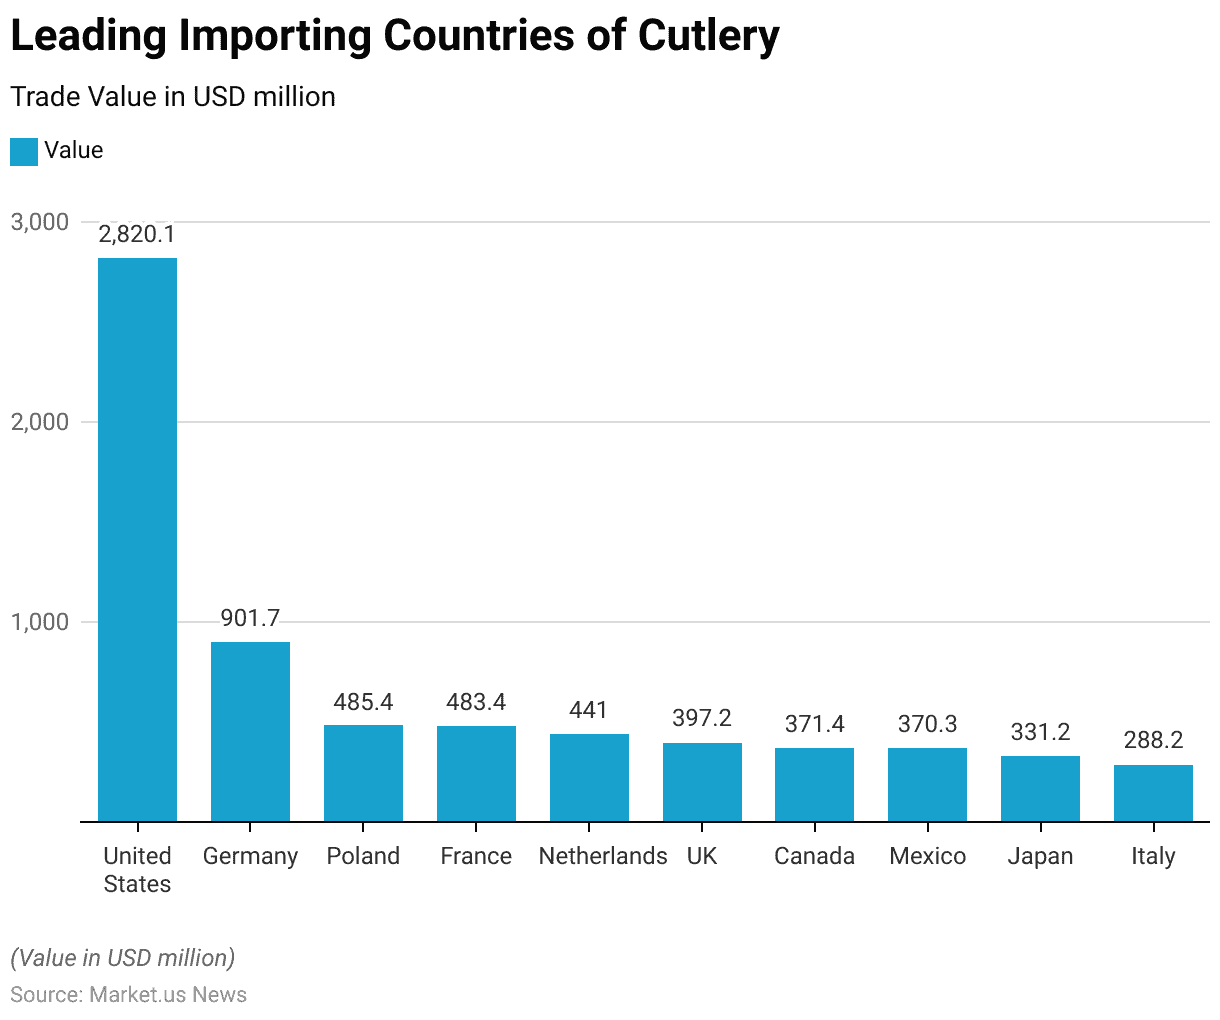
- In 2022, the United States emerged as the largest importer of cutlery worldwide, with a trade value of USD 2,820.1 million.
- Germany followed with imports valued at USD 901.7 million, while Poland imported USD 485.4 million worth of cutlery, closely followed by France at USD 483.4 million.
- The Netherlands ranked fifth, with a trade value of USD 441 million.
- The United Kingdom imported USD 397.2 million, and Canada and Mexico had nearly similar import values, at USD 371.4 million and USD 370.3 million, respectively.
- Japan’s cutlery imports amounted to USD 331.2 million, while Italy rounded out the top ten with USD 288.2 million.
- These figures underscore the significant demand for cutlery in North America and Europe, with the United States being the clear leader.
(Source: Statista)
Knife Importing Leading Countries Statistics
- In 2022, the United States was the largest importer of knives, accounting for 27.5% of the global imports, with a value of USD 1,001 million.
- Germany followed, importing knives worth USD 291 million, representing 7.95% of the market.
- France ranked third, with an import value of USD 180 million, or 4.92% of global imports, while the Netherlands imported USD 168 million (4.58%).
- Canada had imports totaling USD 148 million (4.05%), and the United Kingdom followed closely with USD 99.5 million (2.72%).
- Poland, Italy, Australia, and Spain also contributed significantly, with import values of USD 94.7 million (2.58%), USD 86.8 million (2.37%), USD 76.8 million (2.1%), and USD 76.3 million (2.08%), respectively.
- This data highlights the United States’ dominant position in the global knife import market, with several European countries and Canada also playing important roles.
(Source: The Observatory of Economic Complexity)
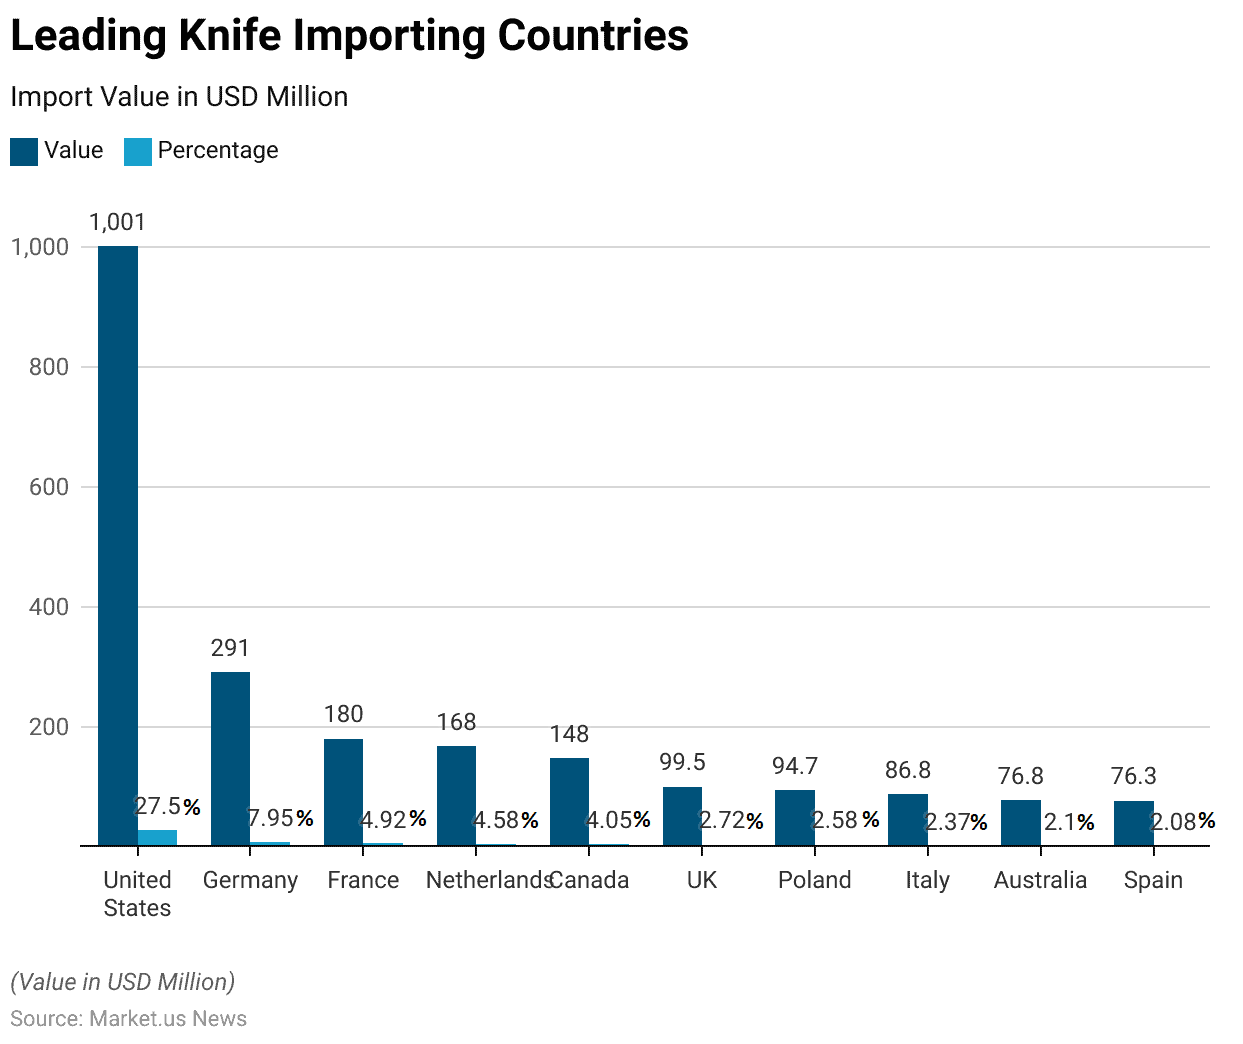
Table Knife Importing Leading Countries Statistics
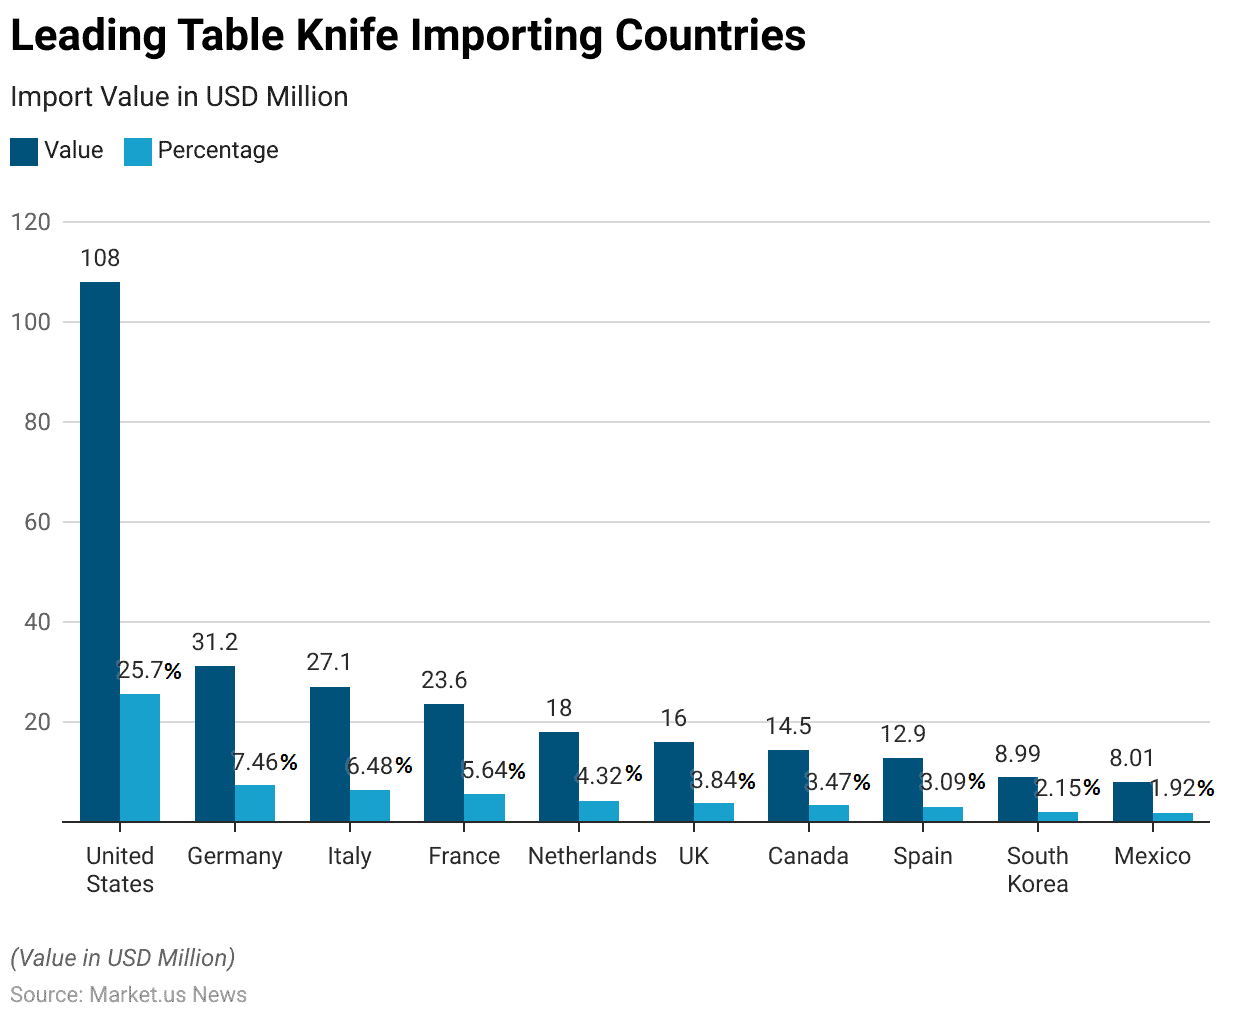
- In 2022, the United States was the leading importer of table knives, accounting for 25.7% of global imports, with a value of USD 108 million.
- Germany followed with imports totaling USD 31.2 million, representing 7.46% of the market, while Italy imported USD 27.1 million worth of table knives, capturing 6.48% of the market.
- France contributed 5.64% of the total imports, with a value of USD 23.6 million.
- The Netherlands imported USD 18 million (4.32%), and the United Kingdom imported USD 16 million (3.84%).
- Canada, Spain, South Korea, and Mexico also made notable contributions, with import values of USD 14.5 million (3.47%), USD 12.9 million (3.09%), USD 8.99 million (2.15%), and USD 8.01 million (1.92%), respectively.
- This data underscores the strong demand for table knives in the United States and Europe, with smaller but significant contributions from other regions.
(Source: The Observatory of Economic Complexity)
Knife Price Statistics
Price Expectations
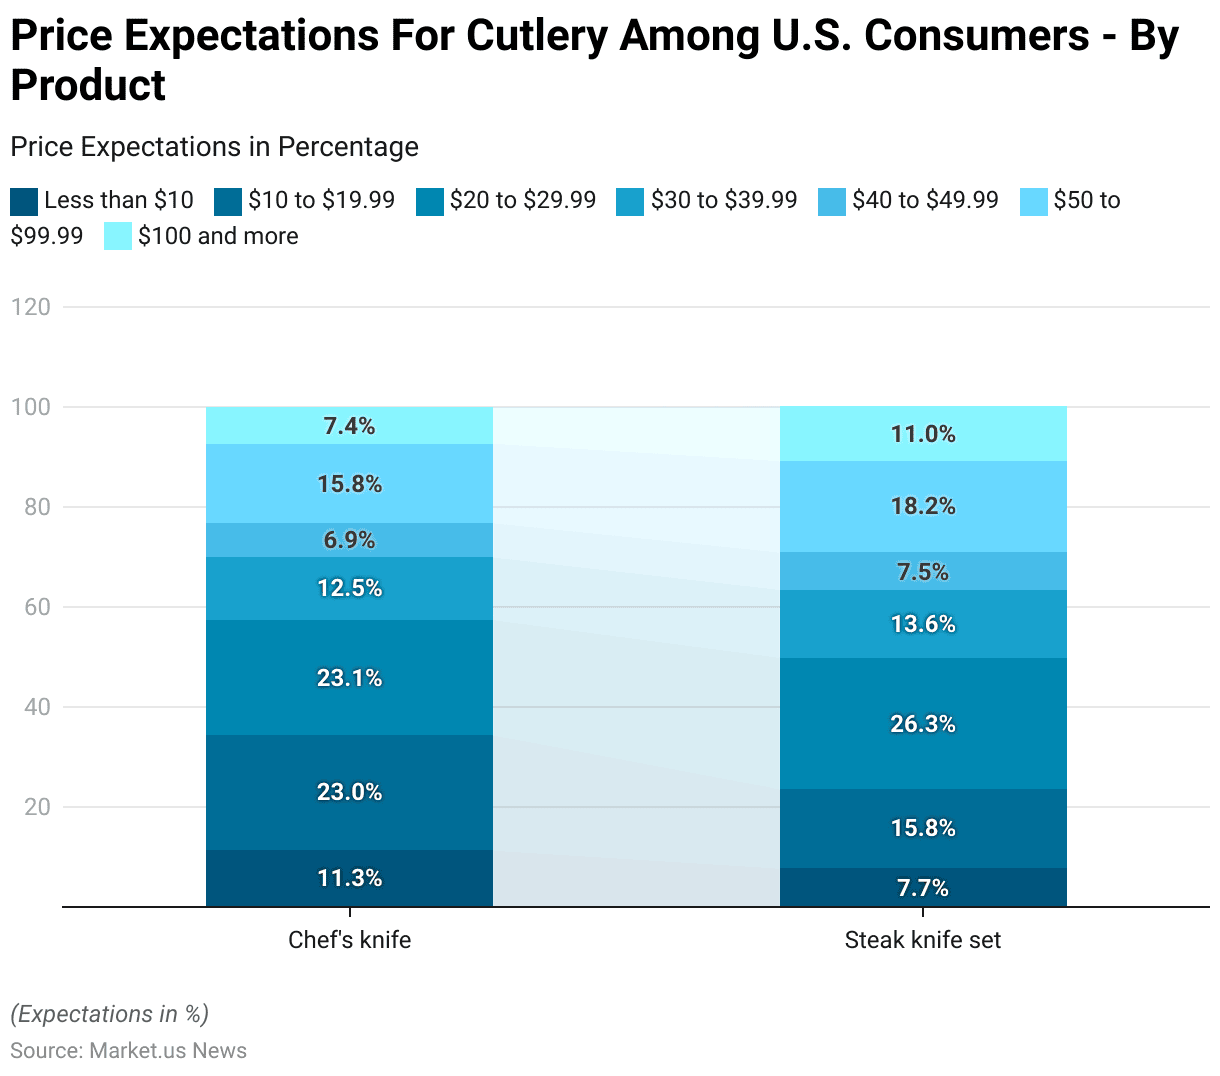
- In 2020, U.S. consumer price expectations for cutlery, particularly chef’s knives and steak knife sets, varied across different price ranges.
- For chef’s knives, 23.1% of consumers were willing to spend between $20 and $29.99, while 23% were comfortable with a price range of $10 to $19.99.
- Additionally, 15.8% expected to pay between $50 and $99.99, and 12.5% anticipated prices in the $30 to $39.99 range.
- A smaller portion of consumers, 7.4%, were prepared to spend $100 or more, while 11.3% sought chef’s knives for less than $10.
- For steak knife sets, 26.3% of consumers expected prices between $20 and $29.99, the most popular range, followed by 18.2% who preferred to pay between $50 and $99.99.
- In the $10 to $19.99 range, 15.8% of consumers had expectations, while 13.6% looked for prices between $30 and $39.99.
- A smaller percentage, 11%, were willing to pay $100 or more, and 7.7% sought steak knife sets priced below $10.
- This data reflects varying consumer preferences for pricing based on the type of cutlery product.
Most Expensive Knives Worldwide
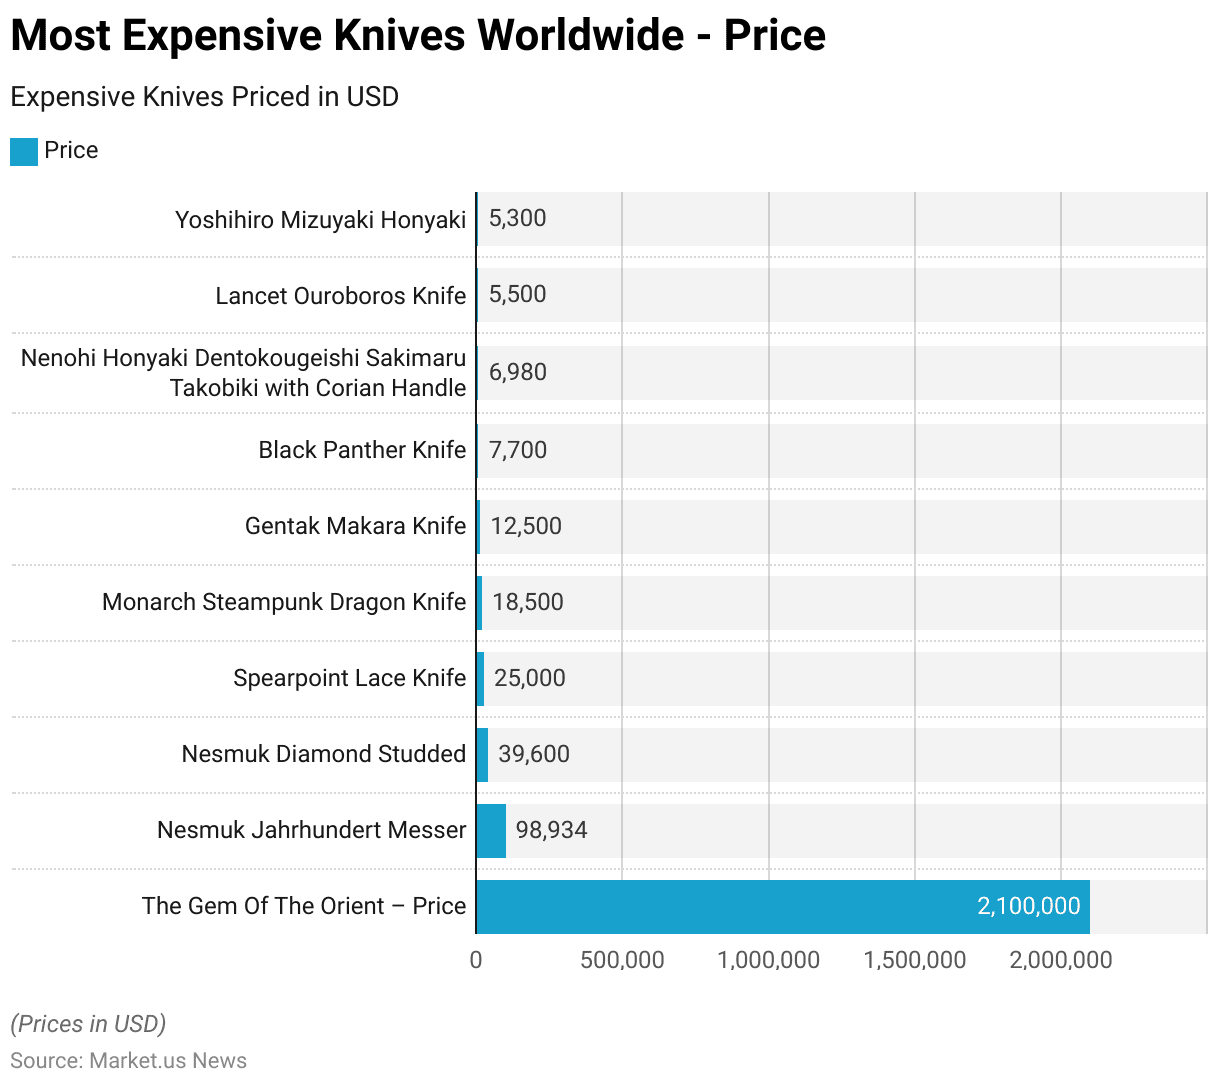
- The list of the most expensive knives worldwide is led by “The Gem of the Orient,” which is valued at an astounding USD 2.1 million, making it the costliest knife globally.
- Following it is the “Nesmuk Jahrhundert Messer,” priced at USD 98,934, and the “Nesmuk Diamond Studded” knife, worth USD 39,600.
- The “Spearpoint Lace Knife” is valued at USD 25,000, while the “Monarch Steampunk Dragon Knife” comes in at USD 18,500.
- Other notable high-end knives include the “Gentak Makara Knife” at USD 12,500, the “Black Panther Knife” at USD 7,700, and the “Nenohi Honyaki Dentokougeishi Sakimaru Takobiki” with a Corian handle, priced at USD 6,980.
- The “Lancet Ouroboros Knife” and “Yoshihiro Mizuyaki Honyaki” are also among the top, priced at USD 5,500 and USD 5,300, respectively.
- This collection showcases some of the most luxurious and exquisitely crafted knives available on the global market.
(Source: Oishya)
Knives and Cutting Blades for Machines and Mechanical Appliances
Revenue Generation
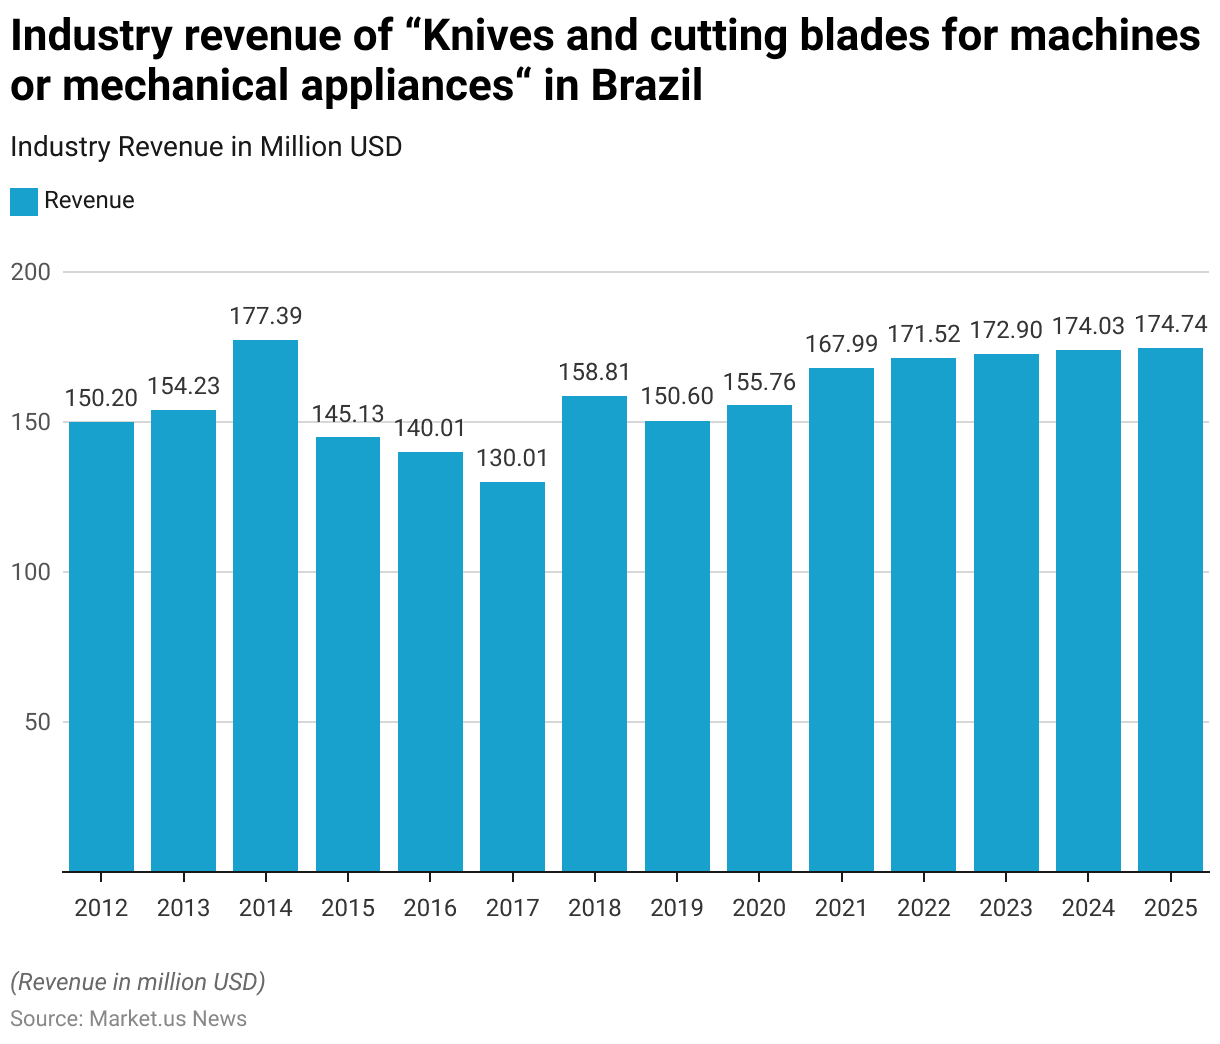
- The revenue generated by the industry for “Knives and cutting blades for machines or mechanical appliances” in Brazil has shown fluctuations from 2012 to 2025.
- In 2012, the industry recorded a revenue of USD 150.2 million, which slightly increased to USD 154.23 million in 2013 and reached a peak of USD 177.39 million in 2014.
- However, a decline followed, with revenues dropping to USD 145.13 million in 2015 and further decreasing to USD 140.01 million in 2016.
- The lowest point was observed in 2017, with revenue falling to USD 130.01 million.
- From 2018 onwards, the industry started to recover, achieving a revenue of USD 158.81 million that year.
- This positive trend continued, with a slight fluctuation in 2019 (USD 150.6 million), before growing to USD 155.76 million in 2020 and USD 167.99 million in 2021.
- In 2022, the industry generated USD 171.52 million, and it is projected to continue growing modestly, reaching USD 172.9 million in 2023, USD 174.03 million in 2024, and USD 174.74 million in 2025.
- This data indicates a stable but gradual recovery and growth pattern for the Brazilian knife and cutting blade industry in the forecast period.
(Source: Statista)
Demographic Insights
By Age
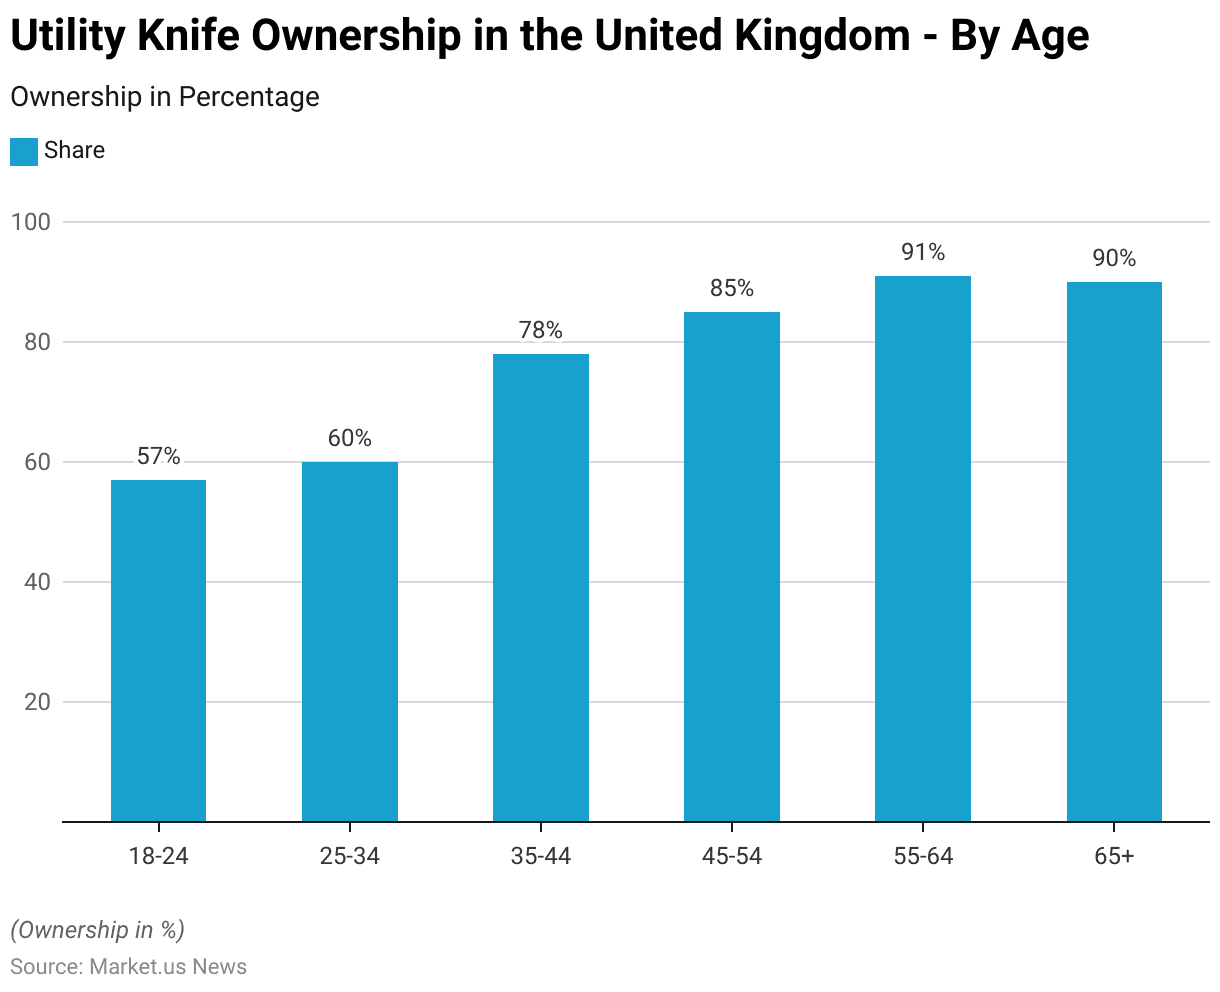
- In 2015, the ownership of Stanley knives or other utility knives in households in the United Kingdom varied significantly by age group.
- Among younger adults aged 18-24, 57% reported having a utility knife in their household, while this percentage increased to 60% for those aged 25-34.
- Ownership was more prevalent in the middle-aged groups, with 78% of respondents aged 35-44 and 85% of those aged 45-54 reporting possession of such tools.
- The highest rates of ownership were observed among older adults, with 91% of individuals aged 55–64 and 90% of those aged 65 and above having a utility knife in their household.
- This data suggests that utility knife ownership becomes more common as individuals age.
(Source: Statista)
By Gender
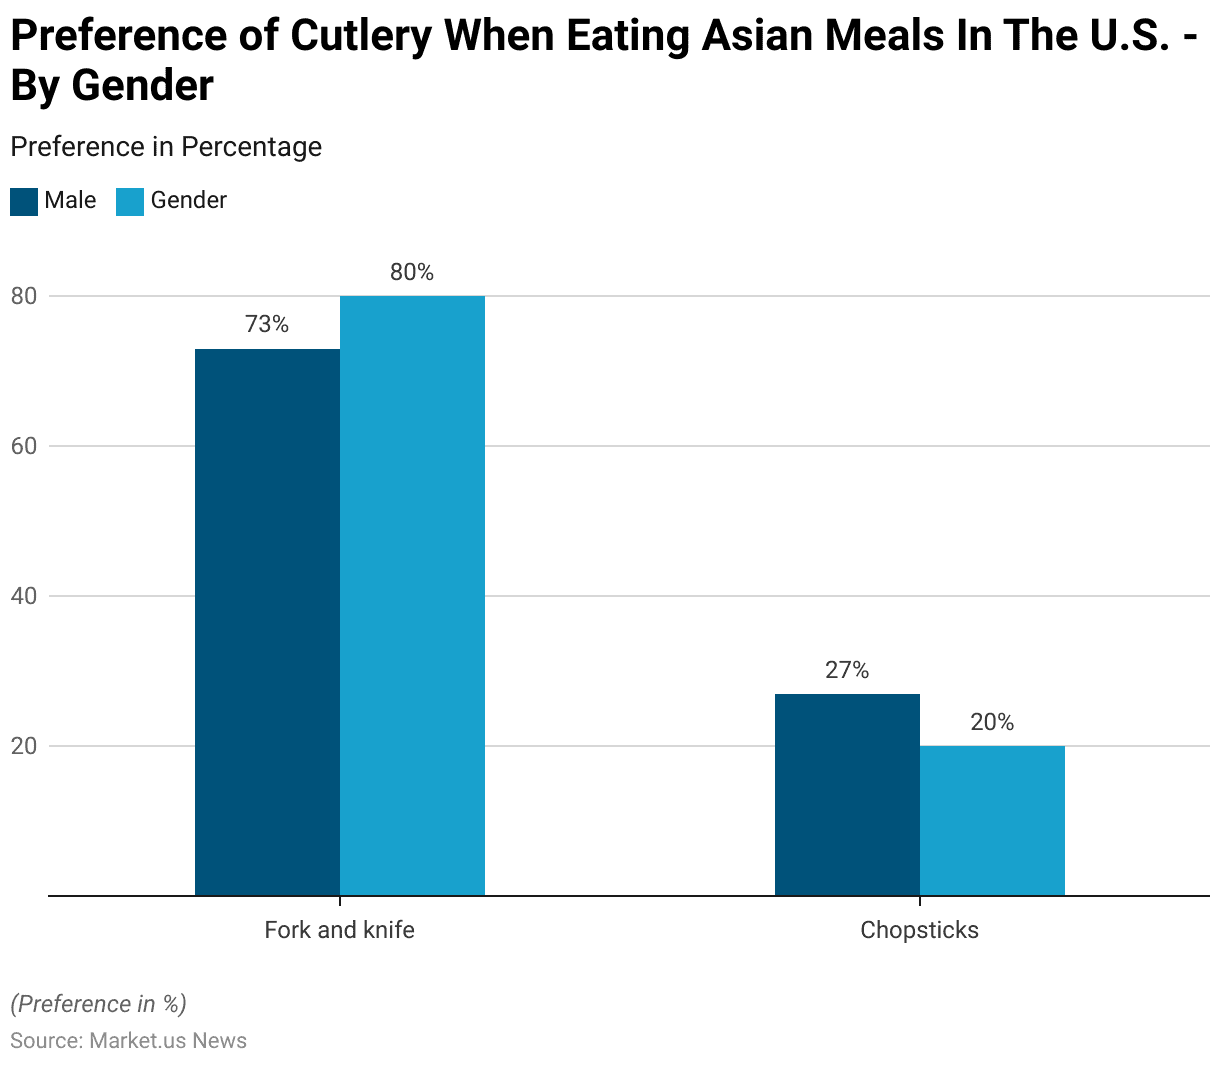
- In 2014, preferences for cutlery when eating Asian meals in the U.S. differed by gender.
- Among males, 73% preferred using a fork and knife, while 27% opted for chopsticks.
- In comparison, 80% of females preferred using a fork and knife, with only 20% choosing chopsticks.
- This data indicates that both men and women in the U.S. predominantly favored Western cutlery, with a smaller percentage of each group opting for traditional Asian utensils when consuming Asian meals.
(Source: Statista)
Consumer Preferences and Trends
Utility Knife Usage Statistics
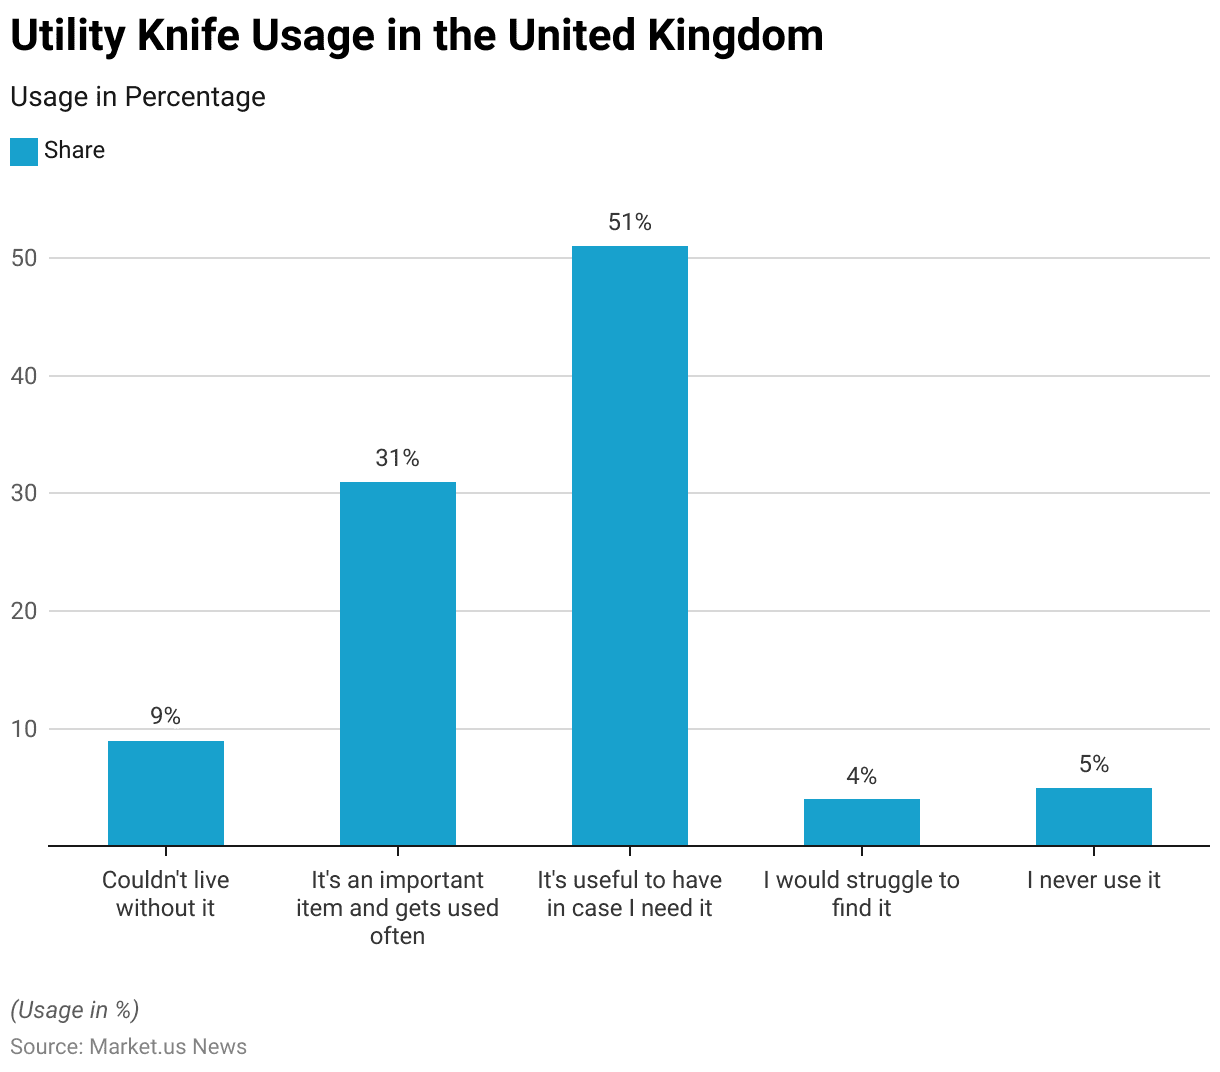
- In 2015, a survey conducted in the United Kingdom assessed how useful Stanley knives or other utility knives were to respondents.
- The majority, 51%, indicated that while they found it useful to have a utility knife on hand, it was more of a preventive tool for potential needs.
- Meanwhile, 31% of respondents considered it an important item that they used frequently.
- A smaller portion, 9%, felt they couldn’t live without it due to its importance in their daily tasks.
- However, 4% noted that they would struggle to find it when needed, and 5% reported that they never used the tool.
- These results demonstrate a broad range of attitudes towards utility knives, from frequent reliance to rare or non-existent usage.
(Source: Statista)
Cutlery Products Purchase Preferences Among Consumers
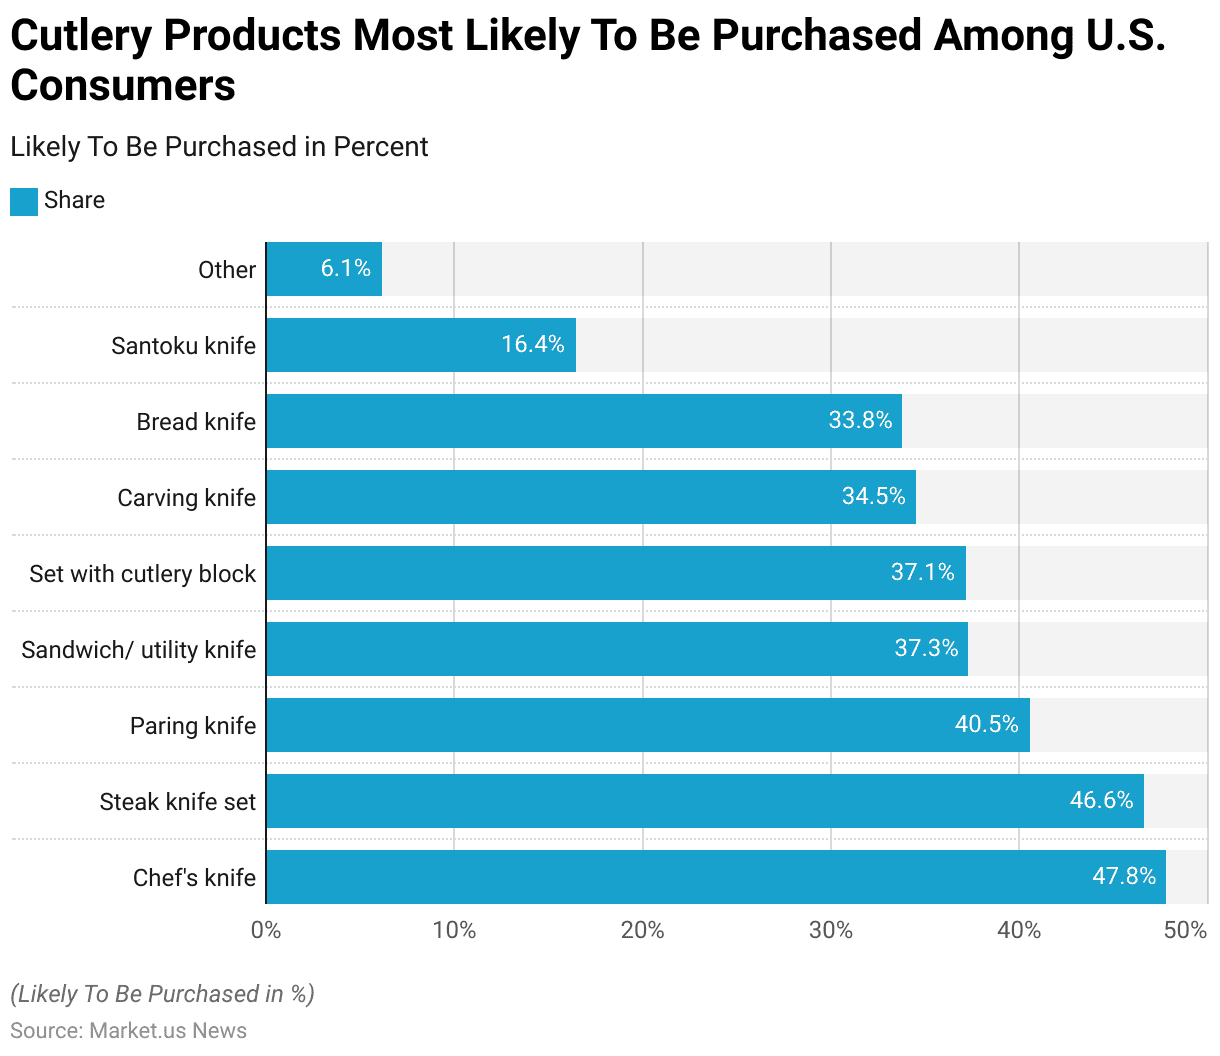
- In 2020, U.S. consumers showed distinct preferences when it came to purchasing cutlery products.
- Chef’s knives were the most popular, with 47.8% of respondents indicating a likelihood of purchase.
- Close behind, 46.6% favored steak knife sets, while 40.5% preferred paring knives.
- Sandwich or utility knives were likely to be purchased by 37.3% of consumers, and 37.1% were inclined to buy a set with a cutlery block.
- Carving knives and bread knives were also popular, with 34.5% and 33.8% of respondents, respectively, expressing interest in these products.
- Santoku knives appealed to 16.4% of consumers, while 6.1% were likely to purchase other types of cutlery.
- This data reflects a broad interest in versatile and specialized cutlery among U.S. consumers.
(Source: Statista)
Sales Channels Most Used for Shopping for Cutlery Among Consumers
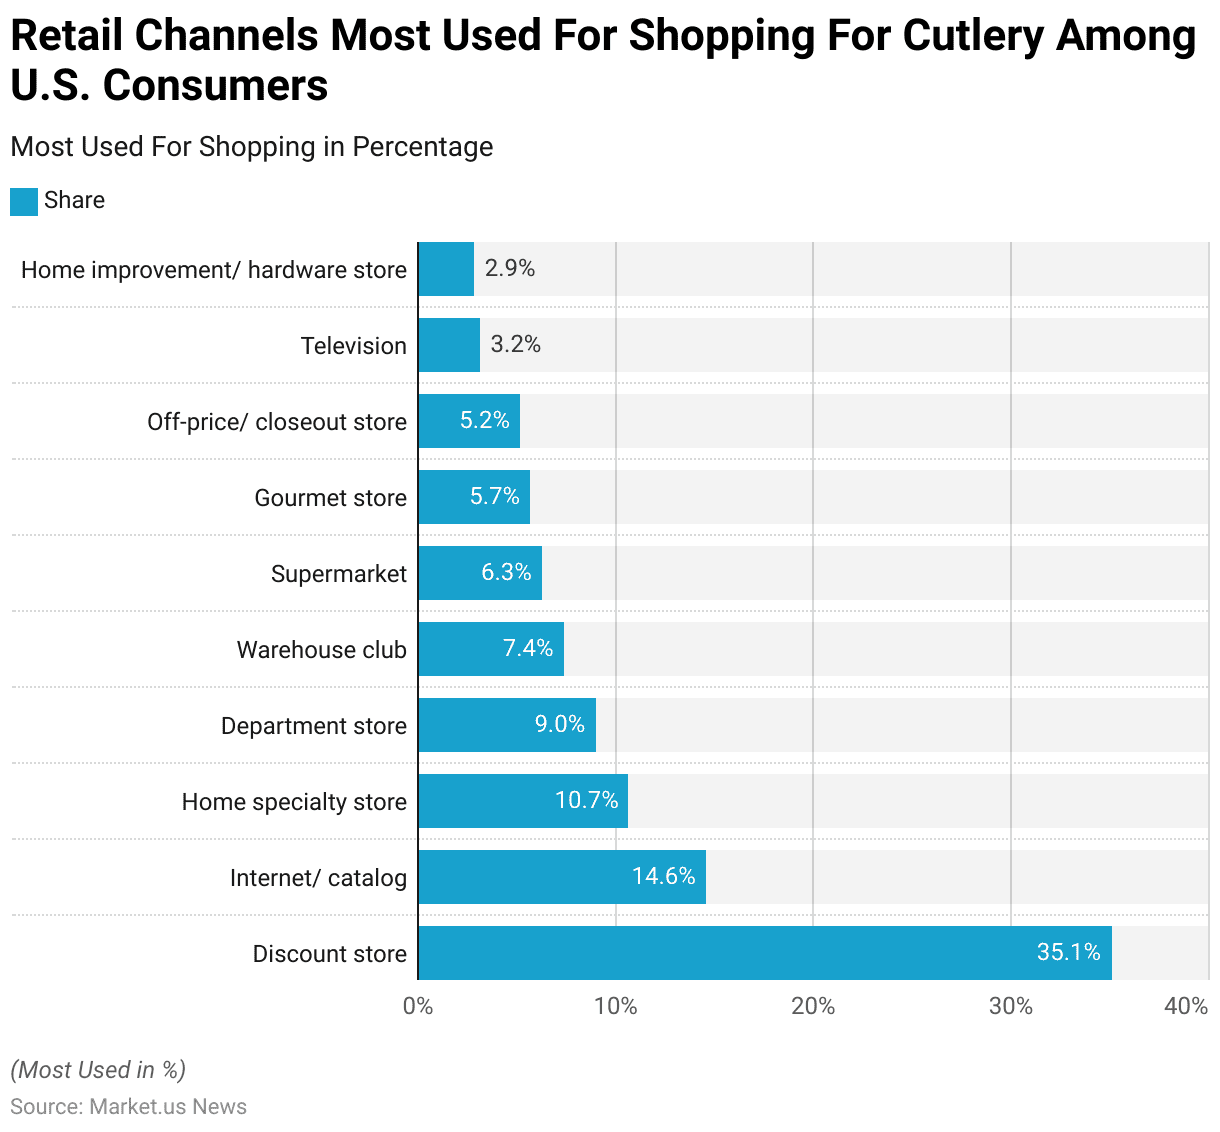
- As of 2020, U.S. consumers showed a clear preference for shopping for cutlery through various retail channels.
- Discount stores were the most popular option, with 35.1% of respondents choosing them for their cutlery purchases.
- Internet and catalog shopping followed, with 14.6% of consumers utilizing these channels.
- Home specialty stores attracted 10.7% of respondents, while 9% favored department stores.
- Warehouse clubs were used by 7.4% of consumers, and 6.3% shopped for cutlery at supermarkets.
- Gourmet stores accounted for 5.7% of respondents’ preferences, while off-price or closeout stores were chosen by 5.2%.
- A smaller portion of consumers, 3.2%, purchased cutlery through television, and 2.9% opted for home improvement or hardware stores.
- This data highlights the variety of retail channels consumers use, with a significant emphasis on discounts and online options.
(Source: Statista)
Kitchen Knife Maintenance Preferences Among Consumers Statistics
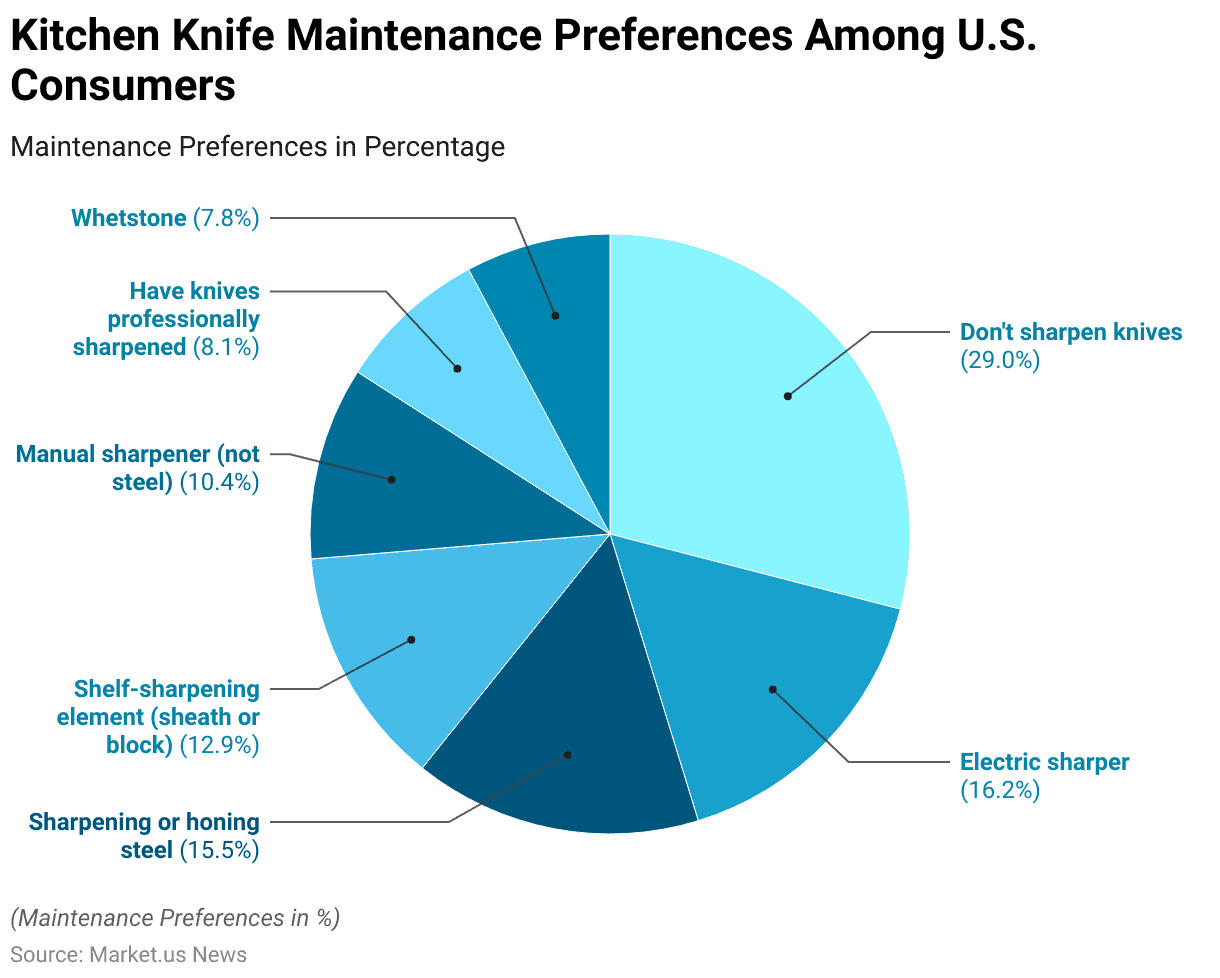
- In 2020, kitchen knife maintenance preferences among U.S. consumers varied widely.
- A significant portion, 29%, reported that they do not sharpen their knives at all.
- Of those who do, 16.2% preferred using an electric sharpener, while 15.5% opted for sharpening or honing steel.
- Shelf-sharpening elements, such as sheaths or blocks, were used by 12.9% of consumers.
- Manual sharpeners, excluding steel, were preferred by 10.4%, and 8.1% of respondents had their knives professionally sharpened.
- A smaller portion, 7.8%, used a whetstone to maintain their knives.
- This data reveals diverse approaches to kitchen knife maintenance, with a notable share of consumers choosing not to sharpen their knives themselves.
(Source: Statista)
Crimes Committed Due to Knives and Related Challenges
Knife Possession Offences by Children Statistics
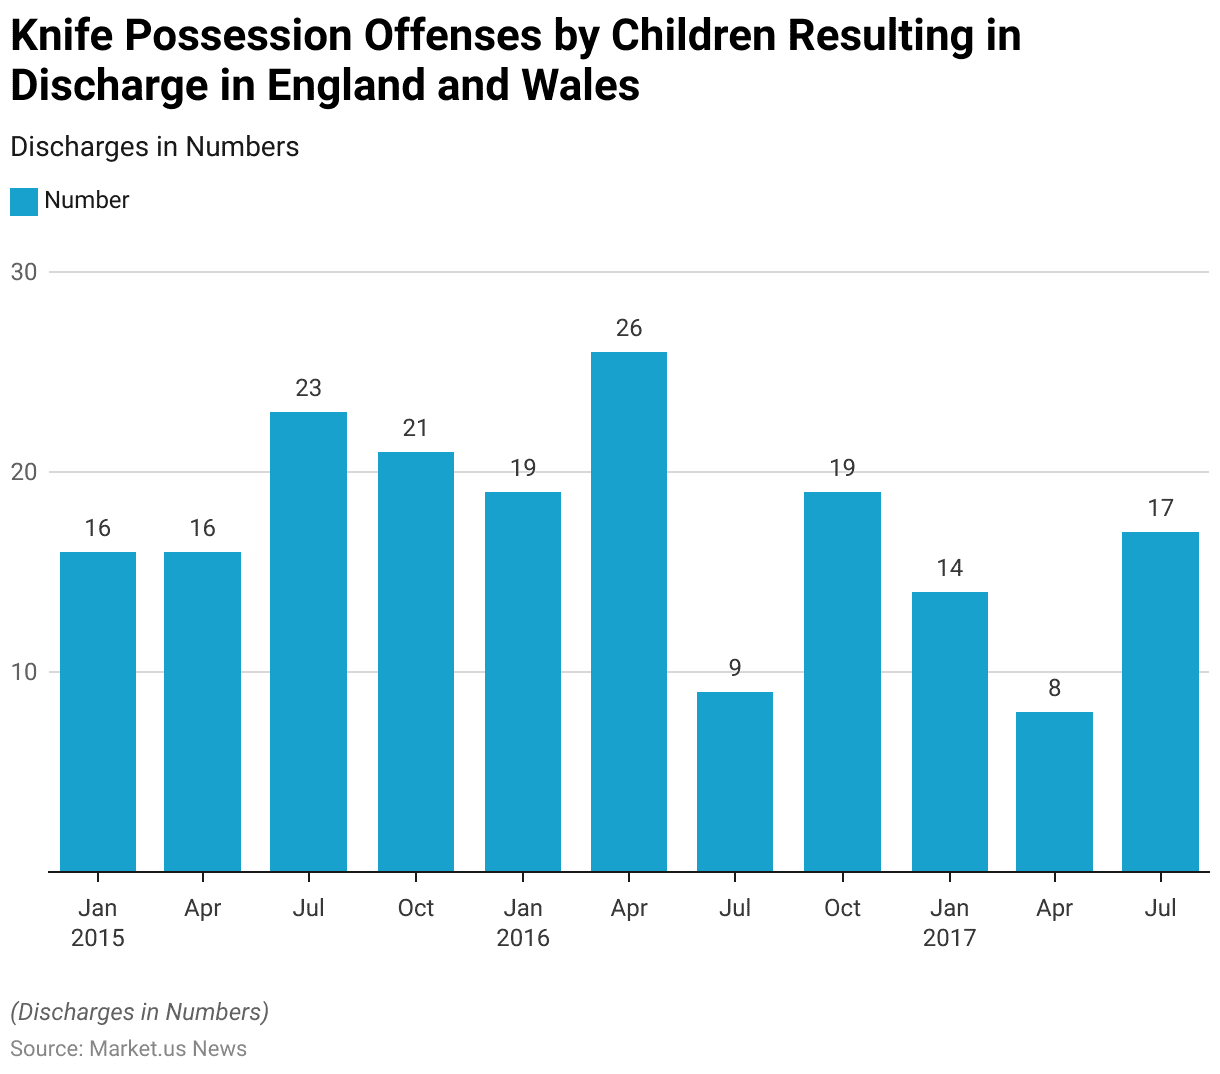
- Between the first quarter of 2015 and the third quarter of 2017. The number of knife possession offenses by children in England and Wales that resulted in discharge fluctuated.
- In the first and second quarters of 2015, there were 16 discharges each. Rising to 23 in the third quarter before slightly decreasing to 21 in the fourth quarter.
- The trend continued with 19 discharges in the first quarter of 2016 and peaking at 26 in the second quarter.
- However, the number of discharges dropped significantly to 9 in the third quarter of 2016, rebounding to 19 by the fourth quarter.
- In 2017, discharges remained relatively low, with 14 in the first quarter and a further decline to 8 in the second quarter.
- The figure rose again to 17 discharges in the third quarter of 2017.
- This data reflects variability in the number of discharges over the two years.
(Source: Statista)
Knife Possession Offences by Adults Statistics
- Between the first quarter of 2015 and the third quarter of 2017, the number of knife possession offenses by adults resulting in community sentences in England and Wales fluctuated.
- In the first quarter of 2015, there were 668 community sentences. Which increased slightly to 675 in the second quarter and further to 692 in the third quarter.
- However, the number dropped to 612 in the fourth quarter of 2015.
- In 2016, the figures remained relatively stable, with 674 sentences in the first quarter, 645 in the second quarter, and 675 in the third quarter. By the fourth quarter of 2016, the number had decreased to 548.
- In 2017, community sentences increased again, reaching 690 in the first quarter. Though this number fell to 614 in the second quarter before rising slightly to 650 in the third quarter.
- This data shows periodic fluctuations, with numbers generally ranging between 600 and 700 sentences during the observed period.
(Source: Statista)

Police Recorded Knife or Sharp Instrument Offences Statistics
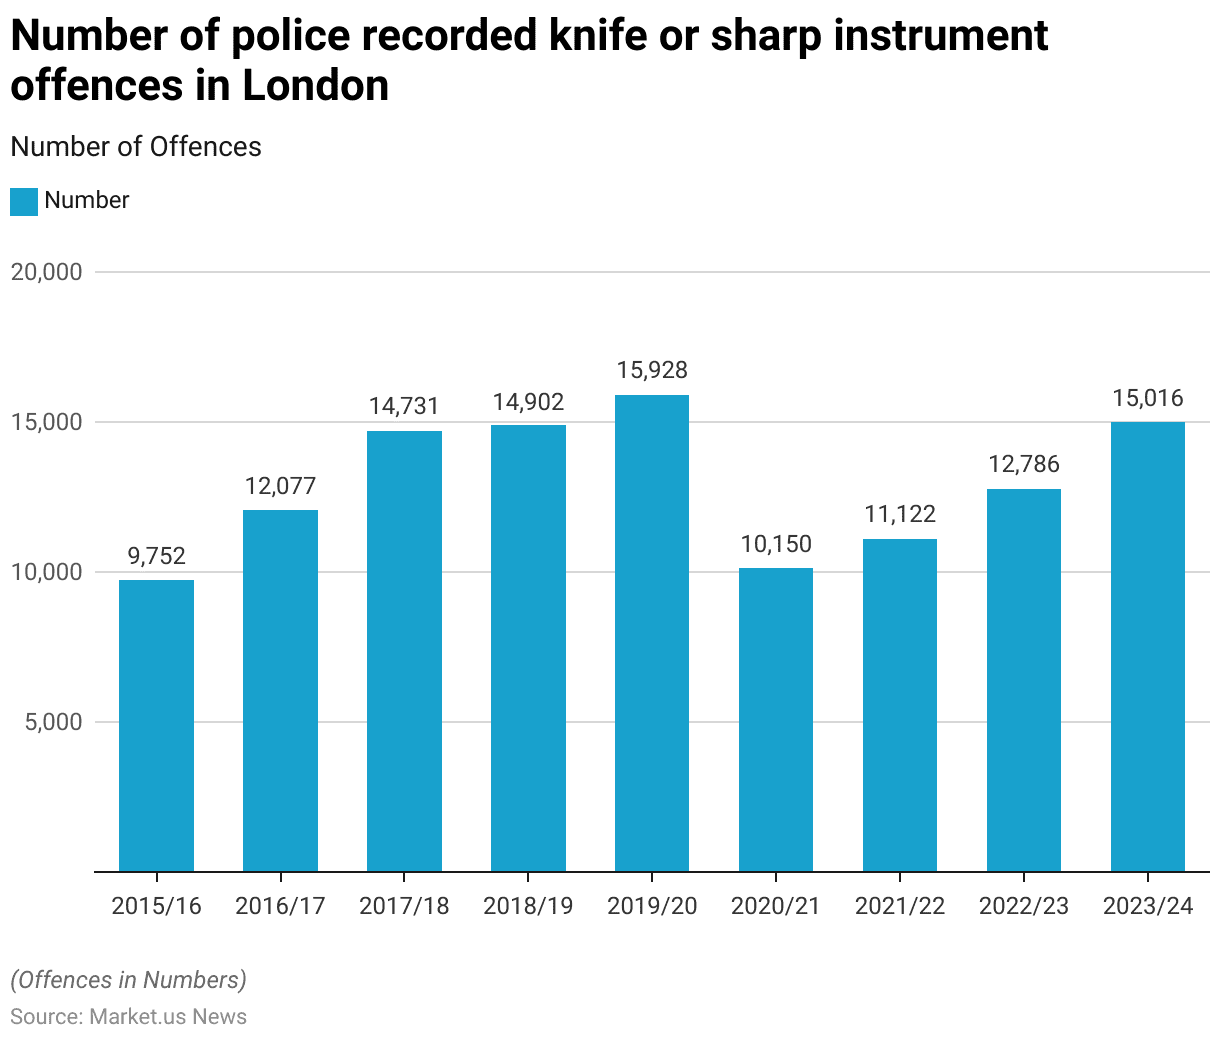
- The number of police-recorded knife or sharp instrument offences in London has varied from 2015/16 to 2023/24.
- In 2015/16, there were 9,752 recorded offences, which increased significantly to 12,077 in 2016/17.
- This upward trend continued, reaching 14,731 offenses in 2017/18 and slightly rising to 14,902 in 2018/19.
- The highest number of recorded offenses during this period occurred in 2019/20, with 15,928 offenses.
- However, in 2020/21, the number dropped to 10,150, likely influenced by the COVID-19 pandemic.
- The following years saw gradual increases, with 11,122 offenses recorded in 2021/22, 12,786 in 2022/23, and 15,016 in 2023/24.
- Overall, the data reflects a fluctuating trend with periods of both rise and decline in knife-related offenses in London over the years.
(Source: Statista)
Homicide Offences Involving a Knife or Sharp Instrument Statistics
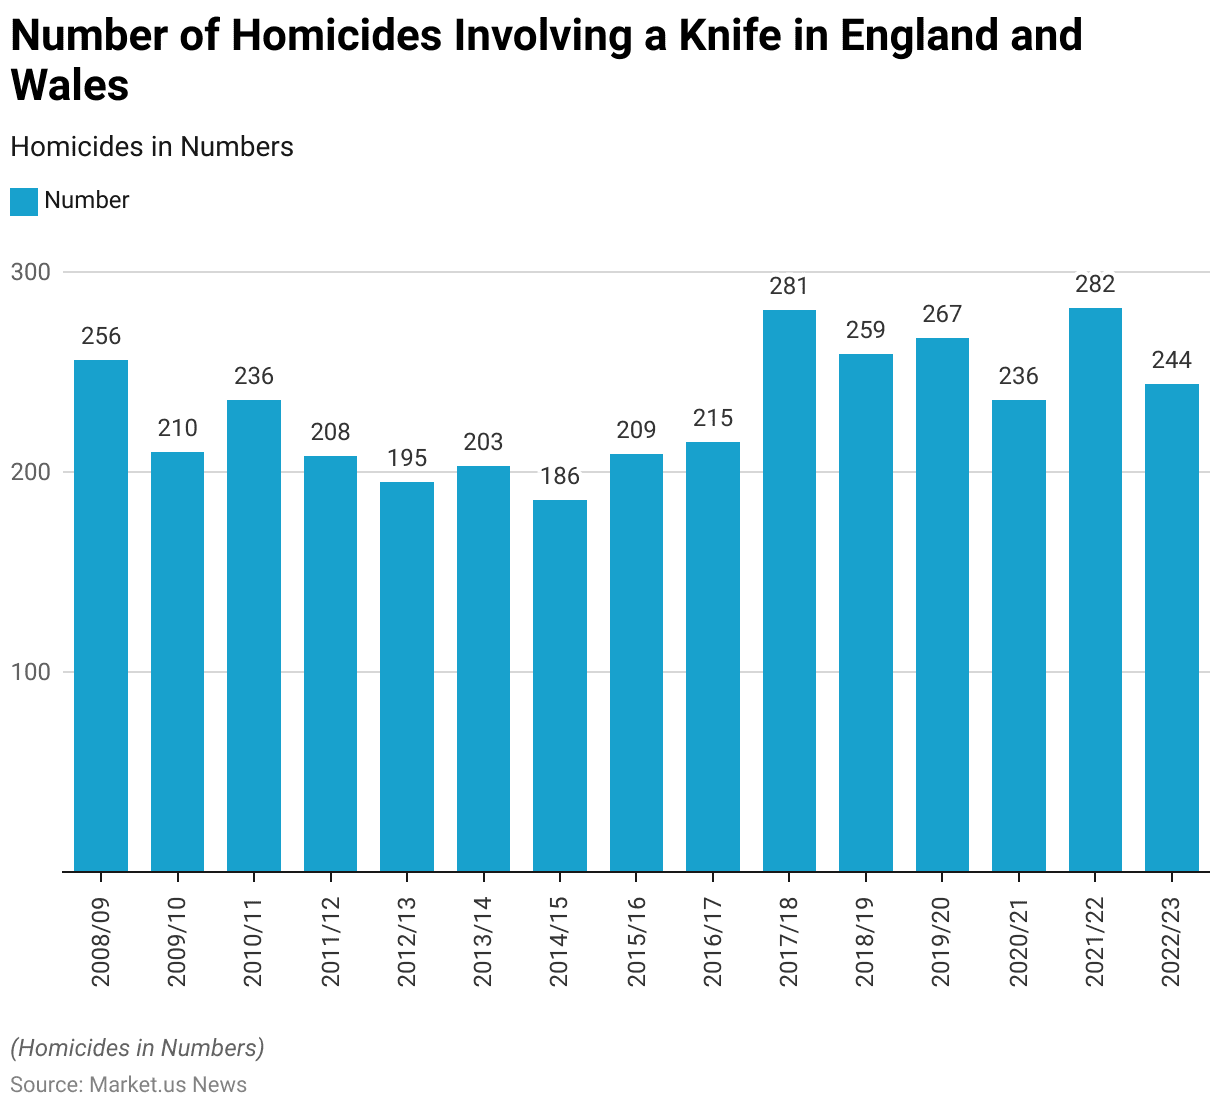
- From 2008/09 to 2022/23, the number of homicide offenses involving a knife or sharp instrument in England and Wales fluctuated.
- In 2008/09, there were 256 such offenses, which dropped to 210 in 2009/10 and slightly rose to 236 in 2010/11.
- The trend continued with a decline to 208 in 2011/12 and further decreased to 195 in 2012/13. A modest increase occurred in 2013/14, with 203 homicides, followed by a decrease to 186 in 2014/15.
- However, from 2015/16 onwards, there was a general upward trend, with 209 offences in 2015/16 and 215 in 2016/17.
- The highest figure during this period was recorded in 2017/18, with 281 homicides. Followed by a slight drop to 259 in 2018/19 and a rise again to 267 in 2019/20.
- In 2020/21, the number decreased to 236, likely influenced by the pandemic, but increased again to 282 in 2021/22.
- The most recent data for 2022/23 shows a slight decrease to 244 homicides involving a knife or sharp instrument.
- This data reflects a variable but overall increasing trend over the 15 years.
(Source: Statista)
Sentencing and Justice
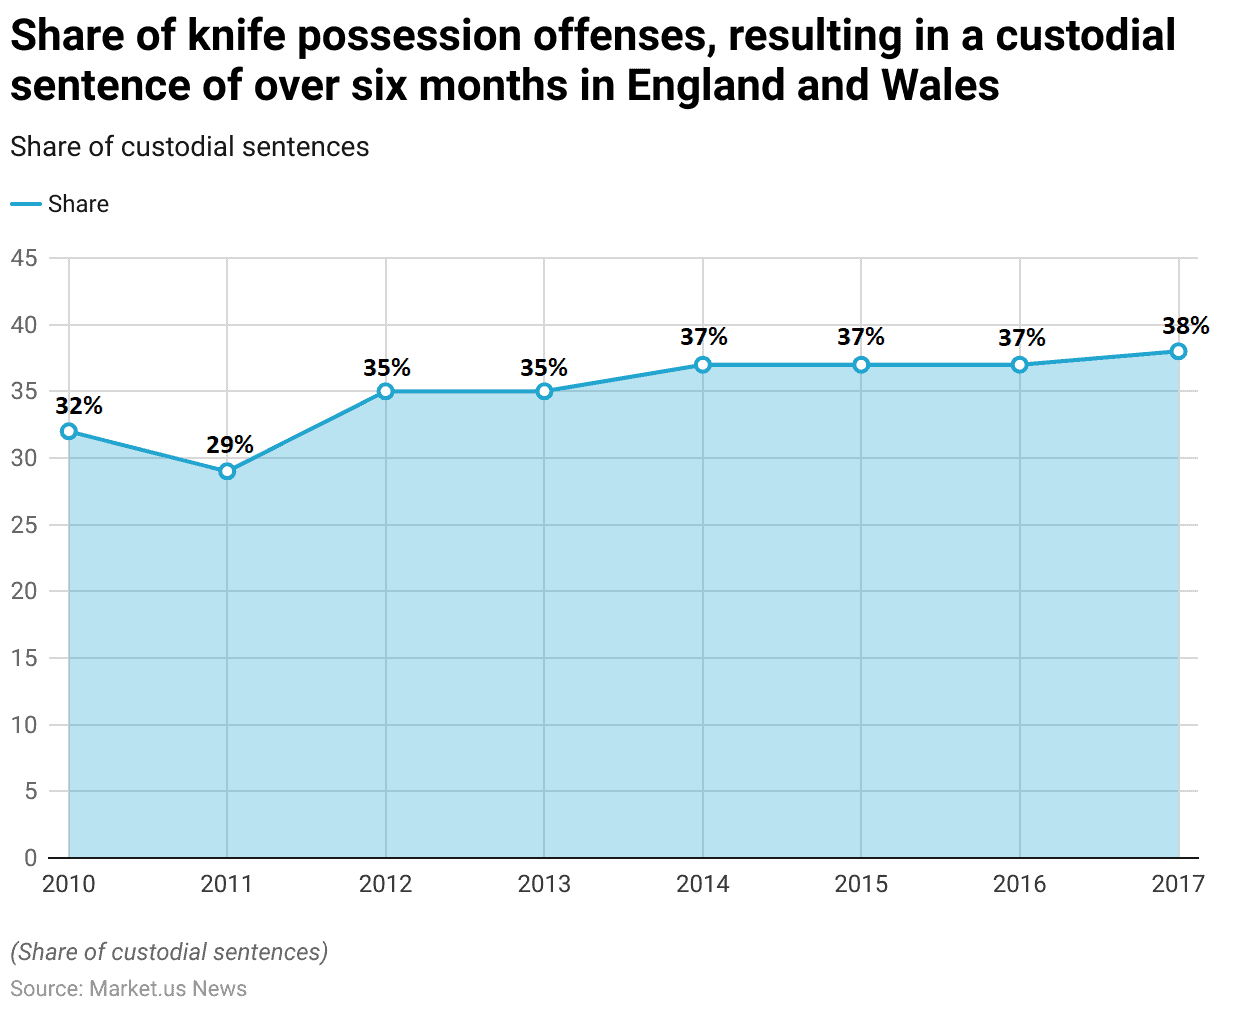
- From October 2010 to September 2017, the share of knife possession offenses in England and Wales that resulted in a custodial sentence of over six months generally increased.
- In 2010, 32% of such offenses led to custodial sentences, which decreased to 29% in 2011.
- However, by 2012, this figure rose to 35%, where it remained steady through 2013.
- In 2014, the share increased further to 37%, a level that was maintained through 2015 and 2016.
- By 2017, the share of custodial sentences exceeding six months reached its highest point during the period, at 38%.
- This data highlights a trend of increasing custodial sentences for knife possession offenses over the last seven years.
(Source: Statista)
Criminal Justice Reforms for Knife Crimes Statistics
- Criminal justice reforms targeting knife crimes have seen diverse approaches across various countries. In the U.K., the Offensive Weapons Act (2019) introduced measures such as prohibiting the possession of certain knives in private and restricting the delivery of knives to individuals under 18.
- Knife Crime Prevention Orders (KCPOs) are employed to impose curfews, social media restrictions, and educational interventions on high-risk individuals, aiming to prevent further offenses.
- Similar reforms are evident in other nations, with Australia implementing strict penalties for knife possession and Scotland focusing on public health approaches, combining education with enforcement to reduce knife crime.
- These reforms typically involve multi-agency efforts, blending law enforcement with social services to address the root causes of knife violence.
- Enhanced penalties for offenders, increased stop-and-search powers, and youth engagement programs are common tactics used to mitigate knife-related crimes globally.
(Sources: Government of U.K., College of Policing)
Recent Developments
Acquisitions and Mergers:
- Browning acquires CRKT (Columbia River Knife and Tool): In 2023, Browning, a major player in the outdoor and sporting goods industry, acquired CRKT for $250 million. This acquisition aims to expand Browning’s portfolio of outdoor knives, targeting both hunters and outdoor enthusiasts.
- Victorinox merges with Wenger: Victorinox, known for its Swiss Army knives, merged with Wenger in 2023 to consolidate the two brands. This merger, valued at $400 million, strengthens Victorinox’s global market presence, particularly in multi-purpose knives and tools.
New Product Launches:
- Benchmade Launches New Tactical Knife: In early 2024, Benchmade introduced a new tactical folding knife designed for military and law enforcement use. This knife features enhanced blade durability and a new locking mechanism, offering improved safety and performance in high-stress situations.
- Gerber’s Sustainable Knife Series: In mid-2023, Gerber launched a new series of sustainable knives made from recycled materials and environmentally friendly production methods. This new product line reflects growing consumer demand for eco-friendly products in the outdoor and knife industries.
Funding:
- KA-BAR secures $50 million for R&D: In 2023, KA-BAR, a leading knife manufacturer, raised $50 million in funding to invest in research and development for new materials and production techniques. This funding will allow KA-BAR to develop more durable, lightweight knives, particularly for military and survival applications.
- Spyderco invests $30 million in technology: Spyderco, a popular knife maker, announced a $30 million investment in 2024 to improve its blade technology. Focusing on developing corrosion-resistant steel and precision sharpening techniques. The investment will also enhance Spyderco’s automated production processes.
Technological Advancements:
- Ceramic and Composite Blades: Recent advancements in knife technology include the use of ceramic and composite blades, which offer superior sharpness and durability compared to traditional steel. By 2025, ceramic knives are projected to account for 15% of the high-end kitchen knife market. Driven by their lightweight and rust-resistant properties.
- Smart Knives with Safety Features: Companies are introducing smart knives with built-in safety features. Including sensors that detect unsafe handling or apply automatic blade retraction. It is estimated that by 2024, 10% of new tactical knives will feature some form of safety technology.
Market Dynamics:
- Growth in the Global Knife Market: This growth is driven by increasing demand for tactical knives, outdoor survival tools, and high-quality kitchen knives.
- Rising Demand for Custom and Handcrafted Knives: Custom and handcrafted knives are gaining popularity, particularly among collectors and enthusiasts. By 2025, custom knives are expected to make up 20% of the high-end knife market. As demand for unique and artisanal products continues to rise.
Conclusion
Knife Statistics – The knife industry is poised for continued growth, driven by consumer preferences, technological advancements, and rising demand across various segments.
Key trends include innovations in materials and ergonomic designs, with major players investing heavily in R&D and new entrants targeting niche markets.
Despite challenges like fluctuating raw material costs and regulatory hurdles, the market outlook is positive.
To sustain competitive advantage, stakeholders should focus on technological innovation, sustainability, and expansion into emerging markets.
FAQs
The most commonly used knives in households include chef’s knives, paring knives, steak knives, utility knives, bread knives, and carving knives. Chef’s knives and steak knives are particularly popular among consumers.
Knife maintenance varies depending on the tool. Some consumers use electric sharpeners, manual sharpeners, honing steel, or whetstones, while others prefer to have their knives professionally sharpened. Regular maintenance ensures the longevity and sharpness of knives.
Knives should be stored in a knife block, magnetic strip, or protective sheath to avoid accidents. Proper storage also helps maintain the blade’s sharpness and reduces the risk of injury.
Steel is the most popular material for kitchen knives due to its durability and ease of sharpening. Other materials, such as titanium and ceramic, are also used but are less common.
The rise in knife-related crimes can be attributed to several factors, including social, economic, and cultural influences. Authorities continue to focus on enforcement and prevention to curb knife crime rates.


