Table of Contents
- Introduction
- Editor’s Choice
- Luggage & Bags Market Statistics
- Sales Value of the Global Luggage Market Statistics
- Anti-Theft Luggage Market Statistics
- Luggage Suitcases & Briefcases Industry Statistics
- Travel Bag Materials Statistics
- Global Sales of Luggage Companies Statistics
- Export of Luggage Products Statistics
- Import of Luggage Products Statistics
- Expenditure on Luggage Worldwide Statistics
- Consumer Preferences and Trends
- Luggage Checking at Airports
- Luggage Regulations
- Recent Developments
- Conclusion
- FAQs
Introduction
Luggage Statistics: Luggage is an essential component of travel, designed to transport personal belongings efficiently and securely.
Various types include hard-shell and soft-shell suitcases, carry-ons, backpacks, duffel bags, garment bags, and kid’s trolley bags, each suited to different travel needs.
Key features to consider when selecting luggage are size and capacity, weight, wheels and handles, security features, durability, and organizational compartments.
Factors such as travel frequency, type, budget, and brand reputation also influence the choice of luggage. Ultimately, selecting the right luggage enhances the travel experience by providing convenience and efficiency tailored to individual preferences.
Editor’s Choice
- The global luggage and bags market size reached USD 176.98 billion in 2023.
- In 2022, the competitive landscape of the global luggage and bags market was characterized by a significant presence of both major and numerous smaller companies. Louis Vuitton led with a market share of 6%, reflecting its strong brand recognition and premium positioning.
- In 2023, the revenue generated from the global luggage and bags market exhibited significant disparities across various countries. The United States led the market with a substantial revenue figure of USD 28,729.39 million.
- The market value of anti-theft luggage is projected to reach USD 8.8 billion, respectively, by 2024.
- Samsonite, a leading brand, reported sales of USD 1,250 million in 2008, which declined to USD 1,029 million in 2009 during the economic downturn before rebounding to USD 1,215 million in 2010.
- In 2015, per capita expenditure on luggage varied significantly across different regions and countries, reflecting disparities in economic conditions and consumer spending habits. Japan led with the highest per capita expenditure on luggage at USD 32.3, indicating a strong market demand for travel goods.
- In 2012, a survey of U.S. consumers revealed various factors that influenced their decisions to purchase new luggage. The predominant factor was luggage size and dimensions, with 76% of respondents indicating this as a key consideration.
Luggage & Bags Market Statistics
Global Luggage & Bags Market Size Statistics
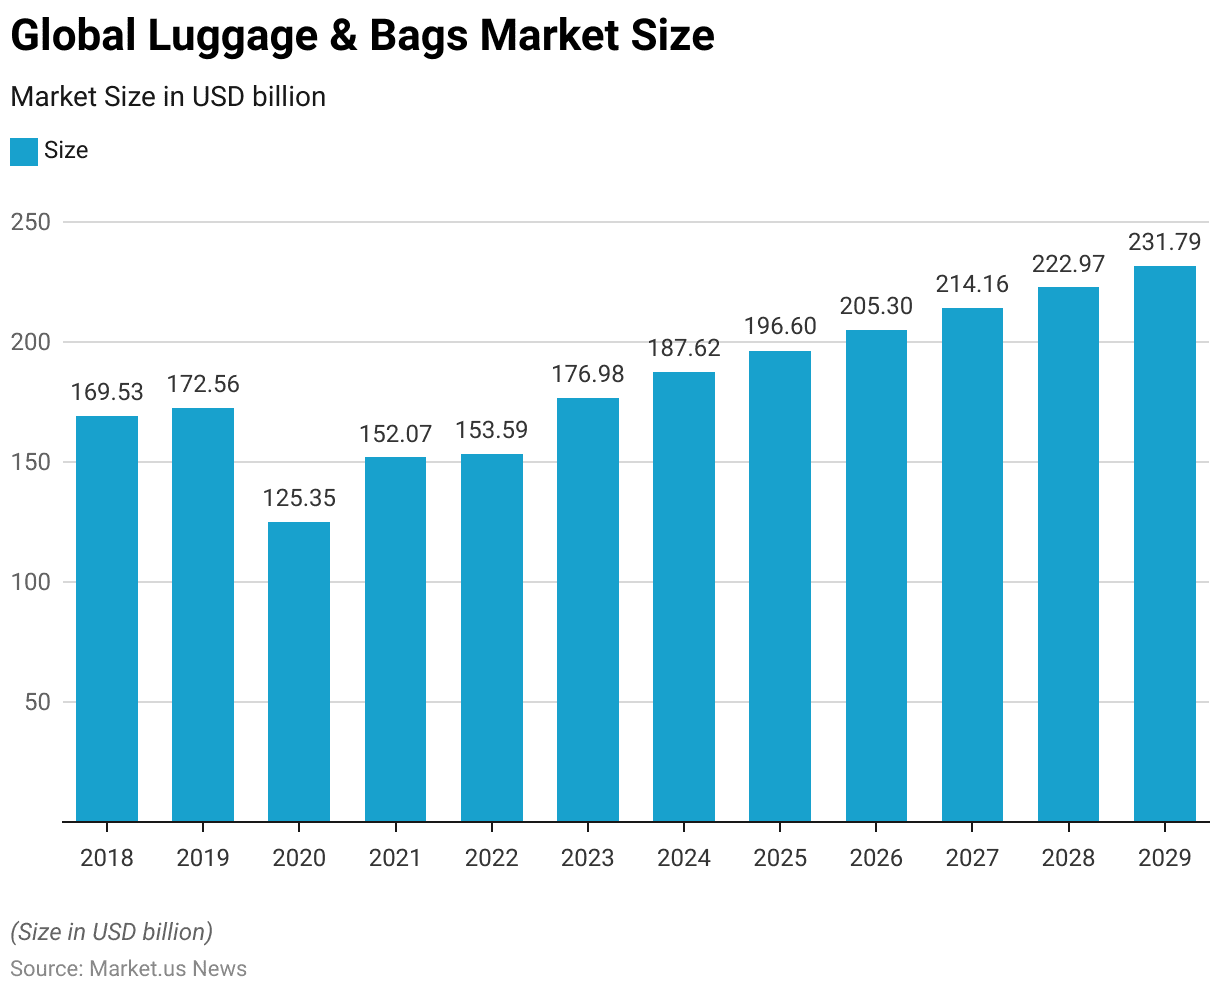
- The global market size for luggage and bags has demonstrated variable growth over the period from 2018 to 2029 at a CAGR of 4.32%.
- In 2018, the market was valued at USD 169.53 billion, showing a slight increase to USD 172.56 billion in 2019.
- A significant decline occurred in 2020, when the market size dropped to USD 125.35 billion, likely due to external impacts affecting market conditions.
- Recovery began in 2021, with the market size increasing to USD 152.07 billion and further to USD 153.59 billion in 2022.
- The upward trend continued through the subsequent years, reaching USD 176.98 billion in 2023, USD 187.62 billion in 2024, and USD 196.60 billion in 2025.
- The market is projected to grow consistently in the following years, with estimates of USD 205.30 billion in 2026, USD 214.16 billion in 2027, USD 222.97 billion in 2028, and culminating at USD 231.79 billion by 2029.
- This trajectory indicates a resilient recovery and a positive growth outlook for the global luggage and bags market over the forecast period.
(Source: Statista)
Global Luggage & Bags Market Size – By Type Statistics
2018-2022
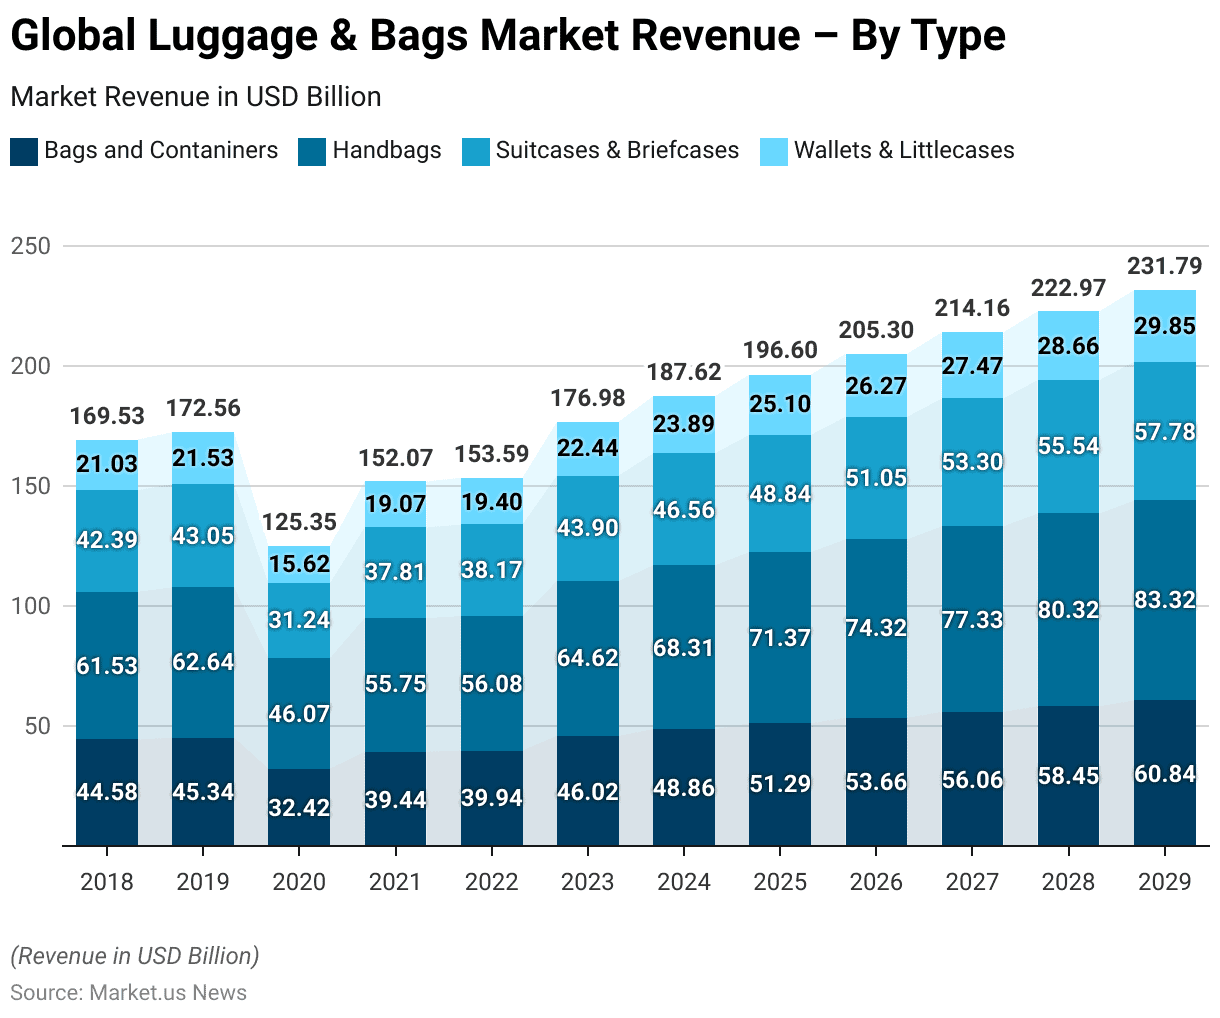
- The revenue distribution by type within the global luggage and bags market from 2018 to 2022 reveals differentiated growth patterns across various categories.
- Starting in 2018, bags and containers generated USD 44.58 billion, handbags accounted for USD 61.53 billion, suitcases and briefcases brought in USD 42.39 billion, while wallets and small cases contributed USD 21.03 billion.
- This pattern of growth persisted, with a notable dip in 2020 due to likely market disruptions, where bags and containers dropped to USD 32.42 billion, handbags to USD 46.07 billion, suitcases and briefcases to USD 31.24 billion, and wallets and small cases to USD 15.62 billion.
- A recovery was observed in 2021, with bags and containers increasing to USD 39.44 billion, handbags to USD 55.75 billion, suitcases and briefcases to USD 37.81 billion, and wallets and small cases to USD 19.07 billion.
2023-2029
- The market continued to expand, with bags and containers reaching USD 46.02 billion in 2023, handbags USD 64.62 billion, suitcases and briefcases USD 43.90 billion, and wallets and small cases USD 22.44 billion.
- By 2024, the figures had increased further, with bags and containers at USD 48.86 billion, handbags at USD 68.31 billion, suitcases and briefcases at USD 46.56 billion, and wallets and small cases at USD 23.89 billion.
- Projected growth continues into the latter part of the decade, with 2029 forecasts indicating bags and containers will reach USD 60.84 billion, handbags USD 83.32 billion, suitcases and briefcases USD 57.78 billion, and wallets and small cases USD 29.85 billion.
- This progression underscores a steady recovery and robust growth in each segment of the luggage and bags market, demonstrating sustained consumer demand and evolving market dynamics.
(Source: Statista)
Global Luggage & Bags Market Revenue Change – By Type Statistics
2019-2022
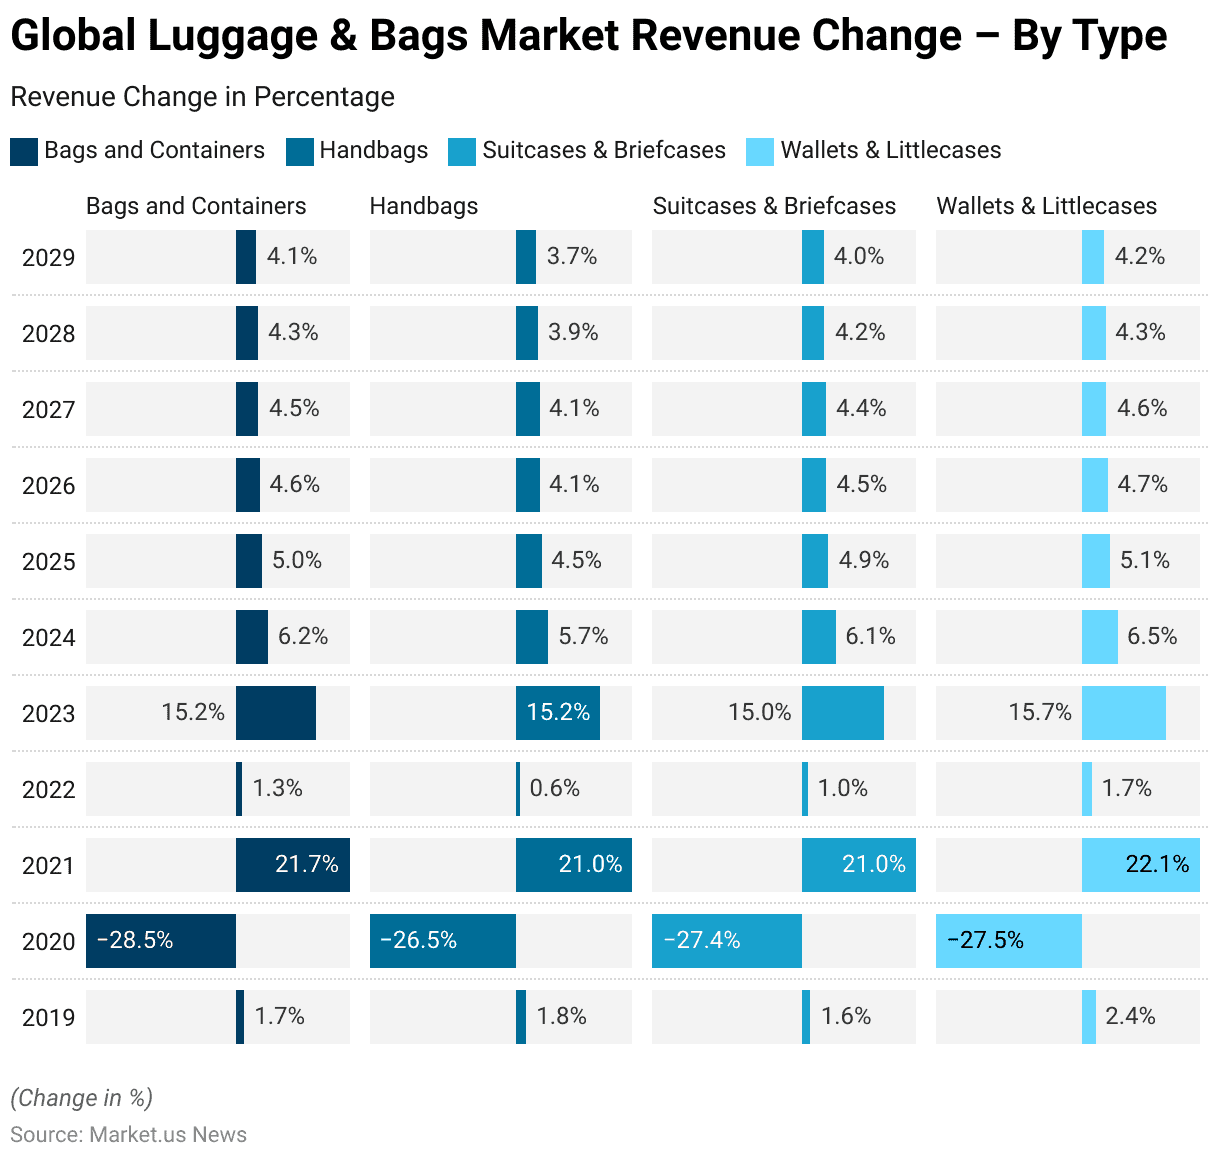
- The annual percentage changes in revenue by type within the global luggage and bags market from 2019 to 2022 reflect varying levels of market resilience and recovery across different product categories.
- In 2019, modest growth was observed across all categories: bags and containers increased by 1.7%, handbags by 1.8%, suitcases and briefcases by 1.6%, and wallets and small cases by 2.4%.
- However, in 2020, there was a significant decline across all segments, with bags and containers dropping by 28.5%, handbags by 26.5%, suitcases and briefcases by 27.4%, and wallets and small cases by 27.5%, likely due to global economic disruptions.
- A robust recovery commenced in 2021, with revenue increases of 21.7% for bags and containers, 21.0% for handbags, 21.0% for suitcases and briefcases, and 22.1% for wallets and small cases. Growth stabilized in 2022, with more modest increases: bags and containers by 1.3%, handbags by 0.6%, suitcases and briefcases by 1.0%, and wallets and small cases by 1.7%.
2023-2029
- The growth continued at a healthy pace in 2023, with increases of 15.2% for both bags and containers and handbags, 15.0% for suitcases and briefcases, and 15.7% for wallets and small cases.
- From 2024 onward, the growth rates began to normalize, reflecting a maturing market. In 2024, the revenue growth was 6.2% for bags and containers, 5.7% for handbags, 6.1% for suitcases and briefcases, and 6.5% for wallets and small cases.
- These rates gradually tapered off towards the end of the forecast period in 2029, with bags and containers growing by 4.1%, handbags by 3.7%, suitcases and briefcases by 4.0%, and wallets and small cases by 4.2%.
- This data indicates a stable and sustained growth pattern in the global luggage and bags market across various product types, signaling ongoing consumer engagement and market expansion.
(Source: Statista)
Compound Annual Growth Rate of the Luggage Market’s Sales Worldwide – By Category Statistics
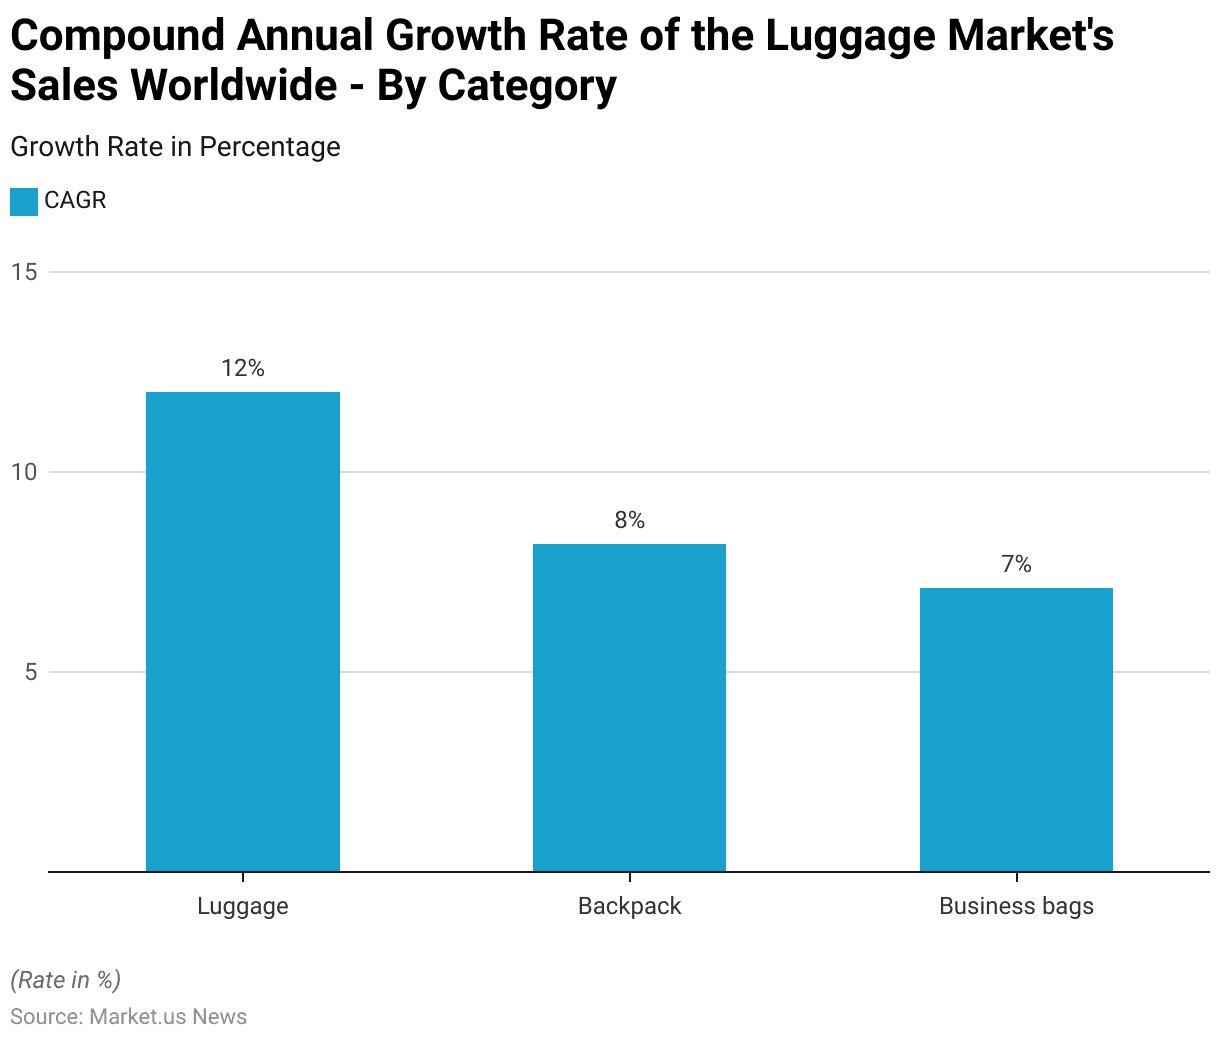
- Between 2022 and 2026, the global luggage market is projected to experience varied rates of growth across different product categories.
- The luggage category is anticipated to lead with a robust compound annual growth rate (CAGR) of 12%, reflecting a strong demand trend for traditional travel solutions.
- Backpacks are expected to grow at a CAGR of 8.20%, indicating a steady consumer preference for versatile and casual carry solutions.
- Business bags are forecasted to expand at a CAGR of 7.10%, which, while slightly lower, still highlights ongoing requirements for professional bag solutions in the market.
- This diverse growth pattern underscores the dynamic nature of the luggage market, catering to a range of consumer needs from travel to everyday functionality.
(Source: Statista)
Average Revenue Per Capita – By Type
2018-2022
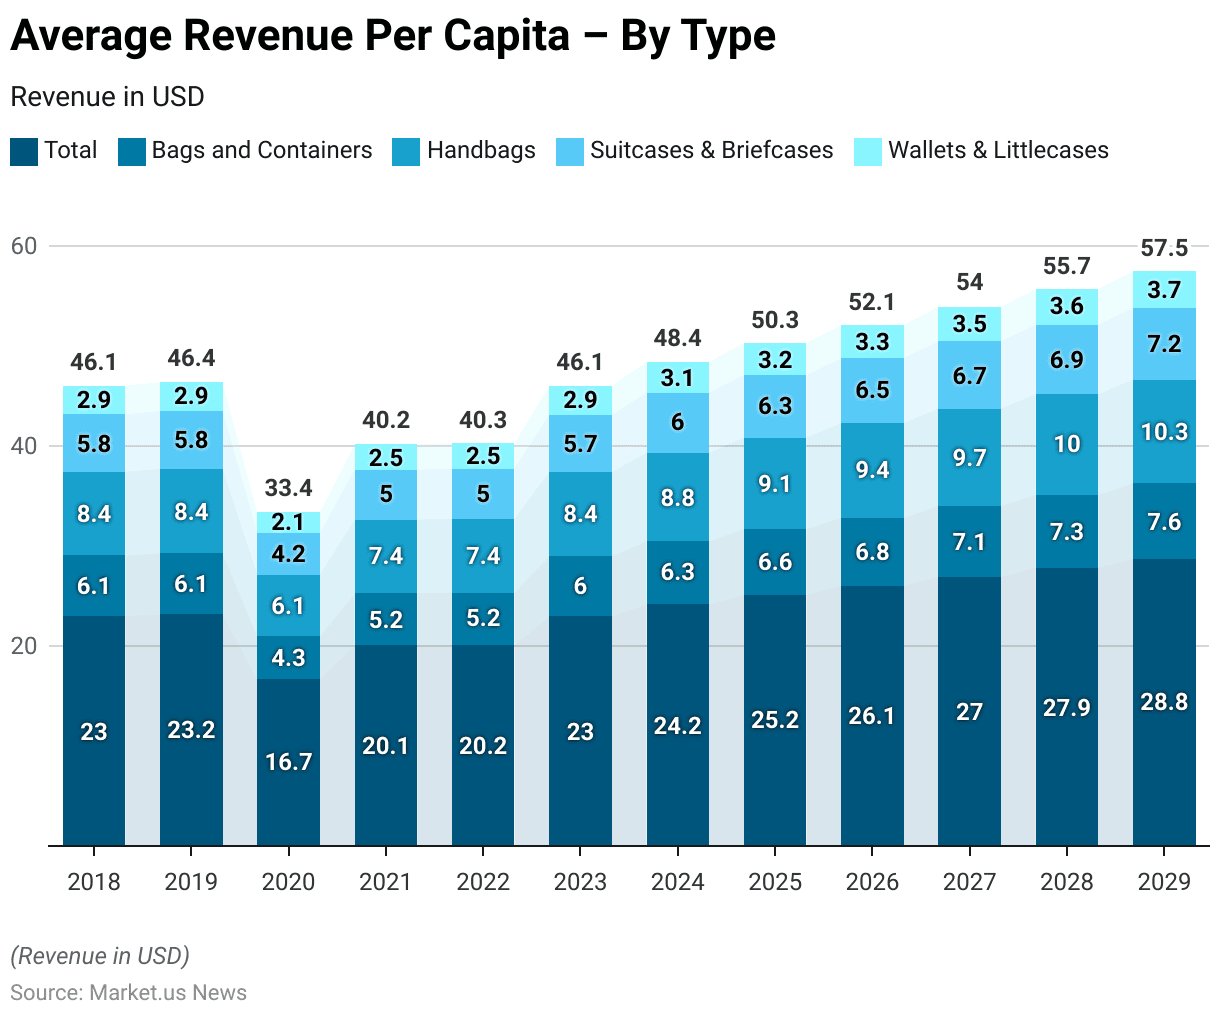
- The average revenue per capita in the global luggage and bags market, divided by product type from 2018 to 2022, showcases a trend of steady growth following a notable decline in 2020.
- In 2018, the total average revenue per capita was USD 23.04, with specific revenues for bags and containers at USD 6.06, handbags at USD 8.36, suitcases and briefcases at USD 5.76, and wallets and small cases at USD 2.86. This figure slightly increased in 2019 to a total of USD 23.21, reflecting minor growth across all categories.
- The year 2020 witnessed a significant downturn, with total revenue per capita dropping to USD 16.70, driven by declines across all segments: bags and containers decreased to USD 4.32, handbags to USD 6.14, suitcases and briefcases to USD 4.16, and wallets and small cases to USD 2.08.
- Recovery commenced in 2021, with total revenue per capita rising to USD 20.10 and continuing to grow modestly in 2022 to USD 20.15.
2023-2029
- From 2023 onwards, a robust recovery pattern emerged. In 2023, total revenue per capita increased to USD 23.03, and by 2024, it had further risen to USD 24.22.
- The growth trajectory continued upwards through the subsequent years, with 2025 seeing a total of USD 25.17, 2026 at USD 26.07, 2027 at USD 26.98, 2028 at USD 27.87, and reaching USD 28.76 by 2029.
- Notably, each category also experienced growth, with handbags and suitcases consistently showing higher per capita revenue compared to wallets and bags.
- By 2029, handbags reached a per capita revenue of USD 10.34, suitcases USD 7.17, wallets and small cases USD 3.70, and bags and containers USD 7.55, illustrating a sustained increase in consumer spending across these product types.
(Source: Statista)
Global Luggage & Bags Market Share – By Sales Channel Statistics
2017-2022
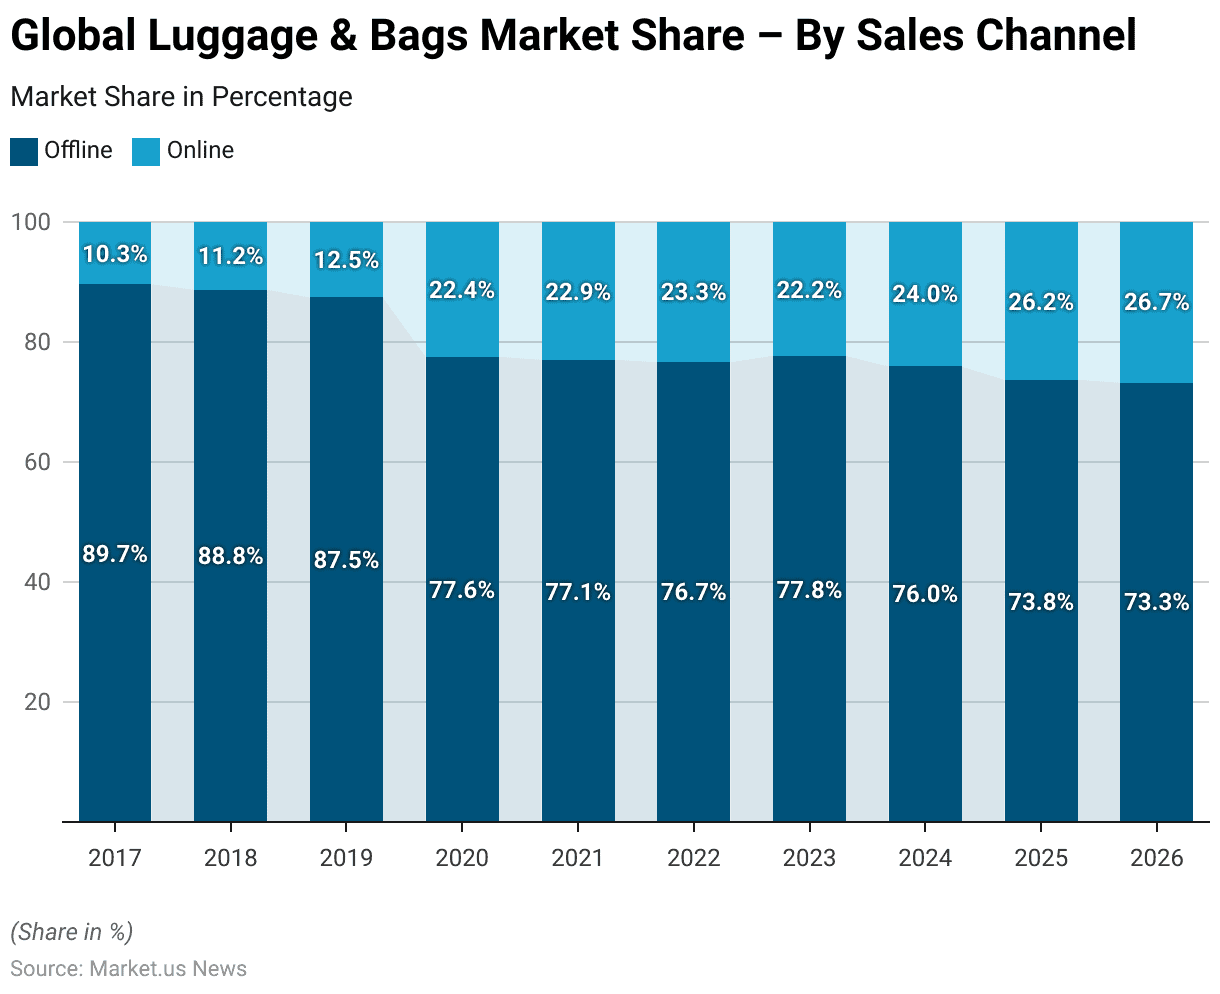
- The market share dynamics between offline and online sales channels in the global luggage and bags market from 2017 to 2022 highlight a significant shift toward digital commerce.
- In 2017, the offline market dominated with 89.7% of sales, compared to just 10.3% for online channels.
- This trend of offline dominance continued into 2018 and 2019, with offline sales comprising 88.8% and 87.5%, respectively, while online sales incrementally grew to 11.2% and 12.5%.
- A pivotal change occurred in 2020, where the offline market share dropped sharply to 77.6%, as online sales surged to 22.4%.
- This shift can be attributed to external factors likely influencing consumer behavior and retail logistics.
- The trend towards online shopping sustained growth into 2021 and 2022, with online market shares climbing to 22.9% and 23.3%, while offline shares adjusted to 77.1% and 76.7%, respectively.
2023-2029
- In 2023, there was a slight recovery in offline sales to 77.8%, with online sales dipping to 22.2%, suggesting a temporary stabilization.
- However, the shift towards online continued from 2024 onwards, with online sales reaching 24.0% that year and forecasted to grow to 26.2% by 2025 and 26.7% by 2026.
- Conversely, offline sales were projected to decline to 76.0% in 2024, further decreasing to 73.8% in 2025 and reaching 73.3% by 2026.
- This data illustrates a clear and ongoing transition from traditional brick-and-mortar shopping to more digital purchasing behaviors in the luggage and bags market, reflecting broader retail and consumer trends.
(Source: Statista)
Competitive Landscape of Global Luggage & Bags Market Statistics
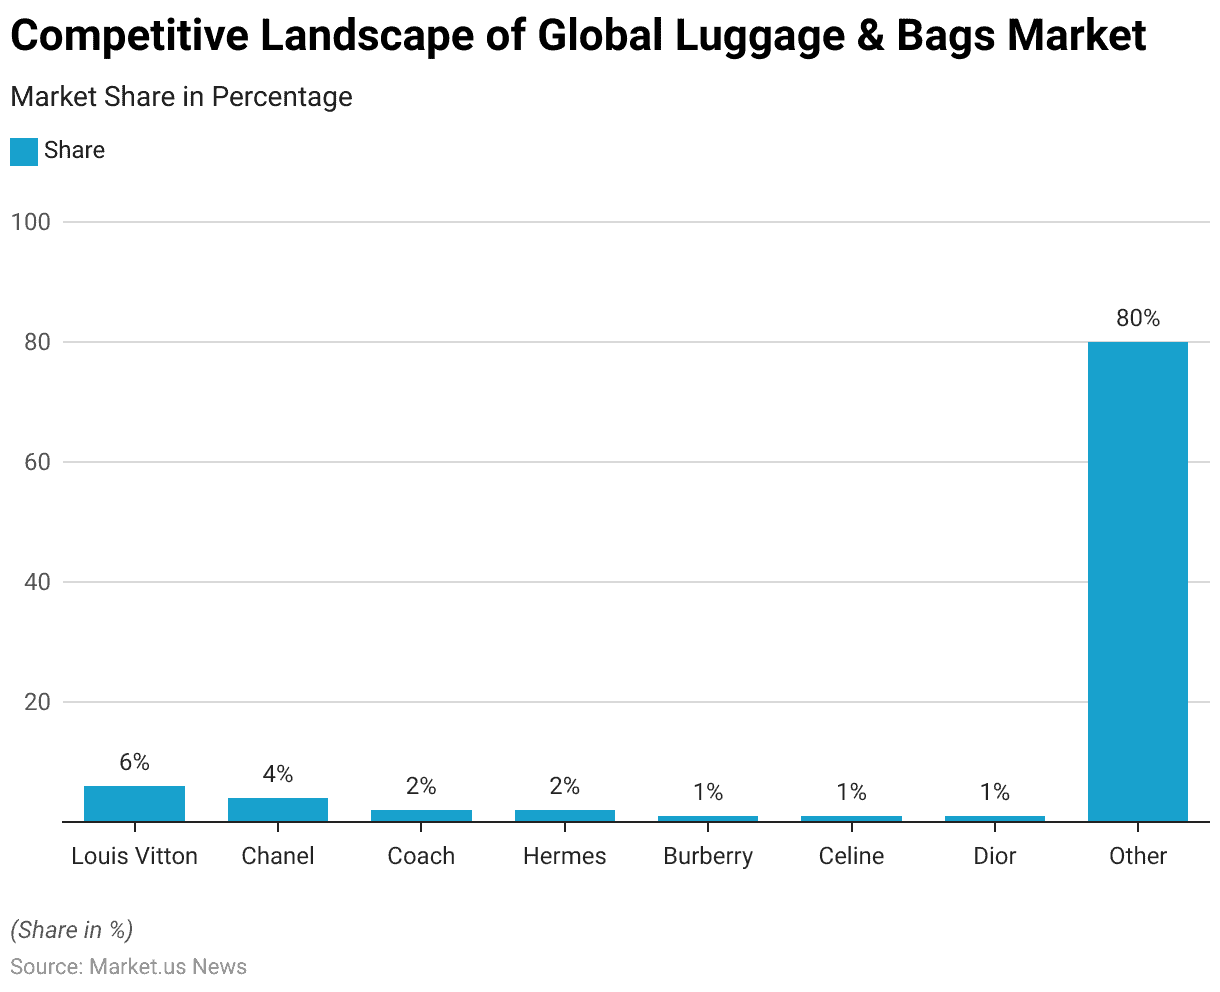
- In 2022, the competitive landscape of the global luggage and bags market was characterized by a significant presence of both major and numerous smaller companies.
- Louis Vuitton led with a market share of 6%, reflecting its strong brand recognition and premium positioning.
- Chanel followed with a 4% share, underscoring its luxury appeal and established market presence.
- Coach and Hermès each held a 2% share, highlighting their solid reputations in quality and craftsmanship.
- Other notable luxury brands such as Burberry, Celine, and Dior each captured 1% of the market, indicating a diverse preference among consumers for high-end luggage and bag options.
- However, the vast majority of the market, 80%, was occupied by a myriad of other companies, demonstrating a highly fragmented market where smaller brands and new entrants have a substantial collective impact.
- This diverse market structure suggests a competitive industry with abundant choices for consumers, ranging from luxury to budget-friendly options, catering to a broad spectrum of preferences and needs.
(Source: Statista)
Luggage & Bags Market Revenue – By Country Statistics
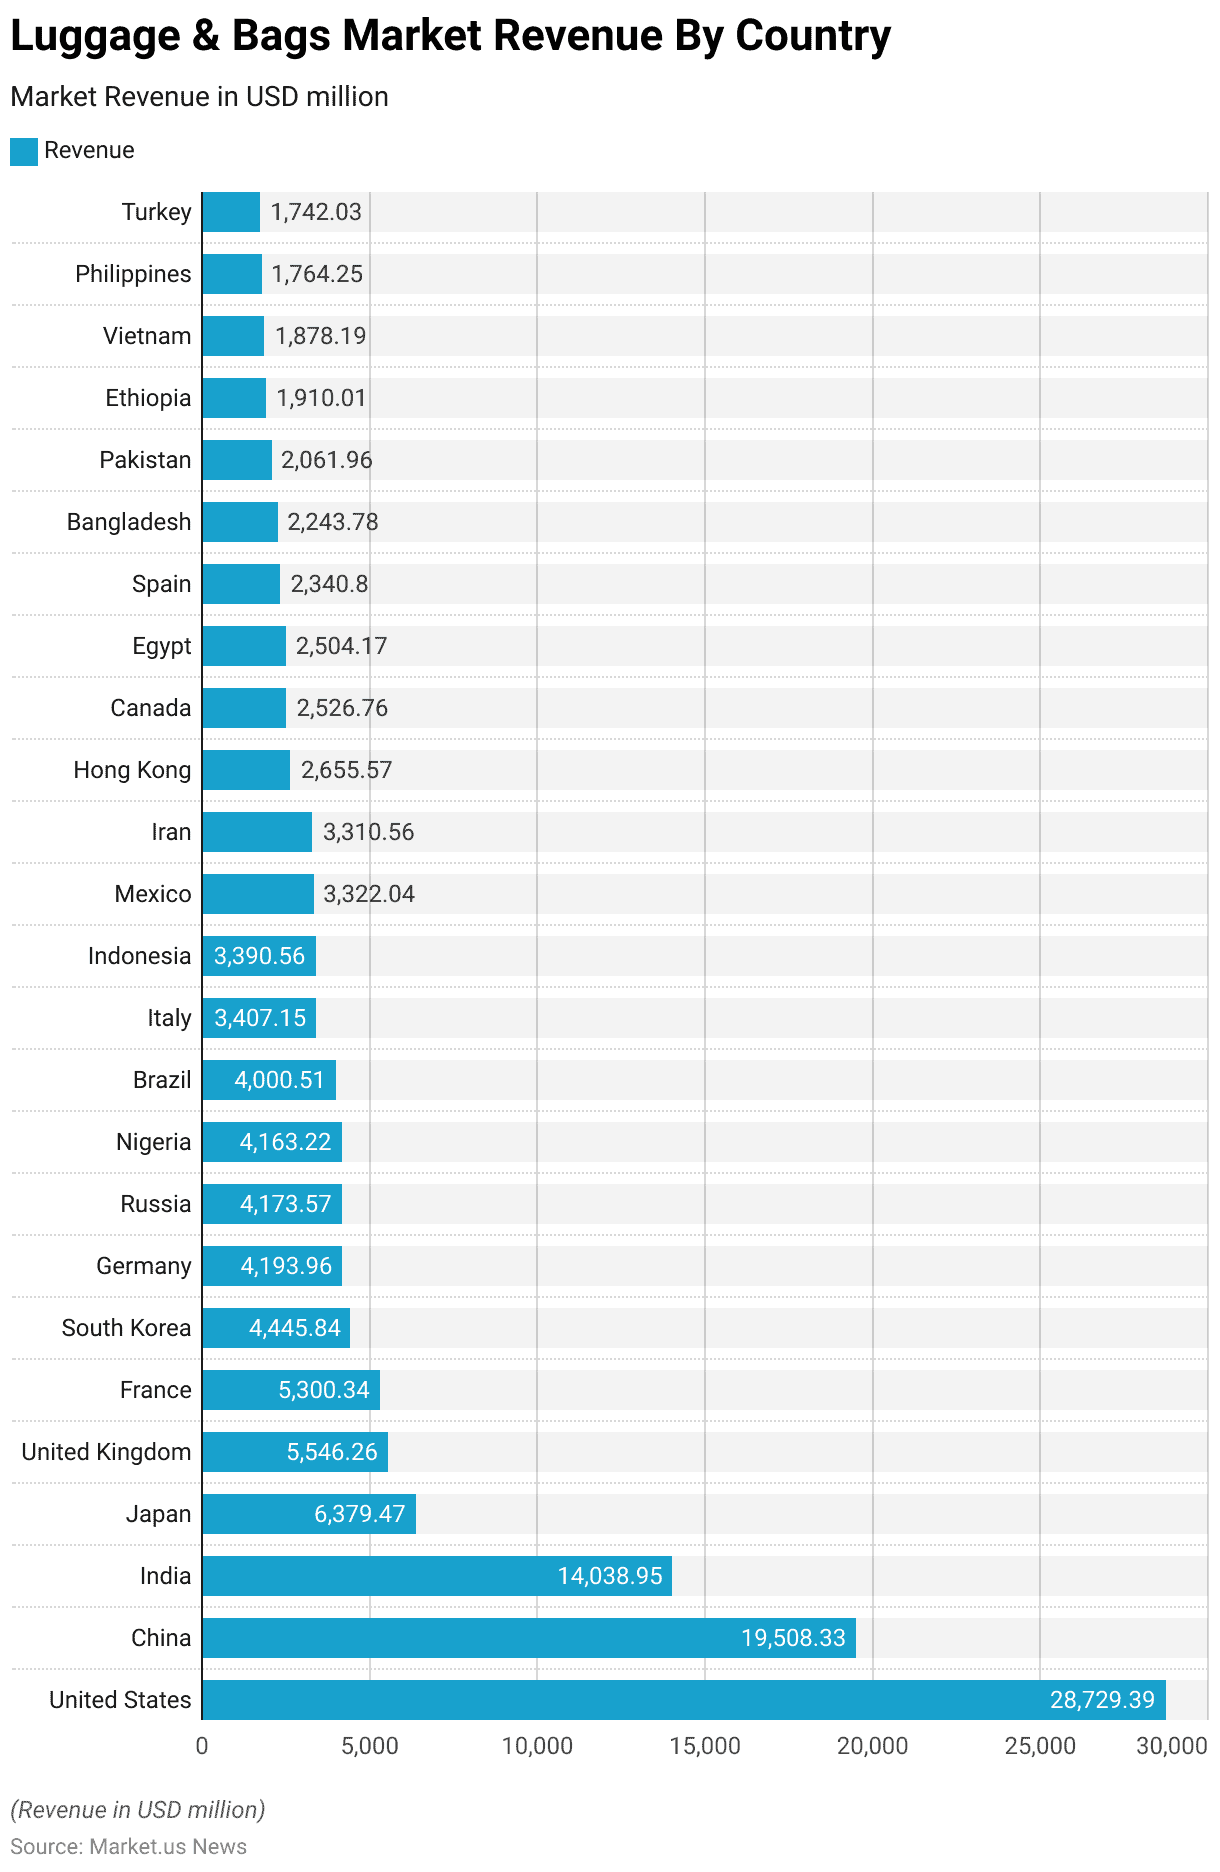
- In 2023, the revenue generated from the global luggage and bags market exhibited significant disparities across various countries.
- The United States led the market with a substantial revenue figure of USD 28,729.39 million, closely followed by China, which accounted for USD 19,508.33 million.
- India also held a prominent position, with its market size reaching USD 14,038.95 million, indicating a strong demand in the region.
- Japan and the United Kingdom also reported notable revenue figures, totaling USD 6,379.47 million and USD 5,546.26 million, respectively. France and South Korea’s markets were similarly robust, with revenues of USD 5,300.34 million and USD 4,445.84 million, respectively.
- Germany, Russia, and Nigeria each contributed significantly to the market, with revenues close to or exceeding USD 4,000 million.
- Additional noteworthy contributions came from Brazil, Italy, Indonesia, and Mexico, each generating revenues ranging from USD 3,000 million to just above USD 4,000 million.
- Other countries such as Iran, Hong Kong, Canada, Egypt, and Spain also demonstrated solid market presences, each accumulating revenues between USD 2,000 million and USD 3,500 million.
- The market landscape continued with contributions from Bangladesh, Pakistan, Ethiopia, Vietnam, the Philippines, and Turkey, each reporting revenues below USD 2,500 million but still reflecting meaningful participation in the global market.
- This distribution underscores the diverse and widespread consumer engagement with luggage and bags across different economic landscapes globally.
(Source: Statista)
Sales Value of the Global Luggage Market Statistics
Retail Sales Value of the Global Luggage Market – By Segment Statistics
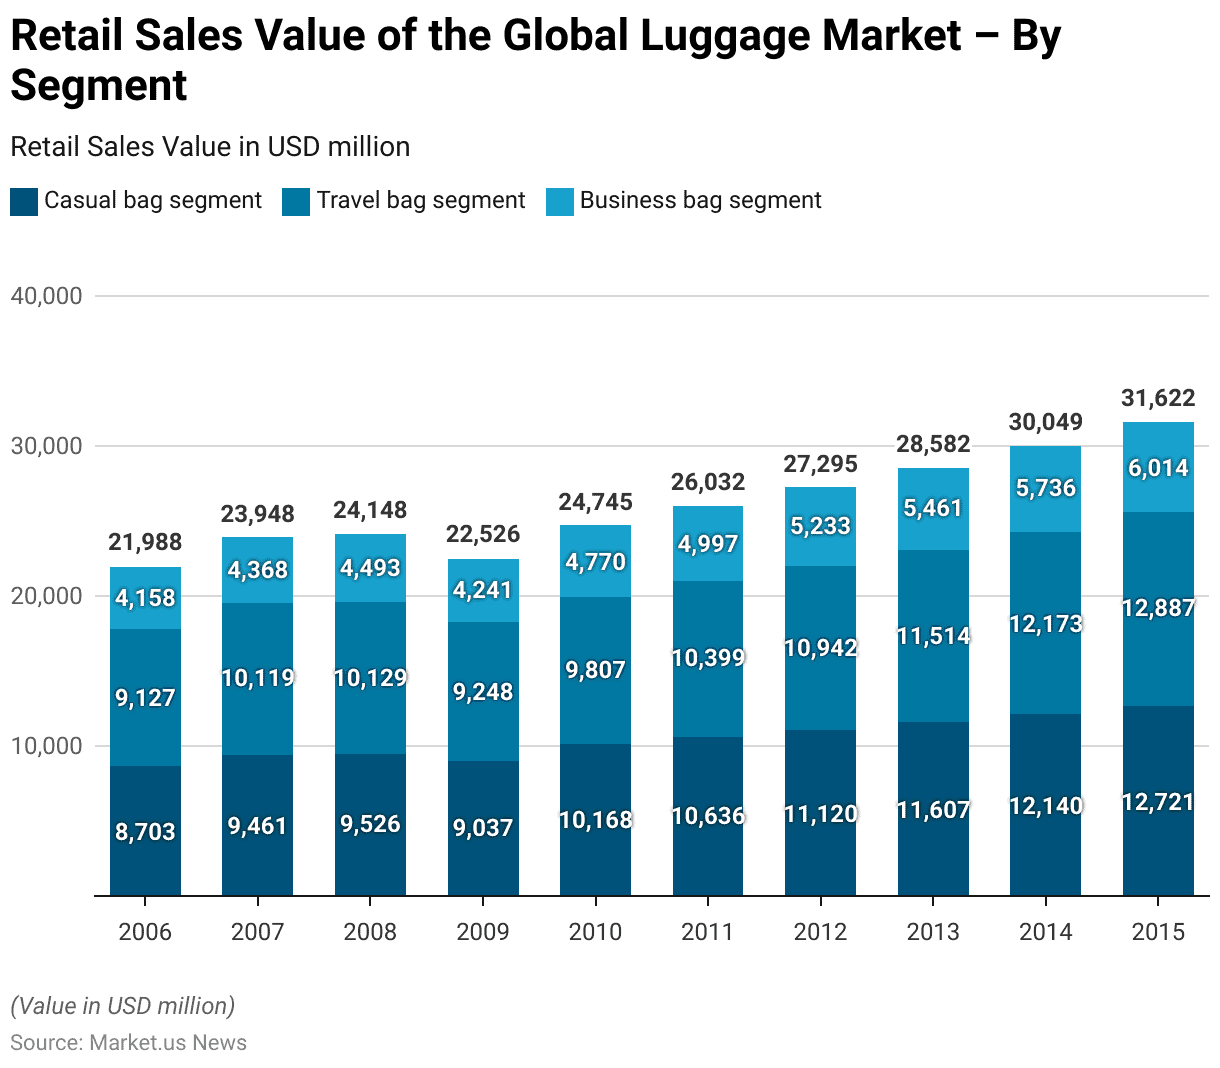
- From 2006 to 2015, the retail sales value of the global luggage market experienced notable growth across three primary segments: casual bags, travel bags, and business bags.
- In 2006, sales values were recorded at $8,703 million for casual bags, $9,127 million for travel bags, and $4,158 million for business bags. Over the years, each segment showed consistent growth.
- By 2007, the sales for casual bags rose to $9,461 million, travel bags to $10,119 million, and business bags to $4,368 million.
- This growth trend persisted through 2008 and slightly dipped in 2009 during the global economic slowdown, where casual bags decreased to $9,037 million, travel bags to $9,248 million, and business bags to $4,241 million.
- However, the market rebounded in 2010, with casual bags increasing to $10,168 million, though travel bags slightly decreased to $9,807 million, and business bags rose to $4,770 million.
- From 2011 onwards, a steady increase was observed across all segments. By 2015, the casual bag segment reached a sales value of $12,721 million, travel bags peaked at $12,887 million, and business bags at $6,014 million.
- This decade-long growth trajectory illustrates a robust demand and expanding market for various types of luggage, reflecting changing consumer preferences and increasing travel and professional activities globally.
(Source: Statista)
Sales Value of the Global Luggage Market- By Region Statistics
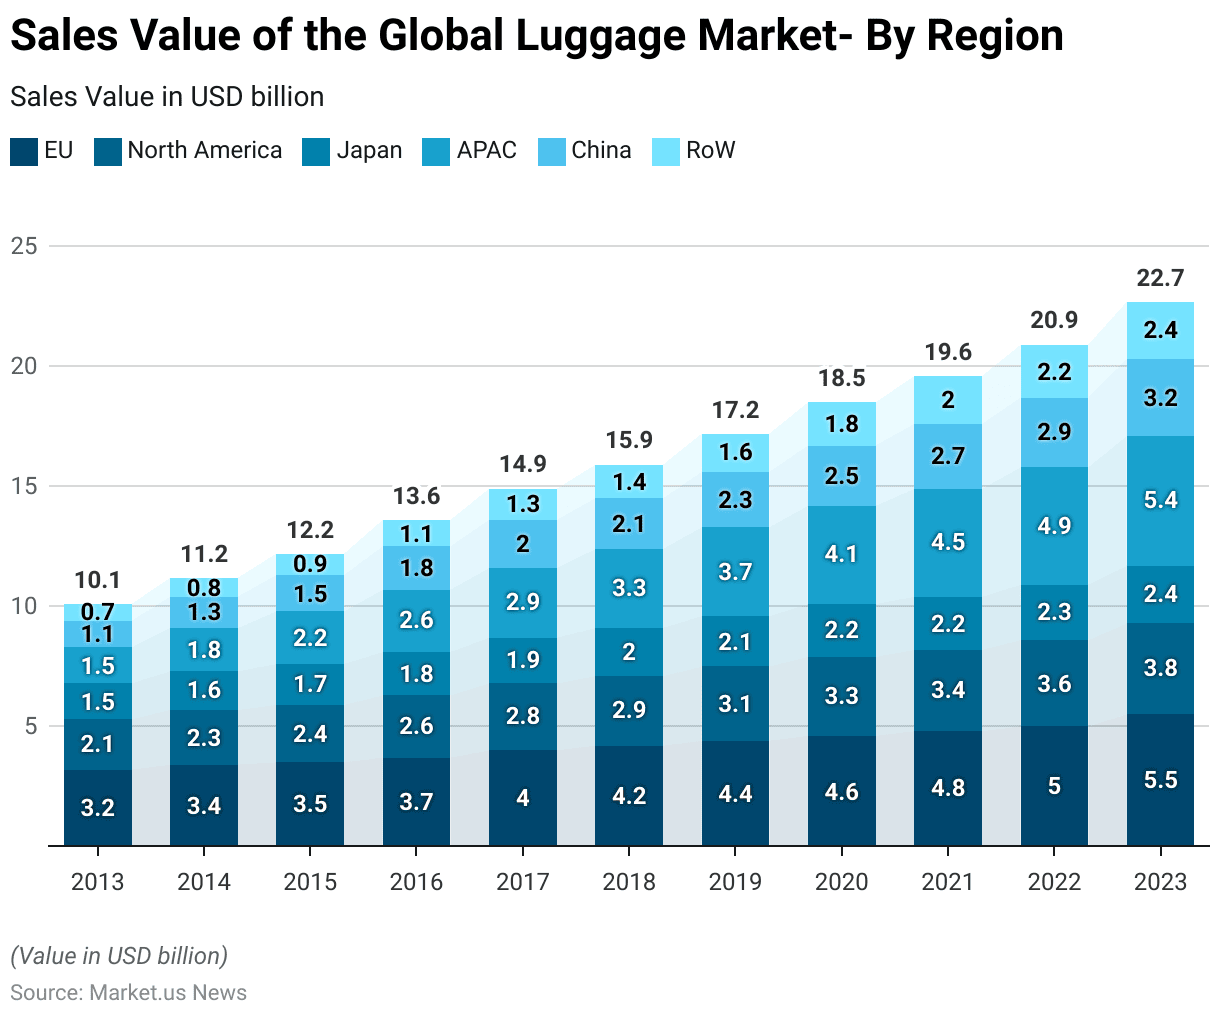
- The sales value of the global luggage market from 2013 to 2023 showcases significant growth across various regions.
- Initially, in 2013, the European Union (EU) recorded sales of USD 3.2 billion, with North America at USD 2.1 billion and Japan at USD 1.5 billion. The Asia-Pacific region (excluding China), China, and the Rest of the World (RoW) posted values of USD 1.5 billion, USD 1.1 billion, and USD 0.7 billion, respectively.
- Over the years, each region displayed consistent growth. By 2018, the EU’s market had expanded to USD 4.2 billion, North America to USD 2.9 billion, and Japan to USD 2.0 billion.
- The APAC region showed particularly strong growth, reaching USD 3.3 billion, while China’s market grew to USD 2.1 billion, and RoW increased to USD 1.4 billion.
- This upward trend continued into 2023, with the EU reaching USD 5.5 billion in sales. North America reported USD 3.8 billion, and Japan’s market expanded to USD 2.4 billion.
- APAC saw a significant rise to USD 5.4 billion, reflecting its increasing market share. Similarly, China’s market reached USD 3.2 billion, and RoW saw its highest yet at USD 2.4 billion.
- This decade-long trend highlights a robust expansion in the global luggage market, driven by increasing travel and consumer expenditure in both established and emerging regions.
(Source: Statista)
Anti-Theft Luggage Market Statistics
Anti-Theft Luggage Market Value Statistics
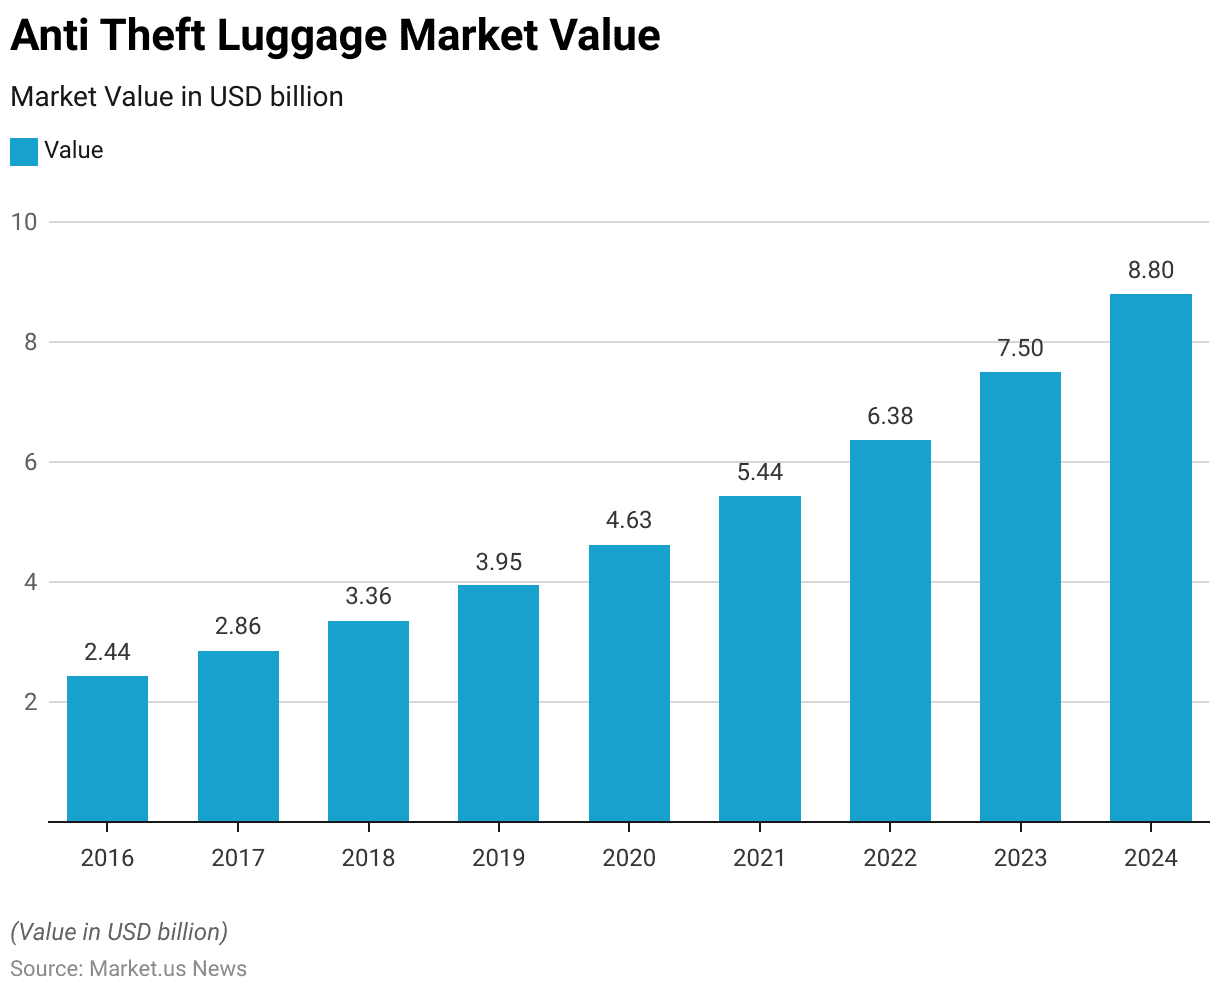
- The market value of anti-theft luggage has shown a consistent upward trend from 2016 to 2024, highlighting growing consumer interest in securing their belongings while traveling.
- Starting in 2016, the market was valued at USD 2.44 billion and saw a gradual increase to USD 2.86 billion in 2017.
- This upward trajectory continued with the market reaching USD 3.36 billion in 2018, and further growth was evident as the value rose to USD 3.95 billion in 2019.
- The growth in the market became more pronounced from 2020 onwards when the market value jumped to USD 4.63 billion and accelerated further to USD 5.44 billion in 2021.
- The following year, 2022, saw a significant increase to USD 6.38 billion, suggesting a strong consumer demand for luggage that offers enhanced security features.
- Forecasts for 2023 and 2024 predict continued growth in this niche market segment, with projected values reaching USD 7.5 billion and USD 8.8 billion, respectively.
- This steady increase underscores the importance placed by consumers on the safety and security of their travel gear, driven by heightened awareness of security issues and innovations in luggage technology.
(Source: Statista)
Luggage Suitcases & Briefcases Industry Statistics
Global Suitcases & Briefcases Market Size
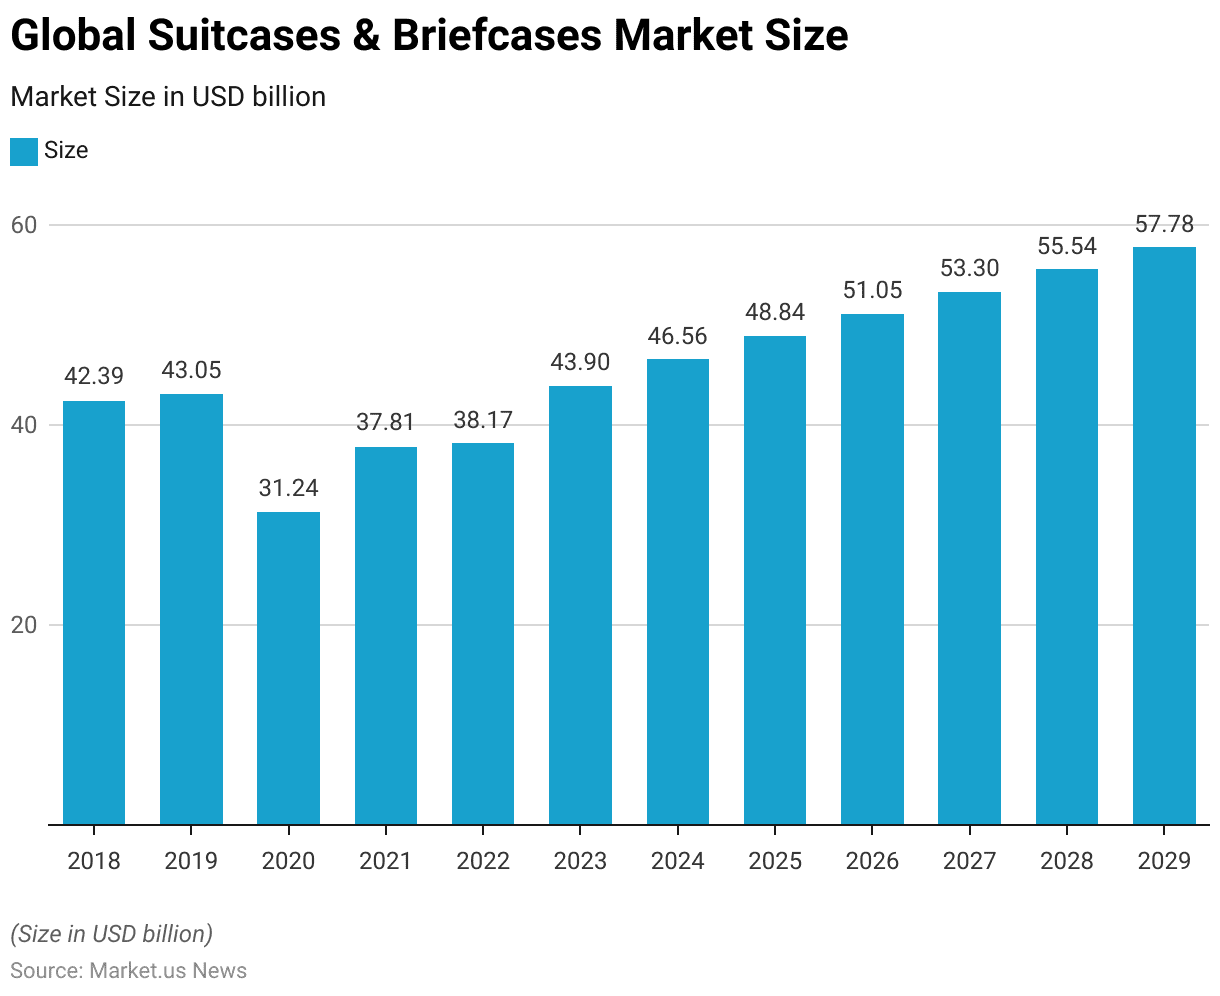
- The global suitcases and briefcases market has demonstrated varied growth from 2018 to 2029.
- In 2018, the market size was valued at USD 42.39 billion, showing a modest increase to USD 43.05 billion in 2019.
- However, a significant downturn was observed in 2020, when the market size decreased sharply to USD 31.24 billion, likely influenced by global economic factors and changes in travel behavior.
- A gradual recovery ensued in 2021, with the market size rising to USD 37.81 billion, followed by a slight increase to USD 38.17 billion in 2022.
- The market continued to rebound, reaching USD 43.90 billion in 2023. The growth trajectory became more pronounced in subsequent years, with market sizes of USD 46.56 billion in 2024, USD 48.84 billion in 2025, and crossing the USD 50 billion mark to USD 51.05 billion in 2026.
- The upward trend sustained momentum, leading to market sizes of USD 53.30 billion in 2027, USD 55.54 billion in 2028, and concluding the period at USD 57.78 billion in 2029.
- This indicates a resilient recovery and a positive growth trend for the global suitcases and briefcases market over the forecast period, reflecting increasing consumer confidence and renewed interest in travel-related products.
(Source: Statista)
Global Luggage Suitcases & Briefcases Market Share – By Sales Channel Statistics
2017-2020
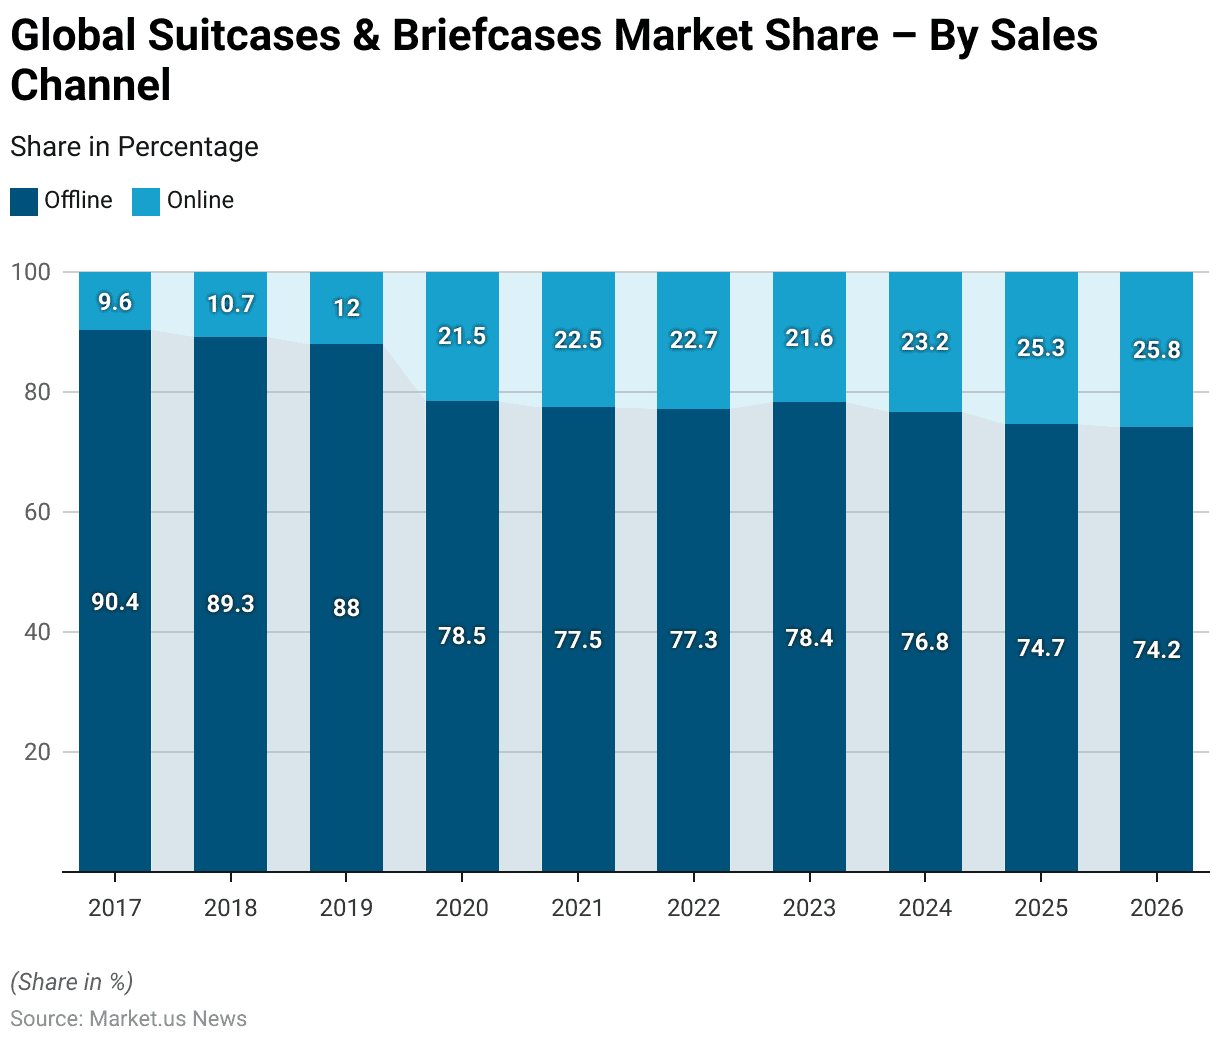
- The distribution of market shares between offline and online sales channels in the global suitcases and briefcases market from 2017 to 2020 shows a clear and steady trend toward online purchasing.
- In 2017, offline sales dominated the market with a substantial 90.4% share, contrasting sharply with only 9.6% for online sales.
- Over the next two years, a gradual shift was apparent, with offline market share decreasing to 89.3% in 2018 and further to 88.0% in 2019, while online sales grew to 10.7% and 12.0%, respectively.
- The shift accelerated significantly in 2020, likely influenced by global events that drove consumer behavior towards digital platforms; offline shares plummeted to 78.5%, whereas online shares surged to 21.5%.
2021-2026
- This trend stabilized somewhat in the following years, with offline sales hovering around 77.5% in 2021 and 77.3% in 2022, while online sales remained above 22%.
- By 2023, offline sales experienced a slight rebound to 78.4%, but this was temporary as the share declined again to 76.8% in 2024, with online continuing to climb to 23.2%.
- This trajectory suggests a progressive normalization of online shopping habits in the suitcases and briefcases sector. By 2025 and 2026, online market shares expanded further to 25.3% and 25.8%, respectively, while offline shares dropped to 74.7% and 74.2%.
- This trend underscores a significant transformation in consumer purchasing preferences, increasingly favoring online channels for luggage and briefcase shopping.
(Source: Statista)
Competitive Landscape of Global Luggage Suitcases & Briefcases Market Statistics
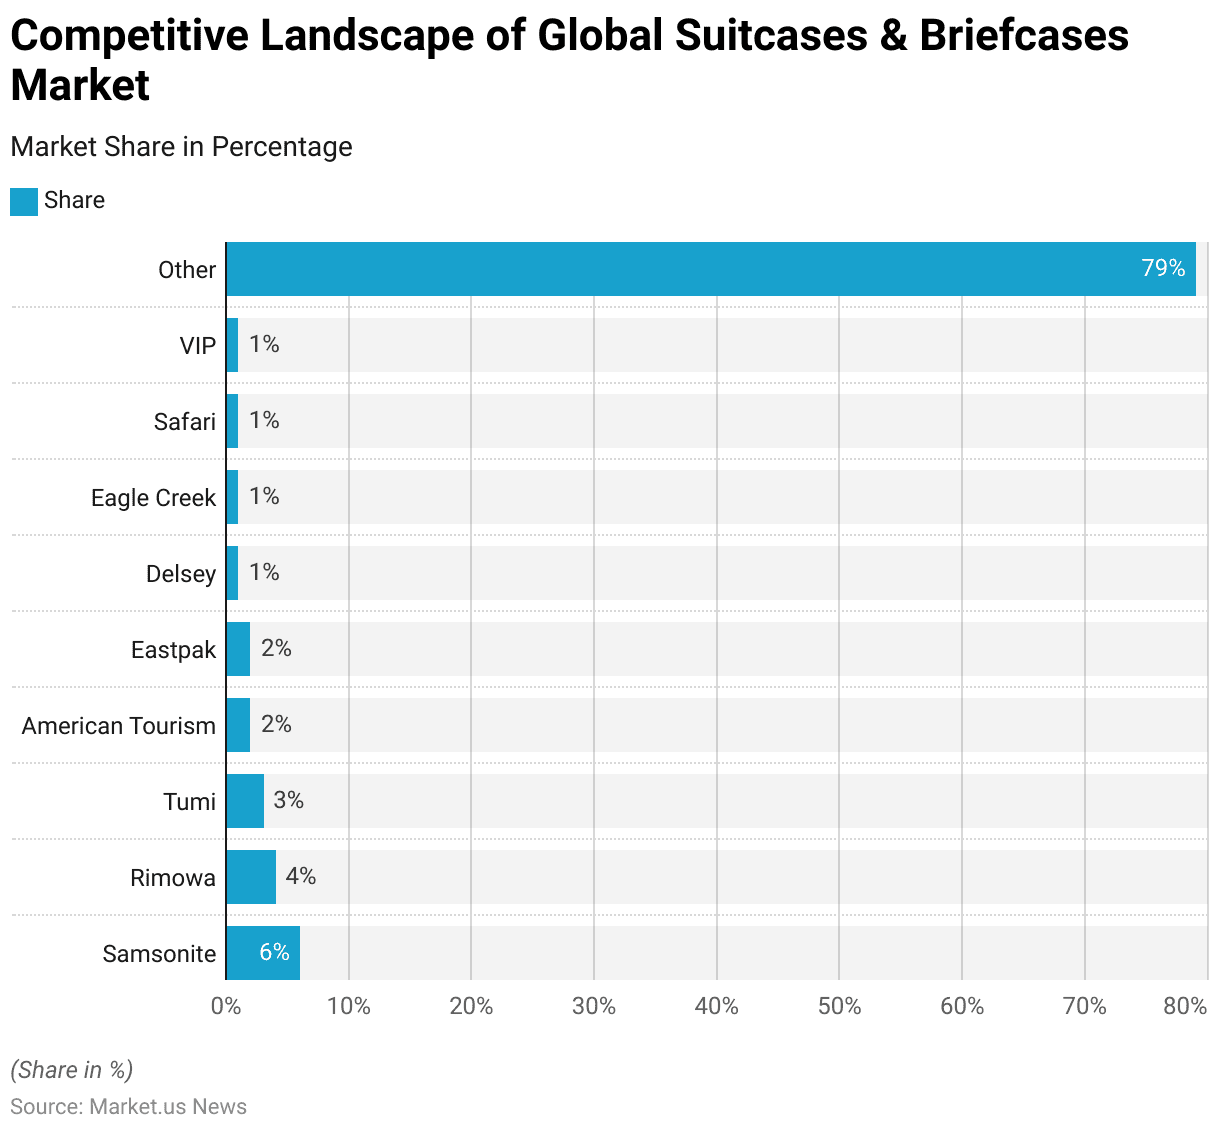
- In 2022, the global suitcases and briefcases market featured a competitive landscape dominated by several key players alongside a large segment of smaller companies.
- Samsonite led the market with a 6% share, underscoring its prominent position as a major player in the luggage industry.
- Rimowa followed with a 4% market share and is known for its high-quality aluminum and polycarbonate suitcases.
- Tumi held a 3% share, appealing to luxury and business travelers with its premium products.
- American Tourister and Eastpak each captured 2% of the market, targeting budget-conscious and younger demographics, respectively.
- Delsey, Eagle Creek, Safari, and VIP each held 1% of the market, indicating their niche but stable positions within the industry.
- However, the majority of the market, comprising 79%, was occupied by a diverse array of other manufacturers, which suggests a highly fragmented market where no single company holds overwhelming dominance.
- This scenario reflects the competitive nature of the luggage market, where a variety of brands compete on features such as durability, design, and price to attract different consumer segments.
(Source: Statista)
Suitcases & Briefcases Market Revenue – By Country
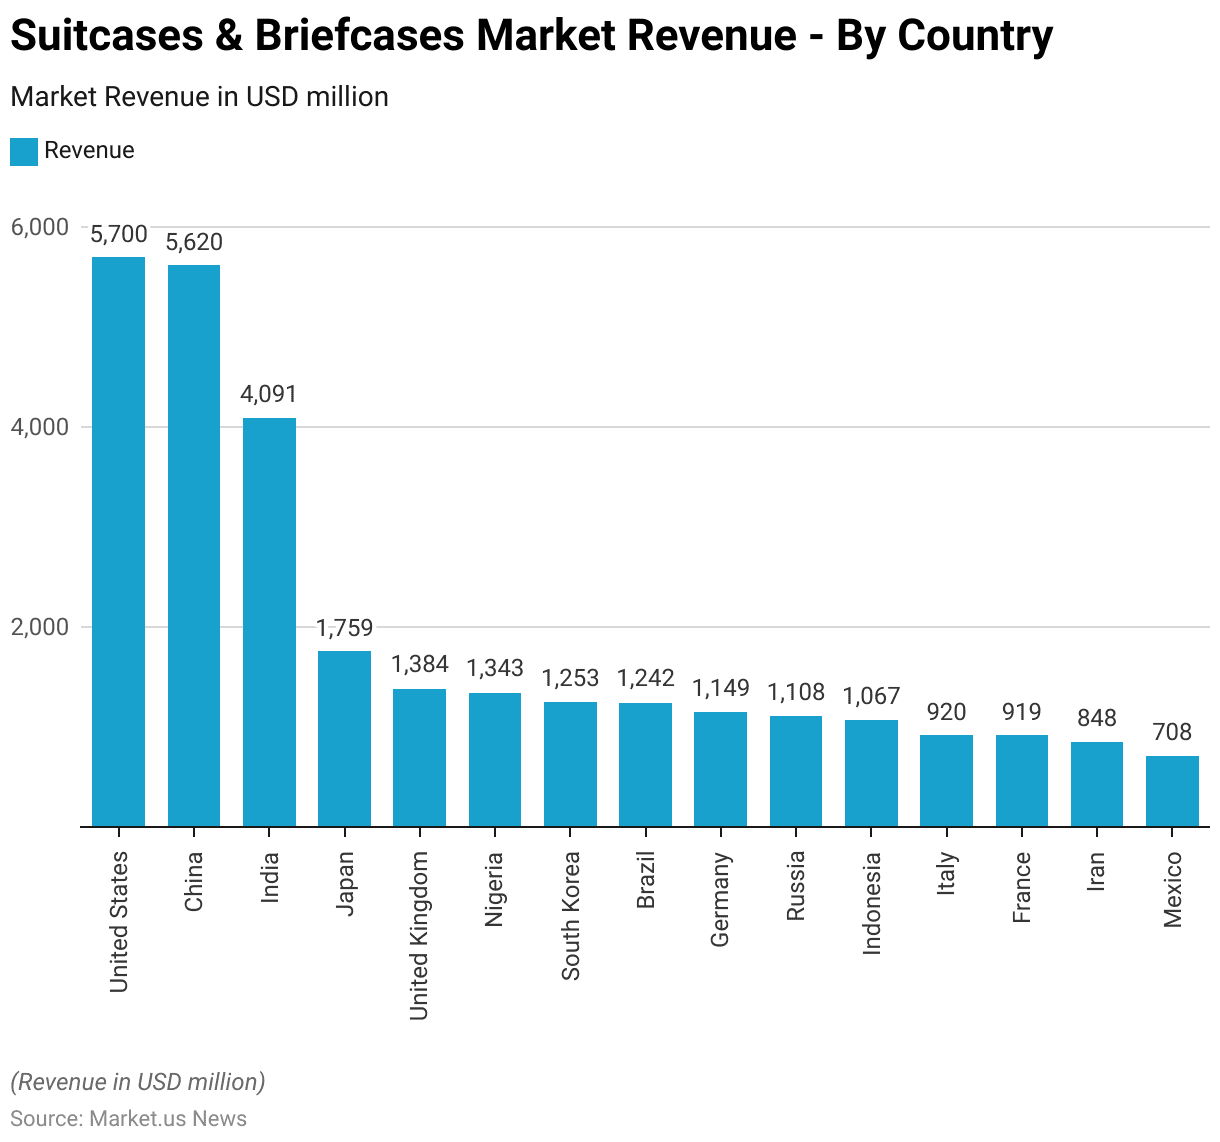
- In 2024, the revenue from the suitcases and briefcases market displayed significant geographical diversity.
- The United States led with a substantial market revenue of USD 5,700 million, closely followed by China with USD 5,620 million.
- India also showed strong market performance, with revenue reaching USD 4,091 million.
- Japan and the United Kingdom contributed noticeably as well, with revenues of USD 1,759 million and USD 1,384 million, respectively.
- Other notable contributors included Nigeria, which had USD 1,343 million; South Korea, which had USD 1,253 million; and Brazil, which was closely behind at USD 1,242 million.
- Germany and Russia also held substantial shares in the market, generating revenues of USD 1,149 million and USD 1,108 million, respectively.
- Markets in Indonesia, Italy, France, Iran, and Mexico also demonstrated significant activity, with revenues recorded at USD 1,067 million, USD 920 million, USD 919 million, USD 848 million, and USD 708 million, respectively.
- This distribution highlights the global spread of the market for suitcases and briefcases, reflecting varied consumer demand and economic conditions across different regions.
(Source: Statista)
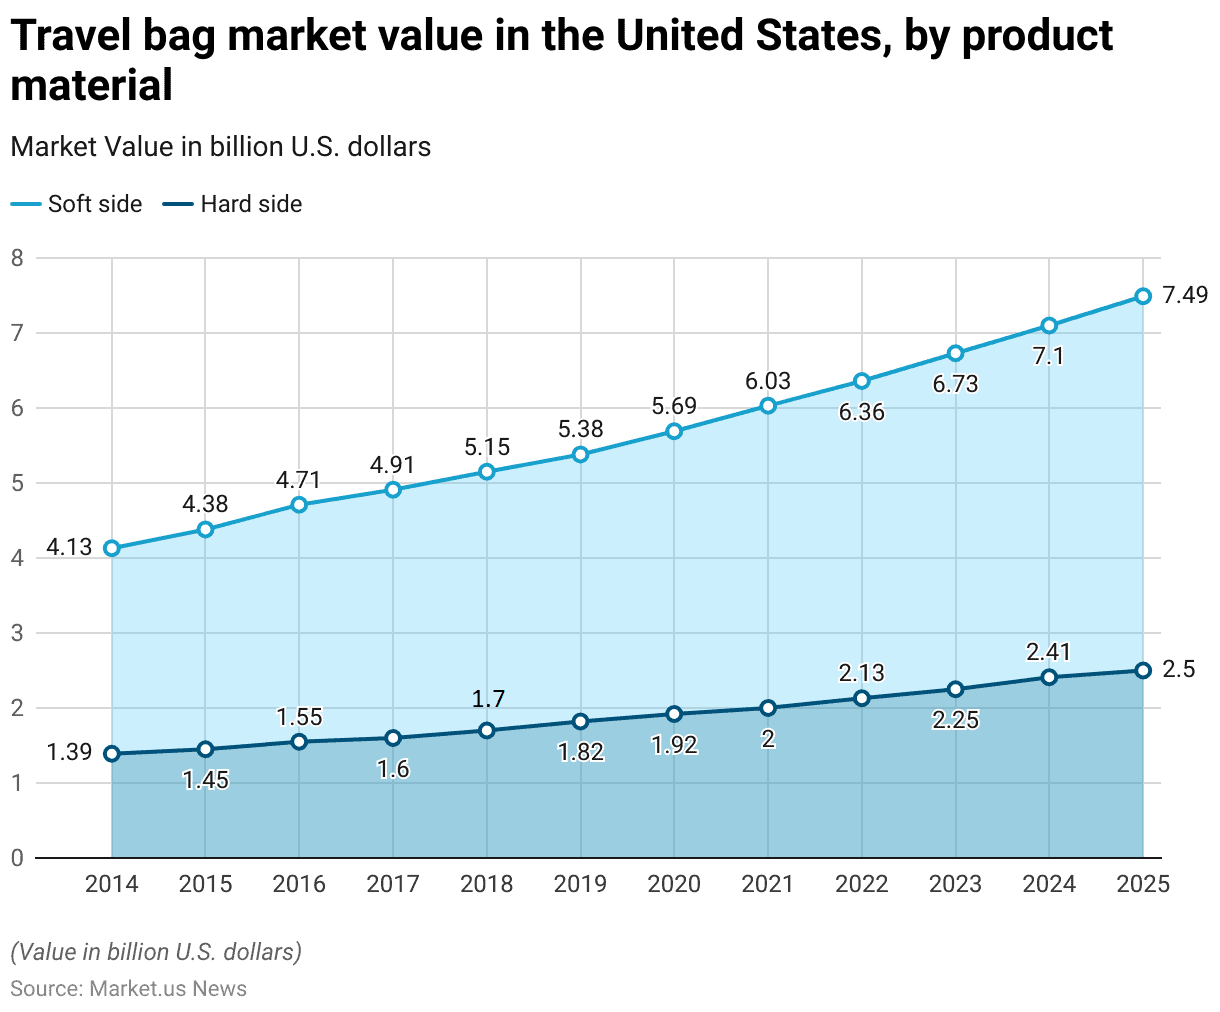
Travel Bag Materials Statistics
- From 2014 to 2025, the travel bag market in the United States demonstrated steady growth in both soft-side and hard-side product categories.
- In 2014, the market value for soft-side travel bags started at USD 4.13 billion and exhibited a consistent increase annually, reaching USD 7.49 billion by 2025.
- Similarly, the hard-side segment began at USD 1.39 billion in 2014 and also saw a gradual rise each year, culminating at USD 2.5 billion in 2025.
- The soft side segment maintained a dominant position over the hard side throughout this period, reflecting a persistent consumer preference for this type of luggage.
- Notable yearly increments were evident, with the soft side travel bags growing from USD 4.38 billion in 2015 to USD 6.03 billion in 2021 and then to USD 7.49 billion in 2025.
- Concurrently, the hard side bags, although growing at a slightly slower pace, showed significant growth from USD 1.45 billion in 2015 to USD 2 billion in 2021, eventually reaching USD 2.5 billion in 2025.
- This trend indicates a robust expansion in the travel bag market, with both types of materials finding strong footholds in consumer preferences, likely driven by evolving travel habits, innovation in luggage technology, and increasing demand for durable and versatile travel solutions.
(Source: Statista)
Global Sales of Luggage Companies Statistics
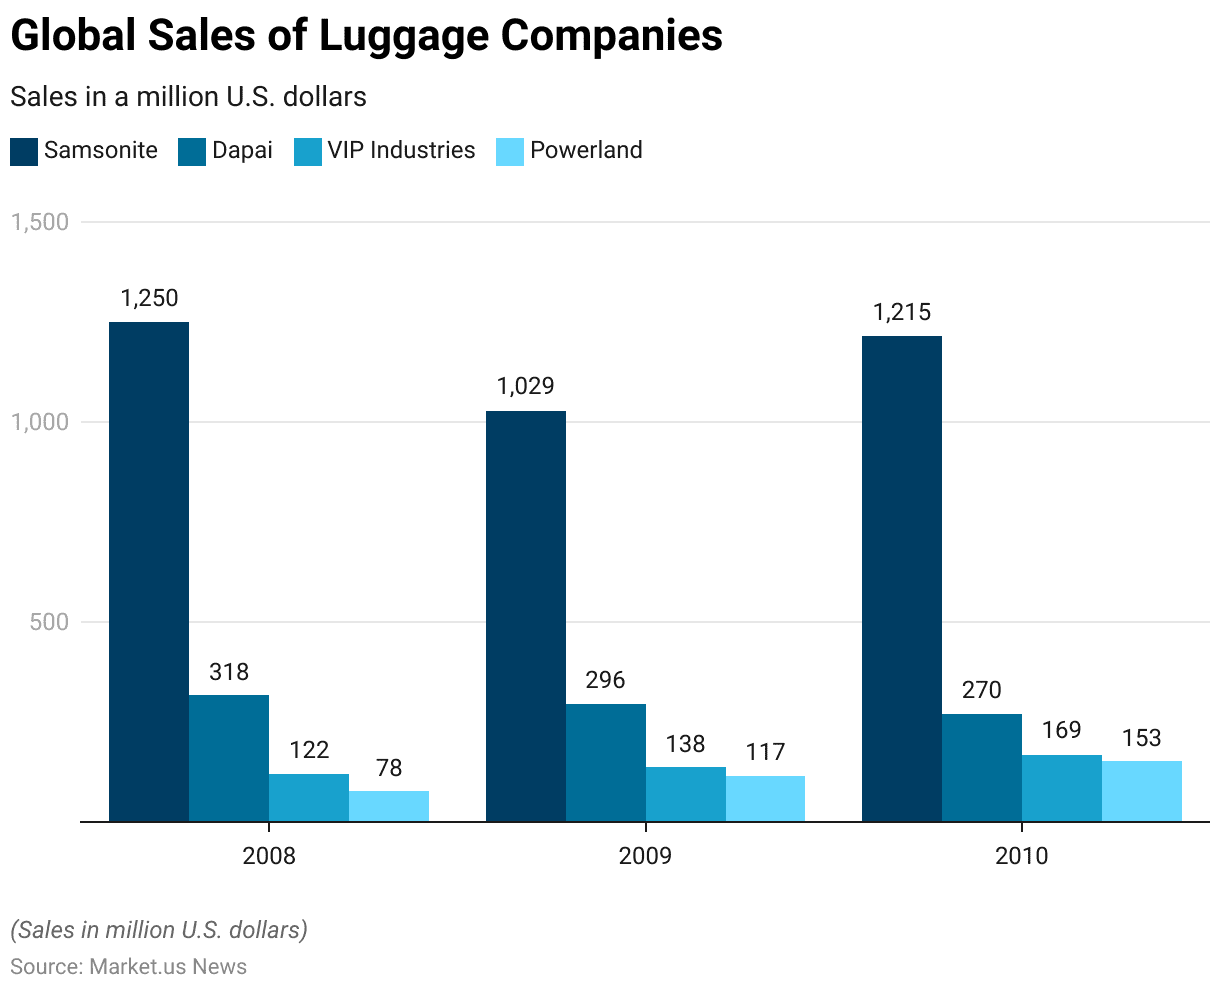
- Between 2008 and 2010, the global sales figures for selected luggage companies revealed varied performance across the industry.
- Samsonite, a leading brand, reported sales of USD 1,250 million in 2008, which declined to USD 1,029 million in 2009 during the economic downturn before rebounding to USD 1,215 million in 2010.
- Dapai experienced a decrease in sales over the same period, starting at USD 318 million in 2008, dropping to USD 296 million in 2009, and further to USD 270 million in 2010.
- VIP Industries, on the other hand, showed a contrasting trend, with sales increasing each year from USD 122 million in 2008 to USD 138 million in 2009 and reaching USD 169 million in 2010.
- Similarly, Powerland also displayed significant growth, starting from USD 78 million in 2008, increasing to USD 117 million in 2009, and further climbing to USD 153 million in 2010.
- These figures illustrate the diverse trajectories within the luggage industry, reflecting how different companies responded to global market conditions and consumer demand during this period.
(Source: Statista)
Export of Luggage Products Statistics
Export Value of Travel Goods and Handbags Worldwide
2003-2013
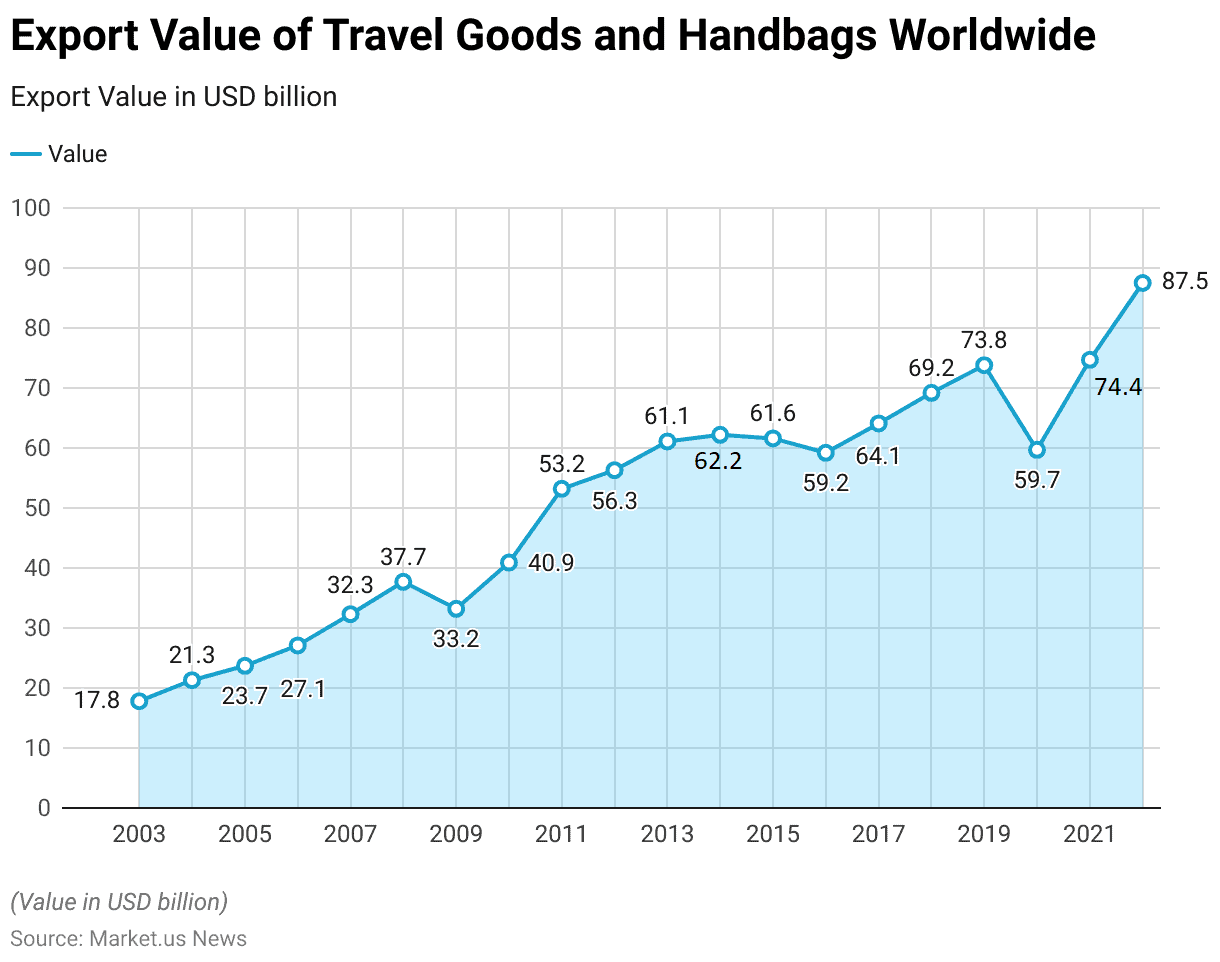
- From 2003 to 2022, the global export value of travel goods and handbags exhibited significant growth, reflecting broader trends in global commerce and consumer spending.
- Starting in 2003, the export value was at USD 17.8 billion and showed a steady upward trajectory over the years.
- By 2004, the value had increased to USD 21.3 billion, continuing to rise to USD 23.7 billion in 2005 and reaching USD 27.1 billion in 2006.
- The growth momentum persisted through 2007 and 2008, with values reaching USD 32.3 billion and USD 37.7 billion, respectively.
- The economic downturn in 2009 saw a temporary dip to USD 33.2 billion, but recovery was swift, climbing to USD 40.9 billion in 2010.
- The upward trend accelerated significantly in the following years, with export values hitting USD 53.2 billion in 2011, USD 56.3 billion in 2012, and peaking at USD 61.1 billion in 2013.
2014-2023
- The market stabilized somewhat from 2014 to 2015, fluctuating around USD 62.2 billion and USD 61.6 billion, respectively, before experiencing a slight decline to USD 59.2 billion in 2016.
- The period from 2017 onward showed renewed vigor, with export values rebounding to USD 64.1 billion in 2017, rising to USD 69.2 billion in 2018, and reaching USD 73.8 billion in 2019.
- The pandemic-induced economic disruptions in 2020 led to a decrease of USD 59.7 billion.
- However, a robust recovery in 2021 brought the value up to USD 74.7 billion, with a significant surge in 2022, when exports reached a remarkable USD 87.5 billion.
- This two-decade span highlights the dynamic nature of the global market for travel goods and handbags, driven by changing consumer habits, economic conditions, and an increasing preference for quality and luxury goods in global markets.
(Source: Statista)
Leading Exporting Countries of Travel Goods and Handbags Worldwide
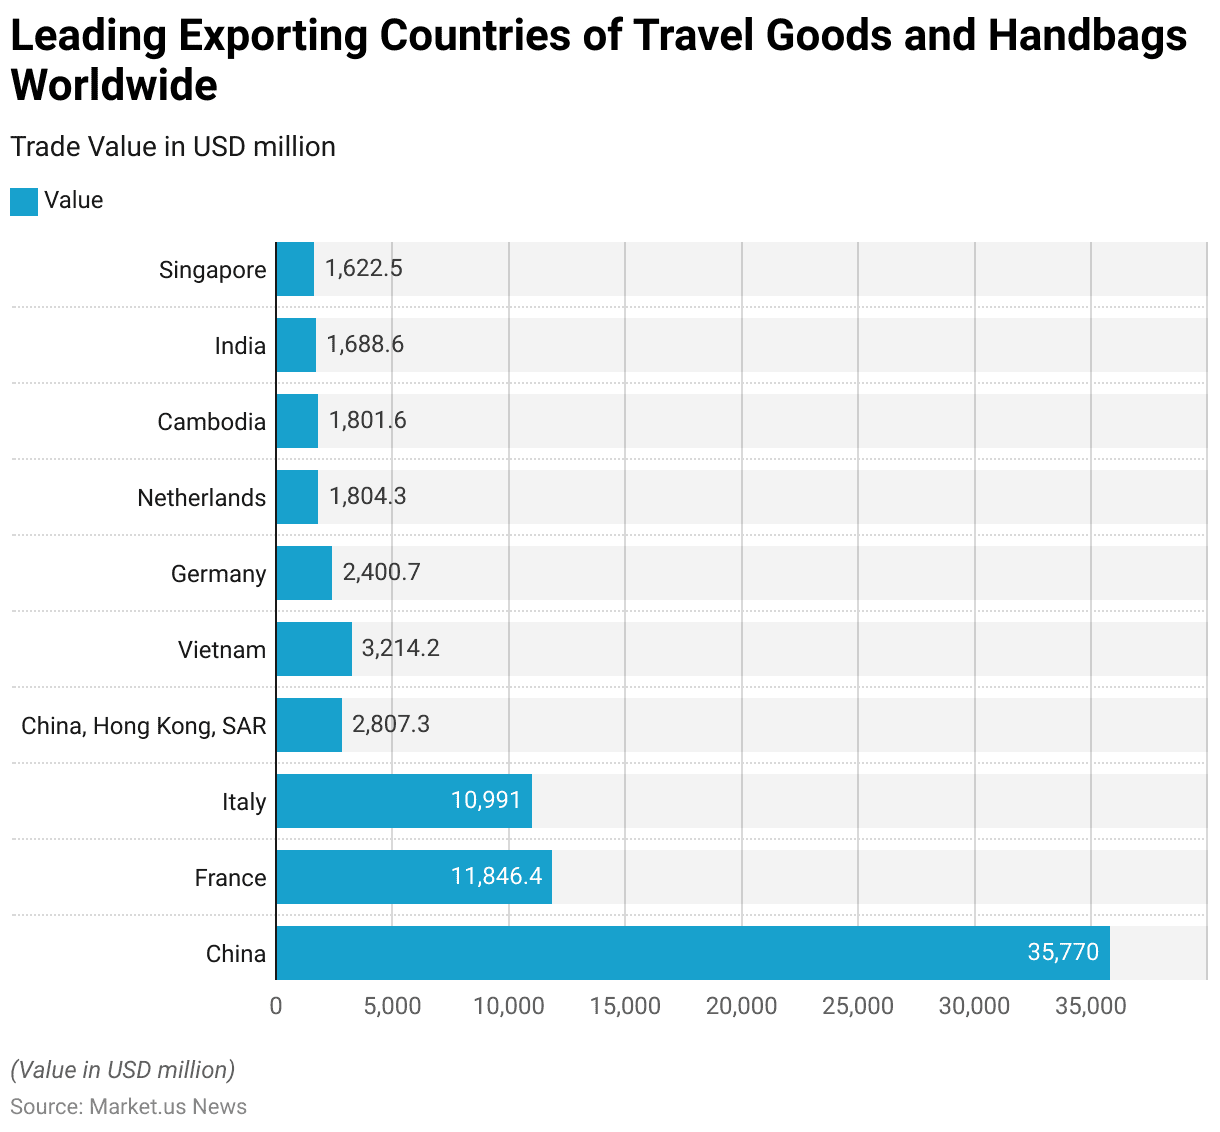
- In 2022, China led the global market in exporting travel goods and handbags, achieving a trade value of USD 35,770 million, significantly ahead of other countries.
- France followed as a prominent exporter with a trade value of USD 11,846.4 million, while Italy closely trailed with USD 10,991 million, underscoring Europe’s strong position in the luxury travel goods segment.
- Hong Kong, SAR of China also made a notable contribution with exports valued at USD 2,807.3 million.
- Vietnam and Germany were also key players in the market, with export values of USD 3,214.2 million and USD 2,400.7 million, respectively, indicating their growing roles in the global travel goods industry.
- The Netherlands, Cambodia, India, and Singapore rounded out the list of leading exporters, with values of USD 1,804.3 million, USD 1,801.6 million, USD 1,688.6 million, and USD 1,622.5 million, respectively.
- These figures highlight a diverse set of contributors to the global market, ranging from traditional powerhouses in luxury goods to emerging manufacturing hubs in Asia.
(Source: Statista)
Import of Luggage Products Statistics
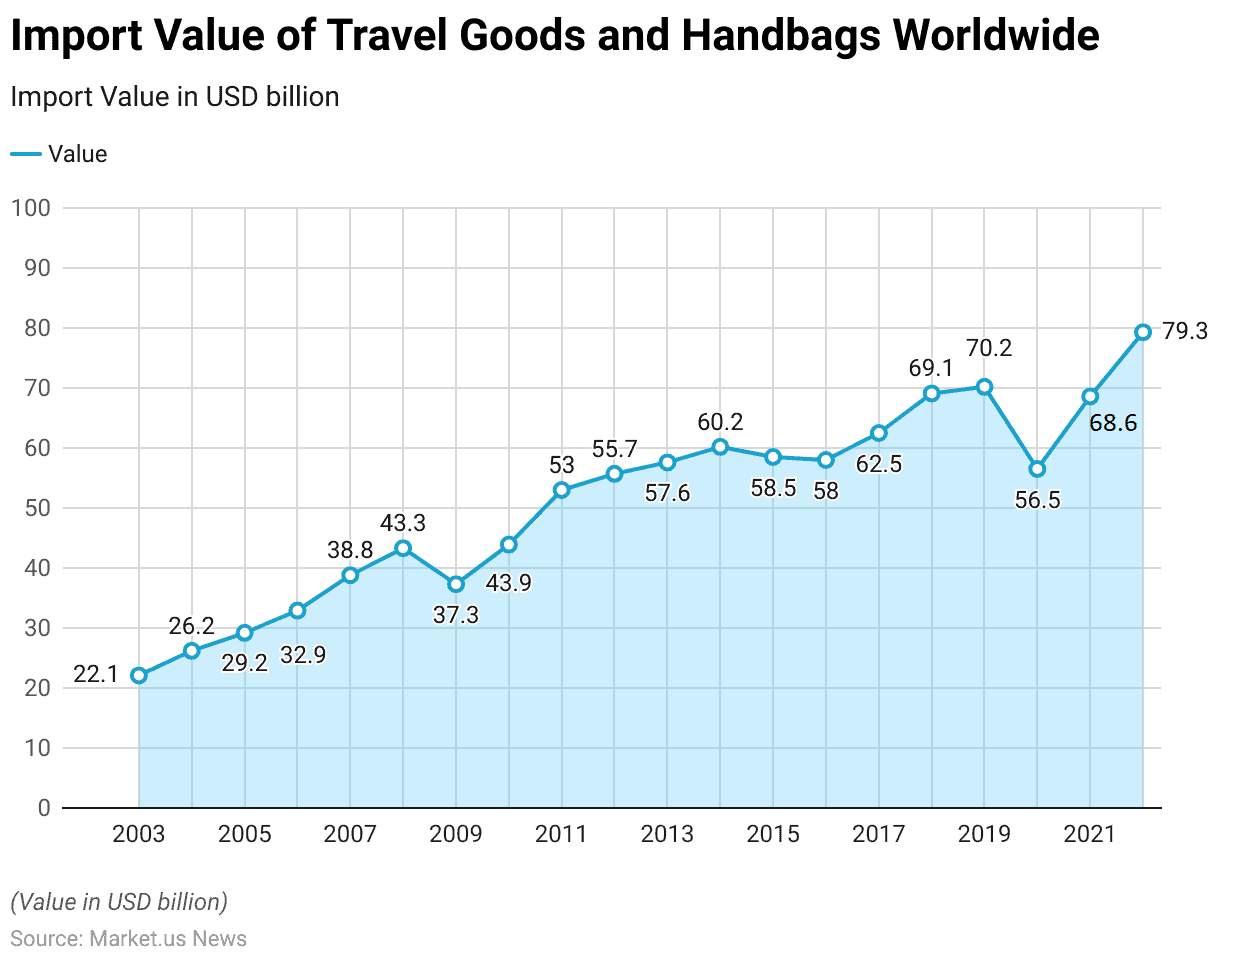
Import Value of Travel Goods and Handbags Worldwide
2003-2011
- From 2003 to 2022, the import value of travel goods and handbags worldwide showed significant fluctuations but maintained an overall upward trend.
- Starting at USD 22.1 billion in 2003, the import value increased steadily, reaching USD 26.2 billion in 2004 and continuing to rise to USD 29.2 billion in 2005.
- The growth persisted through the subsequent years, with the import value hitting USD 32.9 billion in 2006, USD 38.8 billion in 2007, and peaking at USD 43.3 billion in 2008.
- The global financial crisis impacted the market in 2009, causing imports to drop to USD 37.3 billion.
- However, recovery was swift, with imports climbing back to USD 43.9 billion by 2010 and then experiencing a significant surge to USD 53 billion in 2011.
2012-2022
- The import value continued to grow moderately, reaching USD 55.7 billion in 2012, USD 57.6 billion in 2013, and USD 60.2 billion in 2014.
- A slight dip occurred in 2015, with imports decreasing to USD 58.5 billion.
- After a brief stabilization of around USD 58 billion in 2016, the import value again rose to USD 62.5 billion in 2017 and markedly increased to USD 69.1 billion by 2018.
- The upward momentum continued, achieving USD 70.2 billion in 2019.
- The pandemic influenced a notable decrease in 2020, bringing the import value down to USD 56.5 billion, but it recovered to USD 68.6 billion in 2021.
- By 2022, a robust recovery was evident as the import value reached a high of USD 79.3 billion, reflecting a resilient demand and the significant role of global trade dynamics in the travel goods and handbag sector.
(Source: Statista)
Leading Importing Countries of Travel Goods and Handbags Worldwide
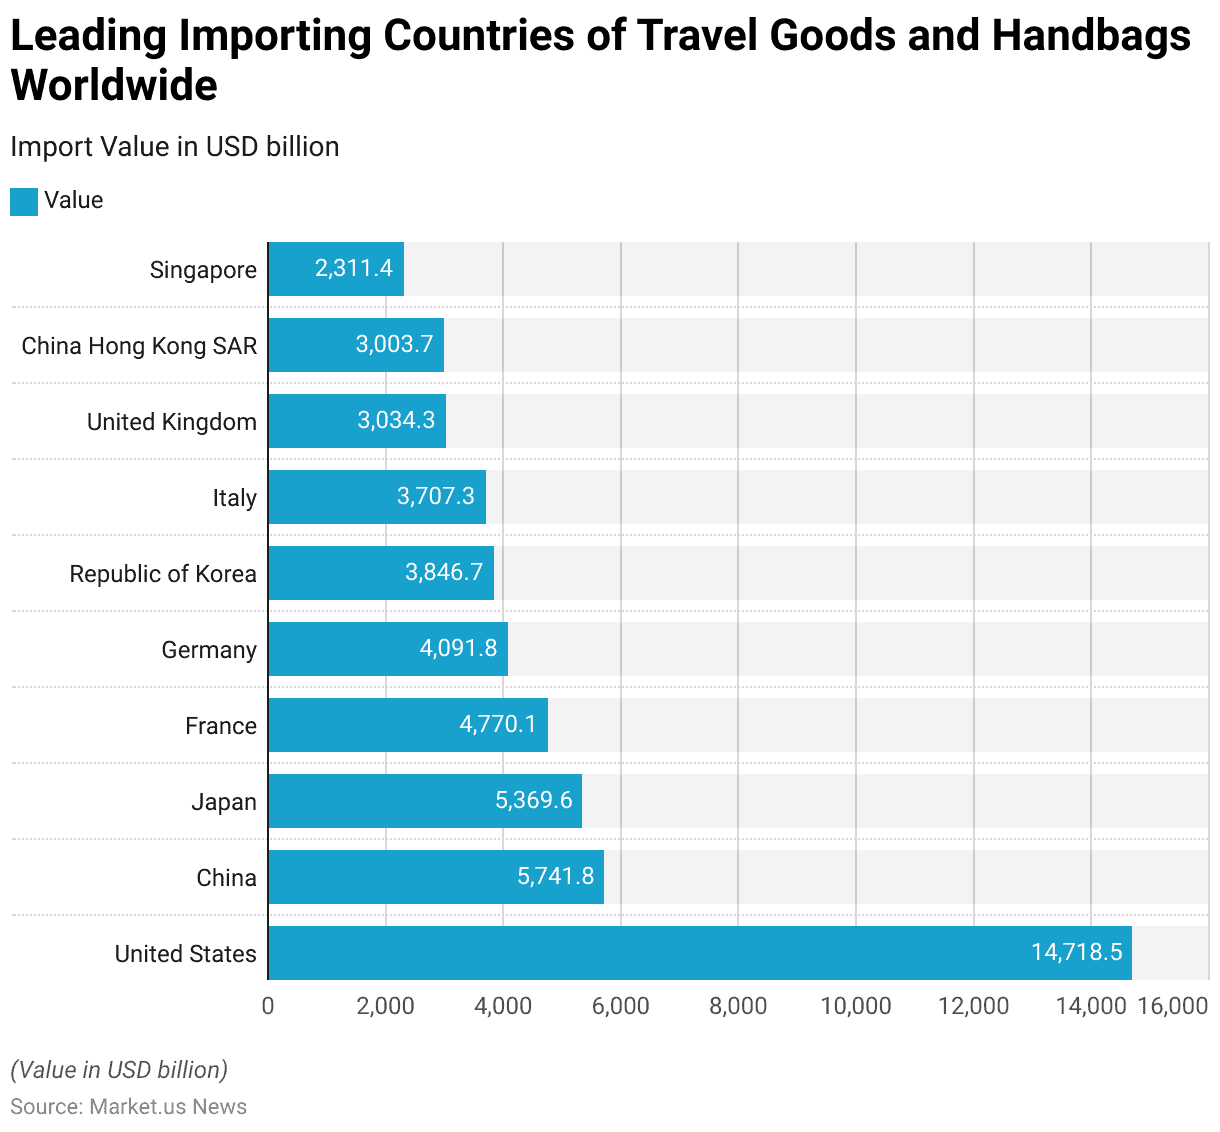
- In 2022, the landscape of the global travel goods and handbags market was significantly shaped by major importing countries.
- The United States stood out as the largest importer, bringing in goods worth USD 14,718.5 million, highlighting its substantial consumer market for these products.
- China also emerged as a significant player, with imports totaling USD 5,741.8 million, followed closely by Japan, which imported goods valued at USD 5,369.6 million.
- France and Germany were also prominent importers in the European market, with import values of USD 4,770.1 million and USD 4,091.8 million, respectively.
- The Republic of Korea and Italy further contributed to the global demand, with imports of USD 3,846.7 million and USD 3,707.3 million, respectively, reflecting robust market activity in both countries.
- The United Kingdom and Hong Kong, as well as the SAR of China, also showed strong import figures, with USD 3,034.3 million and USD 3,003.7 million, respectively.
- Singapore rounded out the list with imports totaling USD 2,311.4 million, indicating its role as a significant hub in the Southeast Asian region for luxury and travel-related goods.
- These figures underscore the global appeal and essential nature of travel goods and handbags, driven by varying consumer preferences and economic strengths across different regions.
(Source: Statista)
Expenditure on Luggage Worldwide Statistics
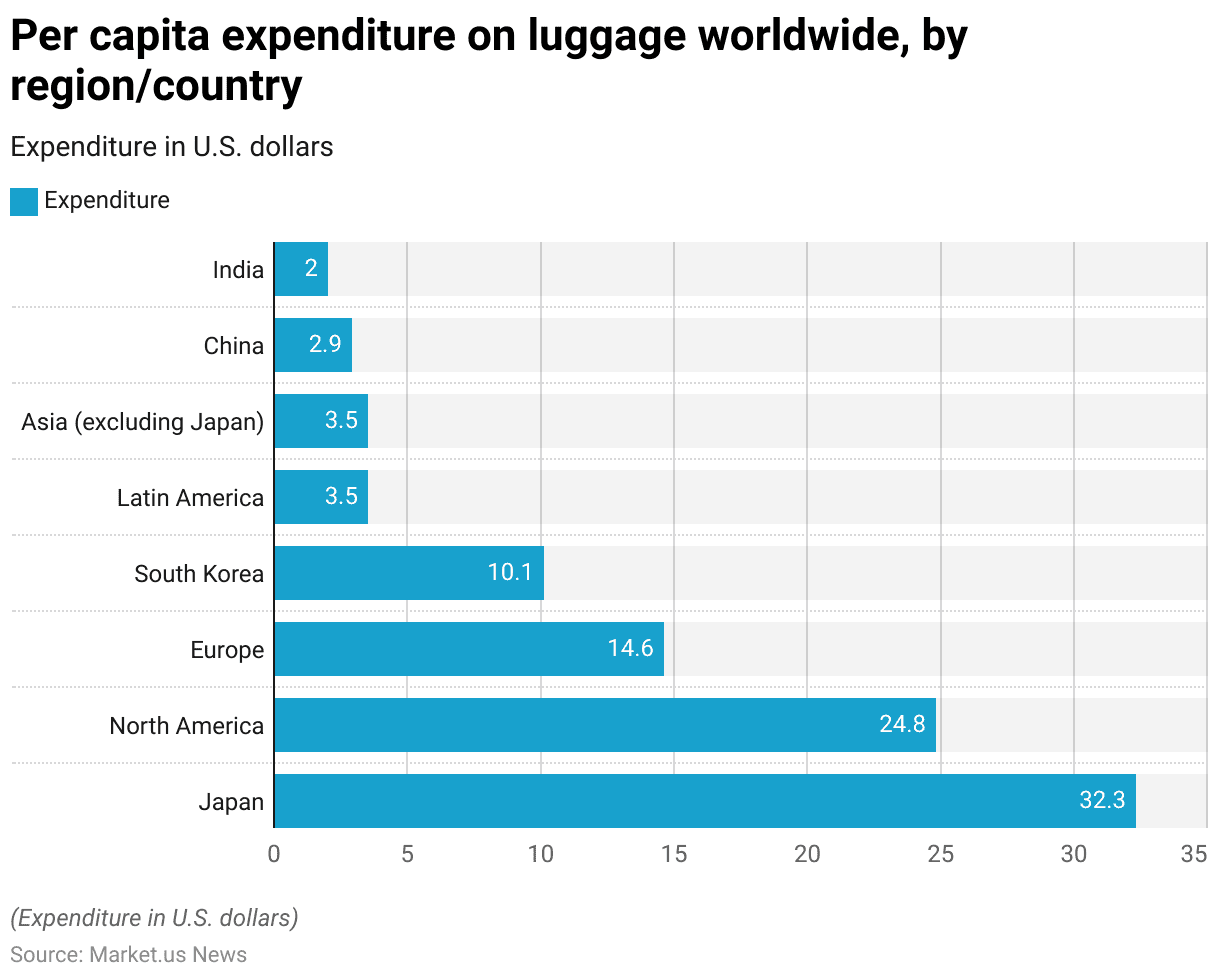
- In 2015, per capita expenditure on luggage varied significantly across different regions and countries, reflecting disparities in economic conditions and consumer spending habits.
- Japan led with the highest per capita expenditure on luggage at USD 32.3, indicating a strong market demand for travel goods.
- North America followed with a per capita expenditure of USD 24.8, showcasing substantial consumer investment in luggage in this region.
- Europe reported a moderate per capita expenditure of USD 14.6, while South Korea also showed notable spending at USD 10.1 per capita.
- Both Latin America and the broader Asian region (excluding Japan) exhibited lower levels of expenditure, each with a per capita spending of USD 3.5, pointing to more conservative spending habits or different market dynamics in these regions.
- China and India, despite their large populations and growing economic stature, had relatively low per capita expenditures on luggage at USD 2.9 and USD 2.0, respectively.
- This could reflect varying stages of economic development, differences in consumer priorities, or the availability of affordable travel goods in these markets.
- Overall, these figures underscore the diverse economic landscapes and consumer spending patterns across the globe concerning luggage purchases.
(Source: Statista)
Consumer Preferences and Trends
Factors That Influence Consumers to Purchase New Luggage Statistics
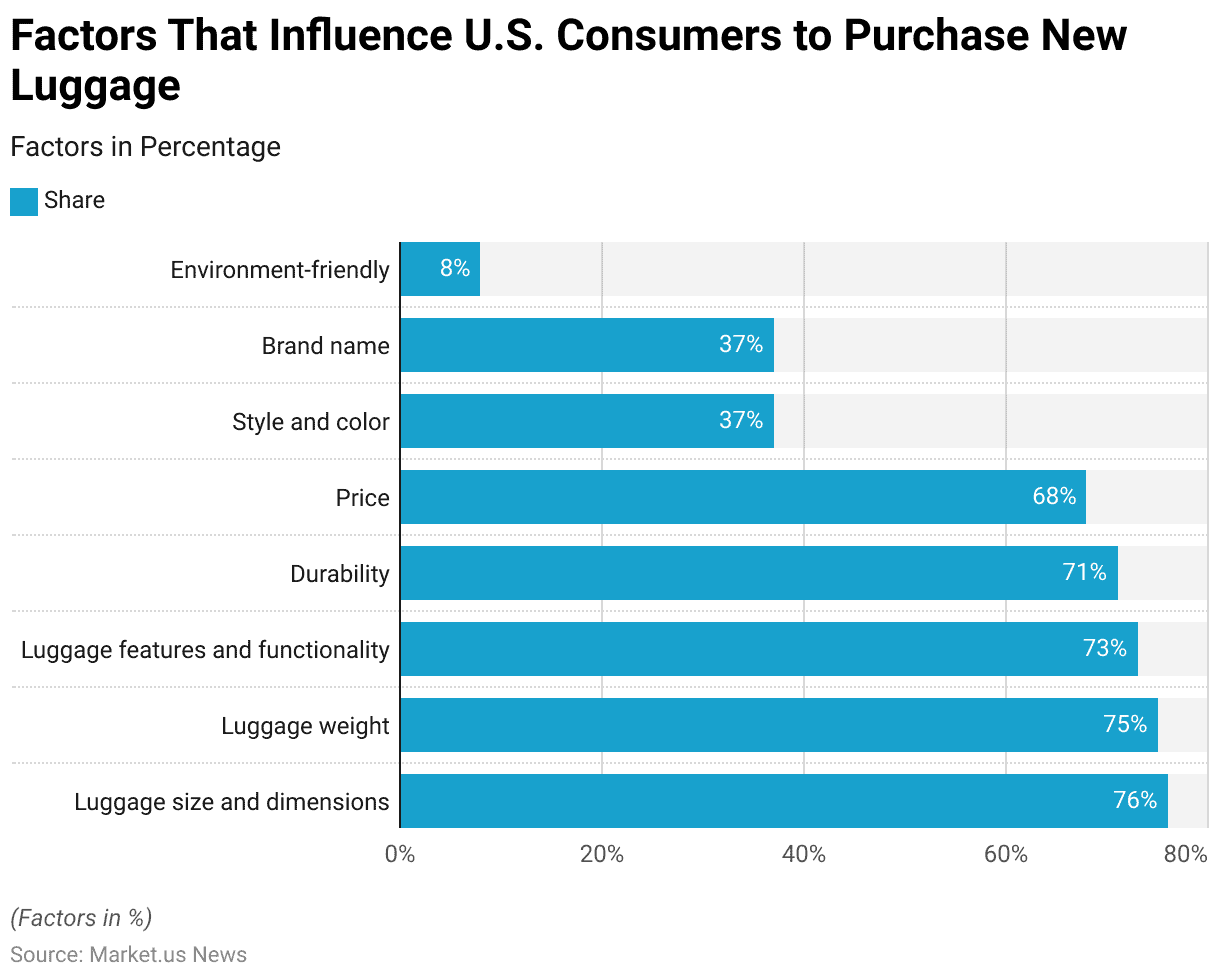
- In 2012, a survey of U.S. consumers revealed various factors that influenced their decisions to purchase new luggage.
- The predominant factor was luggage size and dimensions, with 76% of respondents indicating this as a key consideration, closely followed by luggage weight, which 75% of consumers found important.
- Features and functionality were also significant, with 73% of respondents valuing these aspects.
- Durability was a concern for 71% of those surveyed, emphasizing the importance of long-lasting luggage.
- Price was another critical factor influencing 68% of consumers, which highlights the role of cost in purchasing decisions.
- Style and color, along with the brand name, each influenced 37% of respondents, suggesting that while aesthetics and brand reputation are important, they are secondary to practical concerns for a majority of consumers.
- Additionally, environmental friendliness was a factor for 8% of the consumers, indicating a niche market focused on sustainability within the luggage industry.
- These findings illustrate the diverse criteria that U.S. consumers consider when selecting new luggage, with a clear preference for practicality and durability over aesthetics or brand.
(Source: Statista)
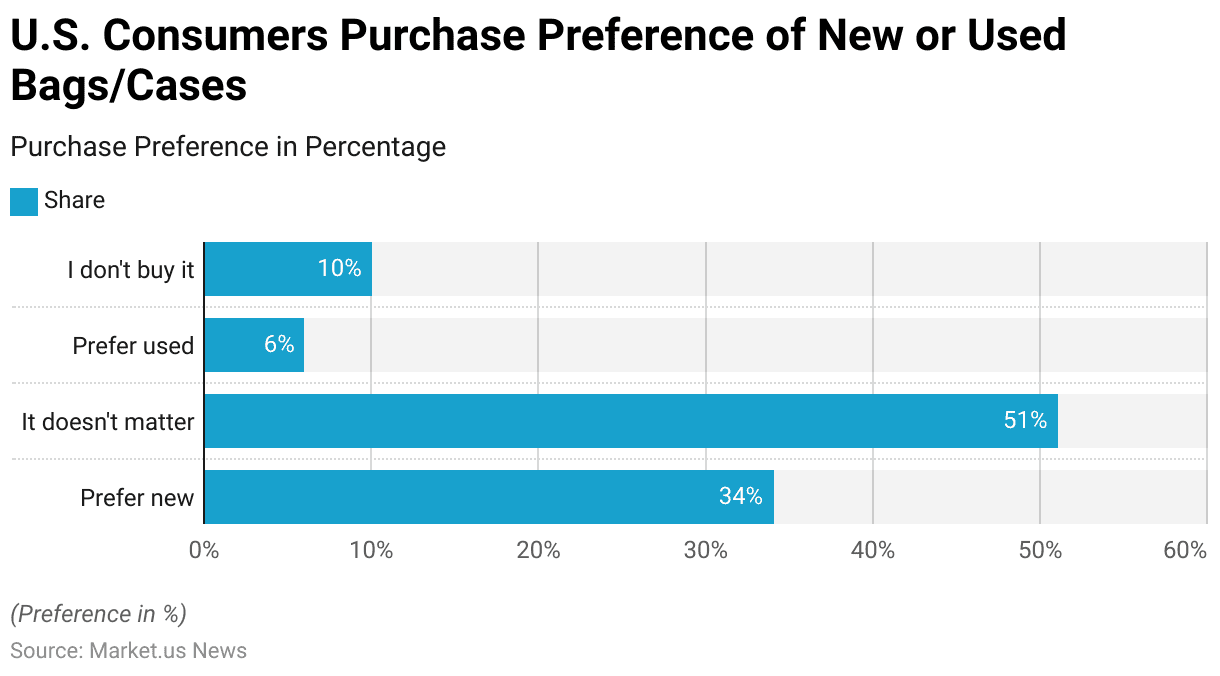
Consumers Purchase Preference of New or Used Bags/Cases
- In the United States in 2017, consumer preferences regarding the purchase of new or used bags and cases showed a varied but clear pattern.
- Among the respondents, 34% expressed a preference for buying new bags or cases, highlighting a significant portion of the market that values fresh and potentially more modern products.
- The majority of respondents, however, 51%, indicated that it didn’t matter whether the bags or cases were new or used, suggesting flexibility and perhaps a focus on functionality or cost rather than the item’s newness.
- Only a small fraction, 6%, preferred purchasing used items, which could reflect a niche but environmentally or budget-conscious segment of consumers.
- Additionally, 10% of the respondents stated that they do not buy bags or cases at all, indicating either a lack of need or satisfaction with their current possessions.
- This spread of preferences underscores the diverse approaches to purchasing these products, with a substantial number of consumers open to both new and used options depending on other factors such as price, quality, and personal necessity.
(Source: Statista)
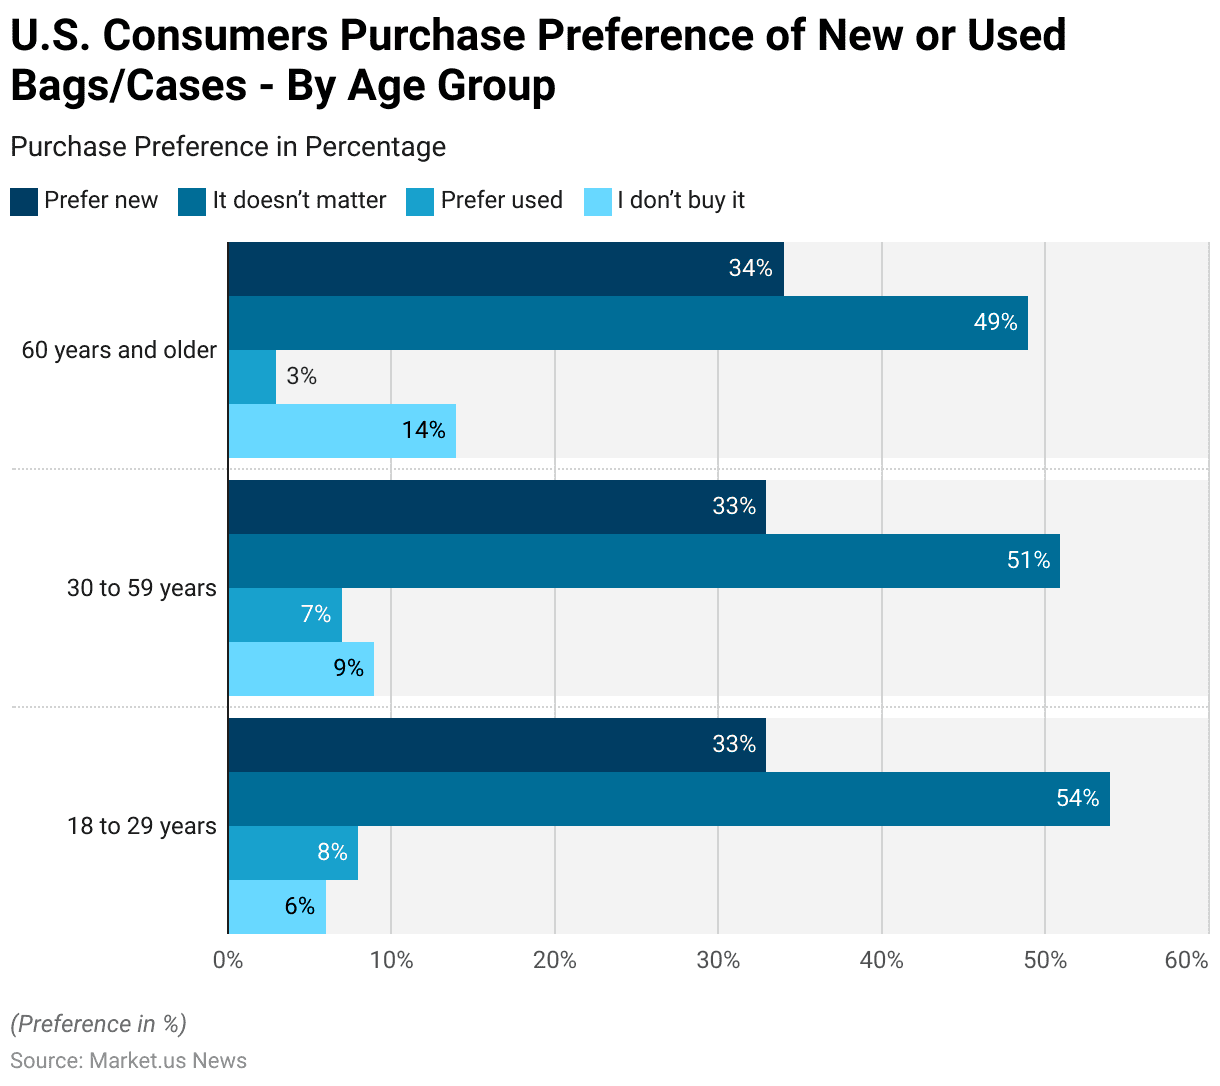
Consumers Purchase Preference of New or Used Bags/Cases – By Age Group
- In 2017, consumer preferences for purchasing new versus used bags and cases in the United States varied by age group.
- Across all age groups, a relatively small proportion expressed a preference for new bags and cases, with 33% of those aged 18 to 29, 33% of those aged 30 to 59, and 34% of those 60 years and older stating this preference.
- A majority of consumers indicated that the newness of the bag or case did not matter to them, with 54% in the 18 to 29 age group, 51% in the 30 to 59 age group, and 49% in the 60 years and older age group sharing this sentiment.
- A minority of consumers preferred used items, with 8% of the youngest group, 7% of the middle age group, and only 3% of the oldest group expressing this preference.
- Notably, the proportion of consumers who stated they do not purchase bags or cases at all increased with age: 6% of those aged 18 to 29, 9% of those aged 30 to 59, and 14% of those aged 60 and older.
- This data highlights age-related trends in consumer behavior regarding the purchase of bags and cases, showing varying levels of interest in new, used, or no purchases at all.
(Source: Statista)
Luggage Checking at Airports
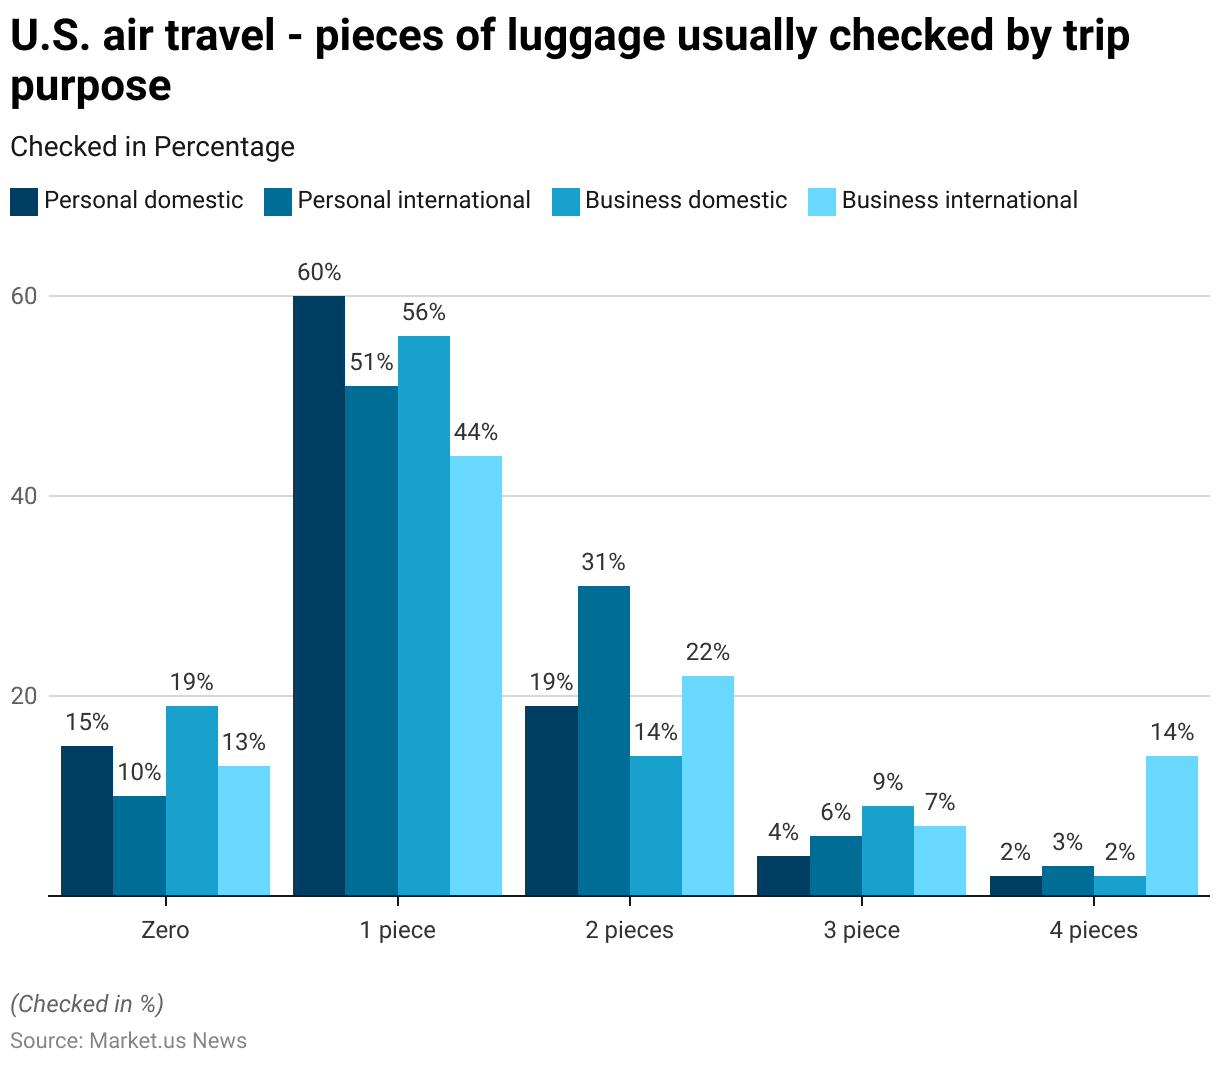
Checking Pattern
- In 2017, a survey of U.S. airline travelers revealed distinct patterns in the number of bags checked before going through security, with variations according to the trip purpose and destination.
- For personal domestic trips, 15% of respondents checked no bags, while a majority of 60% checked one piece of luggage. About 19% checked two pieces, and smaller fractions checked three pieces (4%) and four pieces (2%).
- For personal international travel, the tendency to check more luggage was evident: only 10% checked no bags, 51% checked one, and 31% checked two, indicating a higher luggage requirement for longer trips. 6% checked three pieces, and 3% checked four pieces.
- Business travel showed similar trends but with notable differences. On domestic business trips, 19% did not check any bags, reflecting perhaps shorter trip durations or less need for multiple changes of clothing, while 56% checked one bag and 14% checked two. Notably, 9% checked three bags, and 2% checked four.
- For international business travel, the pattern shifted, with only 13% checking no bags, while a lesser 44% checked one bag, suggesting a need for more extensive wardrobe or equipment options.
- 22% checked two bags, 7% checked three, and a higher proportion of 14% checked four pieces, possibly reflecting the need for a broader range of attire or additional equipment for extended stays or formal business engagements abroad.
- These findings underscore the varying luggage needs of travelers based on the nature and destination of their trips.
(Source: Statista)
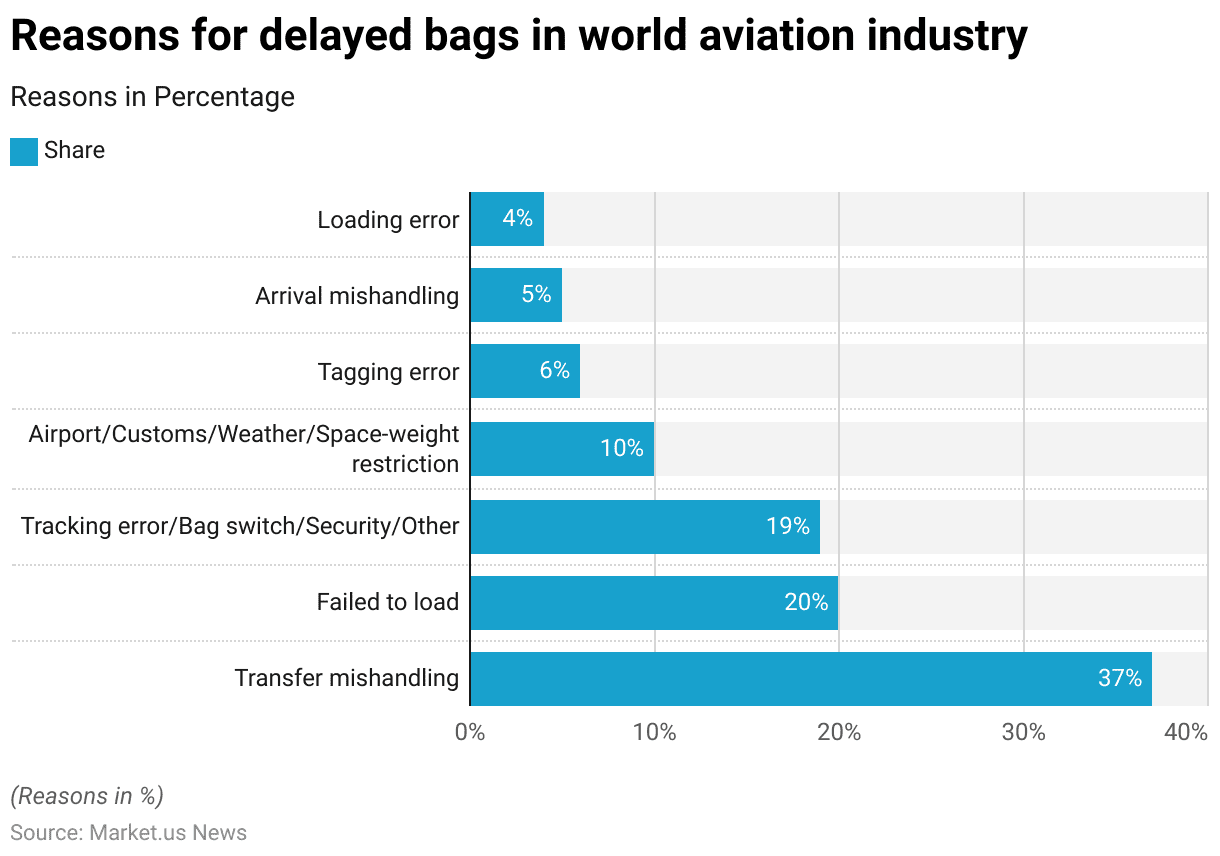
Causes of Delayed Bags in Air Travel
- In 2020, various factors contributed to baggage delays in the global aviation industry, with the primary cause being transfer mishandling, accounting for 37% of delayed bags.
- This indicates significant challenges in managing luggage transfers during flights with multiple legs. The next significant issue was the failure to load bags onto the aircraft, which represented 20% of the delays, pointing to operational inefficiencies at departure points.
- Tracking errors, along with issues related to bag switching, security checks, and other miscellaneous factors, contributed to 19% of the delays. This category underscores the complexities involved in baggage tracking and handling systems.
- Airport operations, influenced by customs procedures, weather conditions, and space-weight restrictions, accounted for another 10% of baggage delays, highlighting the impact of external and environmental factors on luggage handling.
- Tagging errors, which can lead to bags being routed incorrectly, were responsible for 6% of delays. Arrival mishandling, which includes errors in the final sorting and delivery of luggage to passengers, accounted for 5%. Lastly, loading errors made up 4% of the delays, indicating issues during the physical loading of luggage onto the aircraft.
- These statistics reflect a variety of operational challenges faced by airlines and airports in managing passenger luggage efficiently.
(Source: Statista)
Luggage Regulations
Airports
- Luggage regulations at airports vary significantly depending on the country and airline, but general guidelines exist to enhance safety and efficiency in air travel.
- Most countries, including those in the EU, U.S., and Asia, align with the International Civil Aviation Organization’s (ICAO) 100 ml liquid rule, which mandates that all liquids in carry-on baggage be in containers of 100 ml or less, placed in a transparent 1-litre resealable bag.
- Additionally, hand luggage size limits are often set at around 22 x 18 x 10 inches. However, specific dimensions and weight restrictions (commonly 7-10 kg) differ by airline and region, such as stricter weight limits in European and Asian carriers compared to more lenient U.S. regulations.
- Checked baggage typically has a 50 lb (23 kg) limit for economy class, with potential charges for overweight items.
- Certain items like sharp objects and large electronics must be in checked luggage, while lithium batteries are restricted to carry-on due to fire hazards.
- Various agencies, such as the TSA in the U.S. and IATA guidelines for international travel, enforce these regulations.
(Sources: Travelpro, IATA, Skyscanner)
Railway Stations
- Luggage regulations at railway stations vary significantly across countries and regions, focusing primarily on passenger convenience, safety, and operational efficiency.
- In Europe, countries like France, Spain, and Germany allow passengers to carry up to three pieces of luggage with specific size restrictions, such as a maximum size of 85 x 55 x 35 cm and a total weight limit of 25 kg per item.
- Additional fees apply for excess luggage, as seen with France’s TGV trains, where penalties range from €50 to €150 depending on the number of non-compliant items.
- In China, carry-on luggage policies are more flexible, typically allowing up to 20 kg for adults and 10 kg for children, with specific restrictions on item dimensions for high-speed and standard trains.
- North American carriers like Amtrak provide more generous weight limits, allowing two checked bags up to 50 lbs (23 kg) each and two additional carry-ons, with fees for oversized or extra bags.
- Security measures, such as luggage scanning and limitations on hazardous items, are implemented in several countries to ensure passenger safety during travel.
(Sources: China Discovery, Rail Europe Help, NS International, Amtrak)
Cruises, Ships, and Boats
- Luggage regulations for cruises, ships, and boats vary based on the cruise line, ship type, and country of departure or destination.
- Generally, passengers are allowed two checked bags and carry-on luggage, but weight and size limits differ by cruise line.
- For example, MSC Cruises permits two suitcases per person, with a maximum of 23 kg per bag, and two smaller hand luggage pieces.
- Security screening at the terminal mirrors airport procedures, with X-rays used to scan all bags and strict prohibitions on dangerous items, including firearms, sharp objects, and illegal substances such as CBD and marijuana, which are restricted due to international and local laws at ports of call.
- Some lines, such as Carnival and Holland America, do not allow passengers to bring liquor onboard but permit a limited amount of wine.
- Additionally, national and international maritime laws, such as SOLAS (Safety of Life at Sea) and local port regulations, influence what items can be brought aboard, and baggage policies often advise passengers to label their bags clearly to avoid mishandling.
(Sources: Life Well Cruised, Cruzely.com, Holland America Line)
For Road Travel
- Luggage regulations for road travel can vary significantly by country, with specific restrictions often influenced by local laws and road safety considerations.
- In the European Union, for example, there are no overarching EU-wide luggage rules for vehicles. Still, individual countries maintain specific regulations, especially regarding hazardous materials and weight limits for trailers.
- Germany, for instance, has strict regulations about transporting goods that must not obstruct the driver’s view or affect the vehicle’s stability, for trailers under 3.5 tons, speed limits and safety checks are mandated.
- In non-EU countries like the United States, luggage must be securely fastened, and it is illegal to transport passengers or goods in a way that compromises vehicle safety.
- Many countries also impose restrictions on items like fuel containers and the carrying of large quantities of alcohol or tobacco, which must comply with local customs laws.
- Adhering to these rules is essential to avoid penalties and ensure road safety.
(Sources: C&C, Cedric Lizotte, European Union, European Commission)
Recent Developments
Acquisitions and Mergers:
- Samsonite acquires Tumi: In 2023, Samsonite, the world’s largest luggage manufacturer, acquired Tumi, a premium travel and business luggage brand, for $1.8 billion. This acquisition strengthens Samsonite’s position in the luxury luggage market, allowing it to target high-end travelers with Tumi’s sleek and durable designs.
- Away acquires Baboon to the Moon: In early 2024, Away, a direct-to-consumer luggage brand, acquired Baboon to the Moon, a startup known for its colorful and durable adventure bags, for $40 million. This merger aims to expand Away’s product portfolio to include more outdoor and adventure gear, appealing to younger, adventure-seeking travelers.
New Product Launches:
- Samsonite launches eco-friendly luggage line: In mid-2023, Samsonite introduced the ECO-Nu collection, a sustainable luggage line made from recycled plastic bottles. The collection is designed for eco-conscious travelers, with the company expecting 25% of its product range to be made from sustainable materials by 2025.
- Rimowa introduces smart luggage with GPS tracking: In late 2023, Rimowa launched its Electronic Tag 2.0, a high-end luggage line that includes GPS tracking, digital baggage tags, and app-based controls. The smart luggage aims to reduce mishandled baggage incidents by 30%, targeting frequent flyers and business travelers.
Funding:
- Away raises $100 million in Series D funding: In early 2023, Away raised $100 million in Series D funding to expand its product offerings and international presence. The funding will also help enhance the brand’s tech-enabled luggage features, such as built-in chargers and tracking capabilities.
- Horizn Studios secures $50 million for smart luggage: In late 2023, Horizn Studios, a Berlin-based smart luggage startup, secured $50 million in funding to scale its business globally. The funds will be used to develop new tech-integrated travel products, including luggage with wireless charging and smart locks.
Technological Advancements:
- Smart luggage with biometric locks: By 2025, it is projected that 35% of premium luggage brands will incorporate biometric technology, such as fingerprint recognition for locks, enhancing security and user convenience.
- Sustainable materials in luggage: The demand for eco-friendly materials is growing. By 2026, 40% of new luggage products are expected to use recycled or sustainable materials, reflecting the shift toward environmentally responsible travel gear.
Conclusion
Luggage Statistics: The luggage market has demonstrated robust growth, driven by increased travel, technological advancements, and evolving consumer preferences.
Growth is supported by innovations in materials, with a shift towards lightweight, durable options like polycarbonate.
Smart luggage features such as GPS tracking and USB chargers are becoming standard, catering to modern travelers’ needs for security and connectivity.
Consumer purchasing decisions heavily weigh factors such as size, weight, durability, and price, though there’s a growing demand for style and eco-friendly products.
The market faces challenges like luggage mishandling, prompting investments in improved logistics and tracking technologies.
Despite stiff competition from leading brands like Samsonite and numerous smaller players, the industry continues to thrive on innovation, with a strong outlook driven by the expanding global travel sector and a shift towards sustainability.
FAQs
Popular types of luggage include hard-sided luggage, soft-sided luggage, backpacks, travel duffel bags, and business bags. Consumers choose based on their travel needs and preferences for flexibility, protection, or specific features.
Leading companies include Samsonite, Tumi, Rimowa, VIP Industries, and Delsey. These brands dominate due to their strong reputations for quality and innovation. The market is also characterized by numerous smaller brands, which contribute to its fragmentation.
Key considerations include size and dimensions, weight, durability, price, brand reputation, and additional features like wheels, expandability, and security locks. Aesthetic elements like style and color also play a role, although functionality often takes precedence.
E-commerce plays a crucial role, allowing consumers to easily compare prices, read reviews, and make purchases from the comfort of their homes. The convenience of online shopping has significantly boosted luggage sales, particularly during the pandemic period.
The pandemic led to a sharp decline in sales as travel reached a standstill. However, since restrictions have eased, a strong recovery has been driven by pent-up demand for leisure and business travel.


