Table of Contents
- Introduction
- Editor’s Choice
- Global Luxury Travel and Tourism Market Statistics
- Luxury Travel Market Statistics
- Tourism & Luxury Travel Users Worldwide Statistics
- Luxury Tourism Revenue of Trending Travel Destinations Statistics
- Tourism and Luxury Travel: Share of Global GDP Statistics
- Luxury Travel and Tourism Employment Worldwide Statistics
- Luxury Tourism as a Share of Total Internal Tourism Revenue in Trending Travel Destinations Statistics
- Internal Luxury Tourism Revenue Growth
- Consumer Demographics
- International Luxury Travel Statistics
- Luxury Travel Destinations Statistics
- Luxury Travel Bookings Statistics
- Most Popular Accommodation Choices of Luxury Travel Clients
- Key Spending Statistics
- Impact of COVID-19
- Challenges and Concerns
- Regulations for Luxury Travel
- Recent Developments
- Conclusion
- FAQs
Introduction
Luxury Travel Statistics: Luxury travel is a high-end segment of the travel industry characterized by exclusive, high-quality experiences and services.
It involves premium accommodations like five-star hotels and private villas. Top-tier transportation including first-class flights and private jets, and unique, tailored experiences such as private tours and bespoke excursions.
The target audience includes affluent travelers who value privacy, exceptional service, and unique offerings.
Trends in the sector include a growing emphasis on experiential and sustainable luxury, as well as wellness-focused retreats.
Economic conditions, technological advancements, and evolving consumer preferences influence market dynamics.
Key players in this sector are luxury travel agencies, high-end hospitality brands, and private travel providers.
Editor’s Choice
- The global luxury travel market revenue reached USD 1,432 billion in 2023.
- Several key players with varying market shares characterize the global luxury travel market. Cox & Kings Ltd. holds the largest share at 15%, making it a leading company in the sector.
- Several key regions dominate the global luxury travel market, each contributing a significant share. Europe leads the market with a 33.8% share, reflecting its strong position as a premier destination for luxury travel.
- The United States is expected to maintain its leadership position in the case of internal luxury tourism. With revenue increasing from $204.3 billion in 2020 to $304.5 billion in 2024.
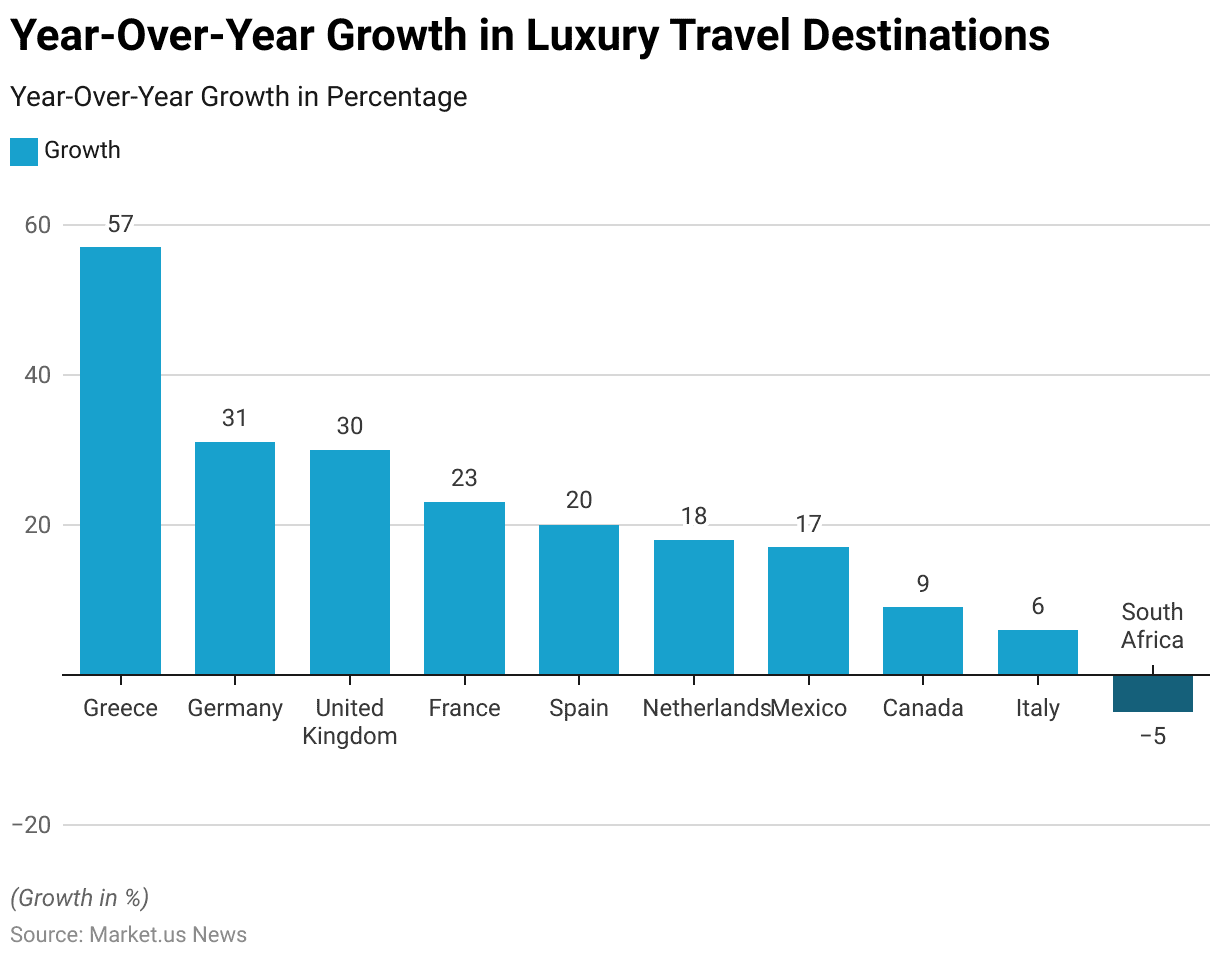
- As of August 2014, several luxury travel destinations around the world experienced significant year-over-year growth in visitor numbers. Greece led the pack with an impressive 57% increase in travel. Marking it as the fastest-growing luxury destination during this period.
- In 2020, the most expensive holiday destinations worldwide were ranked based on the average price per day in British Pounds (GBP). Leading the list was Grand Cayman in the Cayman Islands, where the average daily cost for travelers reached £459.58.
- As of May 2020, Indian luxury travelers reported several uncomfortable experiences during the coronavirus (COVID-19) pandemic. The leading concern, cited by 75% of respondents, was the uncertainty about whether proper cleaning protocols were being followed.
Global Luxury Travel and Tourism Market Statistics
Market Size of the Global Tourism Sector Statistics
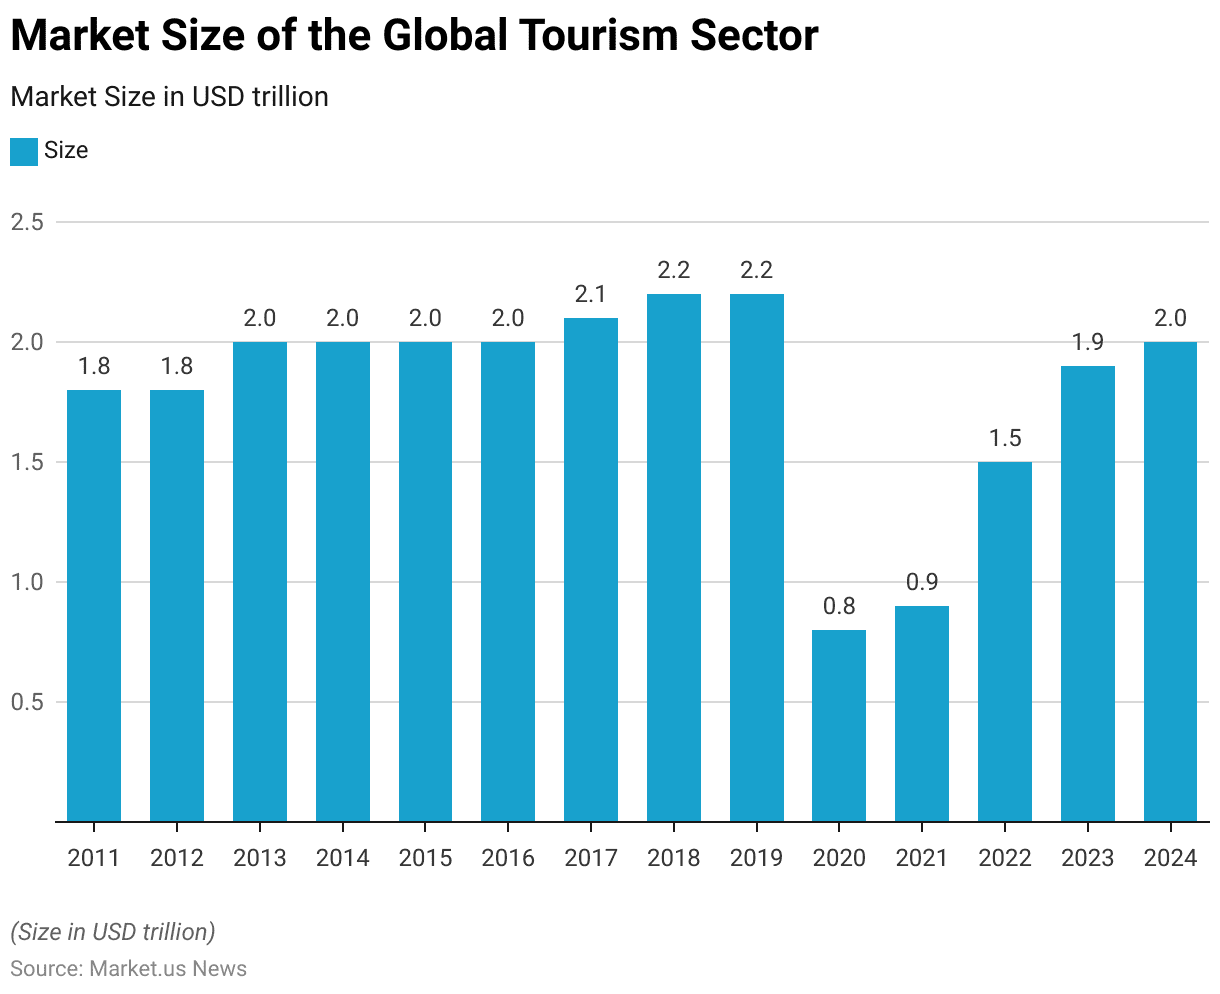
- The market size of the global tourism sector has experienced significant fluctuations over the years, reflecting various global trends and events.
- In 2011 and 2012, the market size remained stable at $1.8 trillion.
- From 2013 to 2016, the market expanded to $2 trillion annually, showing consistent growth.
- This upward trend continued, with the market size reaching $2.1 trillion in 2017 and further increasing to $2.2 trillion in both 2018 and 2019.
- However, the onset of the COVID-19 pandemic in 2020 caused a sharp contraction in the tourism sector, with the market size plummeting to $0.8 trillion.
- The market showed a slight recovery in 2021, increasing to $0.9 trillion, and continued to rebound in 2022 with a market size of $1.5 trillion.
- In 2023, the market size is estimated to reach $1.9 trillion, approaching pre-pandemic levels.
- Looking ahead, the global tourism sector is forecasted to recover fully by 2024. With the market size expected to return to $2 trillion.
- This anticipated recovery highlights the sector’s resilience and its capacity to bounce back from significant disruptions.
(Source: Statista)
Global Luxury Travel and Tourism Market Revenue – By Segment Statistics
2020-2023
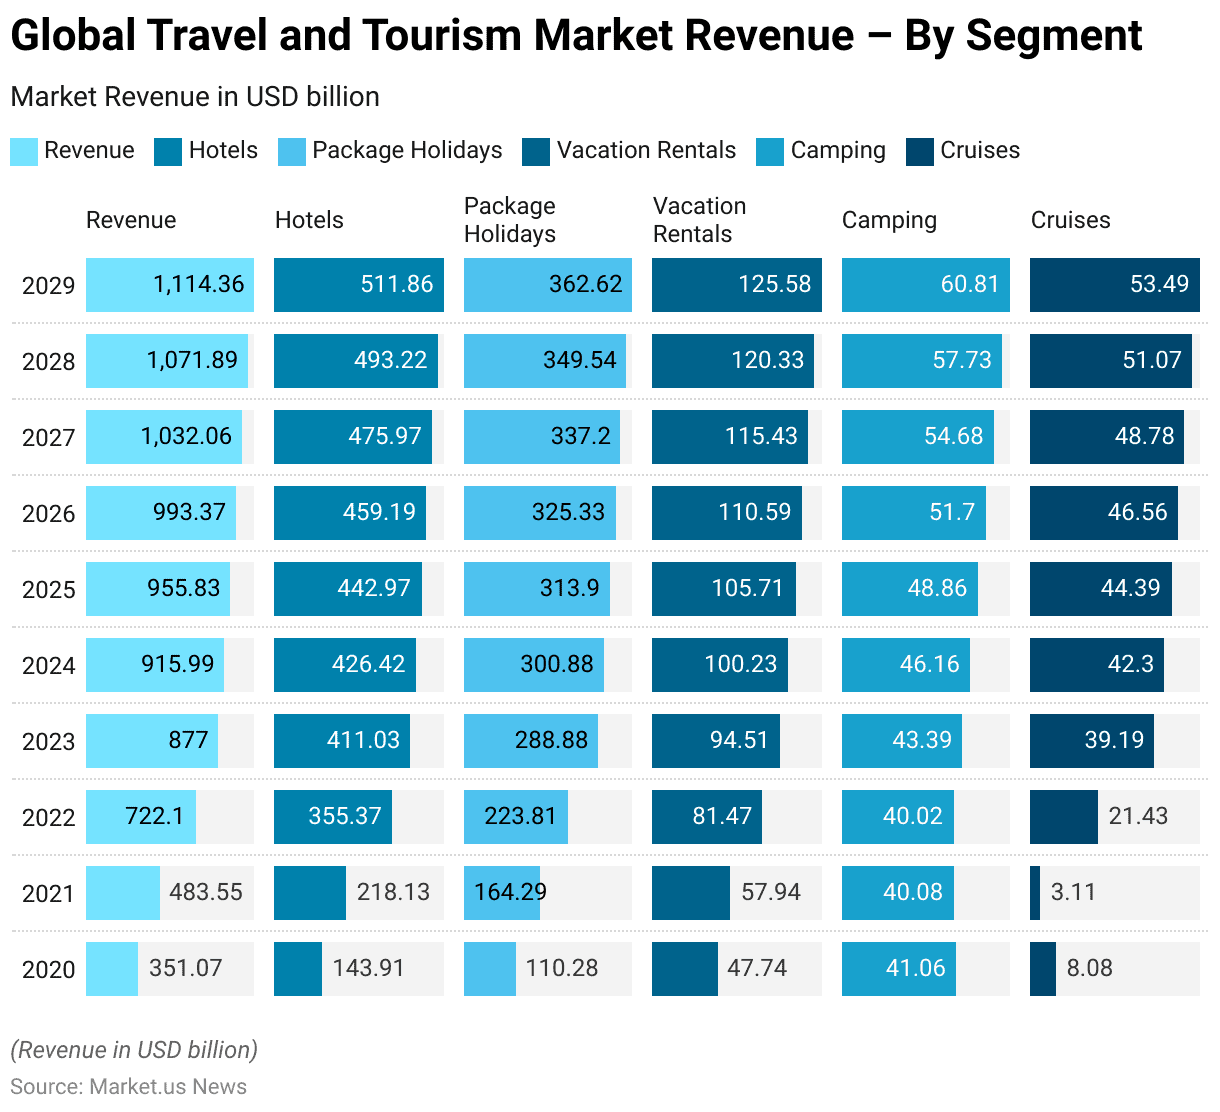
- The global travel and tourism market is projected to experience substantial growth across various segments from 2020 to 2023.
- In 2020, the total revenue of the market was $351.07 billion, with hotels contributing $143.91 billion, package holidays $110.28 billion, vacation rentals $47.74 billion, camping $41.06 billion, and cruises $8.08 billion.
- The market saw a significant rebound in 2021, with total revenue increasing to $483.55 billion despite a decline in the cruise segment to $3.11 billion.
- By 2022, total revenue surged to $722.1 billion, with hotels generating $355.37 billion and cruises recovering to $21.43 billion.
- This growth continued into 2023, with total revenue reaching $877 billion.
- Hotels, package holidays, and vacation rentals showed strong performance. Contributing $411.03 billion, $288.88 billion, and $94.51 billion, respectively.
2024-2029
- The upward trend is expected to persist through 2024, with total revenue projected to reach $915.99 billion. Driven by increases across all segments, including hotels ($426.42 billion) and cruises ($42.3 billion).
- By 2025, the market is anticipated to generate $955.83 billion in total revenue. With continued growth in hotels, package holidays, and vacation rentals.
- Looking ahead, the market is forecasted to surpass the $1 trillion mark by 2027. With total revenue reaching $1,032.06 billion. Led by the hotel segment at $475.97 billion and package holidays at $337.2 billion.
- By 2029, the global travel and tourism market is expected to generate $1,114.36 billion in revenue, with hotels contributing $511.86 billion. Package holidays $362.62 billion, vacation rentals $125.58 billion, camping $60.81 billion, and cruises $53.49 billion.
- This growth trajectory underscores the robust recovery and expansion of the travel and tourism industry over the decade.
(Source: Statista)
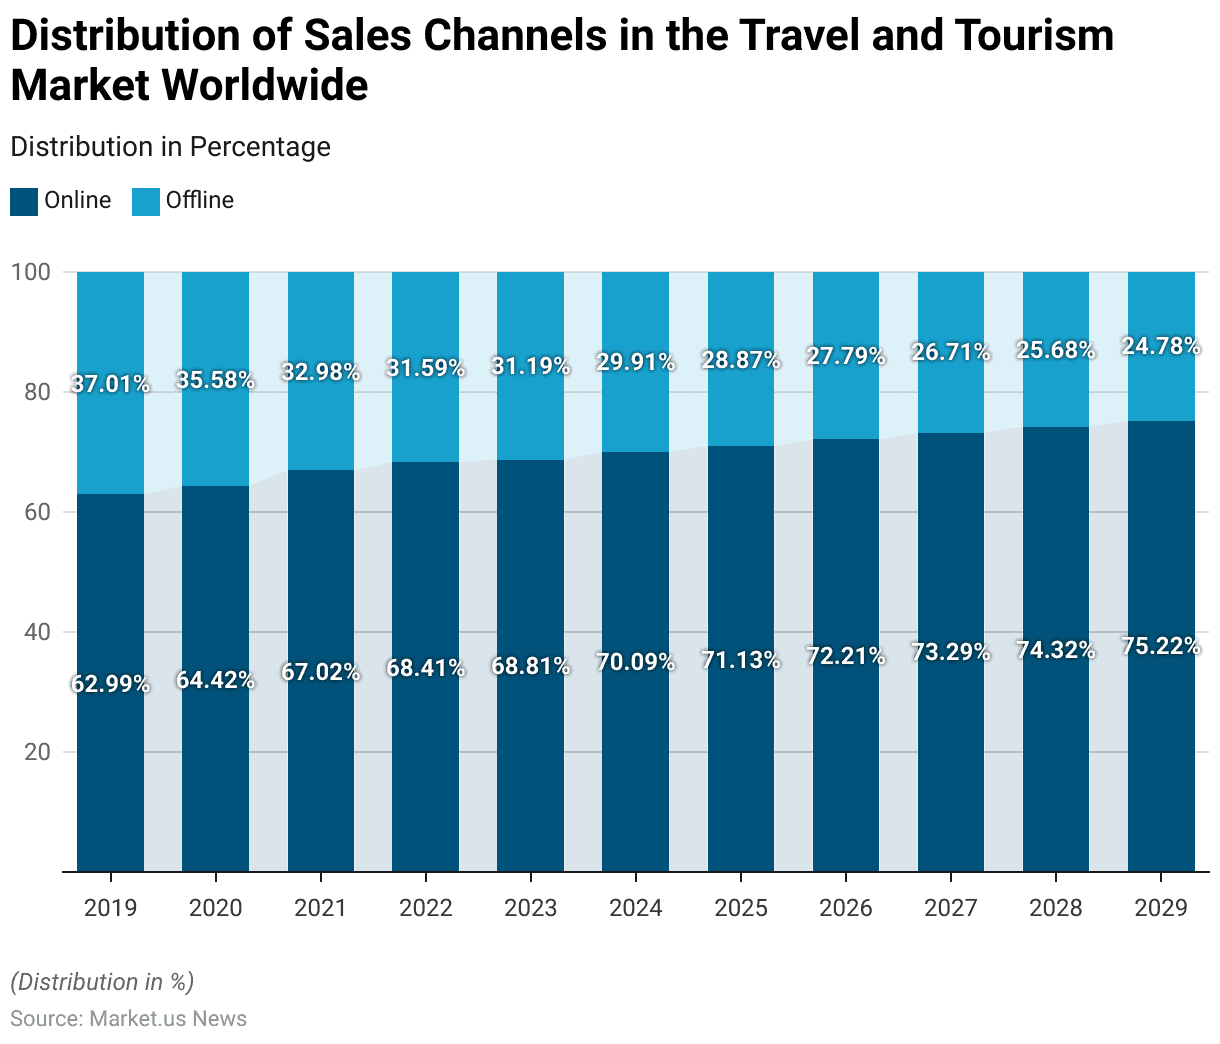
Distribution of Sales Channels in the Luxury Travel and Tourism Market Worldwide Statistics
- The revenue share of sales channels in the global travel and tourism market has seen a notable shift towards online platforms from 2019 to 2029.
- In 2019, online channels accounted for 62.99% of the total revenue, while offline channels held 37.01%.
- This trend towards online sales has strengthened over the years. With the online share increasing to 64.42% in 2020 and further to 67.02% in 2021.
- By 2022, online sales represented 68.41% of the market, with offline channels declining to 31.59%.
- The shift towards online sales is expected to continue. The online share is projected to reach 68.81% in 2023 and 70.09% in 2024. While offline sales are anticipated to decline to 31.19% and 29.91%, respectively.
- By 2025, online channels are expected to dominate with 71.13% of the revenue. Leaving offline channels with 28.87%.
- This trend is forecasted to persist through the latter half of the decade. Online sales are projected to account for 73.29% of the market by 2027, 74.32% by 2028, and 75.22% by 2029.
- Correspondingly, offline channels are expected to continue their decline. Making up only 24.78% of the market by 2029.
- This data underscores the growing preference for online platforms in the travel and tourism sector. Reflecting broader digitalization trends and changes in consumer behavior.
(Source: Statista)
Luxury Travel Market Statistics
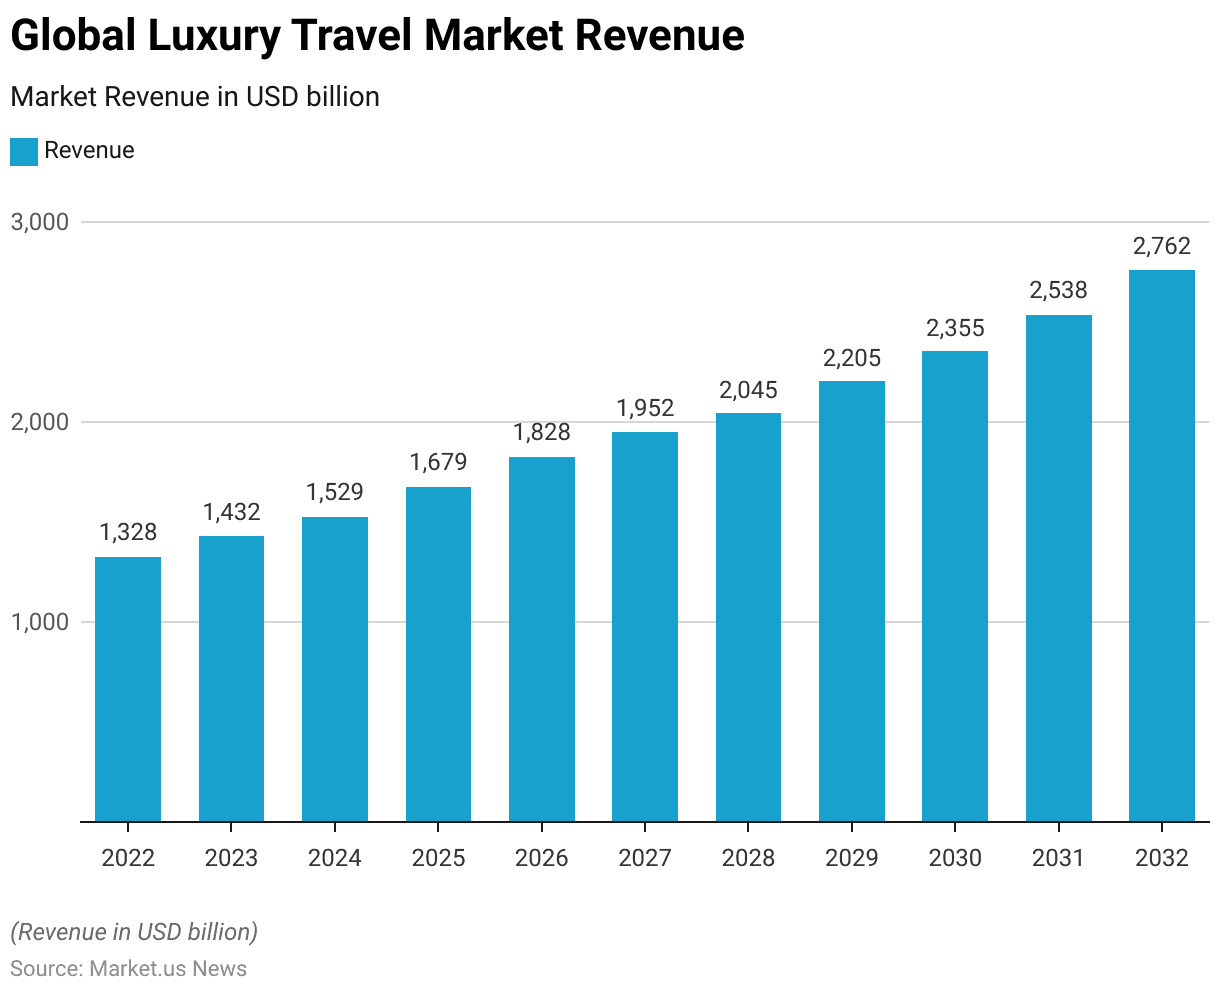
Global Luxury Travel Market Size Statistics
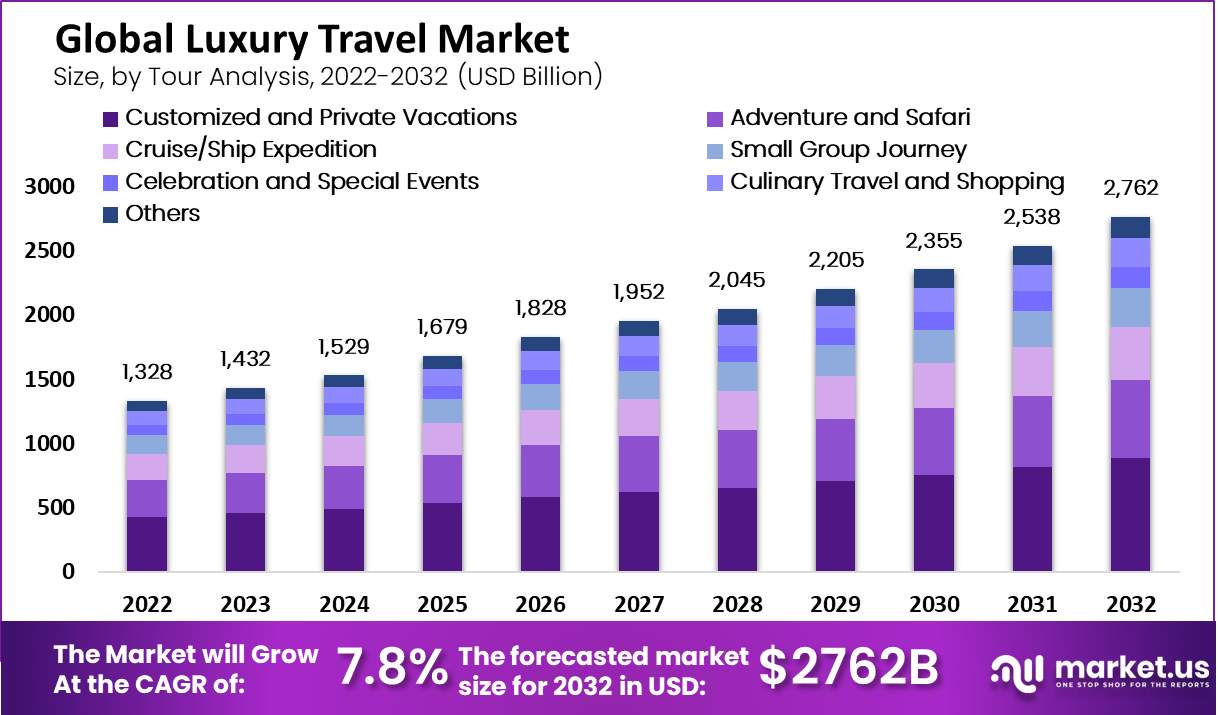
- The global luxury travel market is expected to experience substantial growth over the next decade at a CAGR of 7.80%.
- In 2022, the market was valued at USD 1,328 billion.
- This figure is projected to rise steadily each year, reaching USD 1,432 billion in 2023, USD 1,529 billion in 2024, and USD 1,679 billion in 2025.
- By 2026, the market is expected to surpass USD 1,828 billion and continue its upward trajectory. With an anticipated value of USD 1,952 billion in 2027.
- The growth trend is forecasted to persist through the end of the decade. With the market reaching USD 2,045 billion in 2028 and USD 2,205 billion in 2029.
- Entering the 2030s, the market is expected to grow further. Reaching USD 2,355 billion in 2030 and USD 2,538 billion in 2031.
- By 2032, the global luxury travel market is projected to achieve a significant milestone. With an estimated revenue of USD 2,762 billion.
- This consistent growth highlights the expanding demand and investment in luxury travel experiences worldwide.
(Source: market.us)
Competitive Landscape of Global Luxury Travel Market Statistics
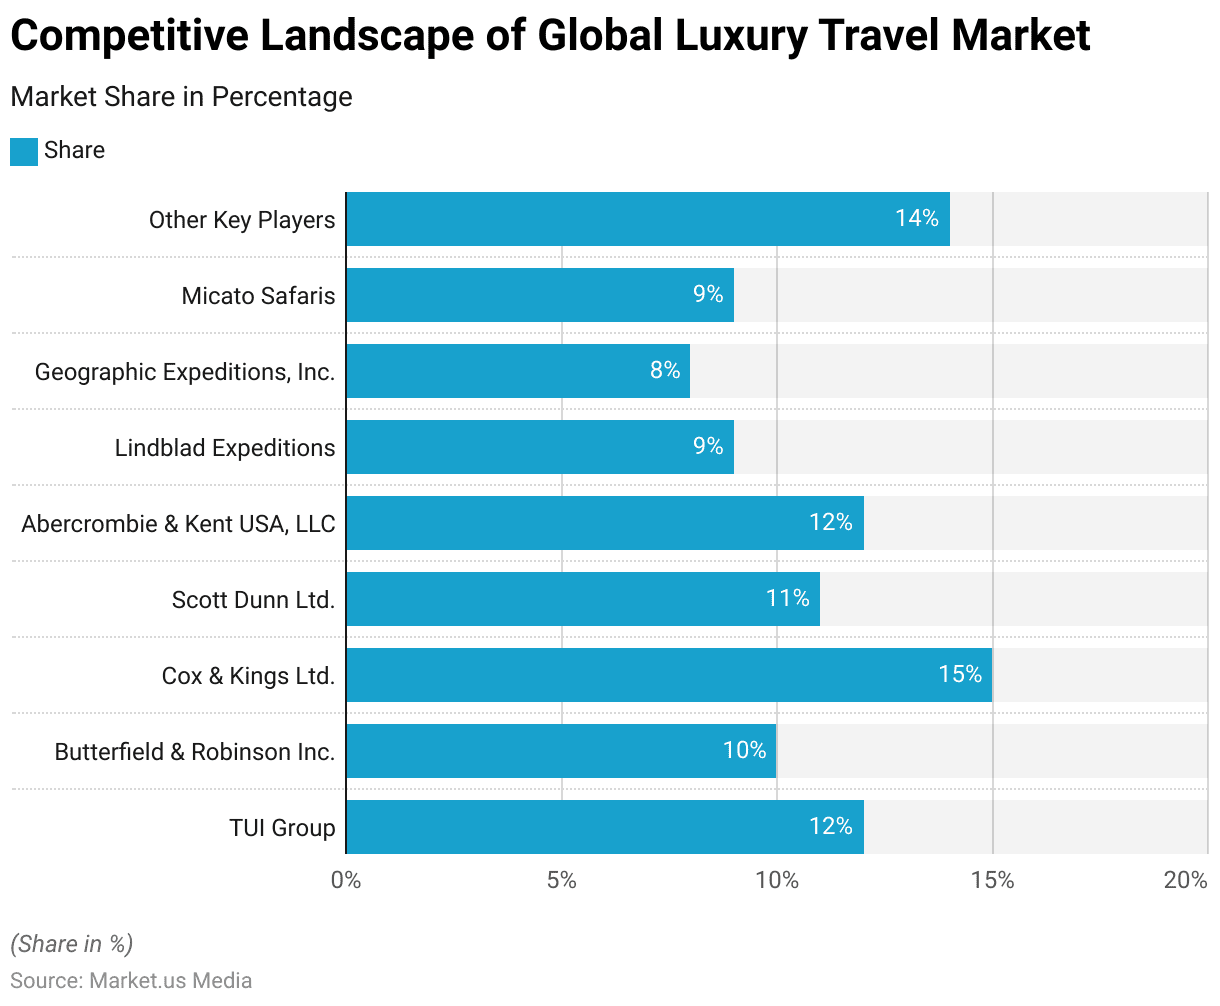
- Several key players with varying market shares characterize the global luxury travel market.
- Cox & Kings Ltd. holds the largest share at 15%, making it a leading company in the sector.
- TUI Group and Abercrombie & Kent USA, LLC each command a 12% share, indicating their strong presence in the market.
- Scott Dunn Ltd. follows with an 11% market share, while Butterfield & Robinson Inc. holds 10%.
- Lindblad Expeditions and Micato Safaris each account for 9% of the market. Closely followed by Geographic Expeditions, Inc., with an 8% share.
- The remaining 14% of the market is distributed among other key players. Highlighting the competitive landscape of the luxury travel industry.
(Source: market.us)
Regional Analysis of the Global Luxury Travel Market Statistics
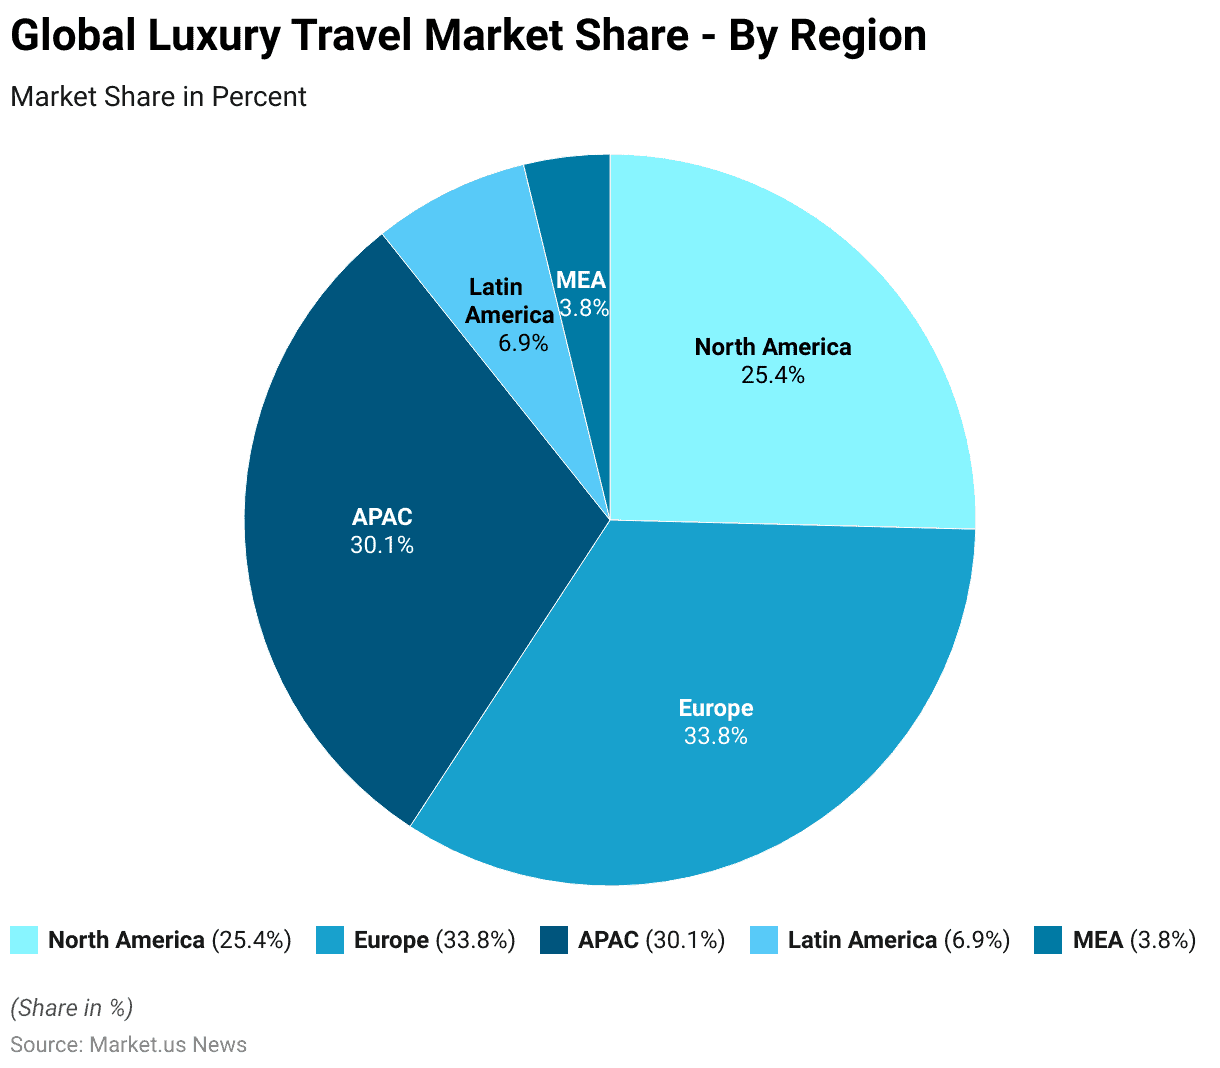
- Several key regions dominate the global luxury travel market, each contributing a significant share.
- Europe leads the market with a 33.8% share, reflecting its strong position as a premier destination for luxury travel.
- The Asia-Pacific (APAC) region follows closely with 30.1%, highlighting its growing influence and appeal in the luxury travel sector.
- North America accounts for 25.4% of the market, underscoring its robust demand and developed infrastructure for high-end travel experiences.
- Latin America holds a smaller portion of the market at 6.9%. While the Middle East and Africa (MEA) region contributes 3.8%. Indicating more modest participation in the global luxury travel market.
(Source: market.us)
Tourism & Luxury Travel Users Worldwide Statistics
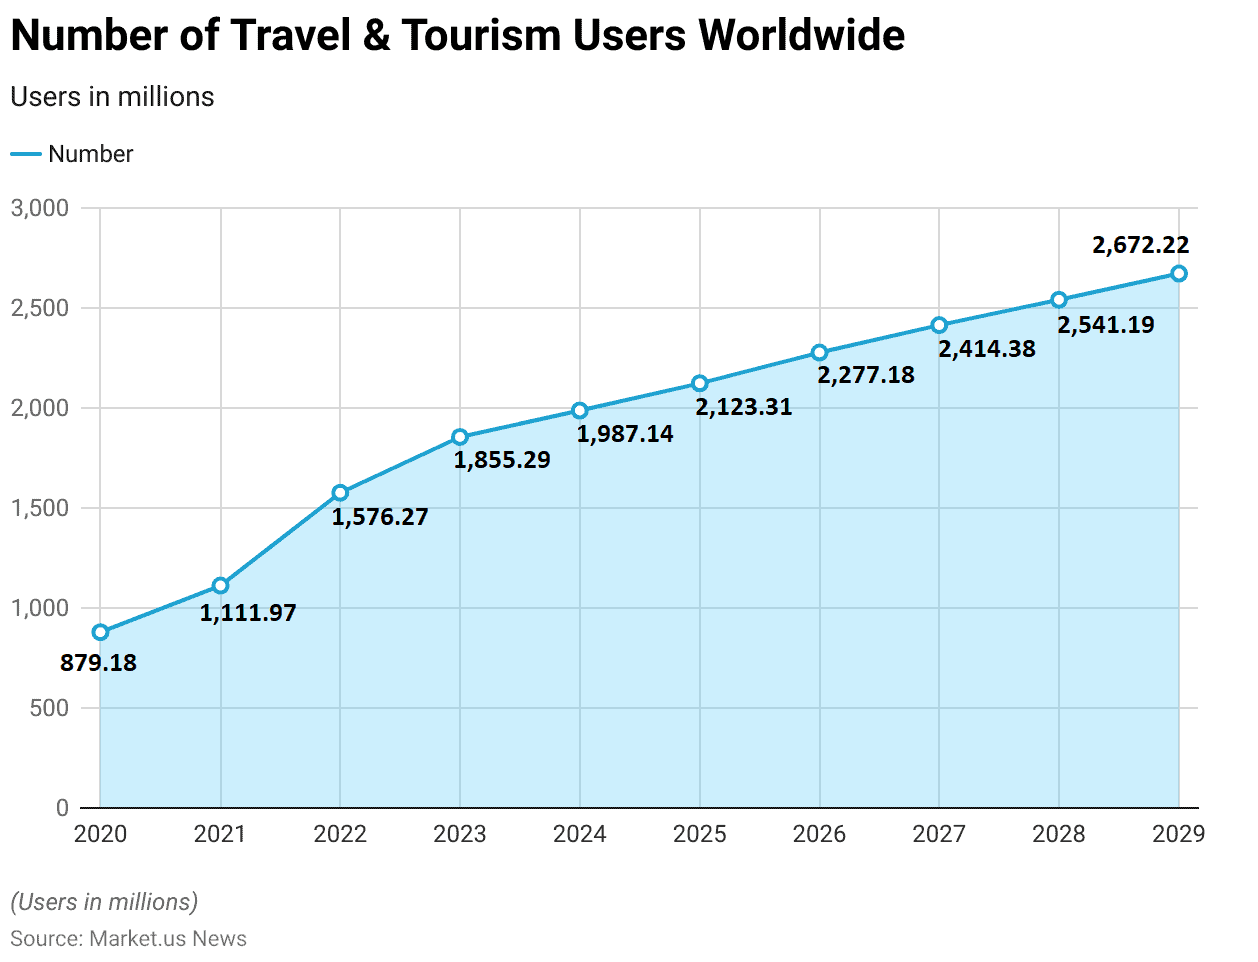
- The number of users in the global travel and tourism sector is projected to witness significant growth from 2020 to 2029.
- In 2020, the sector had approximately 879.18 million users worldwide.
- This number increased to 1,111.97 million in 2021, reflecting a strong recovery following the pandemic.
- The growth trend continued into 2022, with the user base expanding to 1,576.27 million.
- By 2023, the number of users is expected to reach 1,855.29 million.
- The upward trajectory is anticipated to persist in the coming years. The user count is forecasted to rise to 1,987.14 million in 2024 and further to 2,123.31 million in 2025.
- This growth is expected to continue through the latter half of the decade. With 2,277.18 million users projected for 2026, 2,414.38 million in 2027, and 2,541.19 million in 2028.
- By 2029, the global travel and tourism sector is expected to serve approximately 2,672.22 million users. Indicating robust and sustained growth in user engagement across the industry.
(Source: Statista)
Luxury Tourism Revenue of Trending Travel Destinations Statistics
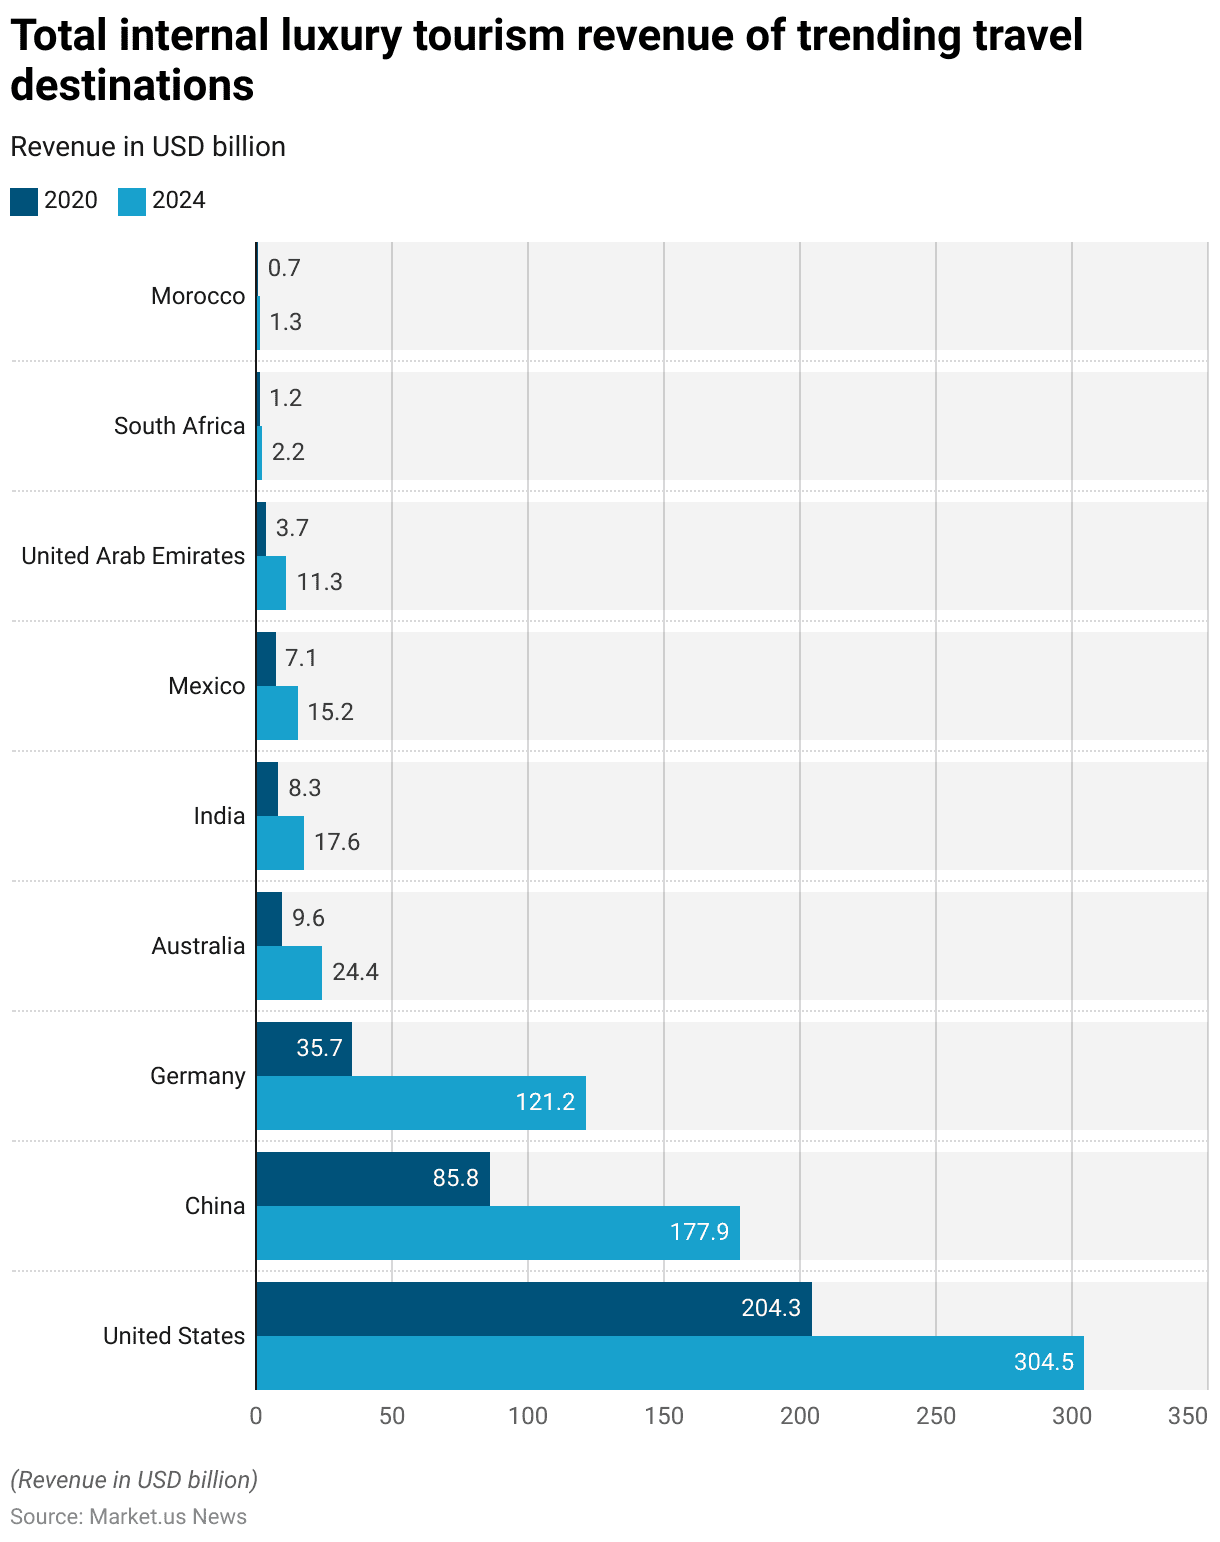
- The internal luxury tourism revenue of several key countries is projected to see significant growth between 2020 and 2024.
- The United States is expected to maintain its leadership position. With revenue increasing from $204.3 billion in 2020 to $304.5 billion in 2024.
- China is also anticipated to experience substantial growth. With its revenue rising from $85.8 billion in 2020 to $177.9 billion in 2024.
- Germany’s luxury tourism revenue is projected to grow from $35.7 billion in 2020 to $121.2 billion in 2024, indicating a strong expansion in this sector.
- Australia is expected to see its revenue increase from $9.6 billion in 2020 to $24.4 billion in 2024.
- India and Mexico are also forecasted to nearly double their revenues. With India growing from $8.3 billion to $17.6 billion and Mexico from $7.1 billion to $15.2 billion.
- The United Arab Emirates is expected to triple its revenue from $3.7 billion in 2020 to $11.3 billion in 2024.
- South Africa and Morocco, although starting from a lower base, are also projected to see growth. South Africa increased from $1.2 billion to $2.2 billion and Morocco from $0.7 billion to $1.3 billion during the same period.
- This growth across various countries highlights the expanding market for luxury tourism worldwide.
(Source: Statista)
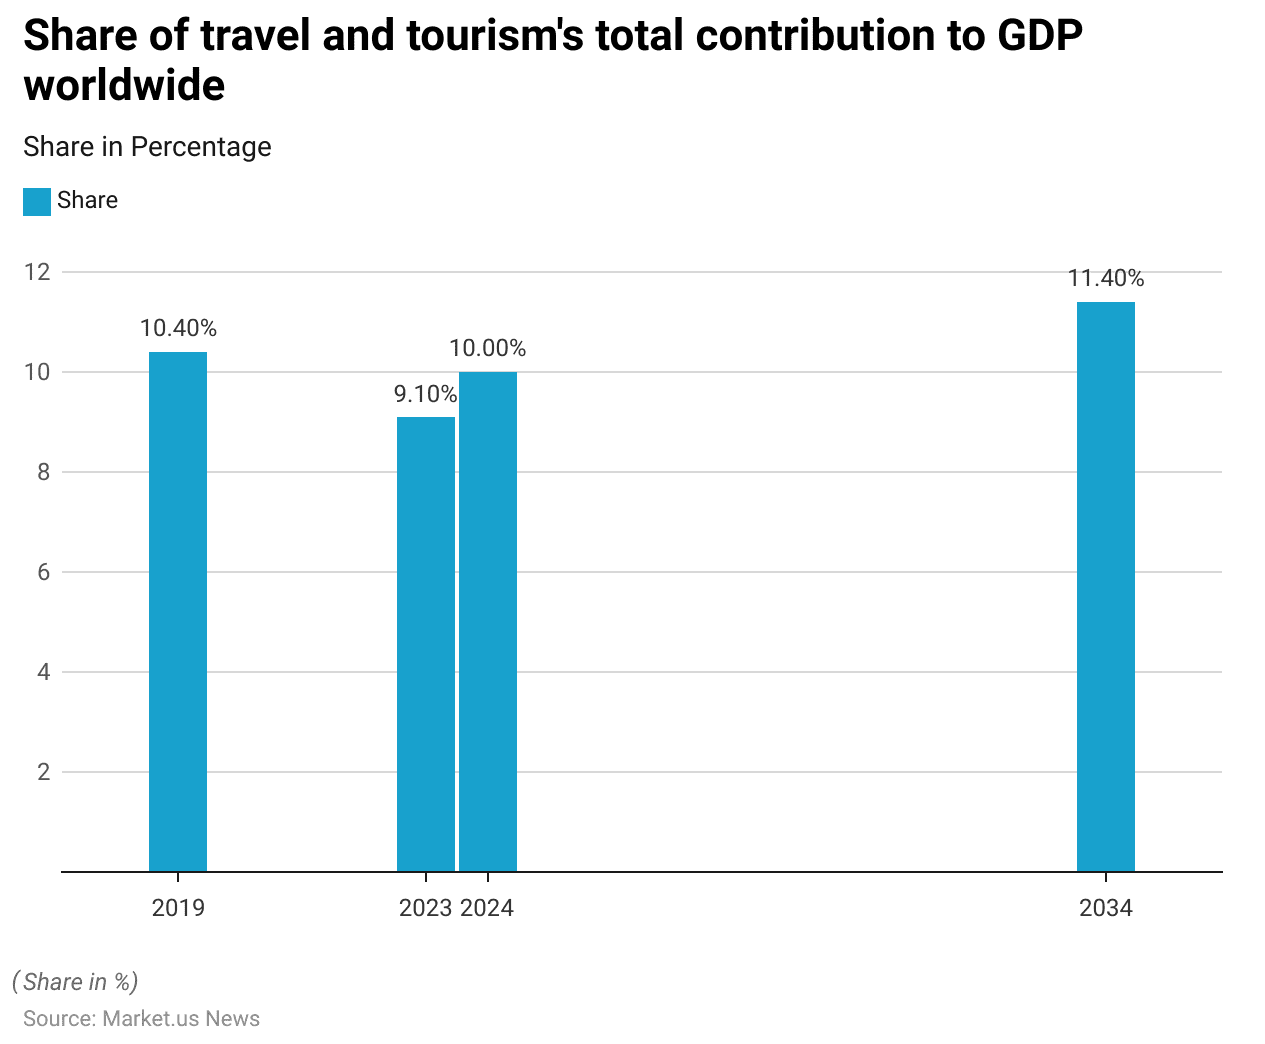
- The contribution of the travel and tourism sector to global GDP has experienced some fluctuations over recent years and is projected to evolve in the coming decade.
- In 2019, the sector contributed 10.4% to the global GDP, reflecting its significant impact on the global economy.
- However, by 2023, this share is expected to decrease to 9.1%. Likely due to the lingering effects of the COVID-19 pandemic and other economic challenges.
- Looking forward, the sector is forecasted to rebound. Its contribution to GDP is expected to rise to 10% by 2024, signaling a recovery and a return to pre-pandemic levels.
- By 2034, the share of GDP from travel and tourism is projected to increase further to 11.4%. Indicating strong growth and the expanding role of this sector in the global economy over the next decade.
Luxury Travel and Tourism Employment Worldwide Statistics
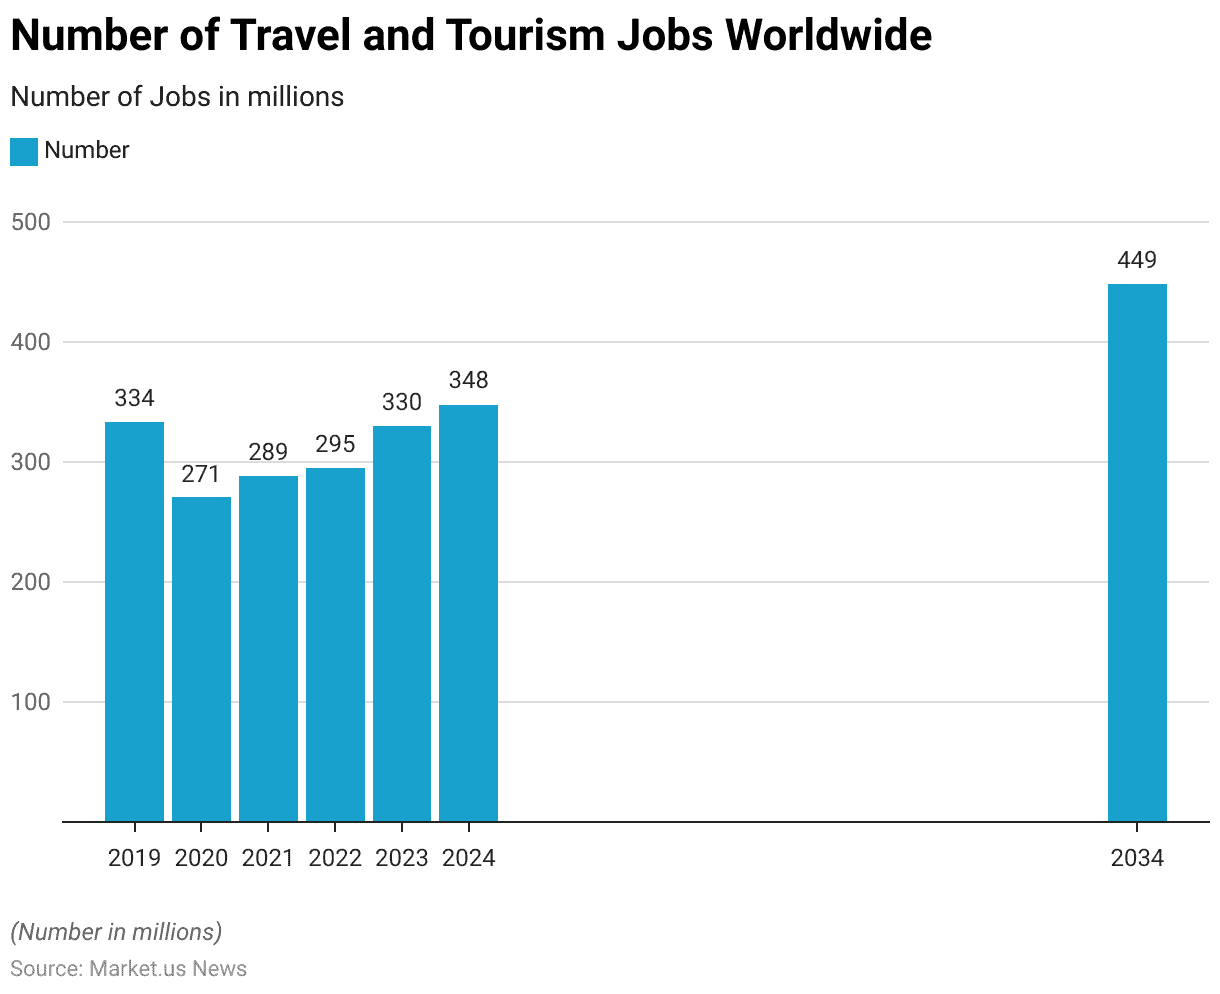
- The global travel and tourism sector has experienced fluctuations in employment over recent years, with significant changes anticipated in the future.
- In 2019, the sector provided 334 million jobs worldwide.
- However, the COVID-19 pandemic led to a sharp decline in 2020, with the number of jobs dropping to 271 million.
- A gradual recovery began in 2021, with employment rising to 289 million and continued into 2022 with 295 million jobs.
- By 2023, the number of jobs in the travel and tourism sector is expected to return to pre-pandemic levels, reaching 330 million nearly.
- The employment growth is projected to continue in 2024, with 348 million jobs anticipated.
- Looking further ahead, the sector is forecasted to see substantial growth in employment by 2034, with the number of jobs expected to rise to 449 million.
- This trend underscores the sector’s resilience and its critical role in global employment. With a strong recovery and expansion projected over the next decade.
(Source: Statista)
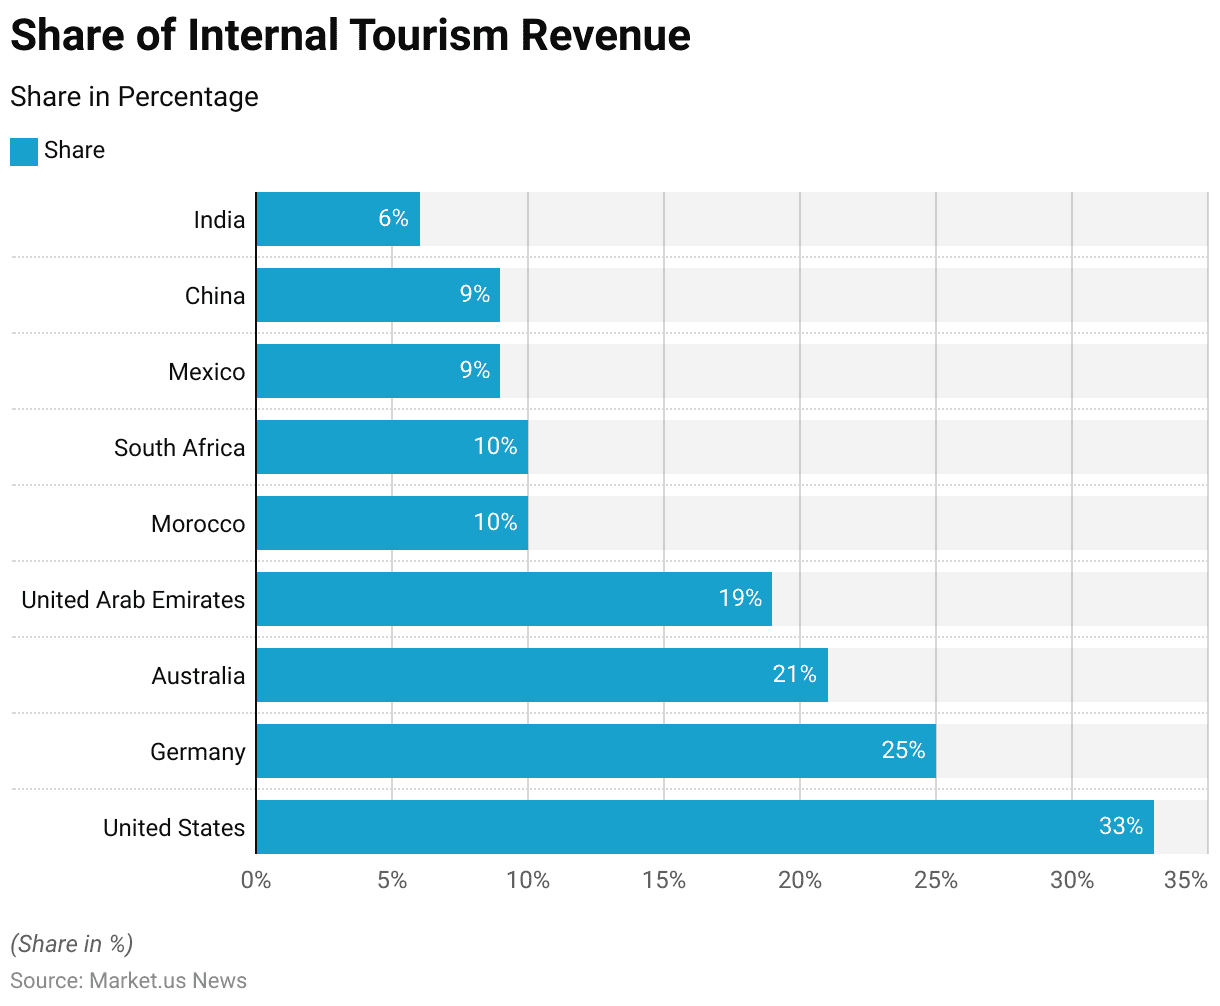
- In 2020, luxury tourism represented a significant portion of the total internal tourism revenue in several key countries.
- The United States led the way, with luxury tourism accounting for 33% of its internal tourism revenue. Underscoring the country’s strong market for high-end travel experiences.
- Germany followed with 25%, indicating a robust luxury tourism sector.
- Australia also had a substantial share, with luxury tourism contributing 21% to its total internal tourism revenue.
- The United Arab Emirates saw 19% of its internal tourism revenue generated from luxury tourism, reflecting its appeal as a luxury destination.
- Both Morocco and South Africa reported that 10% of their tourism revenue came from the luxury segment, highlighting their growing presence in this market.
- Mexico and China each had 9% of their internal tourism revenue attributed to luxury tourism. While India had a smaller share, with luxury tourism accounting for 6% of its total tourism revenue.
- These figures illustrate the varying degrees to which luxury tourism contributes to the overall tourism industry across different countries.
(Source: Statista)
Internal Luxury Tourism Revenue Growth
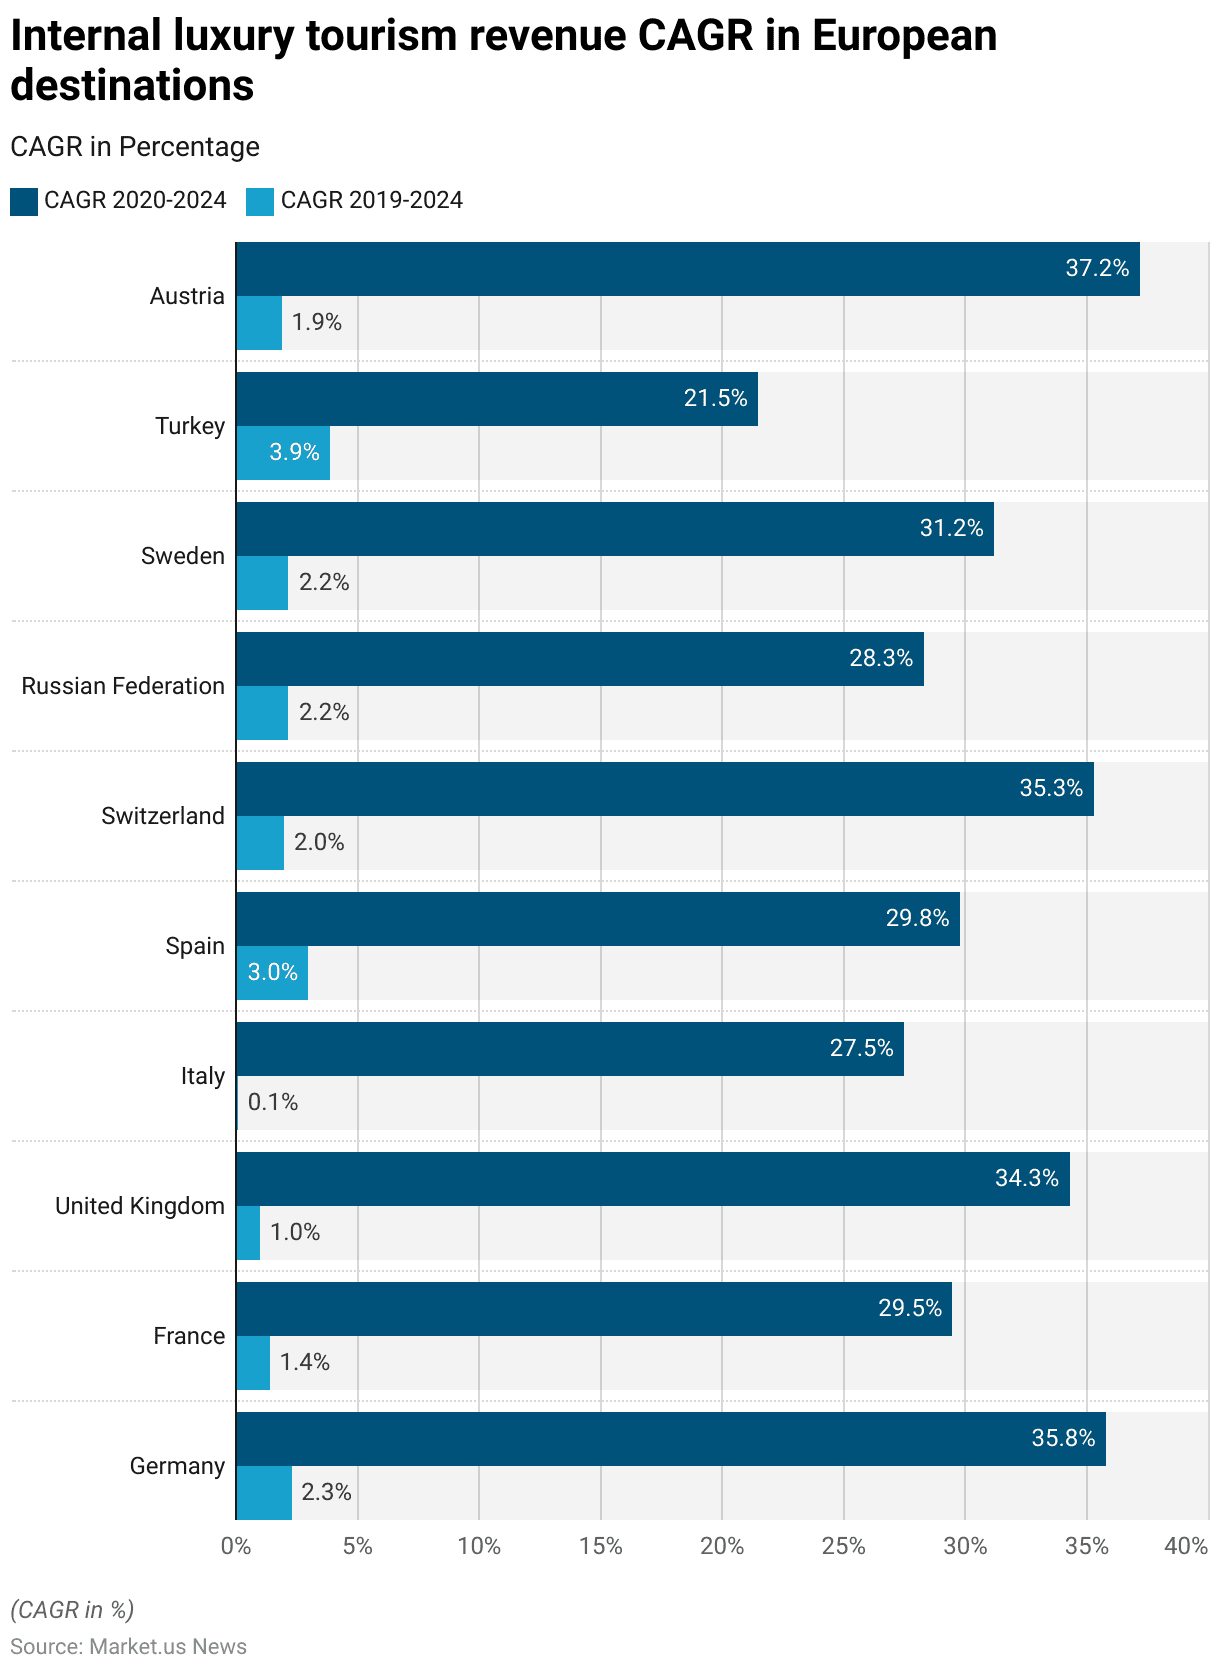
- The compound annual growth rate (CAGR) of total internal luxury tourism revenue in various European luxury travel destinations from 2020 to 2024 shows a significant increase compared to the period from 2019 to 2024.
- Germany is projected to experience a remarkable CAGR of 35.80% between 2020 and 2024. A stark contrast to the modest 2.30% CAGR expected from 2019 to 2024.
- Similarly, France is expected to see its luxury tourism revenue grow at a CAGR of 29.50% during 2020–2024. Compared to just 1.40% over the longer 2019-2024 period.
- The United Kingdom also shows a substantial increase, with a 34.30% CAGR from 2020 to 2024, up from a mere 1% when including 2019.
- Italy and Spain are expected to see CAGRs of 27.50% and 29.80%, respectively. For the 2020-2024 period, compared to 0.10% and 3% over 2019-2024.
- Switzerland’s luxury tourism market is projected to grow at a 35.30% CAGR during 2020-2024. Significantly higher than the 2% CAGR for 2019-2024.
- In the Russian Federation and Sweden, the CAGRs for 2020-2024 are expected to be 28.30% and 31.20%, respectively. Both represent a substantial increase compared to their 2019-2024 CAGRs of 2.20%.
- Turkey’s luxury tourism sector is expected to grow at a 21.50% CAGR from 2020 to 2024. Lower than its 3.90% CAGR for the 2019-2024 period.
- Finally, Austria is anticipated to see the highest growth. With a 37.20% CAGR during 2020-2024, compared to 1.90% over 2019-2024.
- These figures reflect a sharp increase in luxury tourism growth across Europe in the years immediately following 2020. Likely driven by a recovery from the COVID-19 pandemic and a resurgence in high-end travel demand.
(Source: Statista)
Distribution of Domestic and International Luxury Tourism Revenue in Total Internal Luxury Tourism Revenue in Trending Luxury Travel Destinations Statistics
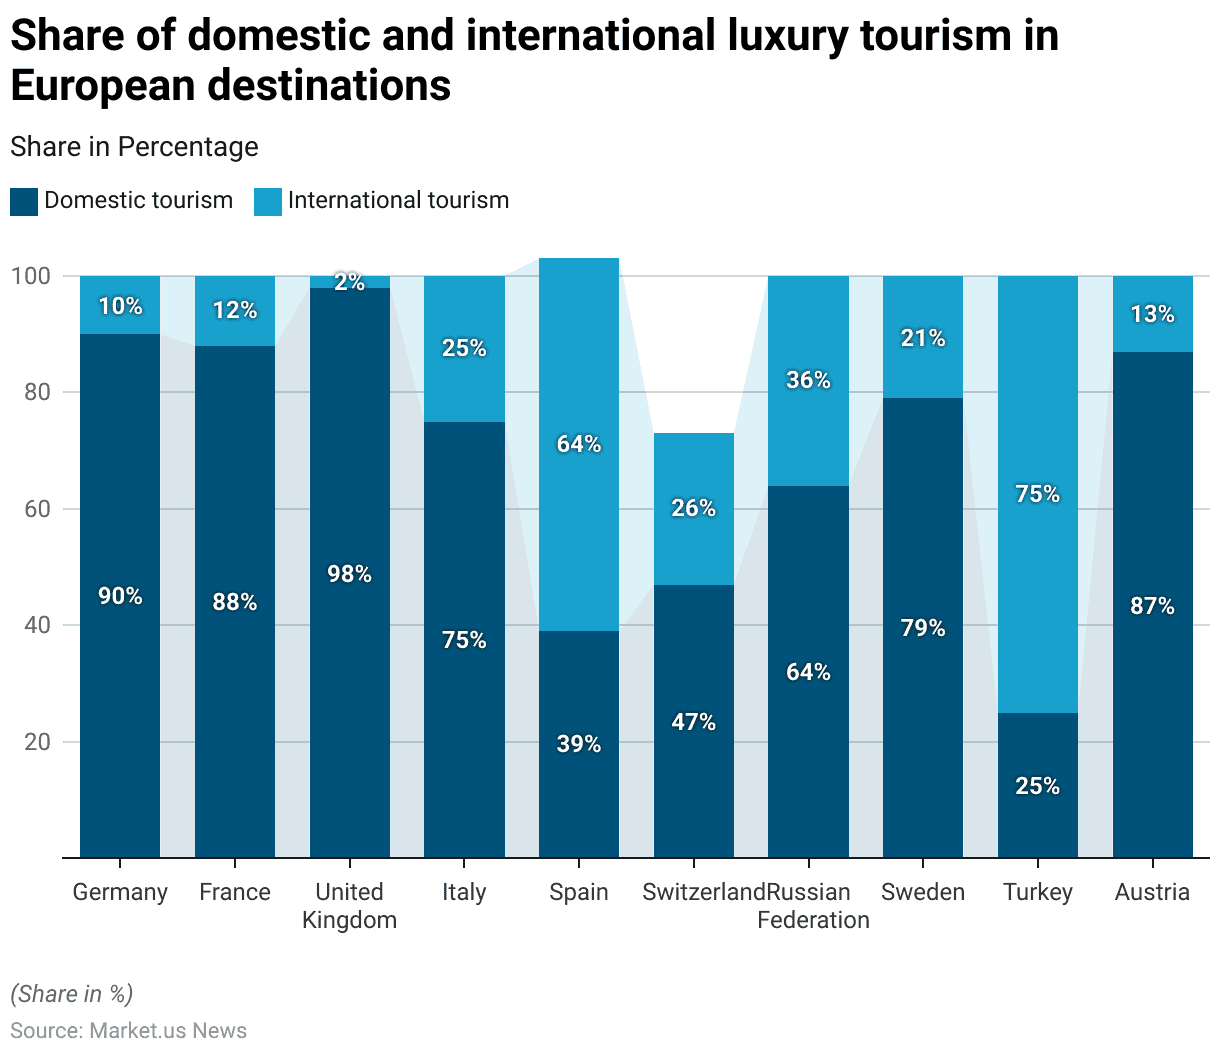
- In 2020, the distribution of domestic and international luxury tourism revenue varied significantly across European countries.
- In Germany, domestic tourism dominated, accounting for 90% of the total internal luxury tourism revenue, with international tourism contributing just 10%.
- Similarly, France and Austria saw domestic tourism comprising 88% and 87% of their luxury tourism revenue, respectively, with international tourism making up 12% and 13%.
- The United Kingdom had an even higher reliance on domestic luxury tourism, with 98% of the revenue coming from domestic tourists and only 2% from international visitors.
- Conversely, Italy had a more balanced distribution, with 75% of luxury tourism revenue from domestic sources and 25% from international tourists.
- Spain and Turkey stood out for their heavy reliance on international tourism. In Spain, 64% of luxury tourism revenue came from international visitors, while in Turkey. This figure was even higher at 75%, leaving only 25% of the revenue from domestic tourists.
- Switzerland and the Russian Federation had a more moderate distribution, with domestic tourism accounting for 47% and 64% of the luxury tourism revenue, respectively, and international tourism contributing 26% and 36%.
- In Sweden, domestic tourists accounted for 79% of luxury tourism revenue, with the remaining 21% from international visitors.
- These variations highlight the differing reliance on domestic versus international tourism across European luxury travel destinations. With some countries heavily dependent on their domestic markets. In contrast, others derive significant revenue from international travelers.
(Source: Statista)
Consumer Demographics
Age
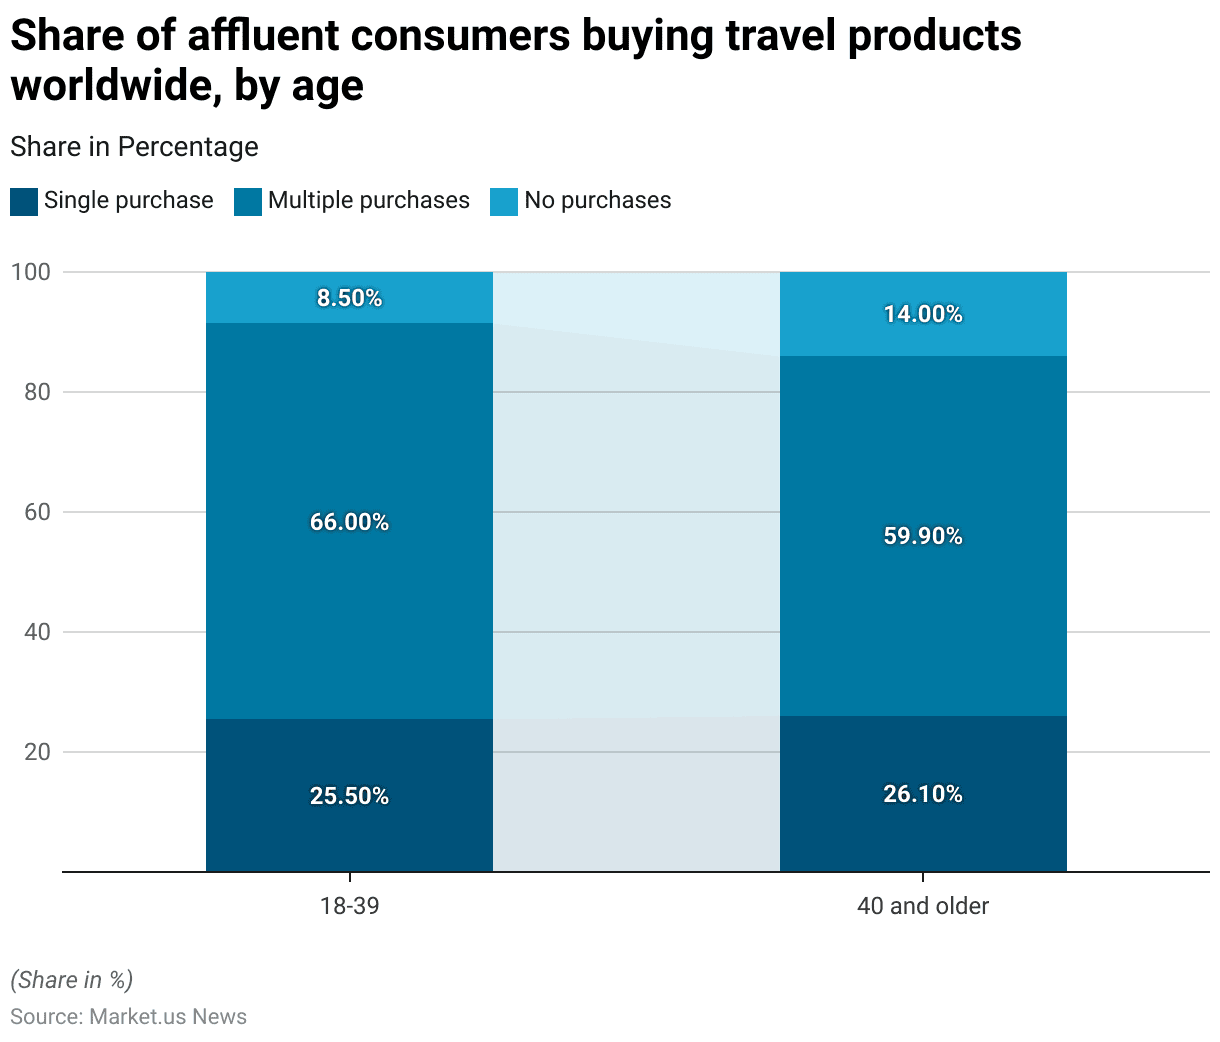
- As of the fourth quarter of 2023, the purchasing behavior of affluent consumers in the travel market showed distinct patterns based on age groups.
- Among consumers aged 18-39, 66% made multiple purchases of travel products. While 25.5% made a single purchase, and only 8.5% did not make any purchases.
- In comparison, consumers aged 40 and older exhibited slightly different behavior. With 59.9% making multiple purchases and 26.1% making a single purchase.
- A higher proportion of this older age group, 14%, did not purchase any travel products.
- These figures highlight that younger affluent consumers are more likely to engage in multiple travel purchases. In comparison, a higher percentage of older consumers either made single purchases or refrained from purchasing travel products altogether.
(Source: Statista)
Gender
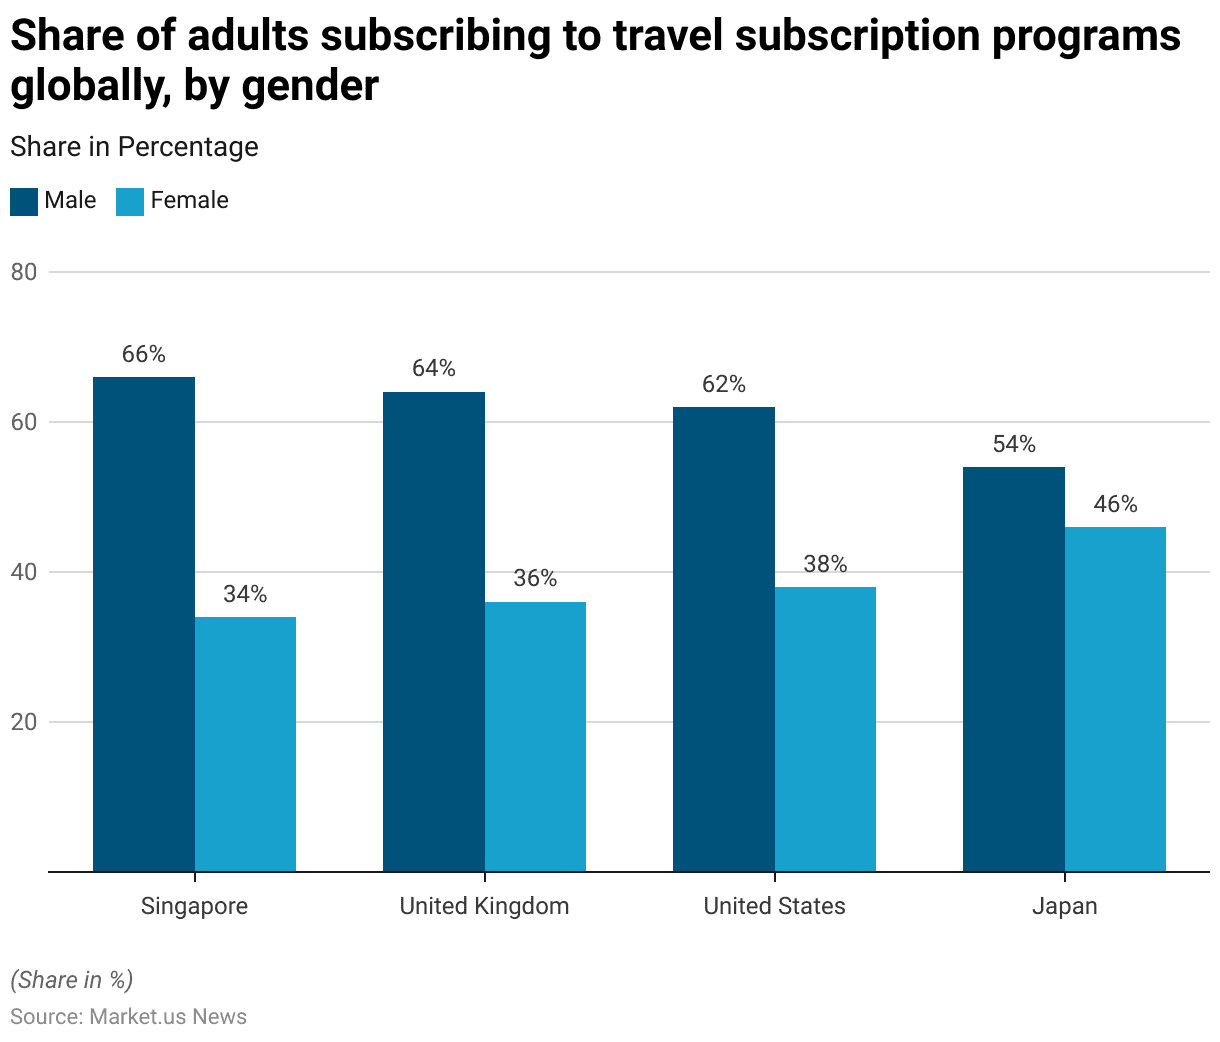
- As of November 2021, the distribution of adults who subscribed to travel-related paid subscription programs or services varied by gender across selected countries.
- In Singapore, 66% of subscribers were male, while 34% were female.
- Similarly, in the United Kingdom, 64% of subscribers were male, compared to 36% female.
- The United States showed a slightly narrower gap, with 62% of subscribers being male and 38% female.
- Japan had the most balanced distribution among the countries listed, with 54% male subscribers and 46% female.
- These figures suggest that, in general, men were more likely than women to subscribe to travel-related paid services across these countries. With the gender gap being most pronounced in Singapore and the United Kingdom.
(Source: Statista)
Race/ Ethnicity
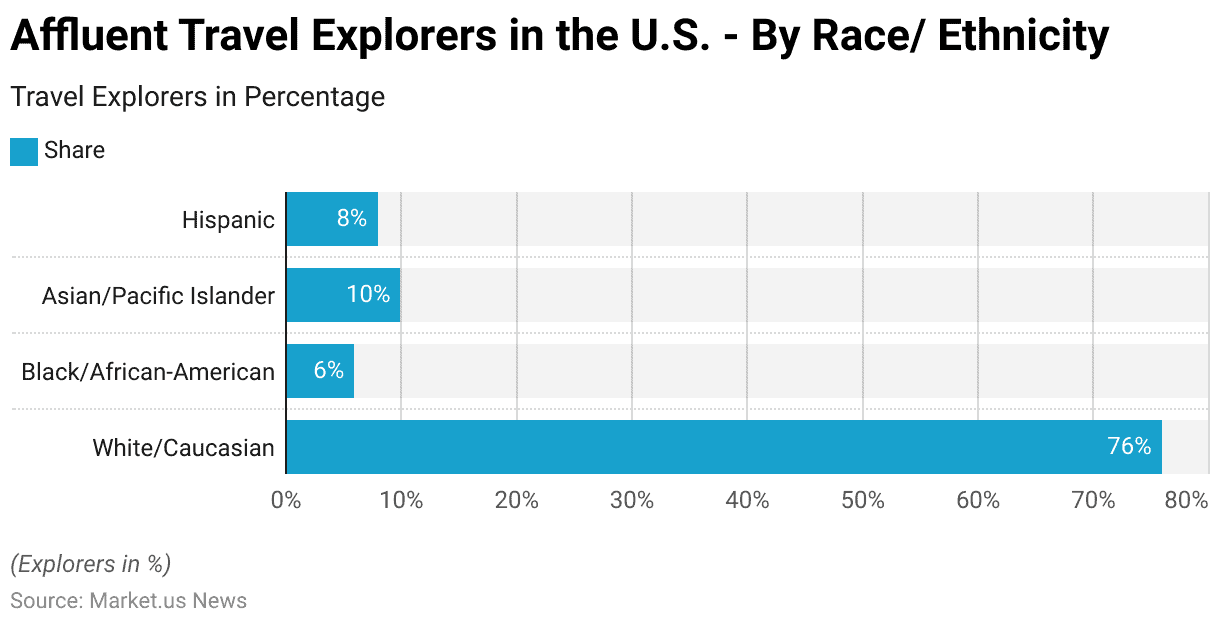
- Among affluent travel explorers in the United States, the distribution by race and ethnicity shows a significant majority of respondents identifying as White/Caucasian, who make up 76% of this group.
- Asian/Pacific Islanders represent 10% of affluent travel explorers, while Hispanic individuals account for 8%.
- Black/African-American respondents constitute 6% of the group.
- This data indicates that the majority of affluent travelers in the U.S. are White/Caucasian. With smaller but notable representations from other racial and ethnic groups.
(Source: Ipsos)
International Luxury Travel Statistics
Number of International Tourist Arrivals Worldwide
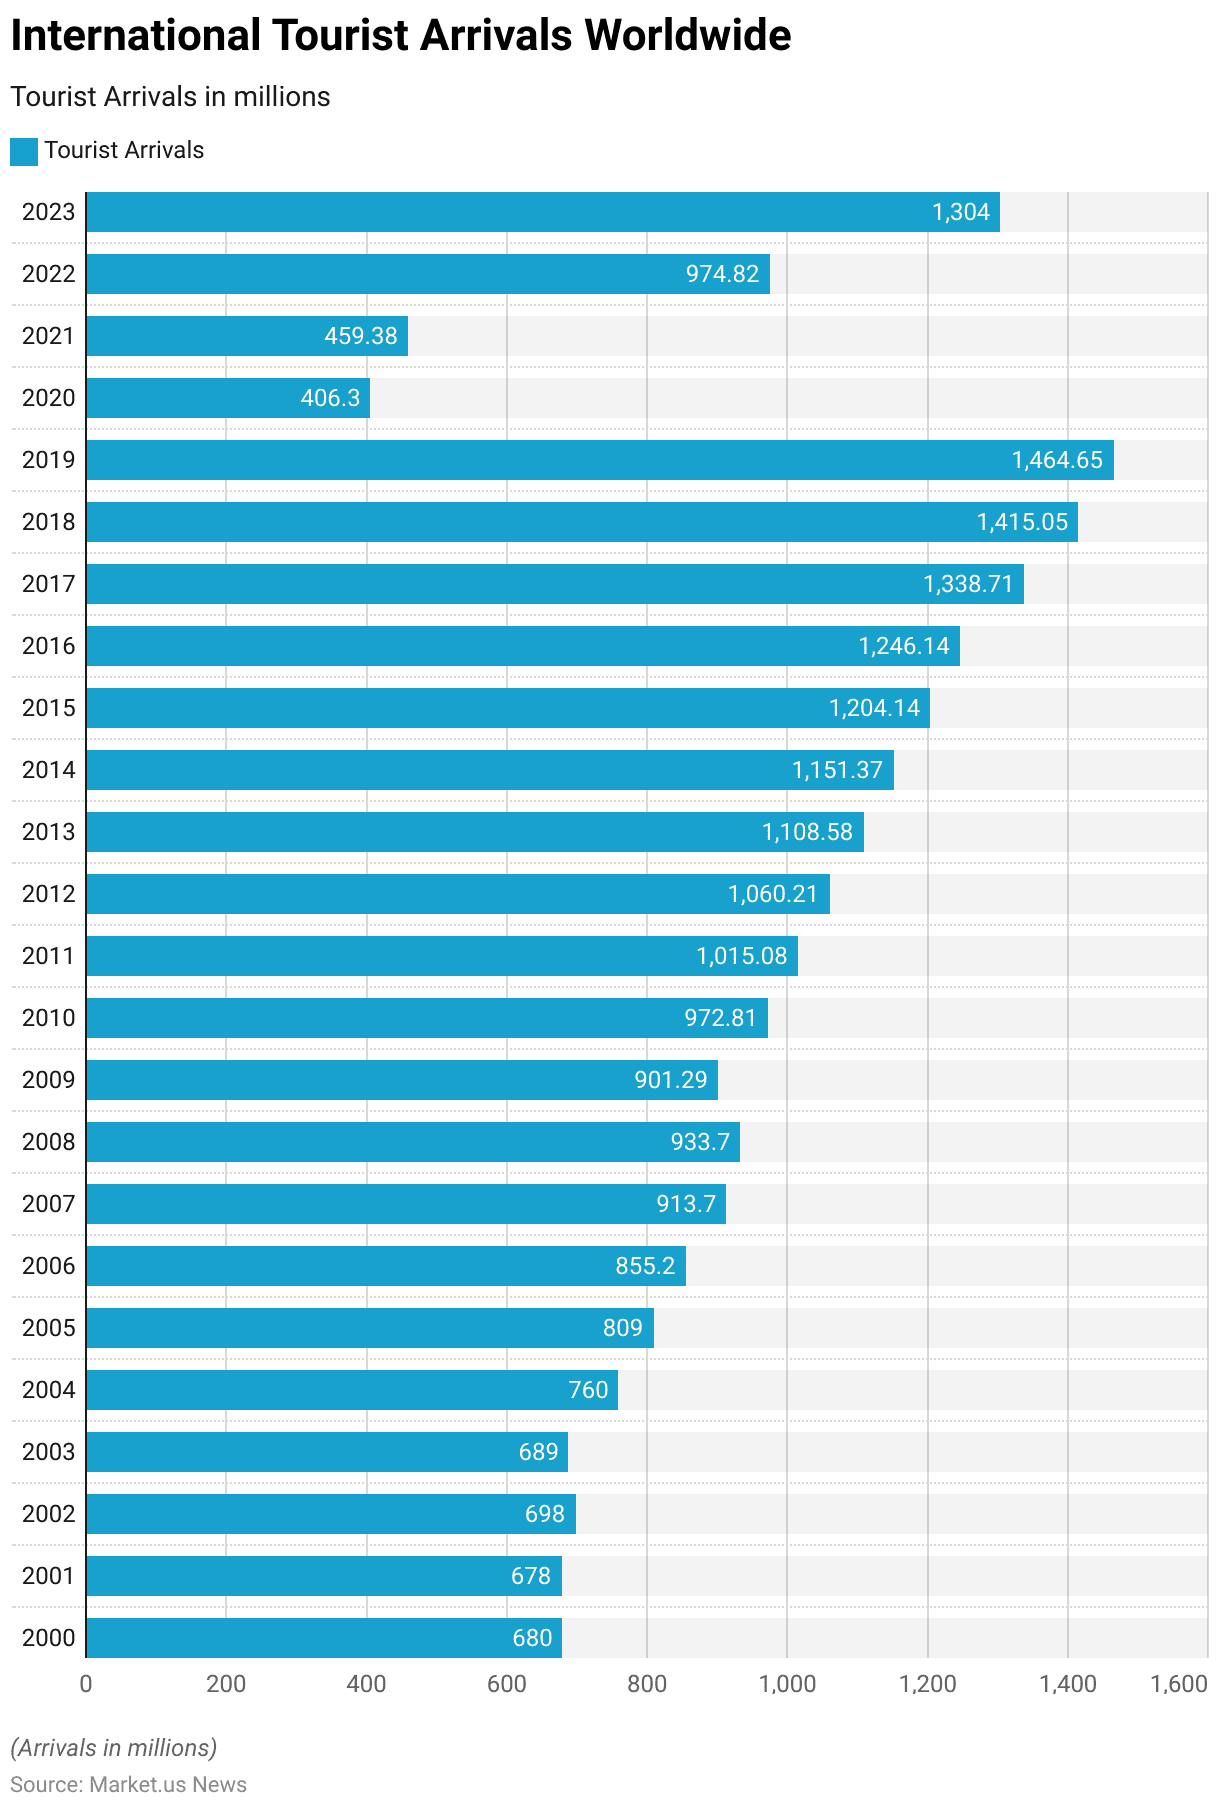
- The trend of international tourist arrivals worldwide has shown significant growth over the past two decades, with notable fluctuations due to global events.
- In 2000, there were 680 million international tourist arrivals, a figure that remained relatively stable in 2001 at 678 million.
- The early 2000s saw gradual increases, with arrivals reaching 698 million in 2002 and 689 million in 2003. A significant jump occurred in 2004, with 760 million arrivals, and this upward trend continued, reaching 809 million in 2005 and 855.2 million in 2006.
- The growth persisted through the late 2000s, with international arrivals reaching 913.7 million in 2007 and 933.7 million in 2008.
- However, the global financial crisis led to a slight decline in 2009, with arrivals dropping to 901.29 million. The recovery was swift, with 972.81 million arrivals in 2010, and the numbers continued to rise steadily, surpassing 1 billion for the first time in 2012 with 1,060.21 million arrivals.
- From 2013 to 2019, the number of international tourist arrivals continued to increase, reaching 1,108.58 million in 2013, 1,151.37 million in 2014, and 1,204.14 million in 2015.
- This growth trend continued, with 1,246.14 million arrivals in 2016, 1,338.71 million in 2017, 1,415.05 million in 2018, and peaking at 1,464.65 million in 2019.
- The COVID-19 pandemic had a dramatic impact on international tourism, with arrivals plummeting to 406.3 million in 2020, the lowest in decades. A modest recovery began in 2021, with 459.38 million arrivals, and accelerated in 2022 with 974.82 million.
- By 2023, international tourist arrivals had rebounded significantly to 1,304 million, reflecting the ongoing recovery of global tourism following the pandemic.
(Source: Statista)
Number of International Tourist Arrivals – By Region
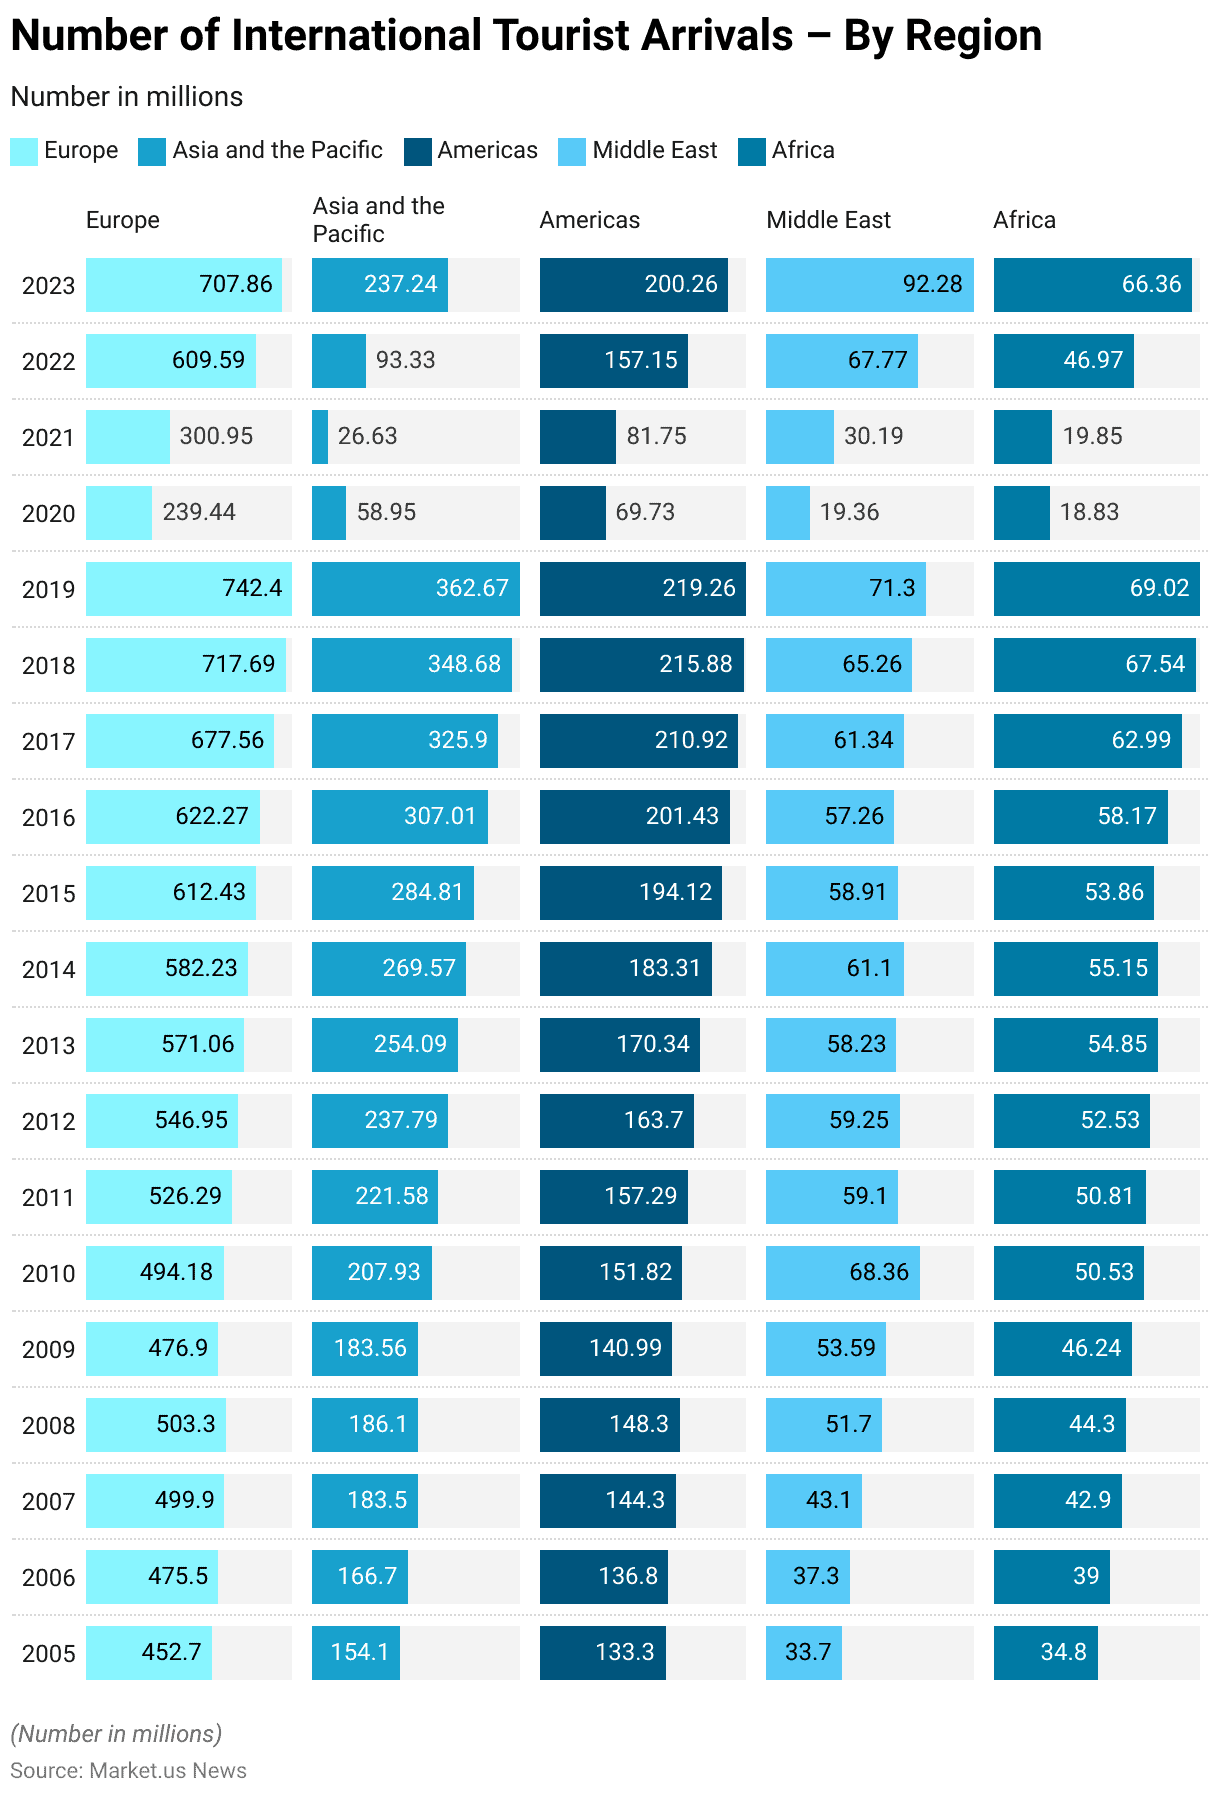
- The number of international tourist arrivals worldwide from 2005 to 2023 reveals significant trends and fluctuations across different regions.
- In 2005, Europe was the leading region with 452.7 million arrivals, followed by Asia and the Pacific with 154.1 million, the Americas with 133.3 million, the Middle East with 33.7 million, and Africa with 34.8 million.
- Over the next several years, Europe continued to dominate, reaching 742.4 million arrivals in 2019, while Asia and the Pacific saw substantial growth, increasing from 154.1 million in 2005 to 362.67 million in 2019. The Americas also experienced steady growth, reaching 219.26 million arrivals by 2019.
- The Middle East and Africa, though smaller markets, showed consistent increases, with the Middle East growing from 33.7 million arrivals in 2005 to 71.3 million in 2019 and Africa increasing from 34.8 million to 69.02 million during the same period.
- The COVID-19 pandemic had a drastic impact on global tourism in 2020, with all regions experiencing significant declines. Europe’s arrivals dropped to 239.44 million, Asia and the Pacific fell to 58.95 million, the Americas to 69.73 million, the Middle East to 19.36 million, and Africa to 18.83 million.
- Recovery began in 2021 and continued into 2022, with Europe rebounding to 609.59 million arrivals, Asia and the Pacific to 93.33 million, the Americas to 157.15 million, the Middle East to 67.77 million, and Africa to 46.97 million.
- By 2023, the recovery had gained further momentum, with Europe reaching 707.86 million arrivals, Asia and the Pacific recovering to 237.24 million, the Americas to 200.26 million, the Middle East to 92.28 million, and Africa to 66.36 million.
- These trends highlight the resilience and recovery of global tourism, particularly in Europe and the Americas, with Asia and the Pacific also making significant strides towards pre-pandemic levels by 2023.
(Source: Statista)
Luxury Travel Destinations Statistics
Luxury Destinations with the Largest Growth in Travel Worldwide Statistics
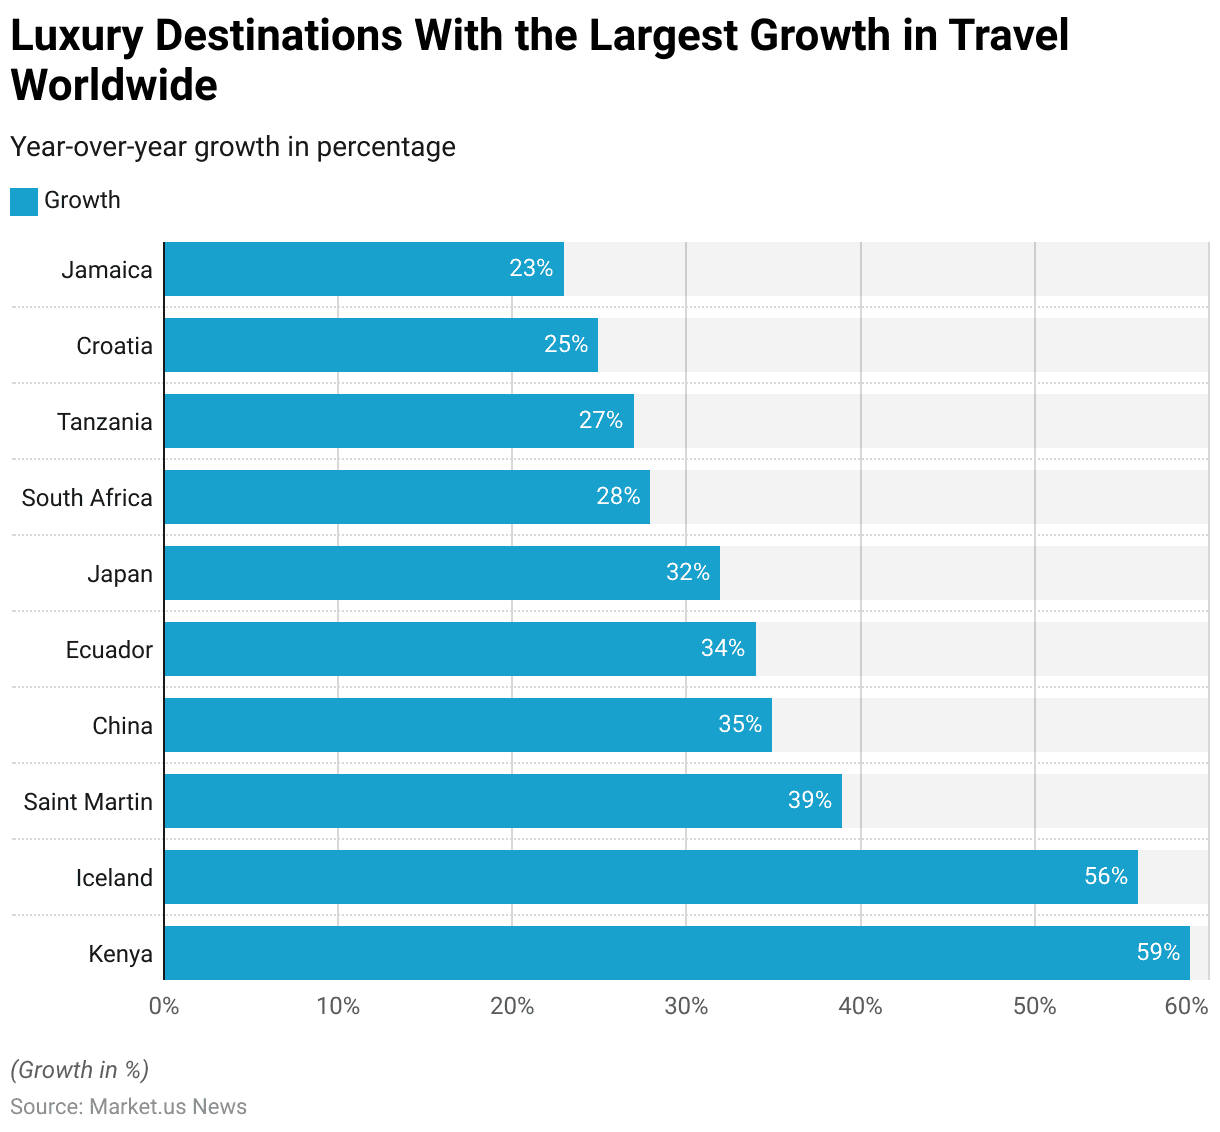
- As of August 2016, several luxury travel destinations around the world experienced significant year-over-year growth in tourism.
- Kenya led the growth with an impressive 59% increase, followed closely by Iceland, which saw a 56% rise in luxury travel.
- Saint Martin also demonstrated substantial growth, with a 39% increase in tourist arrivals.
- China experienced a 35% increase, while Ecuador saw a 34% rise in luxury travel.
- Japan continued to be a popular destination, with a 32% increase in luxury tourism.
- South Africa and Tanzania also showed strong growth, with year-over-year increases of 28% and 27%, respectively.
- Croatia and Jamaica rounded out the list with growth rates of 25% and 23%, highlighting their appeal as emerging luxury travel destinations.
- This data reflects a broader trend of increasing interest in diverse and unique luxury travel experiences across the globe.
(Source: Statista)
Top Luxury Travel Destinations with Increased Global Tourist Demand in Summer Statistics
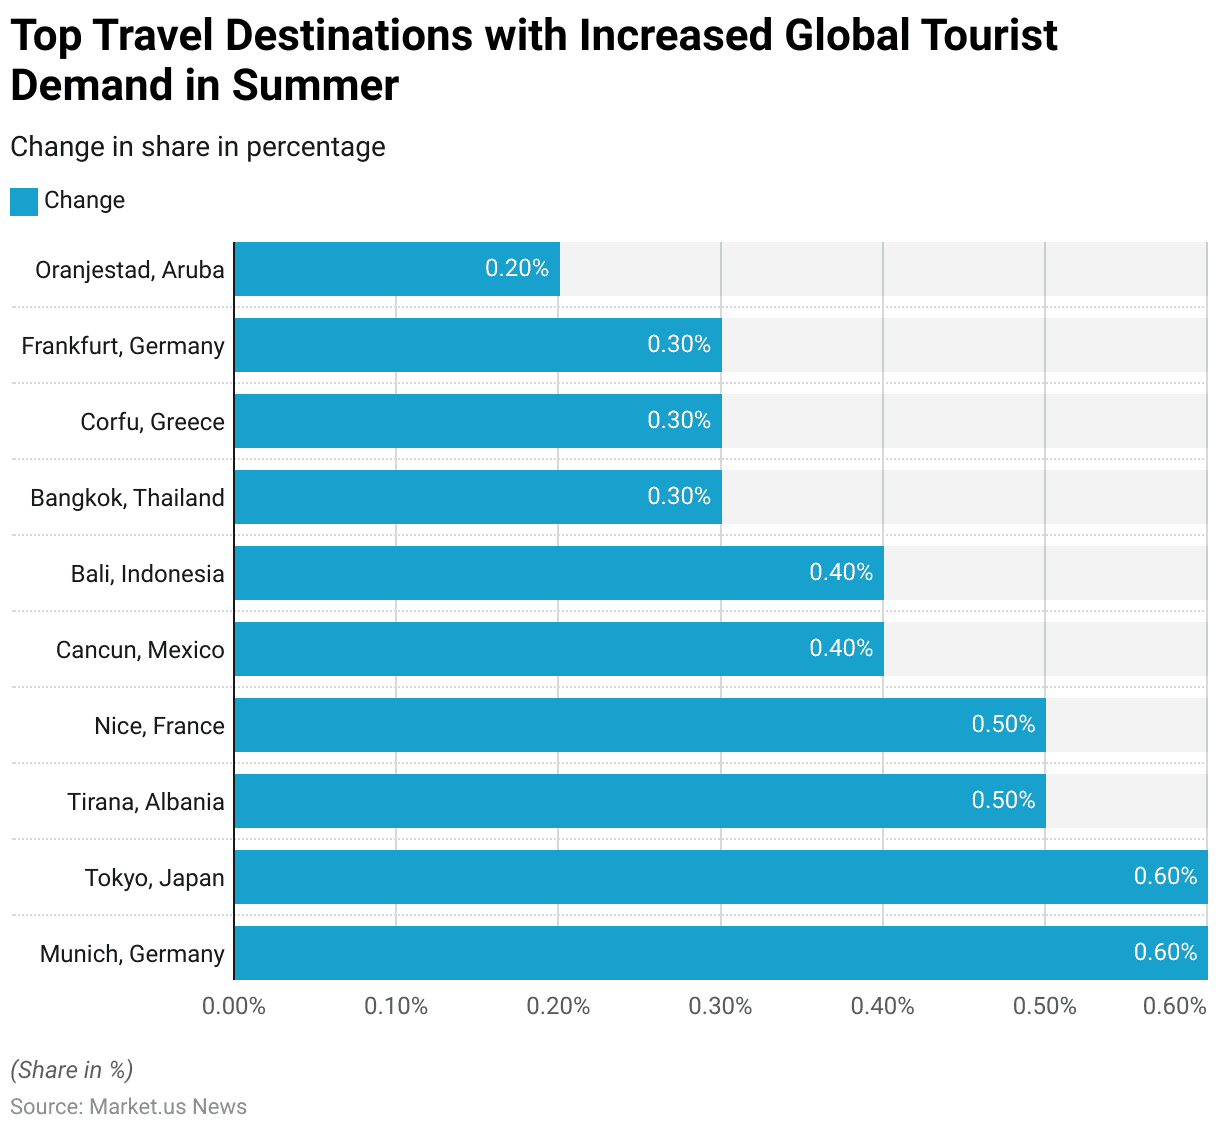
- In the summer of 2024, several cities worldwide experienced notable increases in global tourist demand compared to 2019, as measured by the change in the share of flight bookings.
- Munich, Germany, and Tokyo, Japan, led the way, each seeing a 0.60% increase in their share of flight bookings.
- Tirana, Albania, and Nice, France, followed closely, both with a 0.50% rise.
- Cancun, Mexico, and Bali, Indonesia, each saw a 0.40% increase in flight bookings, reflecting their continued popularity among global travelers.
- Bangkok, Thailand, Corfu, Greece, and Frankfurt, Germany, each experienced a 0.30% increase in tourist demand.
- Finally, Oranjestad, Aruba, saw a 0.20% rise in its share of global flight bookings.
- These changes highlight a resurgence in travel interest across a diverse range of destinations, from well-known cities like Munich and Tokyo to emerging tourist spots such as Tirana and Corfu.
(Source: Statista)
Growth in Travel to The Most Popular Luxury Travel Destinations Worldwide Statistics
- As of August 2014, several luxury travel destinations around the world experienced significant year-over-year growth in visitor numbers.
- Greece led the pack with an impressive 57% increase in travel, marking it as the fastest-growing luxury destination during this period.
- Germany and the United Kingdom also saw substantial growth, with increases of 31% and 30%, respectively.
- France and Spain continued to attract luxury travelers, with France experiencing a 23% increase and Spain a 20% rise in visitor numbers.
- The Netherlands and Mexico also showed strong growth, with year-over-year increases of 18% and 17%, respectively.
- Canada and Italy saw more modest gains, with Canada at 9% and Italy at 6%.
- In contrast to these positive trends, South Africa experienced a 5% decline in luxury travel, indicating a decrease in its attractiveness as a luxury destination during this period.
- Overall, the data reflects a robust expansion in luxury travel across several key destinations, with Greece emerging as a particularly strong performer.
(Source: Statista)
Expensive Holiday Destinations Worldwide
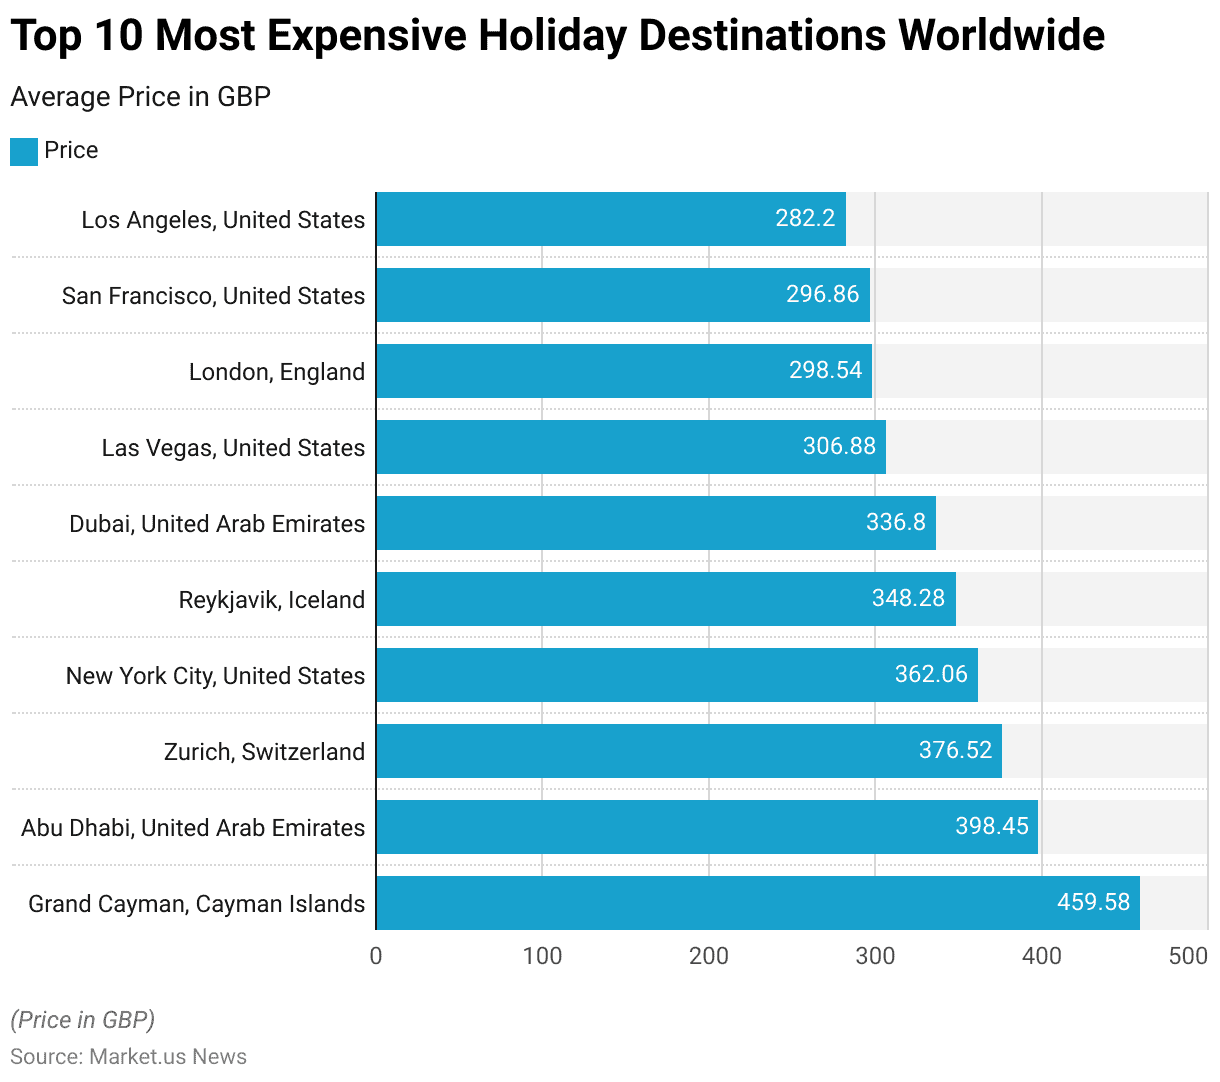
- In 2020, the most expensive holiday destinations worldwide were ranked based on the average price per day in British Pounds (GBP).
- Leading the list was Grand Cayman in the Cayman Islands, where the average daily cost for travelers reached £459.58.
- Abu Dhabi in the United Arab Emirates followed closely with an average price of £398.45 per day.
- Zurich, Switzerland, was another costly destination, with an average daily expense of £376.52, while New York City in the United States came in at £362.06.
- Reykjavik, Iceland, was also among the most expensive, with an average cost of £348.28 per day.
- Dubai in the United Arab Emirates and Las Vegas in the United States had average daily prices of £336.80 and £306.88, respectively.
- London, England, was the most expensive destination in the United Kingdom, with an average daily cost of £298.54.
- Other high-cost destinations in the United States included San Francisco at £296.86 and Los Angeles at £282.20.
- These figures highlight the high costs associated with staying in some of the world’s most popular and luxurious travel destinations in 2020.
(Source: Statista)
Luxury Travel Bookings Statistics
Luxury Tour Booking Activity
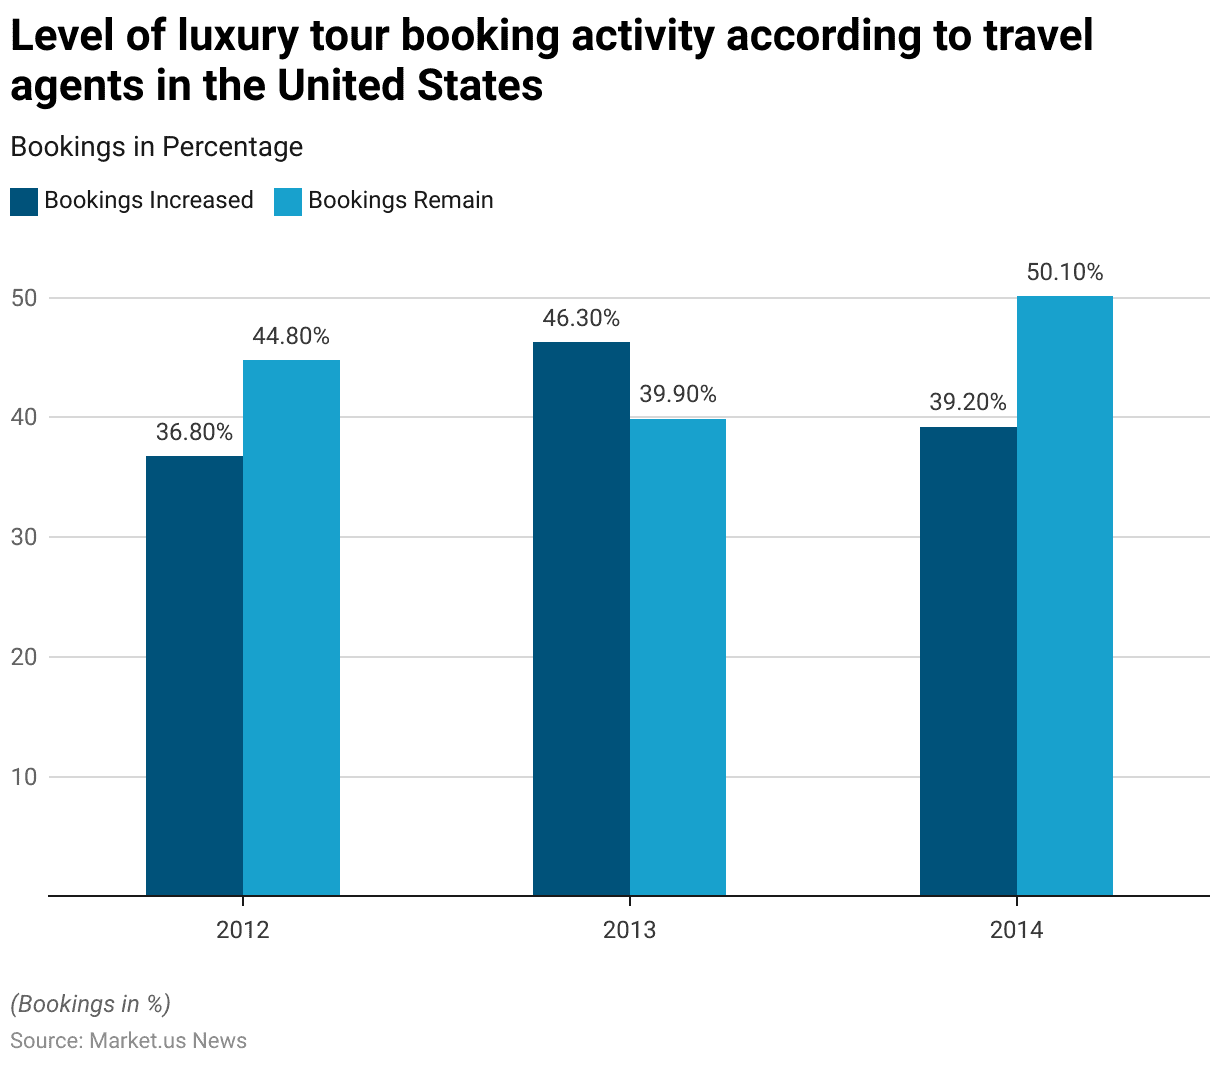
- Between 2012 and 2014, U.S. travel agents observed varying trends in luxury tour booking activity.
- In 2012, 36.8% of agents reported an increase in bookings compared to the previous year, while 44.8% indicated that bookings remained the same.
- The following year, in 2013, there was a notable rise in the percentage of agents reporting increased bookings, reaching 46.3%, although the proportion of agents who observed no change in bookings dropped to 39.9%.
- By 2014, the trend shifted slightly, with 39.2% of agents reporting an increase in luxury tour bookings, a decrease from the previous year.
- Meanwhile, the percentage of agents who observed no change in bookings grew significantly to 50.1%.
- This data reflects a period of fluctuating growth in the luxury travel sector, with some years showing strong increases in booking activity while others saw more stability in the market.
(Source: Statista)
Leading Luxury Travel and Tourism Websites Worldwide Statistics
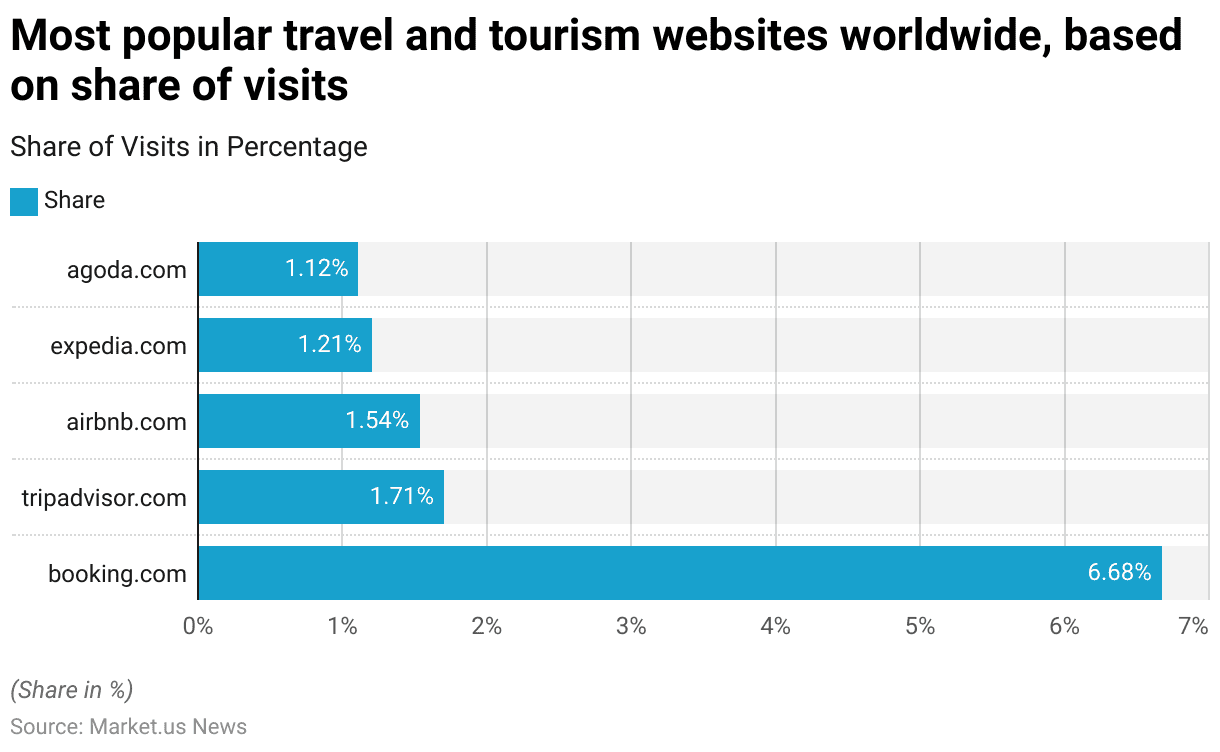
- In April 2023, several travel and tourism websites were leading in popularity based on their share of global visits.
- Booking.com was the most visited website in this sector, commanding 6.68% of all visits, making it the dominant player in the online travel market.
- Tripadvisor.com followed with a 1.71% share, reflecting its continued importance as a resource for travel reviews and planning.
- Airbnb.com also held a significant portion of the market, accounting for 1.54% of visits, indicating its strong presence in the accommodation sector.
- Expedia.com attracted 1.21% of global visits, maintaining its role as a key player in online travel booking.
- Agoda.com, primarily popular in the Asia-Pacific region, garnered 1.12% of the visits, rounding out the top five most popular travel websites.
- These figures highlight the competitive nature of the online travel market, with a few key websites capturing the majority of user traffic.
(Source: Statista)
Most Popular Accommodation Choices of Luxury Travel Clients
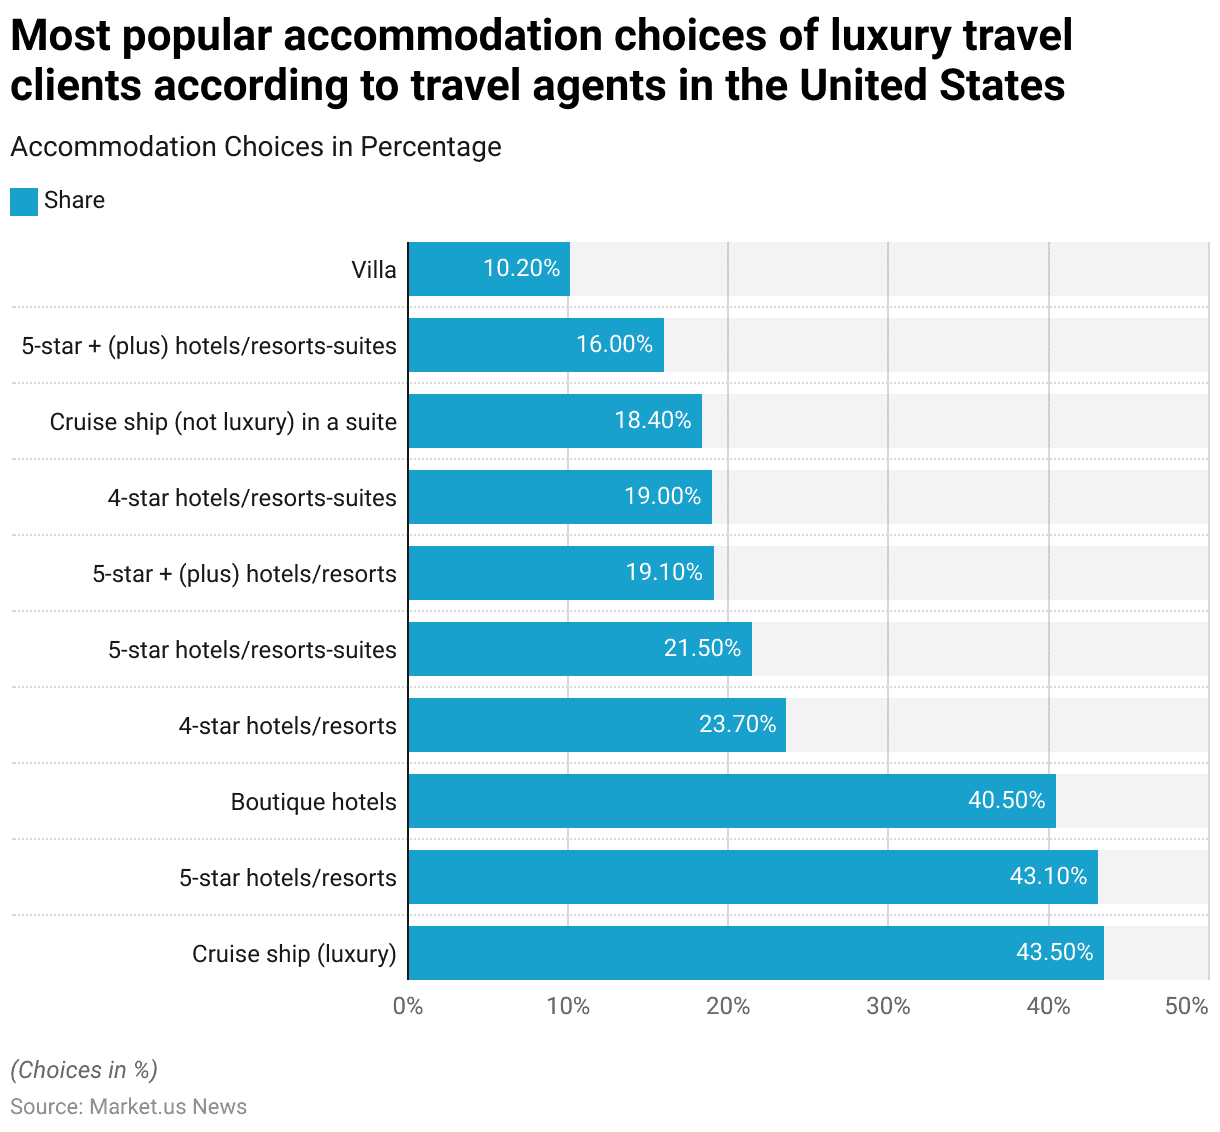
- As of August 2014, luxury travel clients in the United States showed distinct preferences for accommodation choices, as reported by travel agents.
- Luxury cruise ships and 5-star hotels or resorts were the most popular options, each favored by 43.5% and 43.1% of respondents, respectively.
- Boutique hotels also ranked highly, with 40.5% of travel agents noting them as a preferred choice for their clients.
- Other popular accommodations included 4-star hotels or resorts. Which were chosen by 23.7% of respondents, and 5-star hotels or resort suites, were preferred by 21.5% of clients.
- Additionally, 19.1% of luxury travelers opted for 5-star plus hotels or resorts, while 19% favored 4-star hotels or resort suites.
- Non-luxury cruise ships in suites were also a notable choice, preferred by 18.4% of clients.
- A smaller segment of travelers, 16%, selected 5-star plus hotel or resort suites, while 10.2% of respondents preferred staying in villas.
- This data highlights the diverse range of high-end accommodations favored by luxury travelers, with cruise ships and top-tier hotels leading the preferences.
(Source: Statista)
Key Spending Statistics
Global Travel and Tourism Spending
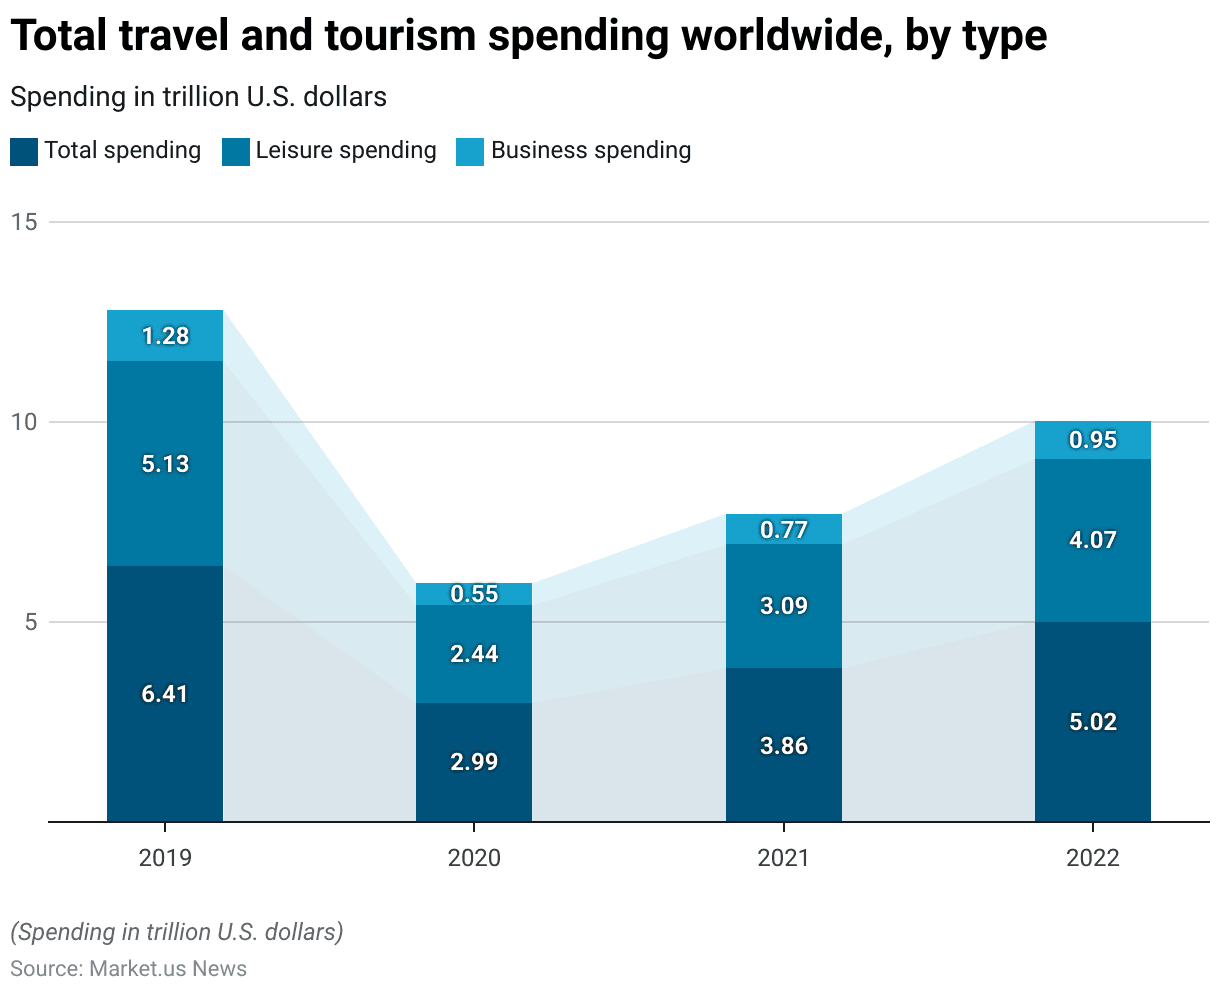
- From 2019 to 2022, global travel and tourism spending experienced significant fluctuations, particularly due to the impact of the COVID-19 pandemic.
- In 2019, total spending in the sector reached $6.41 trillion, with leisure travel accounting for $5.13 trillion and business travel contributing $1.28 trillion.
- The pandemic in 2020 led to a sharp decline in spending, with total expenditures dropping to $2.99 trillion. Leisure spending decreased to $2.44 trillion, while business travel spending fell to $0.55 trillion.
- As the industry began to recover in 2021, total spending increased to $3.86 trillion. Leisure travel spending rose to $3.09 trillion, and business travel saw a modest recovery, with spending reaching $0.77 trillion.
- By 2022, the recovery continued, with total spending reaching $5.02 trillion. Leisure travel spending rebounded significantly to $4.07 trillion, and business travel spending increased to $0.95 trillion.
- This data underscores the resilience of the travel and tourism sector, with a strong recovery trend evident by 2022, particularly in leisure travel.
(Source: Statista)
Distribution of Travel and Tourism Spending Worldwide
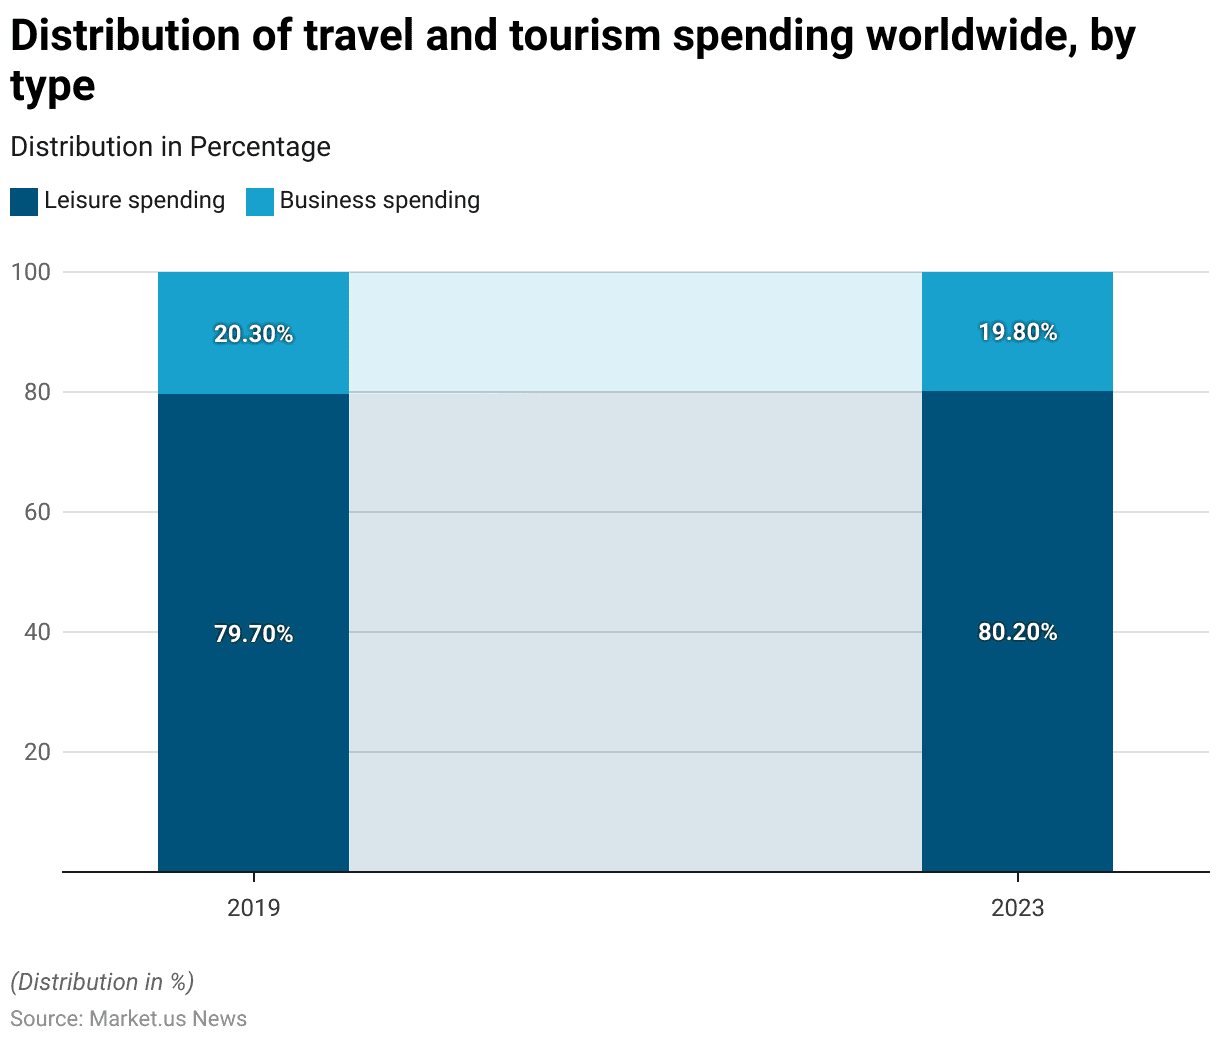
- In the global travel and tourism sector, the distribution of spending between leisure and business travel has shown a slight shift from 2019 to 2023.
- In 2019, leisure travel accounted for 79.7% of total spending, while business travel comprised 20.3%.
- By 2023, the share of leisure travel spending had increased marginally to 80.2%, with business travel’s share slightly decreasing to 19.8%.
- This shift reflects a continued strong preference for leisure travel over business travel, possibly influenced by changes in work practices and travel behavior post-pandemic.
(Source: Statista)
Leisure Tourism Spending
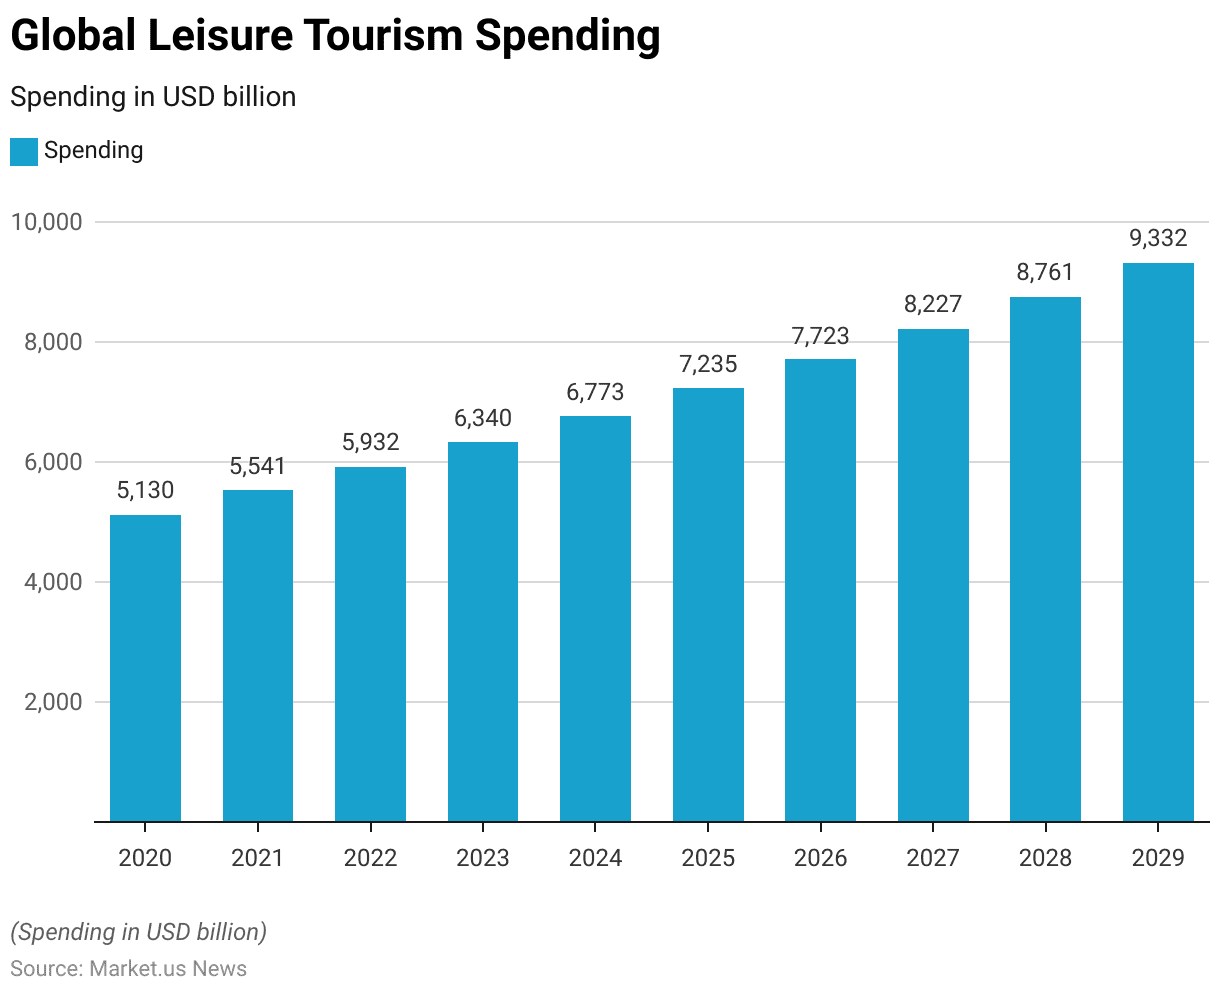
- Global leisure tourism spending has shown consistent growth from 2020 to 2029.
- In 2020, the total spending in this sector was $5,130 billion.
- This figure increased to $5,541 billion in 2021 and further to $5,932 billion in 2022.
- The upward trend continued into 2023, with spending reaching $6,340 billion.
- Projections indicate that this growth will persist, with spending expected to rise to $6,773 billion in 2024 and $7,235 billion in 2025.
- Further increases are anticipated, with global leisure tourism spending forecasted to reach $7,723 billion in 2026, $8,227 billion in 2027, and $8,761 billion in 2028.
- By 2029, spending in this sector is projected to hit $9,332 billion. Reflecting robust and sustained growth in the global leisure tourism market over the decade.
(Source: Statista)
Countries with the Highest Outbound Tourism Expenditure Worldwide
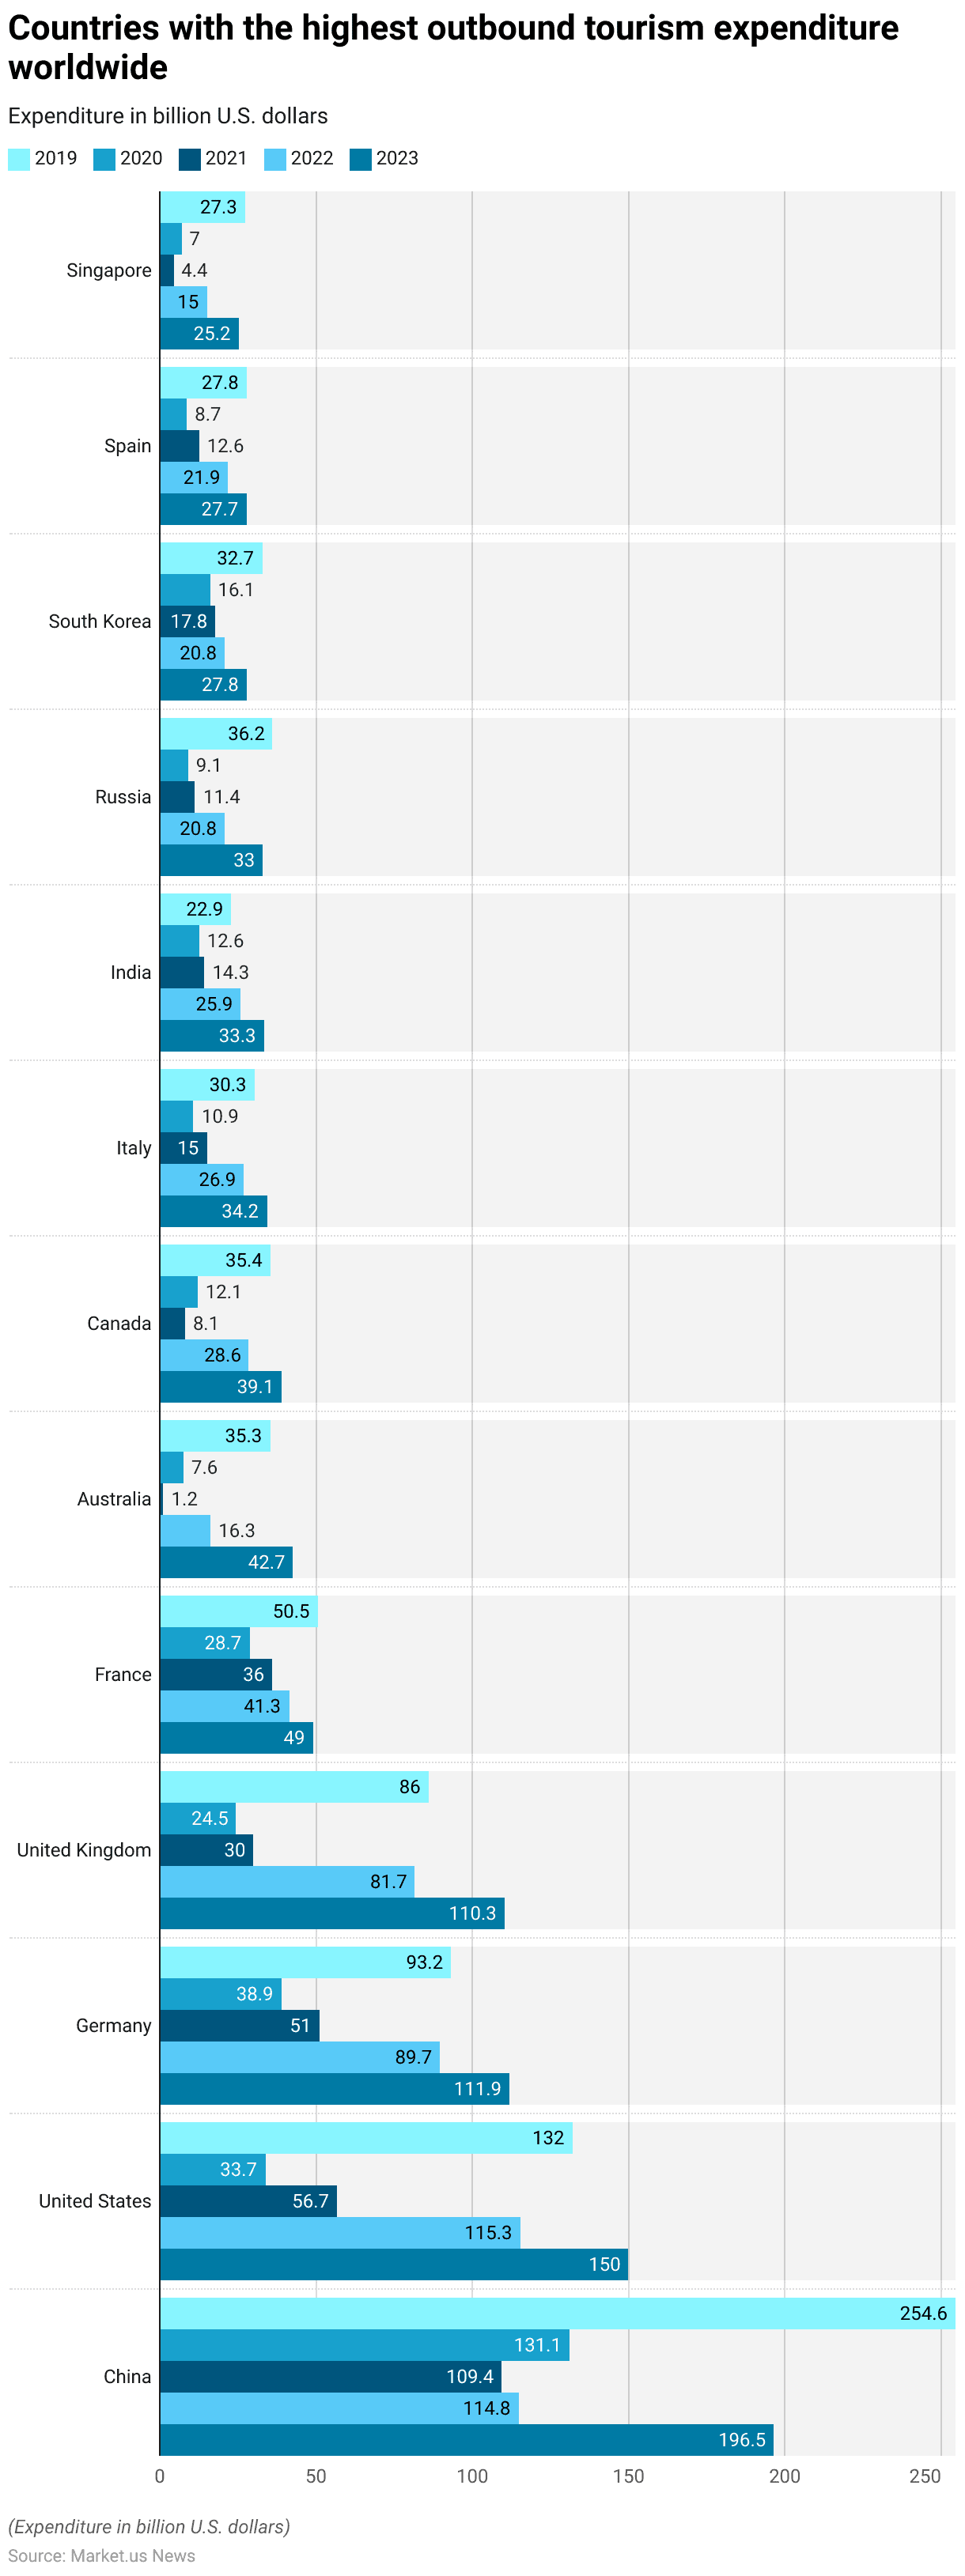
- From 2019 to 2023, the countries with the highest outbound tourism expenditure worldwide experienced significant fluctuations, largely due to the impact of the COVID-19 pandemic.
- China consistently led the world in outbound tourism spending, starting at $254.6 billion in 2019. However, this figure dropped sharply to $131.1 billion in 2020 and further to $109.4 billion in 2021. By 2023, China’s outbound tourism expenditure rebounded strongly to $196.5 billion.
- The United States followed a similar trend, with outbound spending decreasing from $132 billion in 2019 to $33.7 billion in 2020. It gradually recovered over the following years, reaching $150 billion in 2023.
- Germany also saw a drop from $93.2 billion in 2019 to $38.9 billion in 2020, but by 2023, its spending increased to $111.9 billion. The United Kingdom experienced a significant decline in outbound tourism expenditure, falling from $86 billion in 2019 to $24.5 billion in 2020 before rising to $110.3 billion by 2023.
- France’s spending decreased from $50.5 billion in 2019 to $28.7 billion in 2020, and it reached $49 billion in 2023.
More Insights
- Australia saw one of the sharpest declines, with spending plummeting from $35.3 billion in 2019 to just $7.6 billion in 2020. However, by 2023, Australia’s outbound tourism expenditure had recovered to $42.7 billion.
- Similarly, Canada’s expenditure dropped from $35.4 billion in 2019 to $12.1 billion in 2020, with a gradual recovery to $39.1 billion in 2023.
- Italy, India, Russia, South Korea, Spain, and Singapore also experienced declines in outbound tourism spending during 2020 and 2021, with varying degrees of recovery by 2023.
- For instance, Italy’s expenditure fell from $30.3 billion in 2019 to $10.9 billion in 2020, recovering to $34.2 billion by 2023.
- India’s spending decreased from $22.9 billion in 2019 to $12.6 billion in 2020, with an increase to $33.3 billion by 2023. Overall, while the pandemic significantly impacted global outbound tourism expenditure, the data shows a strong recovery trend by 2023 across most leading countries.
(Source: Statista)
Impact of COVID-19
Uncomfortable Travel Experience by Luxury Travelers During COVID-19
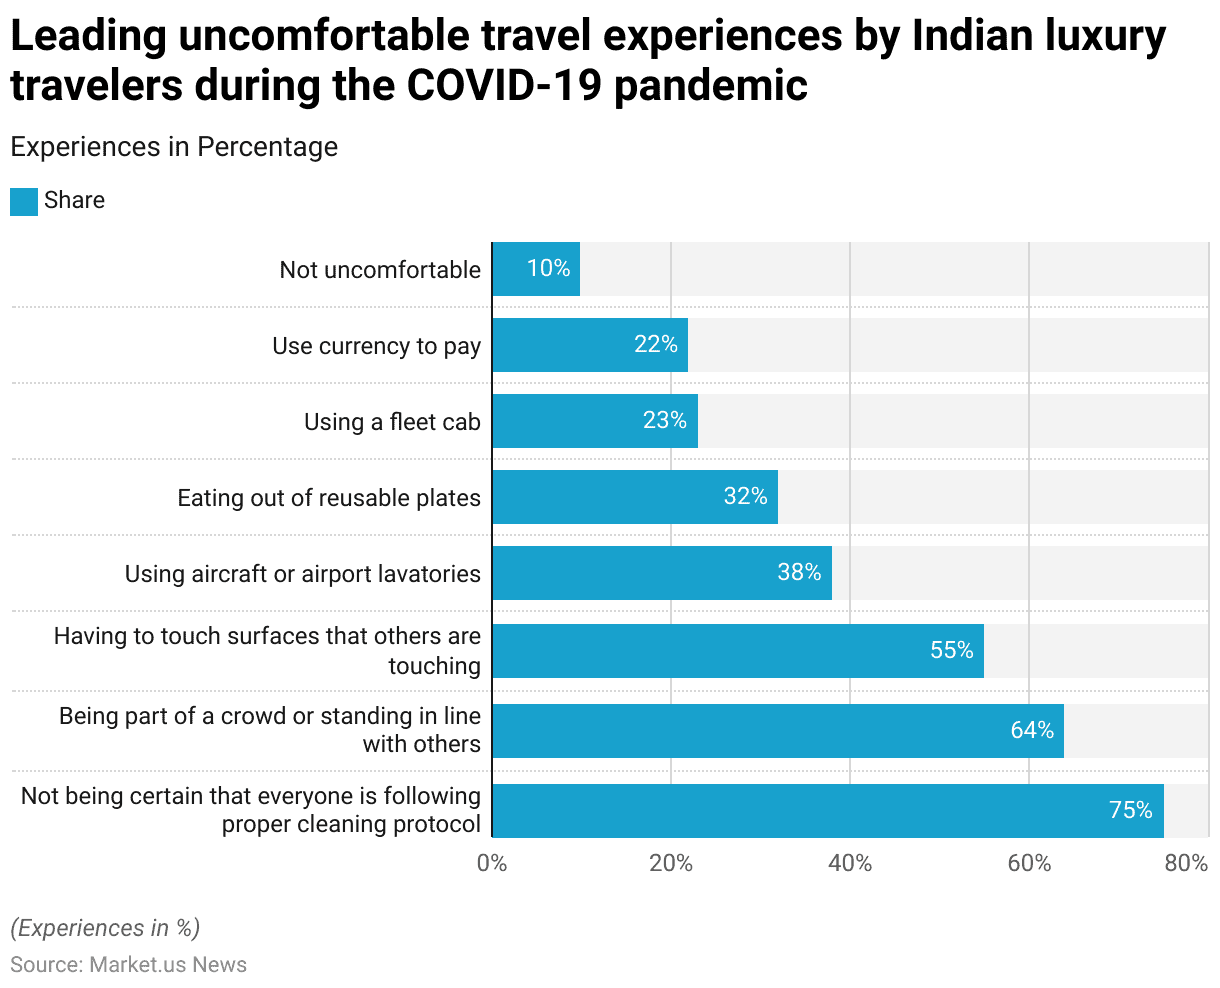
- As of May 2020, Indian luxury travelers reported several uncomfortable experiences during the coronavirus (COVID-19) pandemic.
- The leading concern, cited by 75% of respondents, was the uncertainty about whether proper cleaning protocols were being followed.
- Additionally, 64% of travelers were uncomfortable being part of a crowd or standing in line with others.
- Touching surfaces that others had touched was a concern for 55% of respondents.
- Using aircraft or airport lavatories made 38% of travelers uneasy, while 32% expressed discomfort with eating from reusable plates.
- Using fleet cabs was uncomfortable for 23% of respondents, and 22% were concerned about using currency to pay.
- Interestingly, only 10% of the surveyed luxury travelers indicated that they were not uncomfortable with any of these experiences.
- This data highlights the heightened sensitivities of travelers to hygiene and social distancing during the early stages of the pandemic.
(Source: Statista)
Travel Without COVID-19 App Downloads
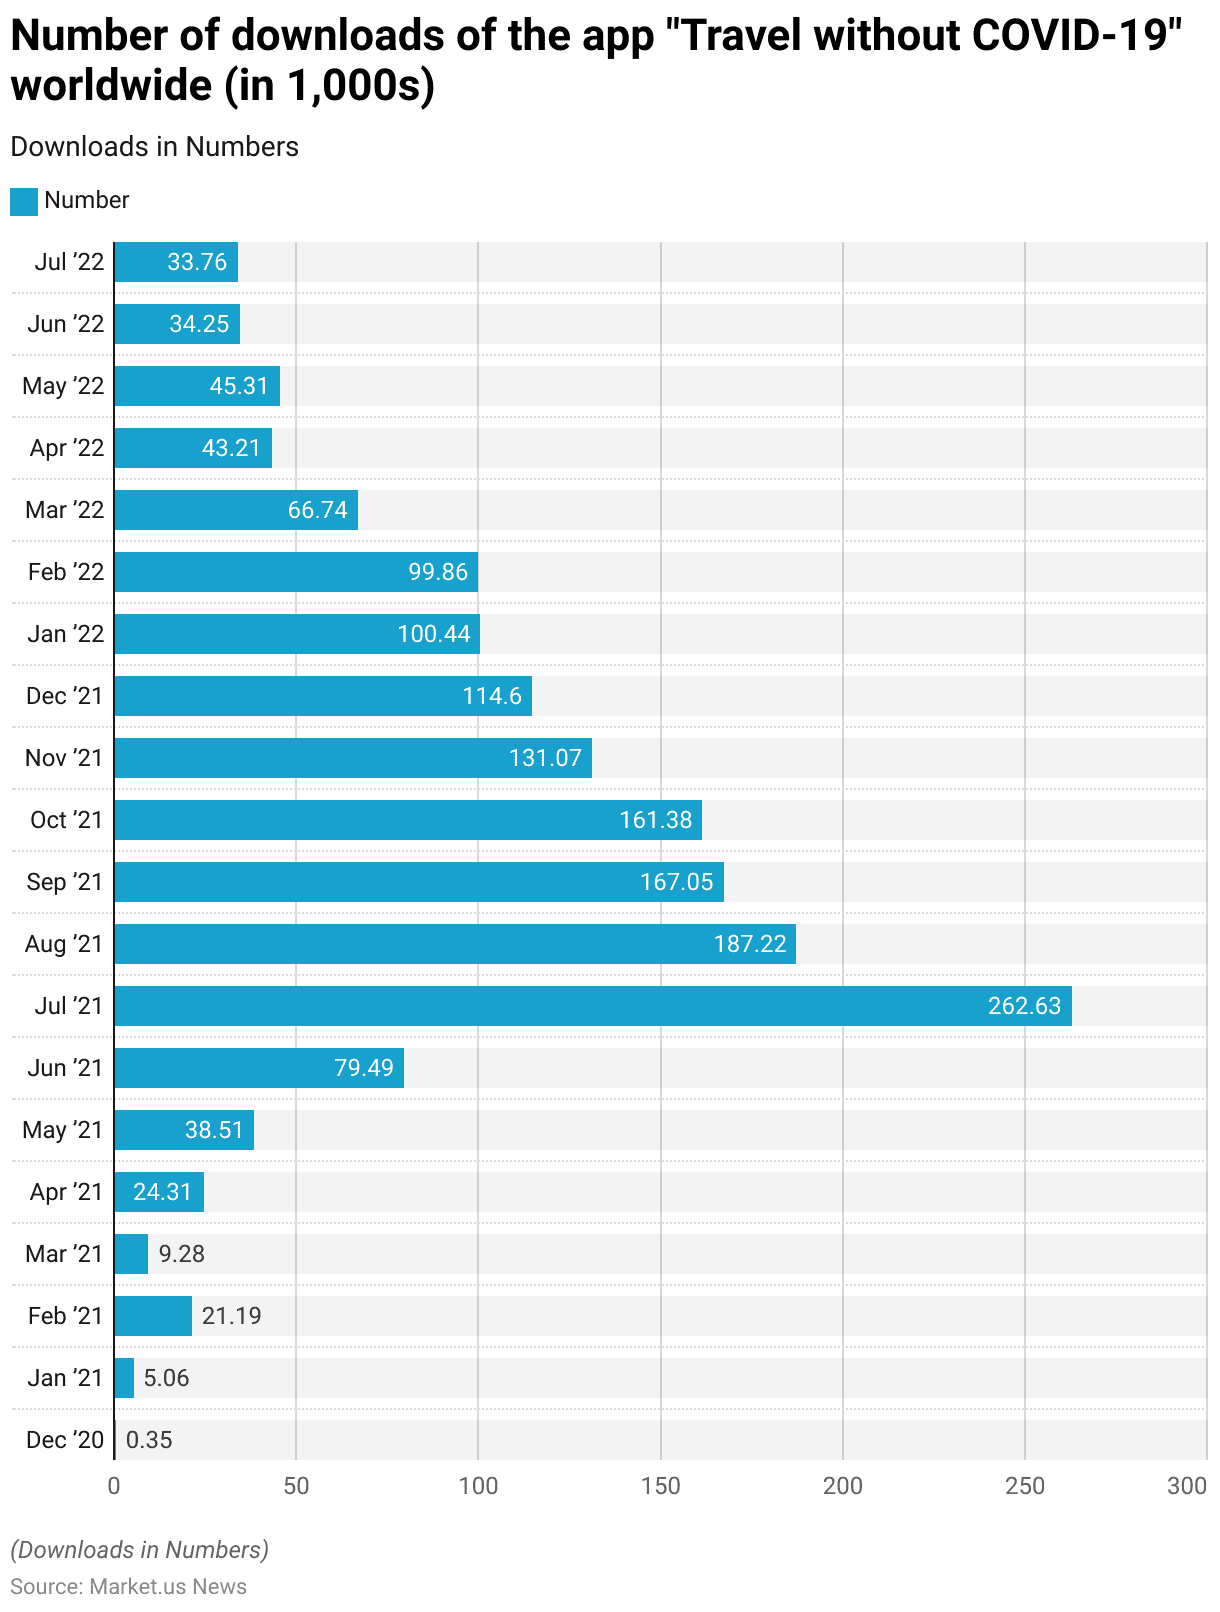
- The app “Travel without COVID-19” saw a varied number of downloads worldwide between December 2020 and July 2022.
- The initial launch in December 2020 resulted in just 0.35 thousand downloads. This number increased to 5.06 thousand in January 2021 and 21.19 thousand in February 2021.
- There was a slight dip in March 2021, with 9.28 thousand downloads, but the numbers picked up again in April 2021, reaching 24.31 thousand.
- The app gained significant traction in the following months, with 38.51 thousand downloads in May 2021 and 79.49 thousand in June 2021. The peak occurred in July 2021, with an impressive 262.63 thousand downloads.
- Although the numbers started to decline after that, they remained substantial, with 187.22 thousand downloads in August 2021 and 167.05 thousand in September 2021.
- The trend continued with 161.38 thousand downloads in October 2021 and 131.07 thousand in November 2021. By December 2021, the number of downloads had decreased to 114.6 thousand.
- In 2022, the downloads continued to decline gradually, starting with 100.44 thousand in January and 99.86 thousand in February.
- March 2022 saw a drop to 66.74 thousand downloads, and the numbers continued to fall, with 43.21 thousand in April, 45.31 thousand in May, 34.25 thousand in June, and 33.76 thousand in July 2022.
- These figures reflect the fluctuating demand for the app, likely influenced by changing travel restrictions and public interest over time.
(Source: Statista)
Challenges and Concerns
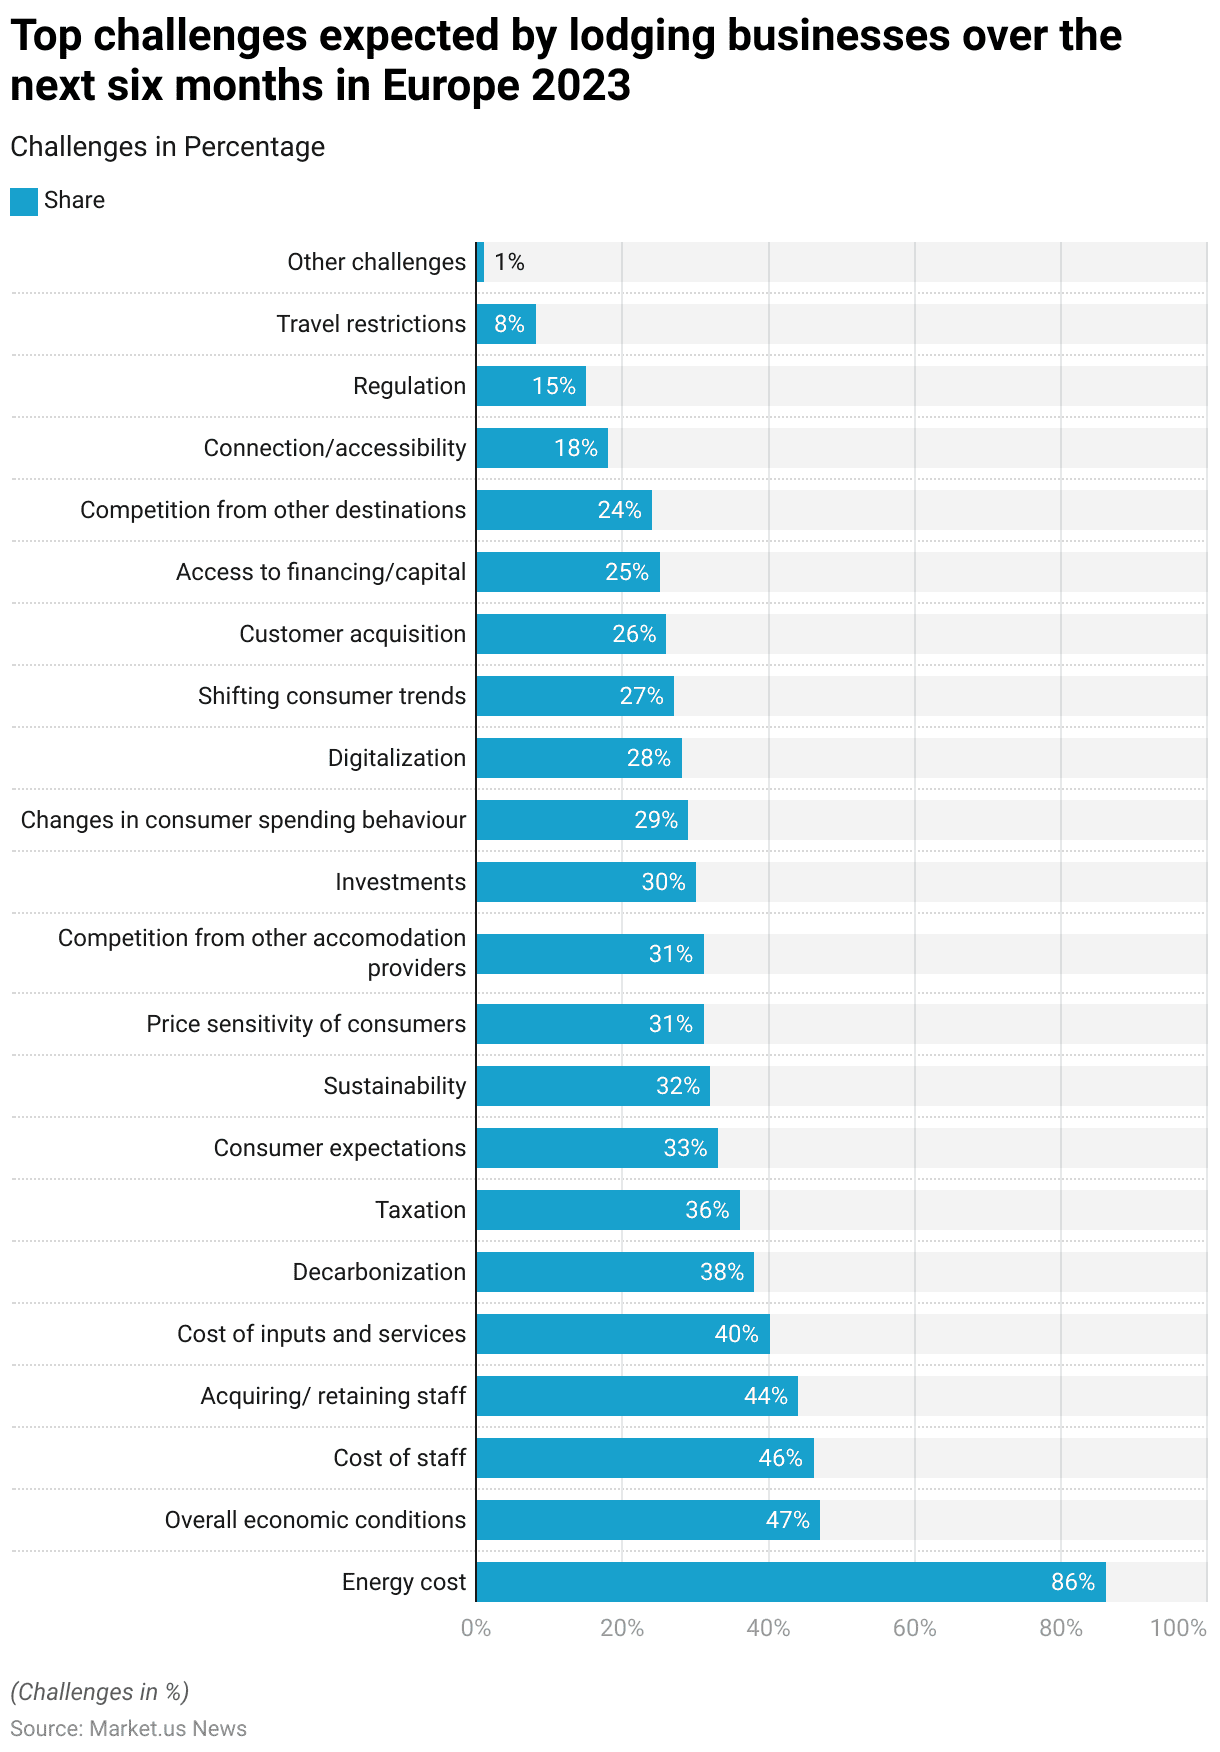
- As of May 2023, accommodation businesses in Europe identified several significant challenges they expect to face over the next six months.
- The most pressing concern, cited by 86% of respondents, is the rising cost of energy. Overall economic conditions were noted as a challenge by 47% of businesses. While 46% highlighted the cost of staff as a major issue.
- Acquiring and retaining staff is a concern for 44% of respondents, and 40% are worried about the cost of inputs and services.
- Decarbonization efforts pose challenges for 38% of accommodation businesses, and 36% are concerned about taxation. Consumer expectations are a challenge for 33% of respondents. While 32% are focused on sustainability issues.
- Price sensitivity of consumers and competition from other accommodation providers are both concerns for 31% of businesses.
- Investment challenges were noted by 30% of respondents. With 29% citing changes in consumer spending behavior as a key issue. Digitalization is a challenge for 28% of businesses, while 27% are concerned about shifting consumer trends.
- Customer acquisition is an issue for 26% of respondents, and access to financing or capital is a challenge for 25%.
- Competition from other destinations worries 24% of businesses, while 18% are concerned about connection and accessibility. Regulation is a challenge for 15% of respondents, and travel restrictions remain an issue for 8%.
- A small percentage (1%) identified other challenges not specified in the survey. These challenges reflect the complex and multifaceted environment that European accommodation businesses are navigating in 2023.
(Source: Statista)
Regulations for Luxury Travel
- Luxury travel is subject to a complex web of regulations that vary significantly by country, reflecting the diverse legal, cultural, and security concerns associated with high-end tourism.
- In Singapore, for instance, the stringent legal framework includes mandatory caning for certain offenses and severe penalties for drug-related crimes, even for transit passengers.
- Moreover, luxury travelers must comply with specific entry requirements, such as visa regulations, which the Immigration and Checkpoints Authority tightly controls.
- In Europe, the focus is on ensuring compliance with data protection laws, environmental sustainability standards, and health protocols, particularly in the wake of the COVID-19 pandemic.
- Meanwhile, in countries like the United States and the United Arab Emirates, luxury travelers face additional scrutiny under anti-money laundering laws and restrictions on carrying large sums of cash.
- The global landscape for luxury travel is thus characterized by a mosaic of policies. From visa requirements and health checks to security screenings and local laws that can include strict penalties for infractions such as public intoxication or inappropriate behavior.
- These regulations are not only designed to safeguard the interests of the host nations but also to ensure that luxury travel remains a secure and sustainable industry.
(Sources: Travel. State, A Luxury Travel Blog, Home)
Recent Developments
Acquisitions and Mergers:
- Accor Acquires SBE Hotel Group: In 2023, Accor, a global hospitality giant, acquired SBE Hotel Group, known for its luxury lifestyle hotels, for $400 million. This acquisition strengthens Accor’s position in the luxury travel market, expanding its portfolio of high-end properties in key global cities.
- Belmond Merges with LVMH: In late 2023, Belmond, a leader in luxury travel experiences, officially merged with LVMH Moët Hennessy Louis Vuitton in a deal valued at $3.2 billion. This merger aims to enhance Belmond’s luxury offerings, integrating them with LVMH’s extensive luxury brand ecosystem.
New Product Launches:
- Four Seasons Launches Private Jet Experiences: In early 2024, Four Seasons launched a new series of Private Jet Experiences, offering bespoke travel itineraries aboard a custom-designed luxury jet. These experiences cater to affluent travelers seeking exclusive, personalized global adventures.
- Aman Resorts Introduces Aman Residences: In 2023, Aman Resorts introduced Aman Residences, a collection of ultra-luxury residential properties located in some of the world’s most sought-after destinations. These residences combine Aman’s signature hospitality with private home ownership, targeting the top tier of luxury travelers.
Funding:
- Rosewood Hotels & Resorts Secures $500 Million for Expansion: In 2024, Rosewood Hotels & Resorts secured $500 million in funding to expand its portfolio of luxury hotels and resorts across Asia and Europe. The funding will be used to develop new properties and enhance existing ones. Focusing on sustainable luxury and exclusive experiences.
- Luxury Escapes Raises $60 Million for Growth: In 2023, Luxury Escapes, an online travel platform specializing in luxury vacation packages, raised $60 million to expand its offerings and enhance its digital platform. The funding will support the launch of new luxury travel experiences and improve customer personalization.
Technological Advancements:
- AI-Powered Personalization in Luxury Travel: AI is increasingly being used to personalize luxury travel experiences. Offering tailored itineraries, real-time recommendations, and bespoke services. By 2025, it is projected that 40% of luxury travel companies will integrate AI-driven personalization tools to enhance customer experiences.
- Sustainable Luxury Travel Initiatives: The demand for sustainable luxury travel is on the rise, with more travelers seeking eco-friendly options. In 2024, sustainable travel offerings are expected to grow by 20%. Luxury brands introduce environmentally-conscious travel packages and eco-luxury accommodations.
Market Dynamics:
- Growth in the Luxury Travel Market: This growth is driven by increasing demand for unique, personalized experiences. The rise of affluent travelers from emerging markets, and the expansion of luxury travel offerings by major hospitality brands.
- Rising Demand for Experiential Travel: Experiential travel, which focuses on immersive and authentic experiences, continues to gain popularity in the luxury segment. By 2025, experiential travel is expected to account for 50% of the luxury travel market. Reflecting the growing desire for meaningful and unique travel experiences.
Conclusion
Luxury Travel Statistics – Luxury travel has shown remarkable resilience and adaptability despite challenges like economic fluctuations, sustainability concerns, and the COVID-19 pandemic.
High-end travelers continue to seek personalized, exclusive experiences with an increasing focus on sustainability and responsible tourism.
The industry is evolving with younger travelers influencing trends, and destinations that offer authentic, eco-conscious experiences are poised for growth.
As the market recovers and expands, luxury travel providers must adapt to changing consumer expectations. Integrate new technologies, and maintain high service standards to thrive in the future.
FAQs
Luxury travel involves high-end experiences that offer exceptional comfort, personalized services, and exclusive access to unique destinations, accommodations, and activities.
Luxury accommodations include five-star hotels, resorts, private villas, boutique hotels, and luxury cruise ships, all offering top-tier amenities and personalized services.
A luxury travel experience is defined by its exclusivity, personalized service, attention to detail, and access to unique, often private, experiences that go beyond standard offerings.
What are some popular destinations for luxury travel?
Popular luxury travel destinations include Paris, the Maldives, Dubai, Bora Bora, Santorini, and the Amalfi Coast, known for their high-end accommodations, fine dining, and exclusive experiences.


