Table of Contents
- Introduction
- Editor’s Choice
- General Sleep Economy Statistics
- Bedding Market Size
- Mattress Market Statistics
- Revenue Generation Through Mattress Statistics
- Air Mattress Market Size Worldwide Statistics
- Smart Mattress Market Size Worldwide Statistics
- Mattress Manufacturing & Production Statistics in Various Countries
- Age-related Dynamics of Mattress Consumers Statistics
- Gender-related Dynamics of Mattress Consumers
- Expenditure on Mattresses and Springs
- Price of Different Mattresses
- Consumer Perceptions and Trends
- Recent Developments
- Conclusion
- FAQs
Introduction
Mattress Statistics: The mattress industry encompasses various types of mattresses designed for comfort and support, including innerspring, memory foam, latex, hybrid, and airbed options.
Each type has distinct characteristics; for example. Innerspring mattresses feature steel coils for responsiveness, while memory foam conforms to the body’s shape for pressure relief.
Key factors influencing mattress selection include firmness level, sleep position, temperature regulation, and material sensitivities.
Durability and warranty length also play crucial roles, with higher-quality materials generally offering longer lifespans.
Understanding these elements can guide consumers in making informed choices tailored to their specific sleep needs and preferences.
Editor’s Choice
- The global mattress market revenue is projected to reach USD 46.44 billion by 2029.
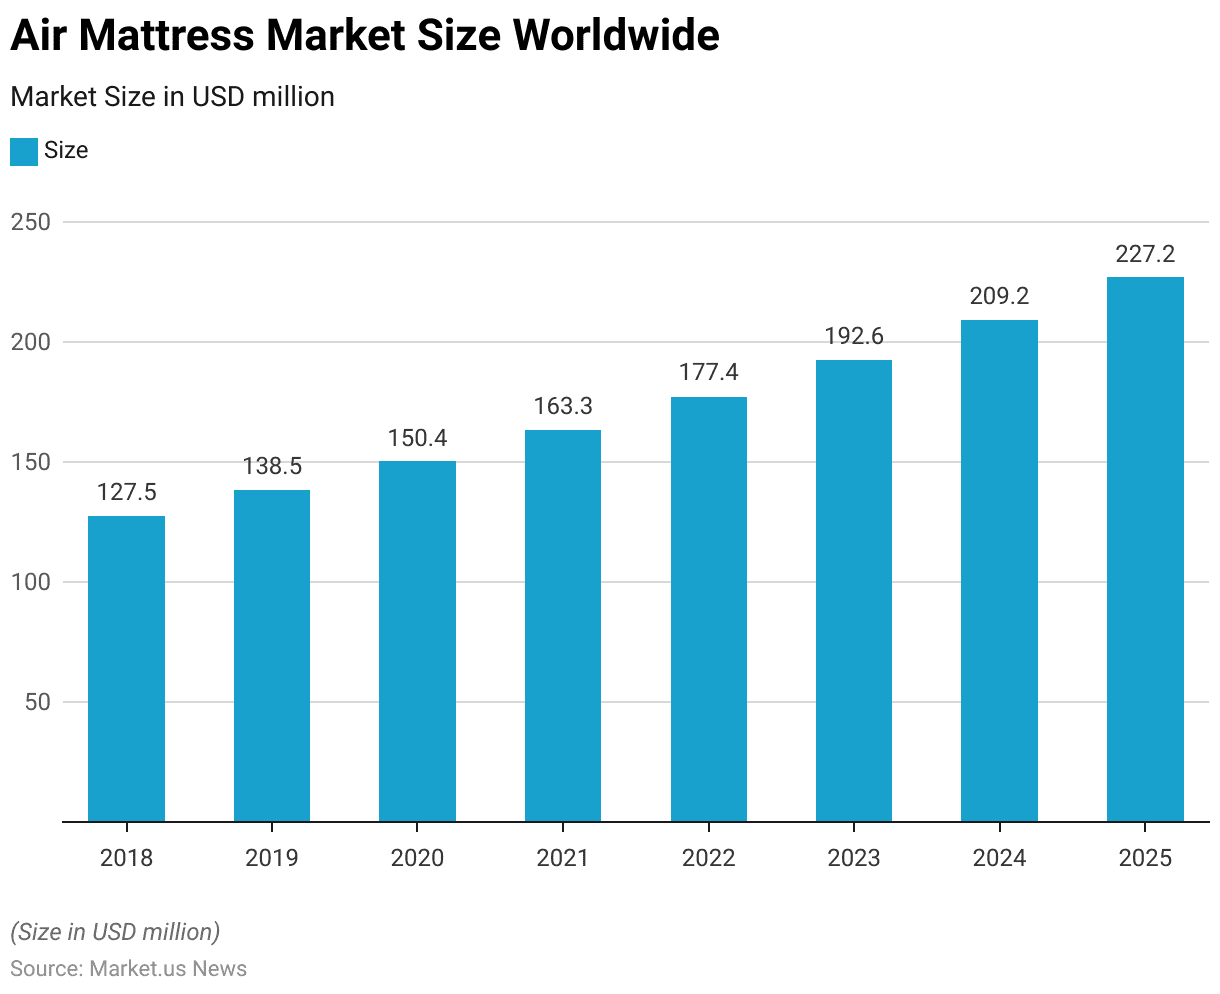
- The worldwide market size for air mattresses is expected to reach USD 227.2 million by 2025.
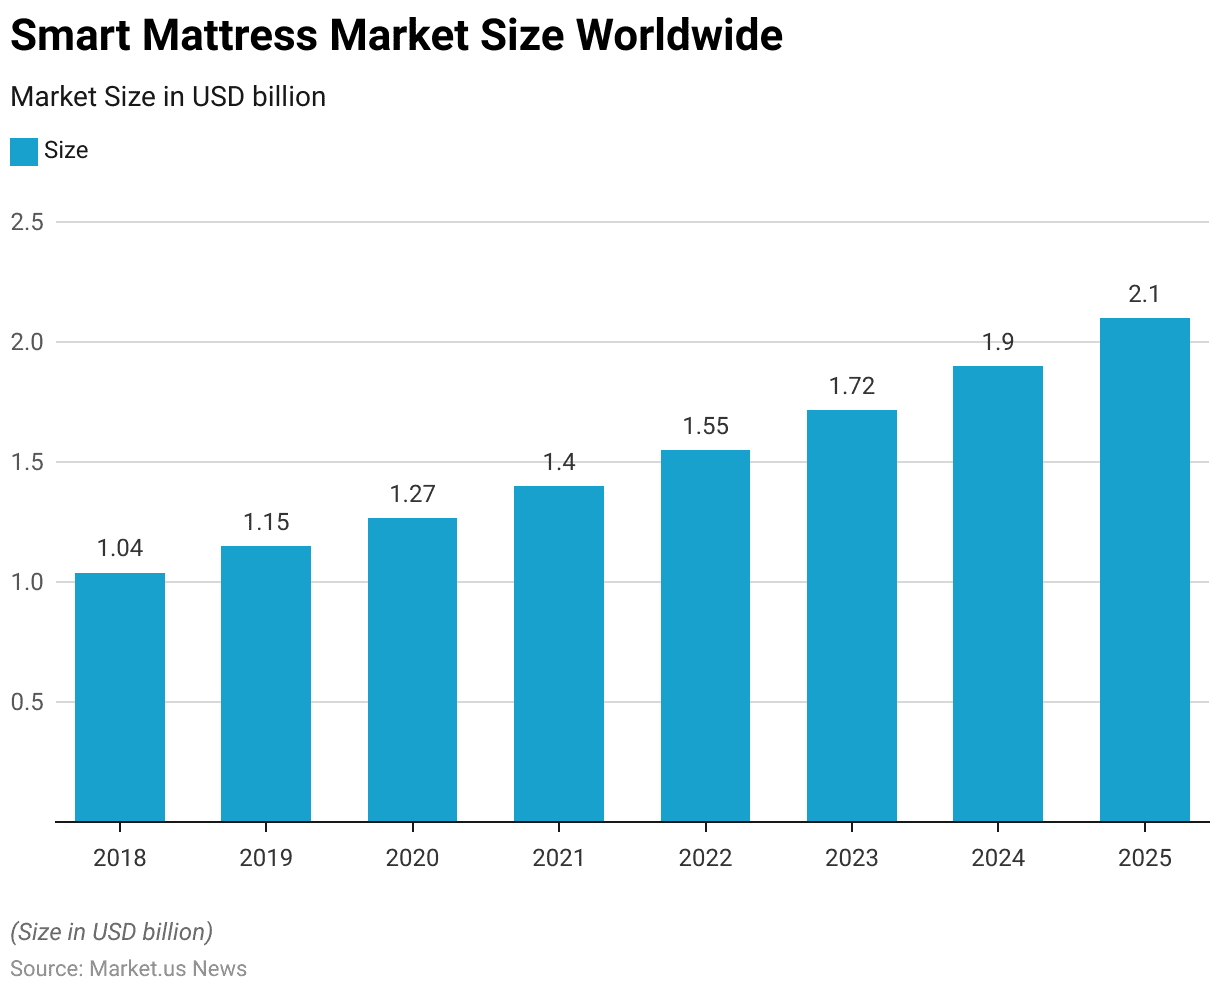
- The worldwide market size for smart mattresses is projected to reach USD 2.1 billion by 2025.
- In 2017, a survey highlighted the various features and factors that U.S. adults consider when purchasing a new mattress. Revealing differences in preferences between genders. Comfort was the most significant factor for all respondents, with 87% overall valuing it.
- In 2016, the purchasing patterns for king-size mattresses in the United States showed a wide distribution across various price ranges. The most commonly purchased king-size mattresses fell into the $1,000 to $1,999 range, accounting for 28% of purchases. Indicating a preference for mid- to high-range products.
- In a 2016 survey exploring key factors that influence U.S. consumers’ decisions when purchasing mattresses. Comfort and support emerged as the most critical aspect, with 86% of respondents considering it essential.
- In a 2018 survey examining U.S. consumer behavior regarding mattress purchases. It was found that a significant majority, 62% of respondents, considered buying their mattresses online.
General Sleep Economy Statistics
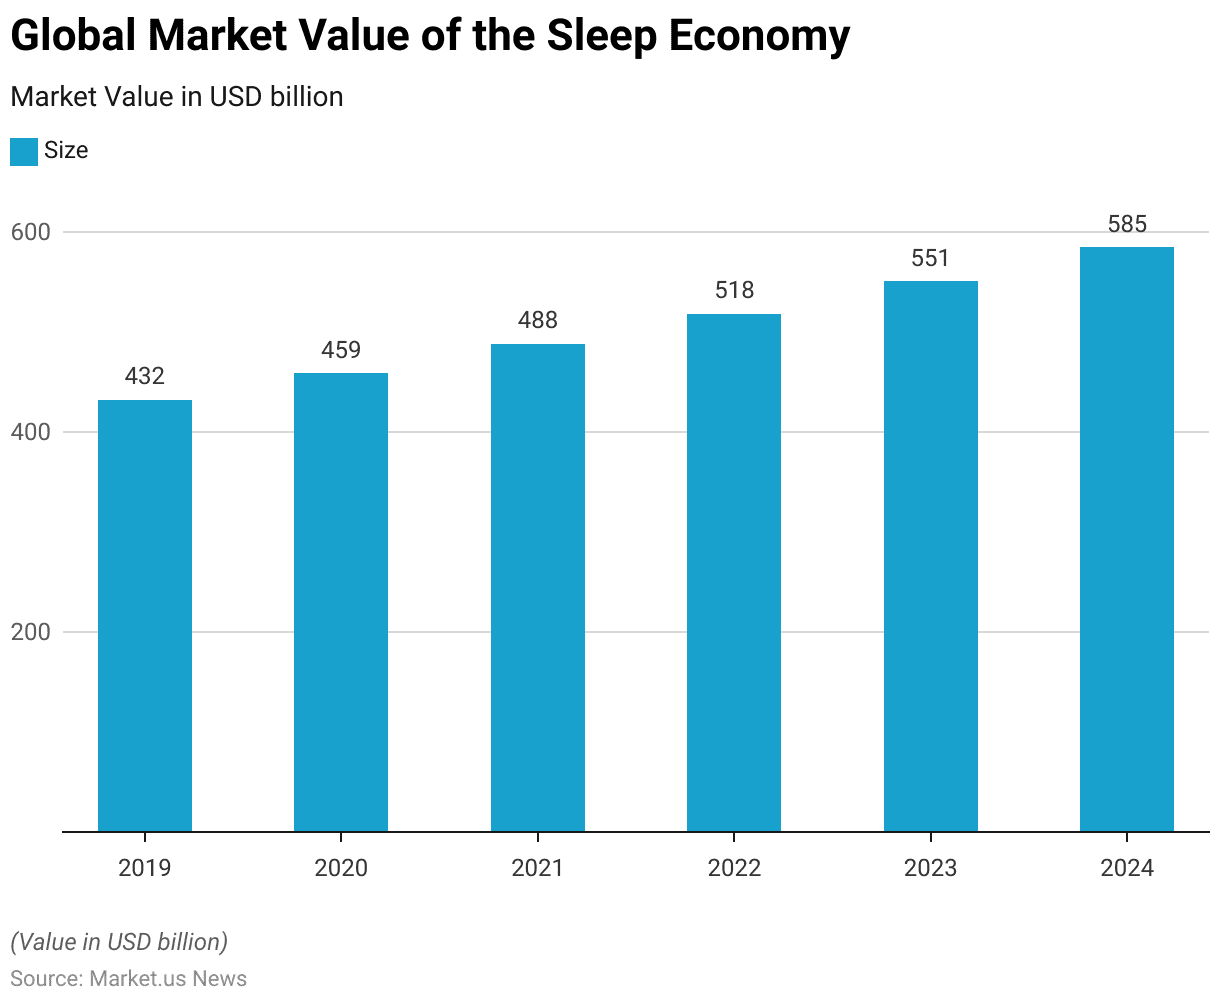
Global Market Value of the Sleep Economy
- The global sleep economy has shown considerable growth from 2019 to 2024.
- Starting in 2019, the market size was valued at USD 432 billion.
- This figure increased to USD 459 billion in 2020, indicating resilience and growth despite global economic challenges.
- In 2021, the market expanded further to USD 488 billion.
- The upward trend continued, with the market size reaching USD 518 billion in 2022.
- By 2023, the market size had grown to USD 551 billion, and it was projected to further increase to USD 585 billion by 2024.
- This consistent growth in the sleep economy highlights the increasing global emphasis on health and wellness. Particularly the critical role that quality sleep plays in overall well-being.
(Source: Statista)
Size of the Sleep Economy Worldwide – By Product Category
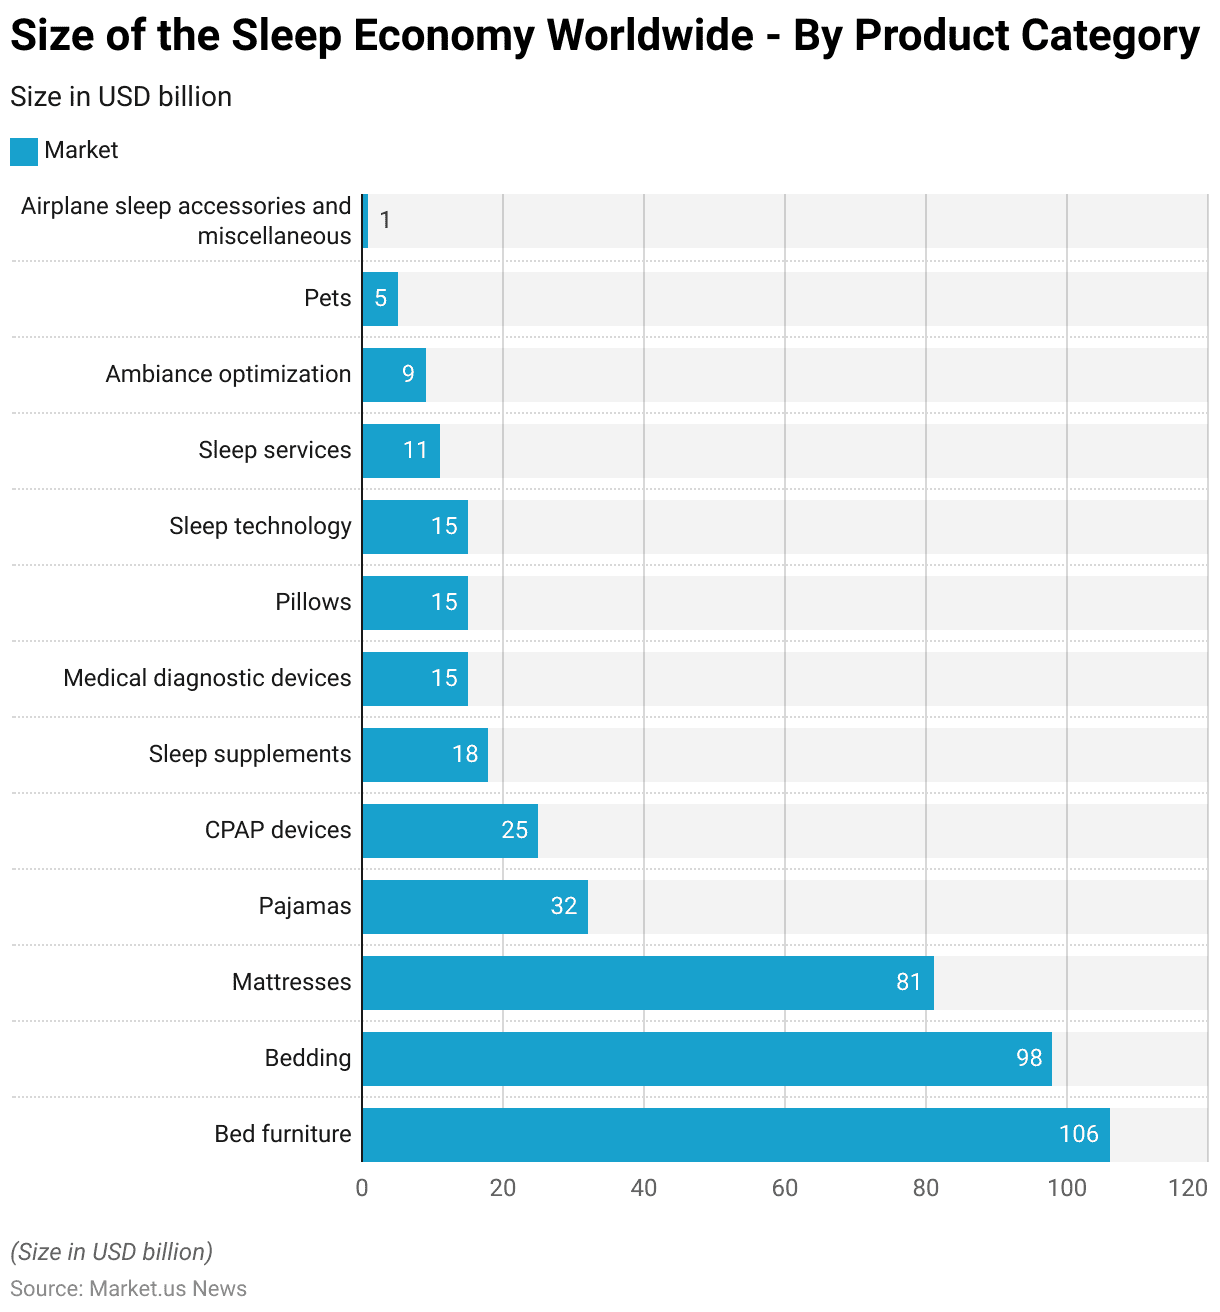
- In 2019, the sleep economy’s market size varied significantly across different product categories.
- Bed furniture led the segments with a substantial market size of USD 106 billion. Closely followed by bedding products at USD 98 billion and mattresses at USD 81 billion. These categories underscored a strong consumer focus on foundational sleep-related goods.
- Additionally, pajamas accounted for USD 32 billion, highlighting the importance of comfort wear in sleep quality.
- CPAP devices, used for sleep apnea treatment, also have a significant market presence at USD 25 billion.
- Further, sleep supplements and medical diagnostic devices each contributed USD 18 billion and USD 15 billion, respectively. Reflecting growing consumer interest in sleep enhancement and health monitoring solutions.
- Pillows and sleep technology products, each at USD 15 billion, indicated a market focus on ergonomic and tech-enhanced sleep aids.
- Sleep services designed to improve sleep quality were valued at USD 11 billion. Ambiance optimization products, which help create a conducive sleeping environment, accounted for USD 9 billion.
- Smaller niche markets included products for pets related to sleep, totaling USD 5 billion, and airplane sleep accessories and miscellaneous items at USD 1 billion. Showing the diversity and breadth of the sleep economy’s reach across different aspects of consumer life and needs.
(Source: Statista)
Bedding Market Size
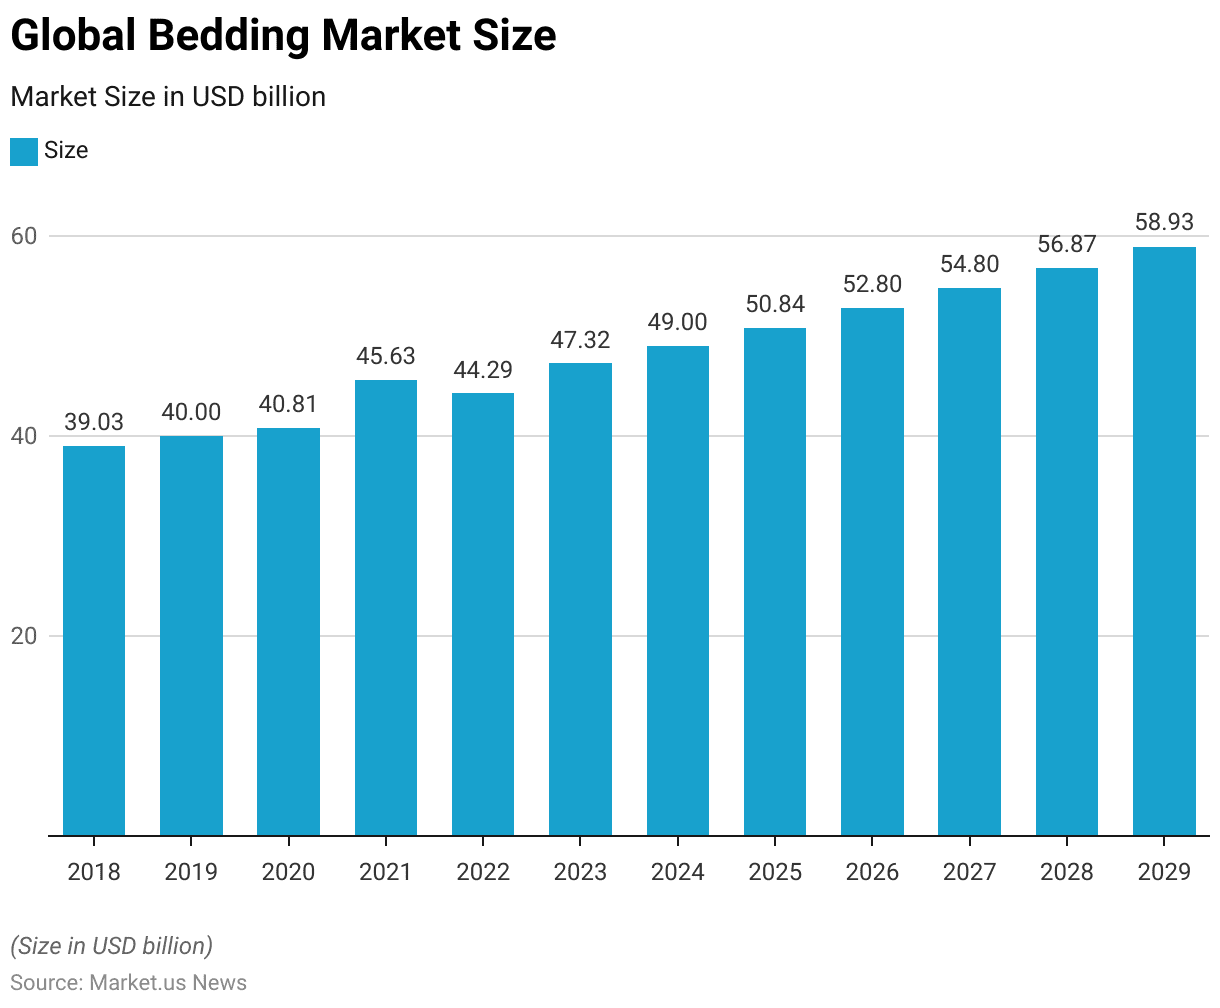
- The annual forecast revenue for the global bedding market from 2018 to 2029 demonstrates steady growth.
- Starting in 2018, the market was valued at USD 39.03 billion.
- It saw a modest increase in 2019 to USD 40 billion, followed by a slight rise to USD 40.81 billion in 2020.
- A more significant jump occurred in 2021, with revenue climbing to USD 45.63 billion. Although it dipped slightly to USD 44.29 billion in 2022.
- The market resumed its growth trajectory in 2023, reaching USD 47.32 billion, and continued to expand in the subsequent years.
- By 2024, the revenue was projected to be USD 49 billion. Followed by USD 50.84 billion in 2025, USD 52.8 billion in 2026, and USD 54.8 billion in 2027.
- The upward trend is expected to persist, with projections of USD 56.87 billion in 2028 and USD 58.93 billion by 2029.
- This sustained growth underscores the increasing consumer demand and evolving preferences within the global bedding market.
(Source: Statista)
Mattress Market Statistics
Global Mattress Market Size Statistics
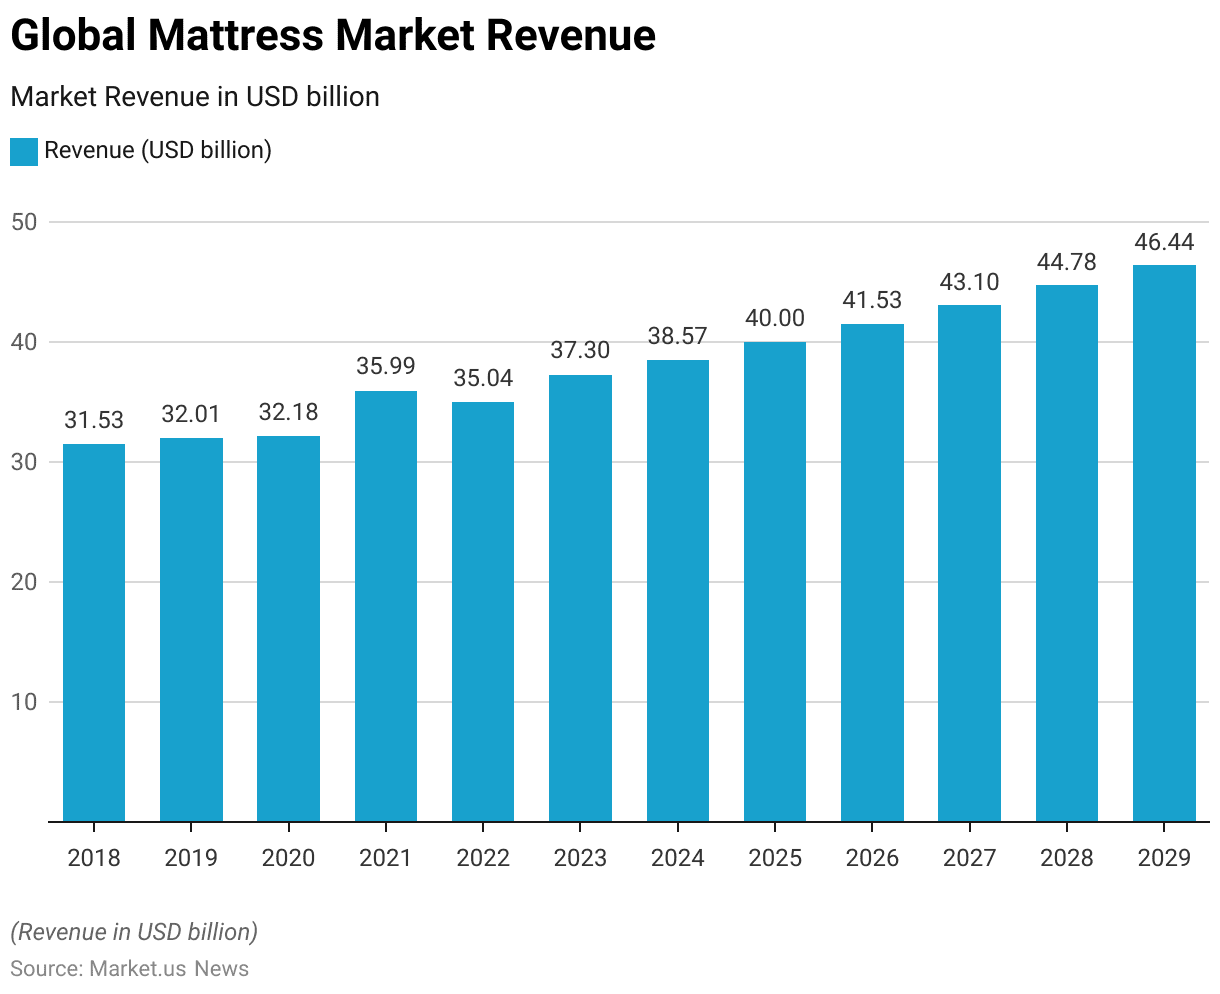
- The global mattress market has demonstrated a steady growth trajectory over the years at a CAGR of 3.78%.
- In 2018, the market revenue was reported at USD 31.53 billion. This figure slightly increased to USD 32.01 billion in 2019.
- The growth pace maintained a marginal rise in 2020, with revenue reaching USD 32.18 billion.
- A notable increase was observed in 2021 when the revenue surged to USD 35.99 billion. Although it slightly declined to USD 35.04 billion in 2022.
- The market showed resilience and growth in the subsequent years. Climbing to USD 37.30 billion in 2023 and further to USD 38.57 billion in 2024.
- The forecast continues to be positive, with projected revenues of USD 40.00 billion in 2025, USD 41.53 billion in 2026, USD 43.10 billion in 2027, USD 44.78 billion in 2028, and USD 46.44 billion by the end of 2029.
- This upward trend indicates a robust expansion within the global mattress market over the forecast period.
(Source: Statista)
Mattress Market Revenue Change Statistics
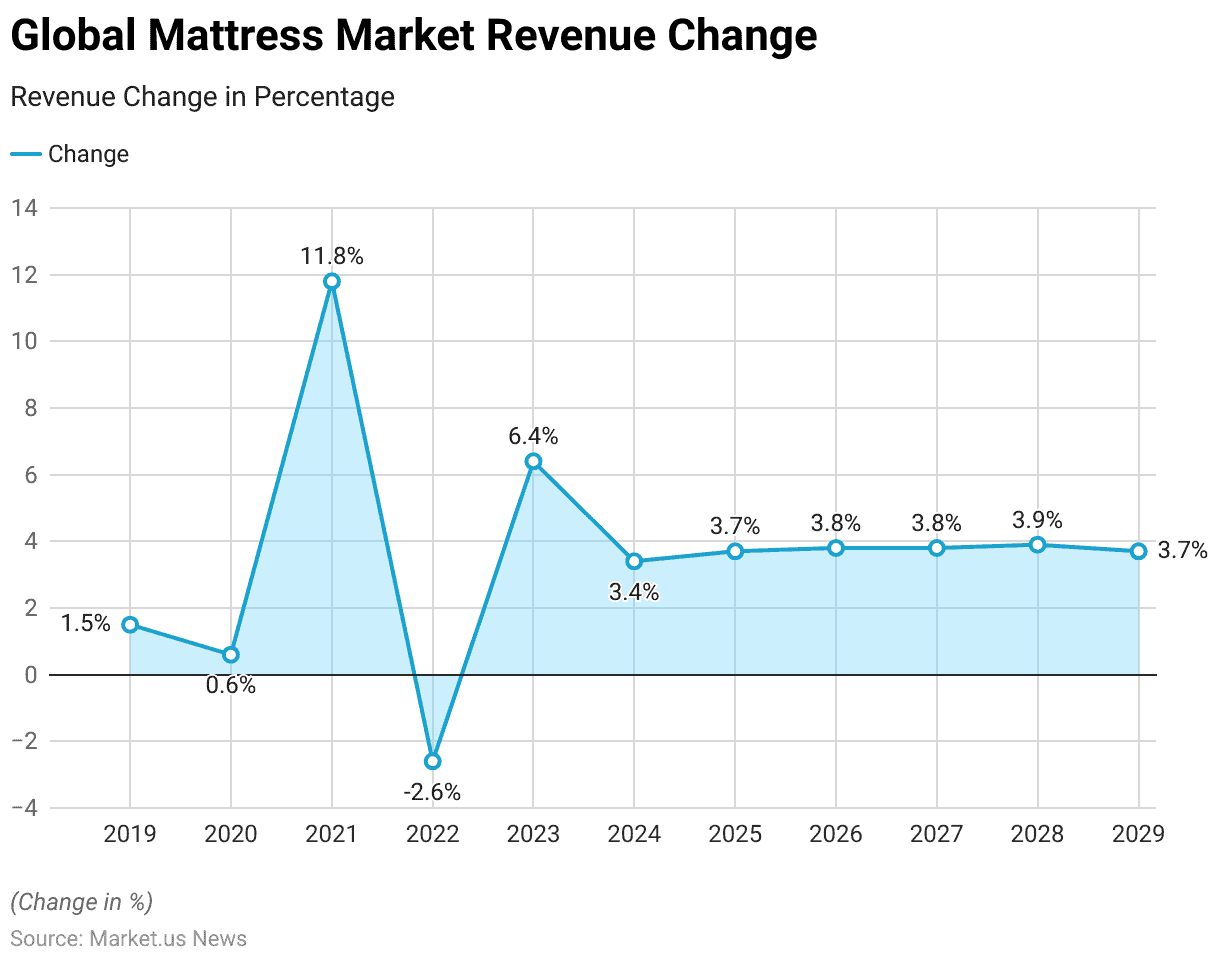
- The year-over-year revenue changes in the global mattress market have exhibited variability.
- In 2019, the revenue growth was modest at 1.5%.
- This was followed by a minimal increase of 0.6% in 2020.
- A significant rise occurred in 2021, with the revenue growth rate surging to 11.8%.
- However, 2022 experienced a setback with a 2.6% decline in growth.
- The market rebounded in 2023, recording a growth rate of 6.4%, and continued to show positive momentum with growth rates of 3.4% in 2024, 3.7% in 2025, 3.8% in 2026, another 3.8% in 2027, 3.9% in 2028, and slightly dipping to 3.7% in 2029.
- These figures demonstrate the market’s resilience and a generally upward trend in growth despite occasional fluctuations.
(Source: Statista)
Mattress Market Share – By Sales Channel Statistics
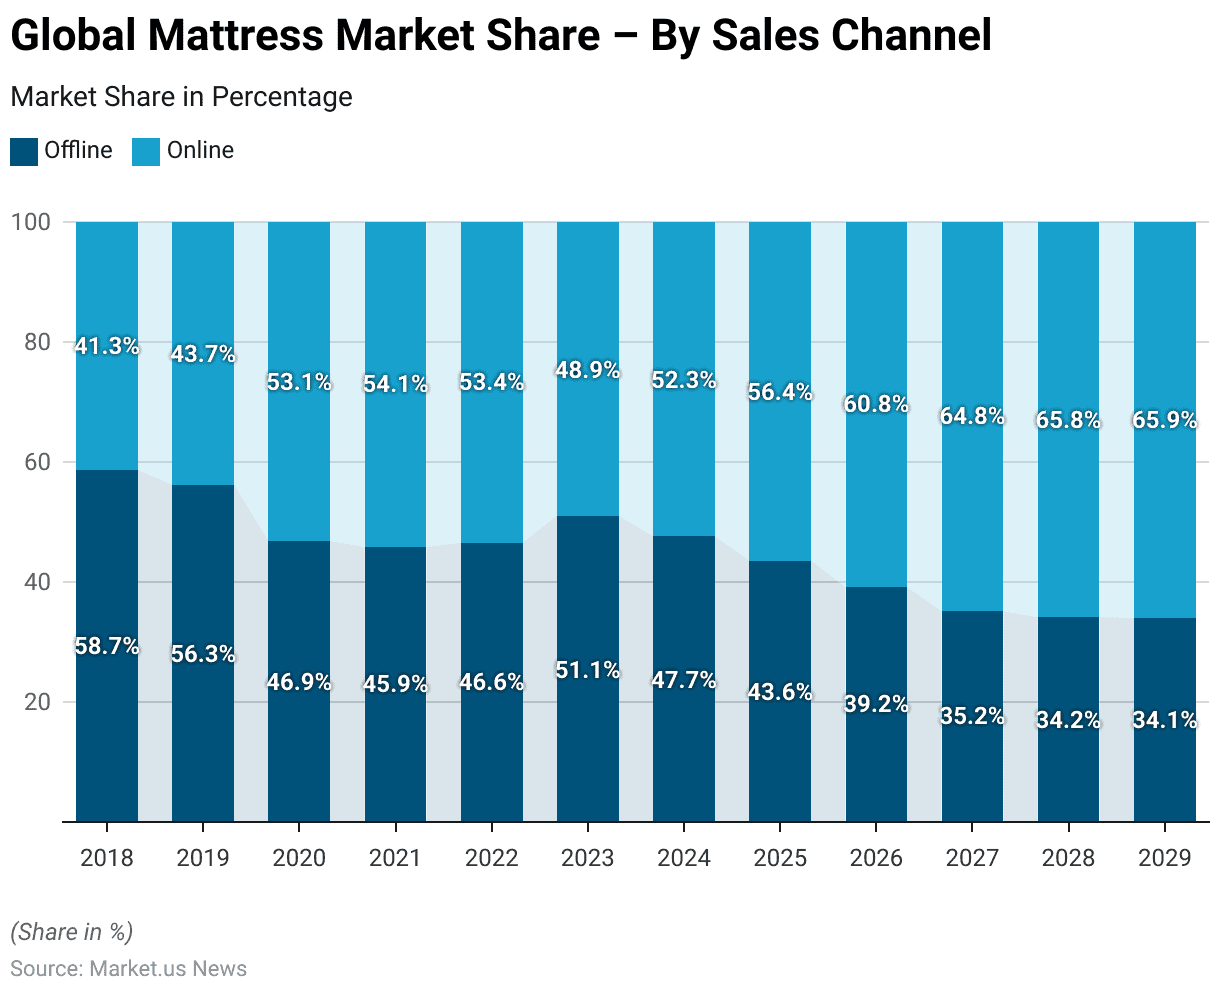
- The distribution of market shares between offline and online sales channels in the global mattress market has shifted significantly over the years.
- In 2018, offline sales dominated with 58.7% of the market, compared to 41.3% for online sales.
- This trend began to shift in 2019, with offline sales decreasing to 56.3% and online increasing to 43.7%.
- The shift became more pronounced in 2020, with online sales surpassing offline for the first time, capturing 53.1% of the market.
- This trend continued in the following years, with online sales reaching 54.1% in 2021. Slightly adjusting to 53.4% in 2022, and then experiencing a temporary reversal in 2023. When offline sales slightly recovered to 51.1%.
- However, from 2024 onwards, online sales gained a stronger foothold. Accounting for 52.3% in 2024 and increasing steadily each year thereafter.
- By 2025, online sales reached 56.4%, and by 2026, they further increased to 60.8%.
- This upward trajectory continued through the forecast period, with online sales projected to reach 64.8% in 2027, 65.8% in 2028, and 65.9% by 2029.
- This data underscores a significant transition in consumer purchasing behavior, with a marked shift towards online shopping in the mattress market.
(Source: Statista)
Competitive Landscape of the Global Mattress Market Statistics
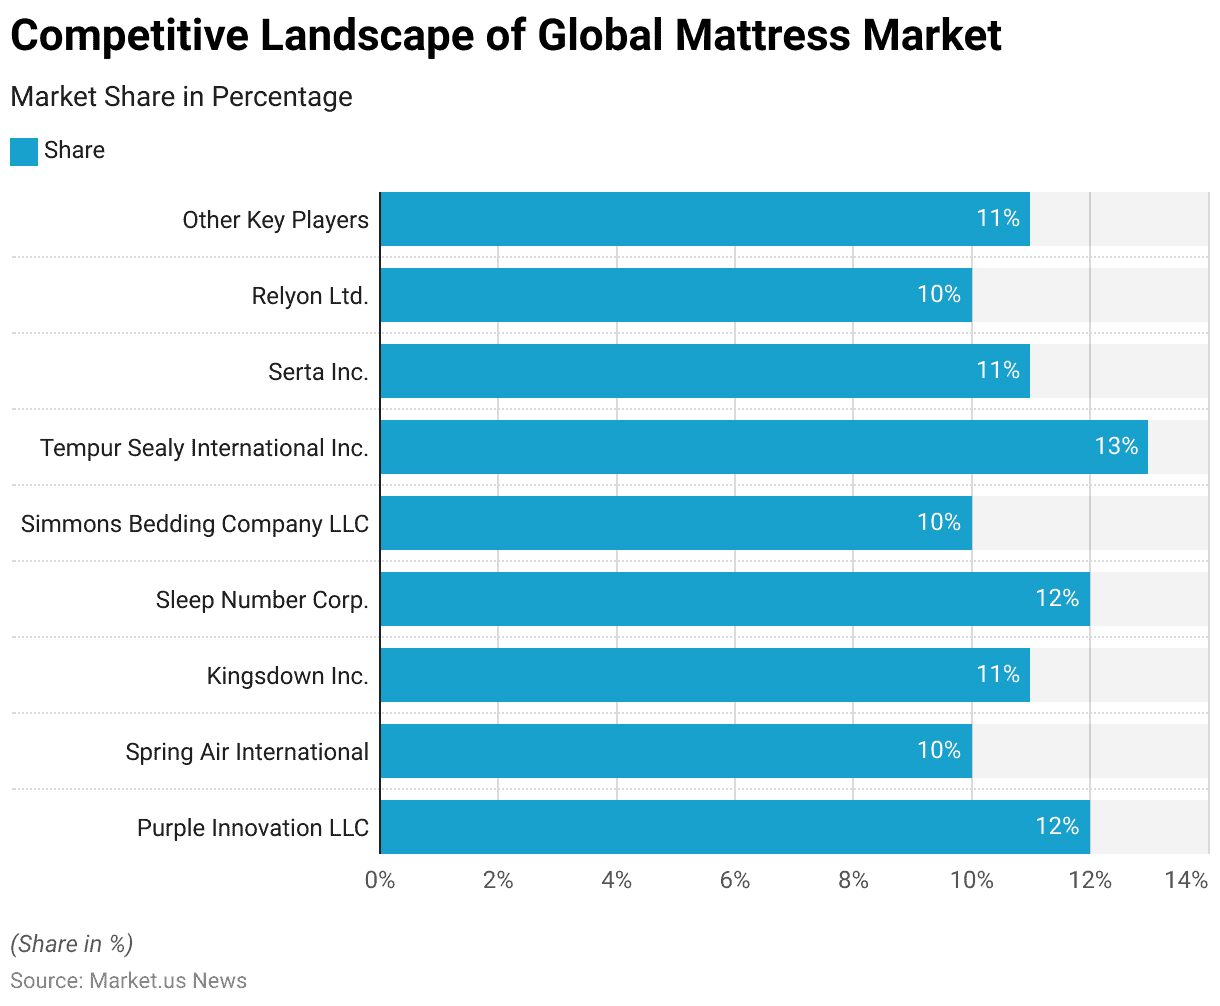
- In 2021, the competitive landscape of the global mattress market was characterized by close competition among several key players.
- Purple Innovation LLC and Sleep Number Corp. each held 12% of the market share, positioning them as significant contributors.
- Tempur Sealy International Inc. led the market with a slightly higher share of 13%.
- Other major companies, such as Spring Air International and Simmons Bedding Company LLC, each accounted for 10% of the market.
- Kingsdown Inc. and Serta Inc. also held substantial shares at 11% each.
- Relyon Ltd. mirrored Spring Air and Simmons with a 10% share.
- Collectively, other key players in the market also represented 11% of the market share. Indicating a diversified and competitive environment where no single company dominated overwhelmingly. Thereby offering multiple options and varied product features to consumers across the global market.
(Source: market.us)
Global Mattress Market Share – By Region Statistics
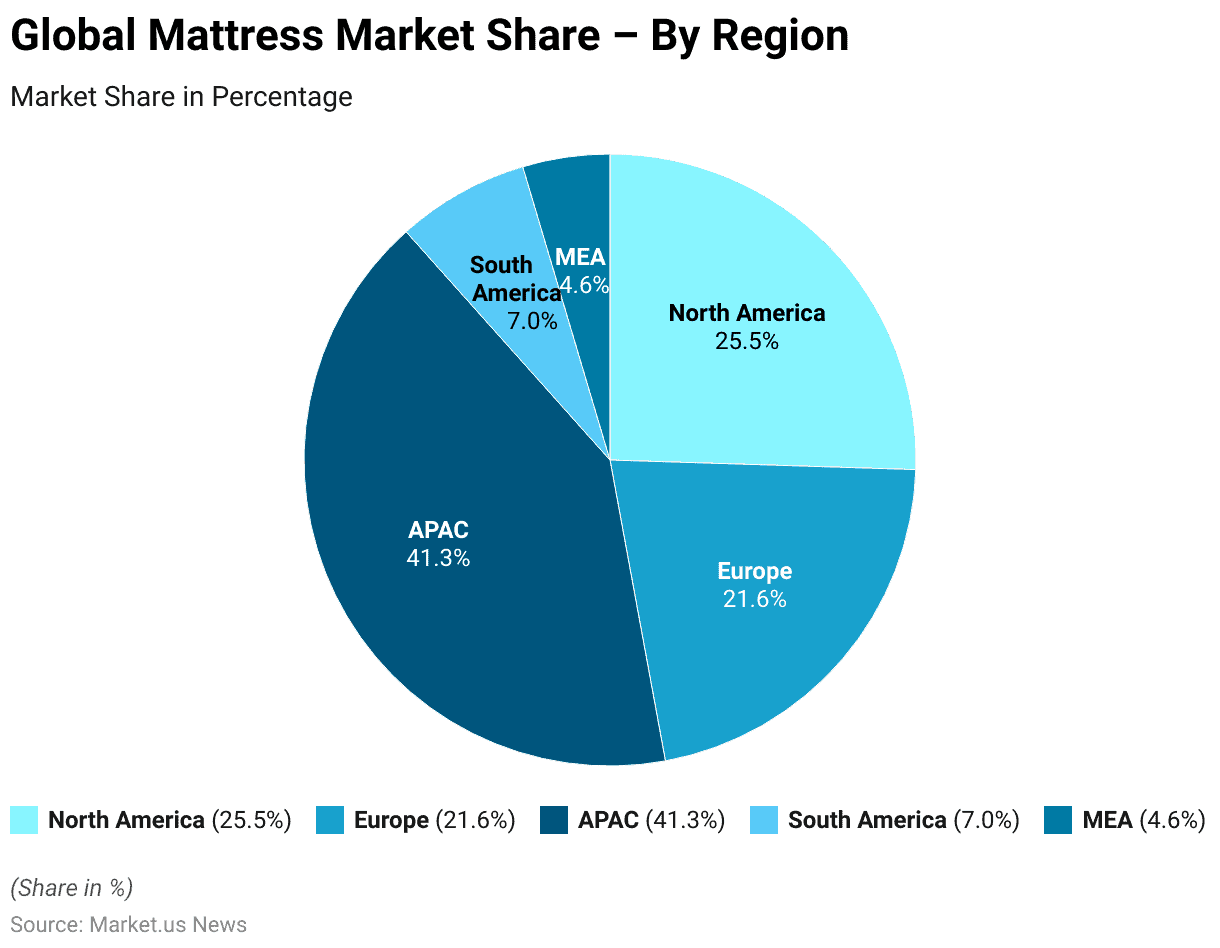
- In 2021, the distribution of the global mattress market shares by region reflected significant variations.
- The Asia-Pacific (APAC) region led with a substantial 41.3% of the global market, underscoring its dominant position.
- North America followed with a significant contribution of 25.5% to the market.
- Europe also held a notable share, accounting for 21.6%.
- South America, the Middle East, and Africa (MEA) regions, while smaller in comparison. Still represented important markets with shares of 7.0% and 4.6%, respectively.
- This regional distribution highlights the global diversity in the mattress market, with APAC’s large share indicating a robust demand driven possibly by large populations and increasing consumer spending power in this region.
(Source: market.us)
Mattress Market Revenue – By Country Statistics
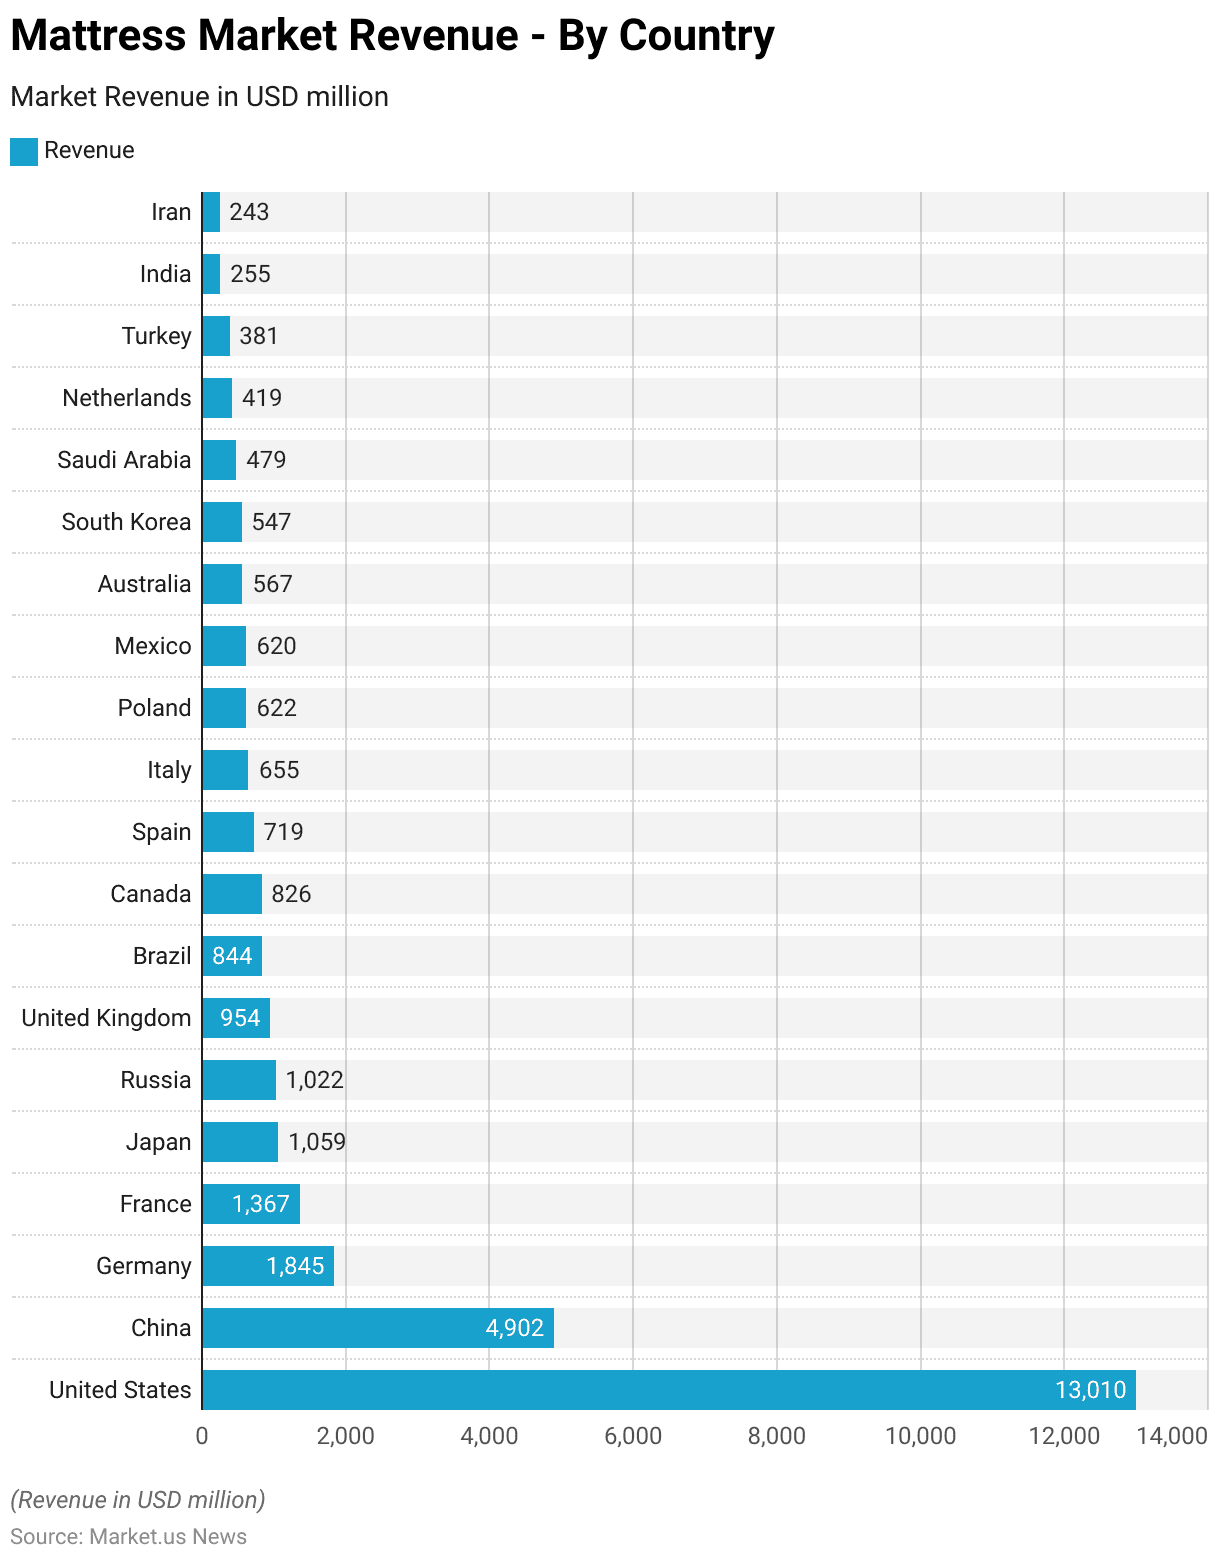
- In 2024, the mattress market revenue varied significantly by country, with the United States leading at USD 13,010 million, indicative of its large consumer base and mature market.
- China followed with a substantial revenue figure of USD 4,902 million. Reflecting its growing middle class and increased spending on home goods.
- Germany and France also showed strong market revenues with USD 1,845 million and USD 1,367 million, respectively. Driven by their robust economies and high standard of living.
- Other significant contributors included Japan and Russia, with revenues of USD 1,059 million and USD 1,022 million, respectively. Highlighting their consumer demand for quality sleep products.
- The United Kingdom, Brazil, and Canada also had notable market revenues, with USD 954 million, USD 844 million, and USD 826 million, respectively. Demonstrating the global reach and diversity of the mattress market.
- European countries like Spain, Italy, and Poland recorded revenues of USD 719 million, USD 655 million, and USD 622 million, respectively. While Mexico closely followed with USD 620 million.
- Australia and South Korea showed their market strength with revenues of USD 567 million and USD 547 million, respectively.
- Saudi Arabia, the Netherlands, Turkey, India, and Iran also contributed to the market, albeit with smaller revenues. Showing a mix of emerging and established markets with figures ranging from USD 479 million in Saudi Arabia to USD 243 million in Iran.
- This distribution emphasizes the global nature of the mattress industry and the varying degrees of market penetration and growth across different regions.
(Source: Statista)
Revenue Generation Through Mattress Statistics
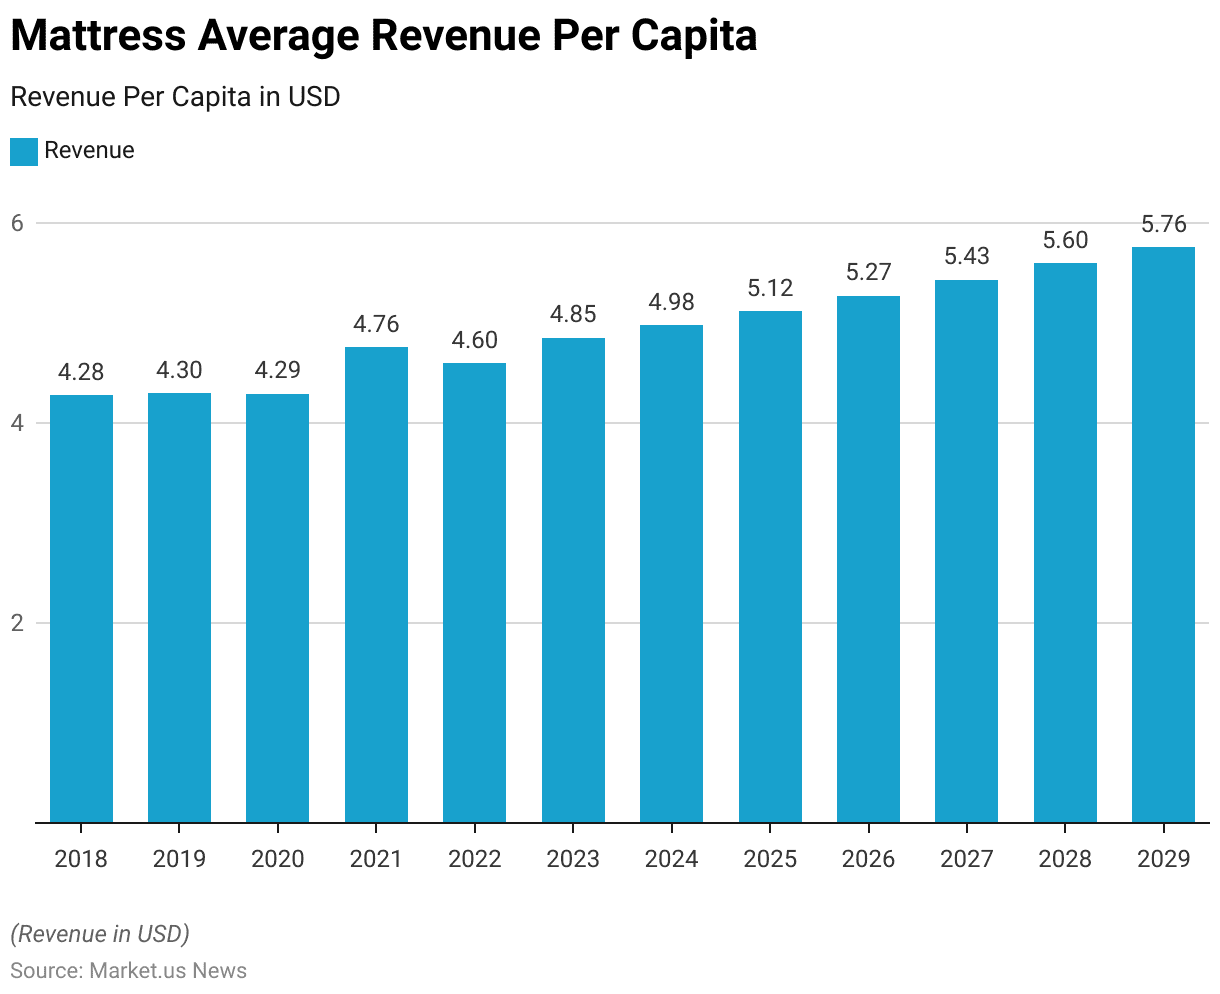
- The average revenue per capita from mattress sales has shown a gradual increase over the years. Reflecting positive trends in market penetration and value growth.
- In 2018, the revenue per capita was USD 4.28, which slightly increased to USD 4.30 in 2019.
- There was a slight decline in 2020, bringing it to USD 4.29. Followed by a more significant rise in 2021 to USD 4.76, indicating a recovery and growth phase.
- The following year, 2022, saw a small dip to USD 4.60 but rebounded again in 2023 to USD 4.85.
- The upward trend continued steadily; by 2024, it reached USD 4.98, and by 2025, it further increased to USD 5.12.
- This growth persisted into the latter part of the decade, with the revenue per capita reaching USD 5.27 in 2026, USD 5.43 in 2027, USD 5.60 in 2028, and peaking at USD 5.76 by 2029.
- This consistent increase indicates a robust expansion in consumer spending on mattresses. Possibly driven by rising awareness of sleep health and the introduction of innovative products in the market.
(Source: Statista)
Air Mattress Market Size Worldwide Statistics
- The worldwide market size for air mattresses has exhibited robust growth from 2018 to 2025.
- In 2018, the market began at USD 127.53 million, showing a progressive increase to USD 138.49 million in 2019.
- The growth continued steadily, with the market reaching USD 150.4 million in 2020.
- In the following year, 2021, the size expanded to USD 163.34 million, and further growth was observed in 2022 when it reached USD 177.39 million.
- The upward trajectory persisted into 2023, with the market size expanding to USD 192.64 million.
- By 2024, the market size was projected to increase to USD 209.21 million, and it was expected to reach USD 227.2 million by 2025.
- This consistent growth in the air mattress market underscores an increasing consumer preference for portable and convenient bedding solutions. Likely driven by factors such as increased travel and the need for space-saving furniture.
(Source: Statista)
Smart Mattress Market Size Worldwide Statistics
- The worldwide market size for smart mattresses has experienced consistent growth from 2018 to 2025.
- It began in 2018 with a market size of USD 1.04 billion, indicating early consumer interest in technology-enhanced sleep solutions.
- In 2019, this figure increased to USD 1.15 billion and continued to rise to USD 1.27 billion in 2020, showing resilience even amid global economic uncertainties.
- The growth trend persisted, with the market expanding to USD 1.4 billion in 2021 and USD 1.55 billion in 2022.
- By 2023, the market size had increased to USD 1.72 billion.
- Projections for the subsequent years remained positive, with the market expected to reach USD 1.9 billion in 2024 and further grow to USD 2.1 billion by 2025.
- This growth trajectory reflects the increasing consumer demand for mattresses that offer enhanced comfort, personalized sleep data, and integrated technology features. Highlighting the evolving preferences towards high-tech home products.
(Source: Statista)
Mattress Manufacturing & Production Statistics in Various Countries
Sales from the Manufacture of Mattress in the United Kingdom (UK) Statistics
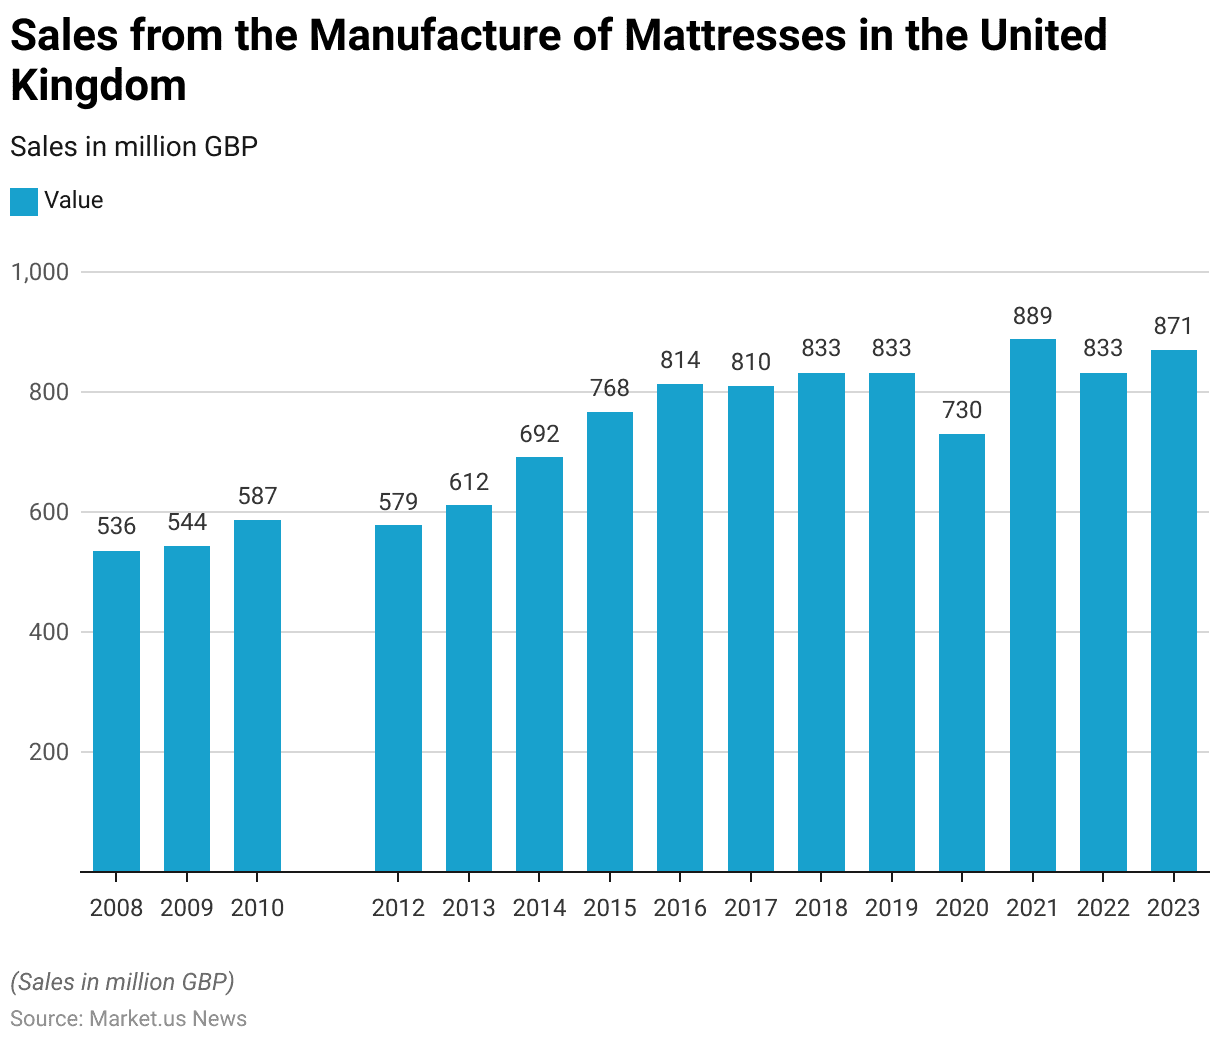
- Sales from the manufacture of mattresses in the United Kingdom exhibited a general upward trend from 2008 to 2023.
- Starting in 2008, sales were valued at GBP 536 million and saw a modest increase to GBP 544 million in 2009.
- Growth continued over the next few years, reaching GBP 587 million in 2010.
- After a slight dip to GBP 579 million in 2012, sales began to climb steadily. Hitting GBP 612 million in 2013 and escalating to GBP 692 million by 2014.
- The growth persisted, with sales reaching GBP 768 million in 2015 and further rising to GBP 814 million in 2016.
- A slight decrease occurred in 2017, with sales dropping to GBP 810 million. But they bounced back to GBP 833 million in both 2018 and 2019.
- The year 2020 saw a significant decrease to GBP 730 million, likely impacted by economic disruptions. However, a robust recovery was observed in 2021, with sales peaking at GBP 889 million.
- The following year, sales stabilized back to GBP 833 million, and in 2023, they increased to GBP 871 million. Demonstrating the resilience and sustained demand within the UK mattress manufacturing sector.
(Source: Statista)
Production Value of Mattress in Brazil Statistics
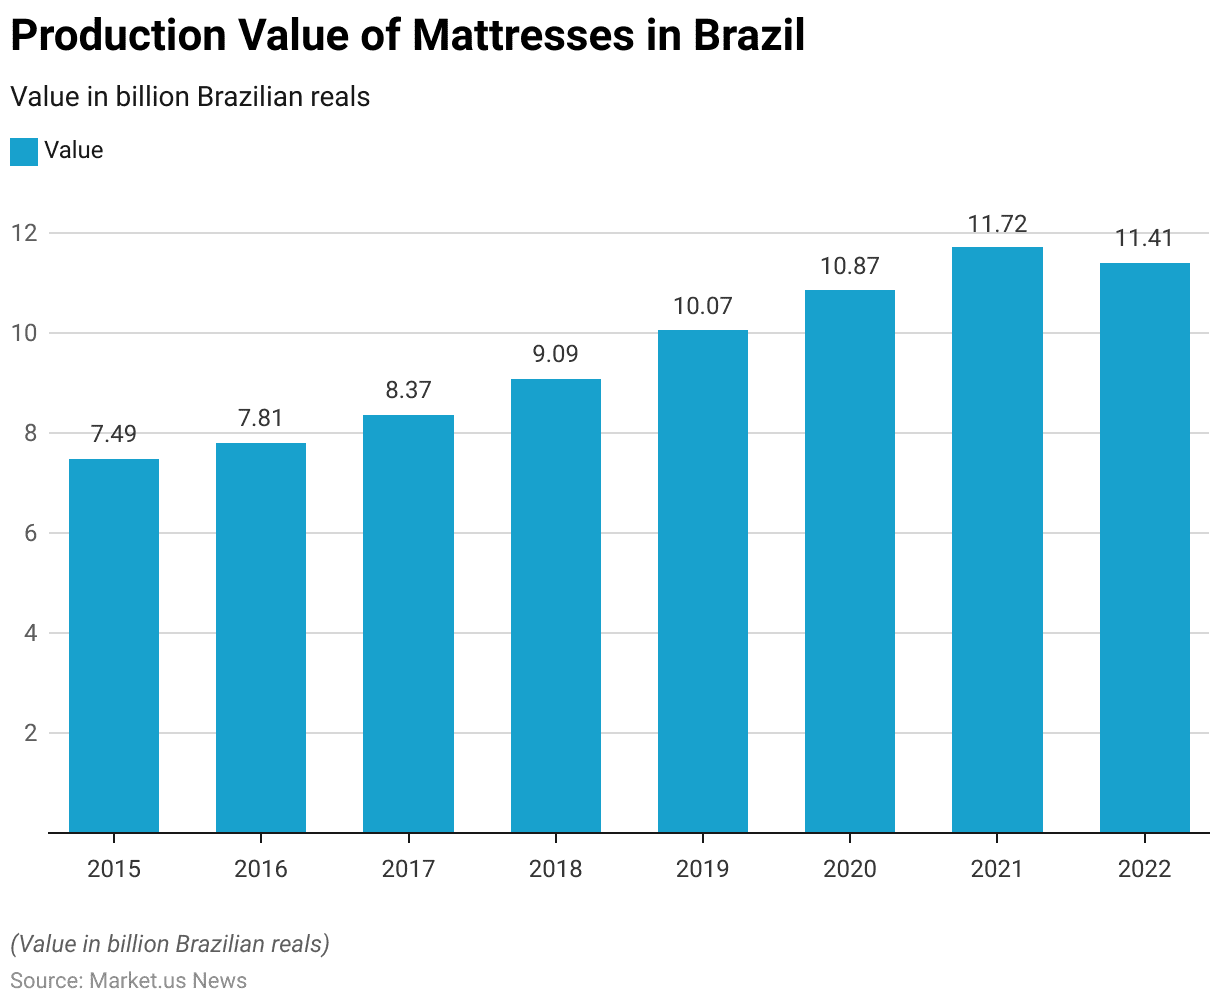
- The production value of mattresses in Brazil from 2015 to 2022 demonstrated consistent growth. Reflecting an expanding market within the country.
- In 2015, the production value started at BRL 7.49 billion and showed a slight increase to BRL 7.81 billion in 2016.
- The following year, 2017, saw a more significant rise to BRL 8.37 billion.
- This growth trend continued, with the value reaching BRL 9.09 billion in 2018 and crossing into double digits at BRL 10.07 billion in 2019.
- The upward trajectory persisted into 2020, with the production value climbing to BRL 10.87 billion despite global economic challenges.
- By 2021, the value peaked at BRL 11.72 billion, marking the highest in this period.
- However, there was a slight reduction in 2022, with the production value adjusting to BRL 11.41 billion, possibly indicating market adjustments or external economic impacts.
- This overall growth over the years highlights the increasing demand and investment in the mattress industry within Brazil.
(Source: Statista)
Production Value of Mattress in Austria Statistics
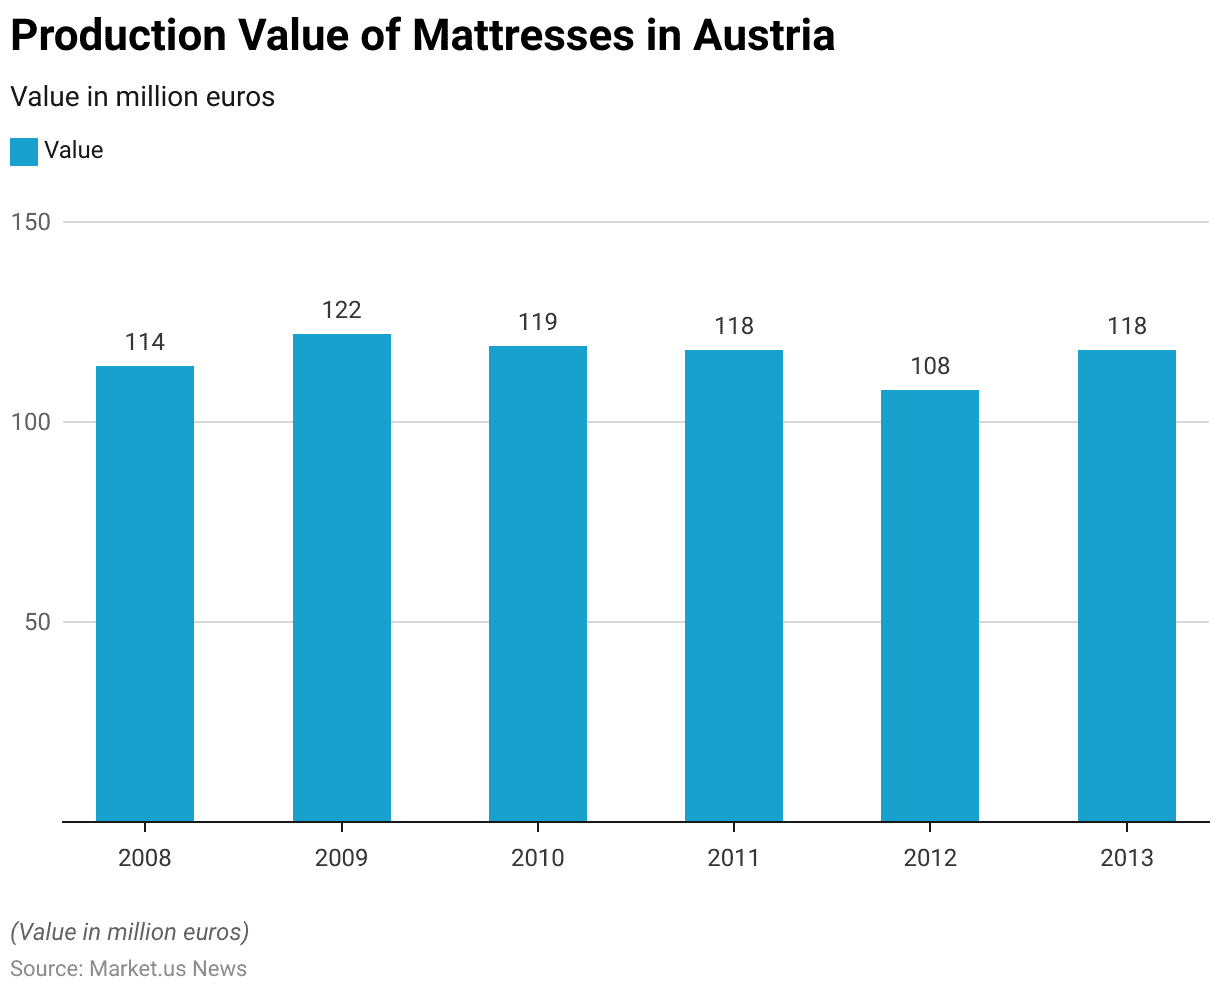
- The production value of mattresses in Austria from 2008 to 2013 experienced fluctuations over six years.
- In 2008, the production value was EUR 114 million.
- It increased in 2009 to EUR 122 million, showing a positive trend in the market.
- However, this trend slightly reversed in the following years, with the production value decreasing to EUR 119 million in 2010 and then to EUR 118 million in 2011.
- A more substantial drop was observed in 2012 when the value fell to EUR 108 million. The lowest in the observed period.
- Nevertheless, there was a recovery in 2013, with the production value climbing back to EUR 118 million, aligning with the levels seen in 2011.
- This period highlights the variability in the Austrian mattress production market. Possibly influenced by economic cycles and changes in consumer spending behavior.
(Source: Statista)
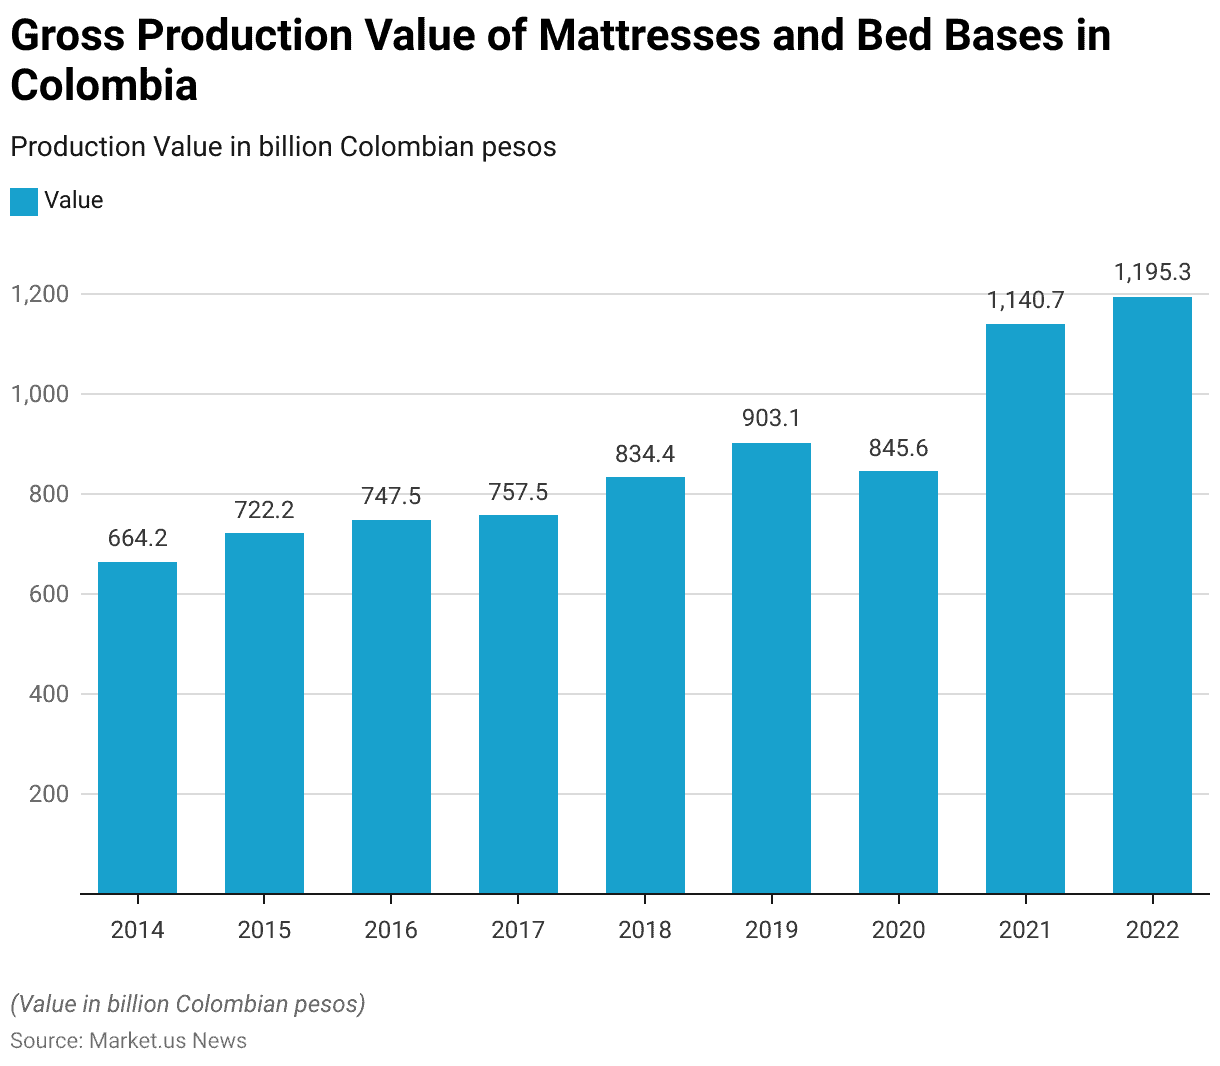
Gross Production Value of Mattress and Bed Bases in Colombia Statistics
- The gross production value of mattresses and bed bases in Colombia saw significant growth from 2014 to 2022.
- In 2014, the production value was recorded at COP 664.21 billion.
- This figure gradually increased over the next few years, reaching COP 722.15 billion in 2015, COP 747.47 billion in 2016, and slightly higher at COP 757.49 billion in 2017.
- The growth trend continued more robustly, with the value climbing to COP 834.43 billion in 2018 and further to COP 903.07 billion in 2019.
- Although there was a slight dip in 2020 with a value of COP 845.63 billion, likely impacted by economic disturbances. A significant rebound occurred in 2021 when the production value surged to COP 1,140.73 billion.
- The upward momentum was maintained into 2022, with the production value reaching COP 1,195.3 billion.
- This progression indicates strong growth and expansion within Colombia’s mattress and bed base manufacturing sector over these years.
(Source: Statista)
Industry Revenue of Mattress Manufacturing in the U.S. Statistics
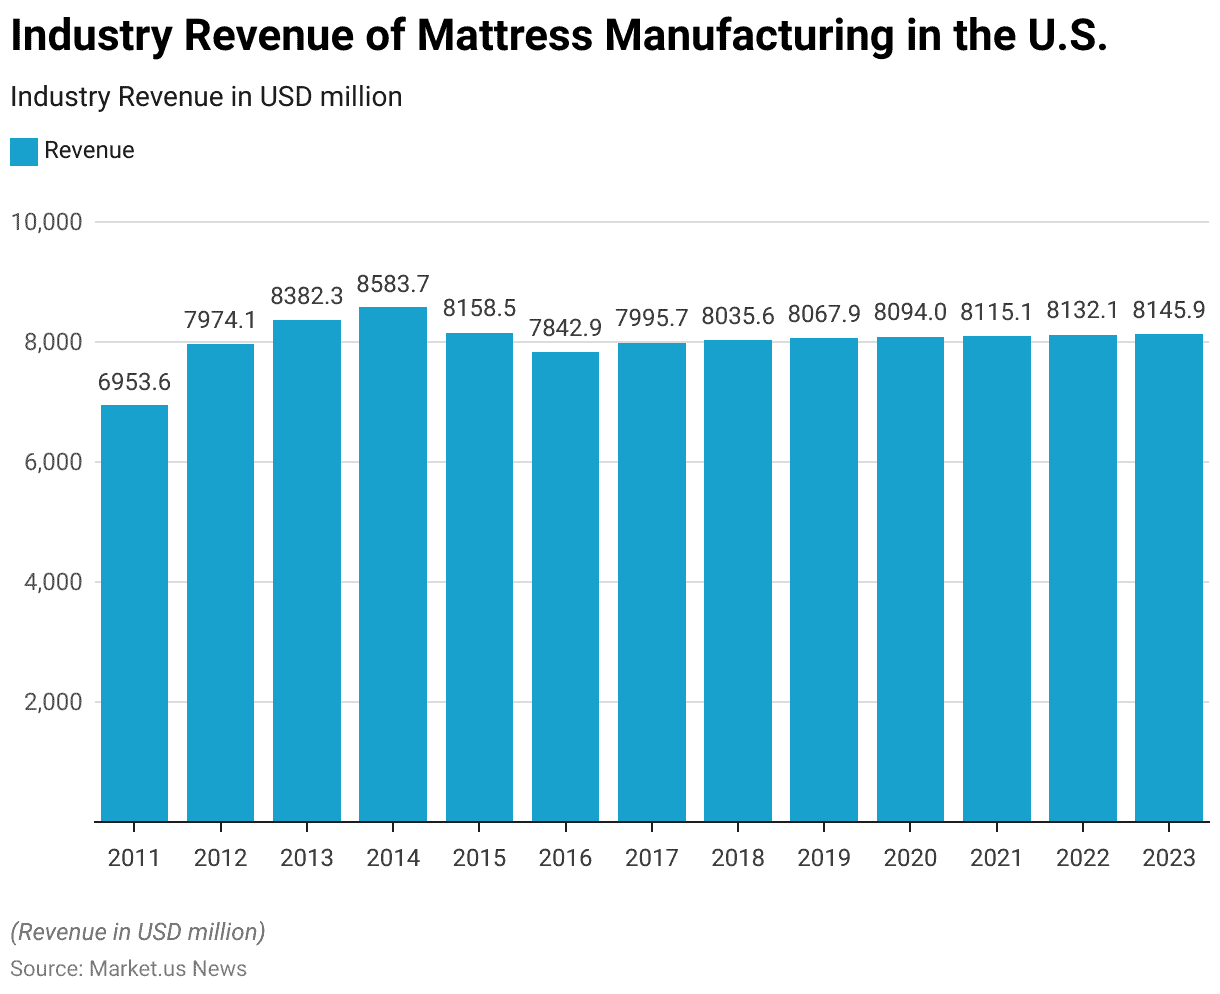
- The industry revenue for mattress manufacturing in the U.S. from 2011 to 2023 has shown fluctuations but generally maintained an upward trajectory.
- Starting in 2011, the revenue was recorded at USD 6,953.60 million.
- It saw a substantial increase in the following year, reaching USD 7,974.14 million in 2012.
- This growth continued, with revenue climbing to USD 8,382.28 million in 2013 and peaking at USD 8,583.71 million in 2014.
- However, a slight decline was observed in 2015, with revenue falling to USD 8,158.49 million and further to USD 7,842.93 million in 2016.
- The industry saw a mild recovery in 2017, with revenues increasing to USD 7,995.68 million, and continued to edge upward in subsequent years. Reaching USD 8,035.62 million in 2018, USD 8,067.90 million in 2019, and USD 8,093.98 million in 2020.
- The growth was sustained in the following years, albeit at a slower pace, with revenue recorded at USD 8,115.06 million in 2021, USD 8,132.10 million in 2022, and USD 8,145.86 million in 2023.
- This pattern indicates a resilient industry, managing to grow incrementally amidst varying economic conditions.
(Source: Statista)
Germany Industry Revenue of Mattress Manufacturing Statistics
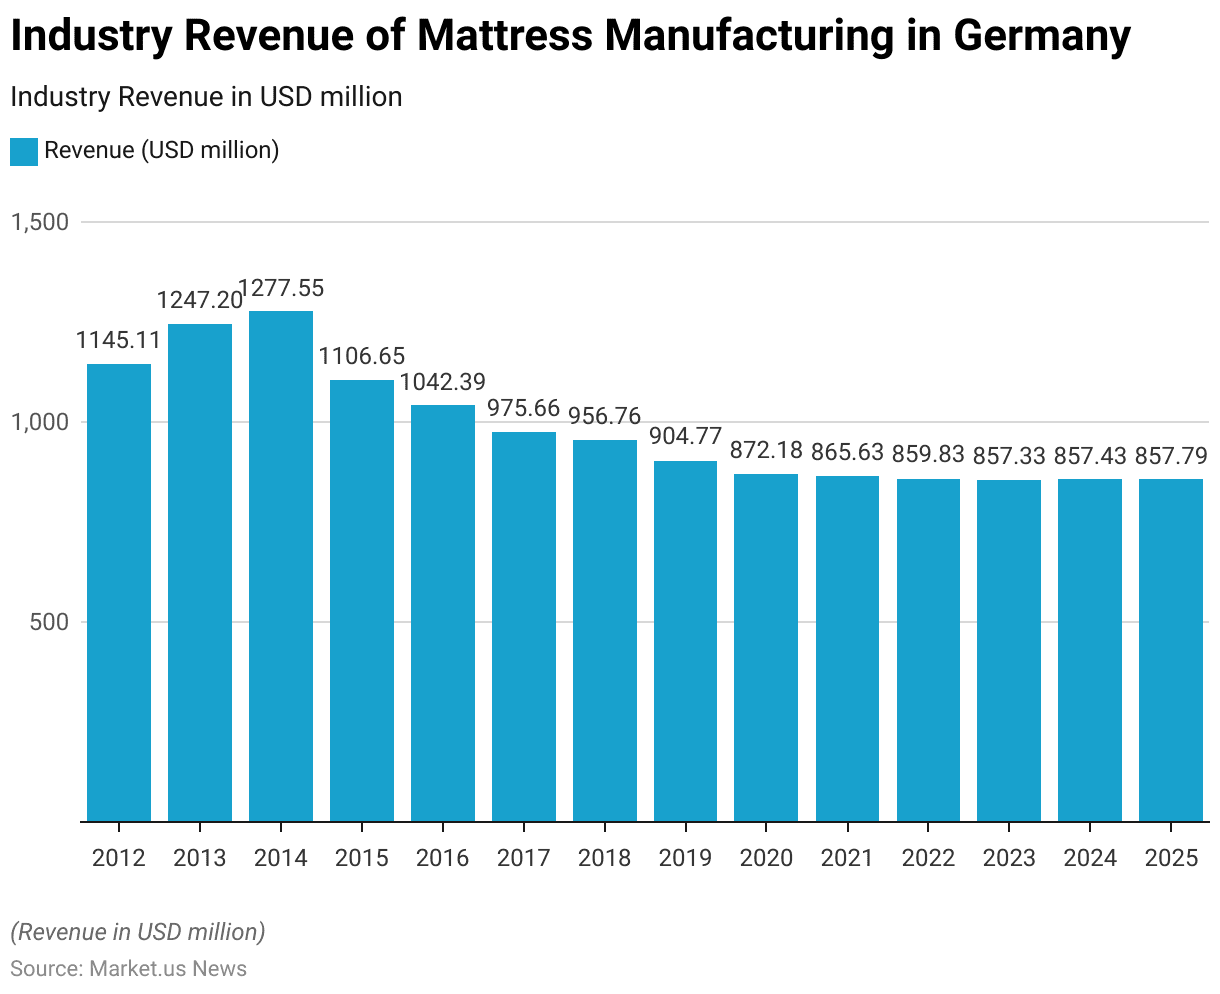
- The industry revenue of mattress manufacturing in Germany from 2012 to 2025 has experienced a noticeable decline over the years.
- Starting in 2012, the revenue was robust at USD 1,145.11 million.
- This number grew over the next two years, reaching USD 1,247.20 million in 2013 and peaking at USD 1,277.55 million in 2014.
- However, a downward trend began in 2015, with revenues dropping to USD 1,106.65 million, and this decline continued more sharply in the subsequent years.
- By 2016, the revenue had further decreased to USD 1,042.39 million, and by 2017, it had dropped below the billion mark to USD 975.66 million.
- This contraction persisted, with 2018 revenues at USD 956.76 million and a further dip to USD 904.77 million in 2019.
- The downward trend was exacerbated by 2020, with revenues falling to USD 872.18 million, and continued to decrease gradually over the next few years.
- By 2021, revenue was USD 865.63 million, and projections for the following years showed little variation. Stabilizing around USD 857 million by 2023 and projected to rise to USD 857.79 million by 2025.
- This pattern suggests a significant market contraction, reflecting challenges such as market saturation. Competitive pressures, or possibly shifts in consumer preferences within the German mattress industry.
(Source: Statista)
Australia Industry Revenue of Mattress Manufacturing Statistics
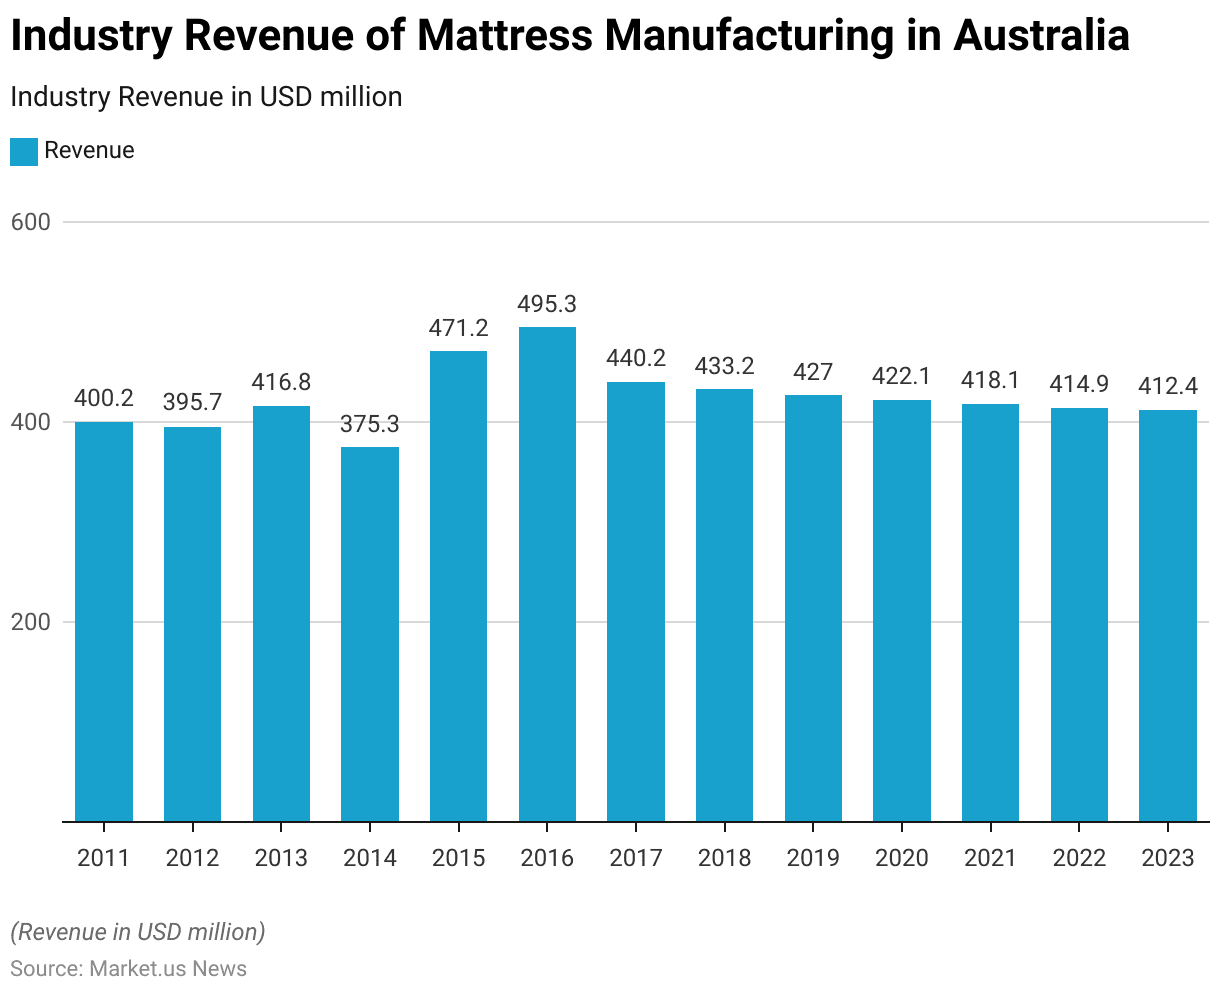
- The industry revenue for mattress manufacturing in Australia from 2011 to 2023 showed varying trends with periods of growth and decline.
- In 2011, the revenue was USD 400.2 million. It experienced a slight decrease in 2012 to USD 395.67 million but rebounded in 2013, reaching USD 416.81 million.
- A sharp drop occurred in 2014 when revenue fell to USD 375.28 million.
- However, a significant recovery ensued, with 2015 seeing a substantial rise to USD 471.18 million, and this upward momentum continued into 2016, peaking at USD 495.34 million.
- From 2017 onwards, a gradual downward trend began. Starting with a drop to USD 440.22 million in 2017, followed by USD 433.22 million in 2018 and USD 427.03 million in 2019.
- This trend of contraction persisted into the following years, with revenue decreasing steadily each year: USD 422.07 million in 2020, USD 418.1 million in 2021, USD 414.93 million in 2022, and further to USD 412.39 million projected for 2023.
- This overall pattern highlights fluctuations in the Australian mattress market. Likely influenced by economic factors, market saturation, and evolving consumer preferences.
(Source: Statista)
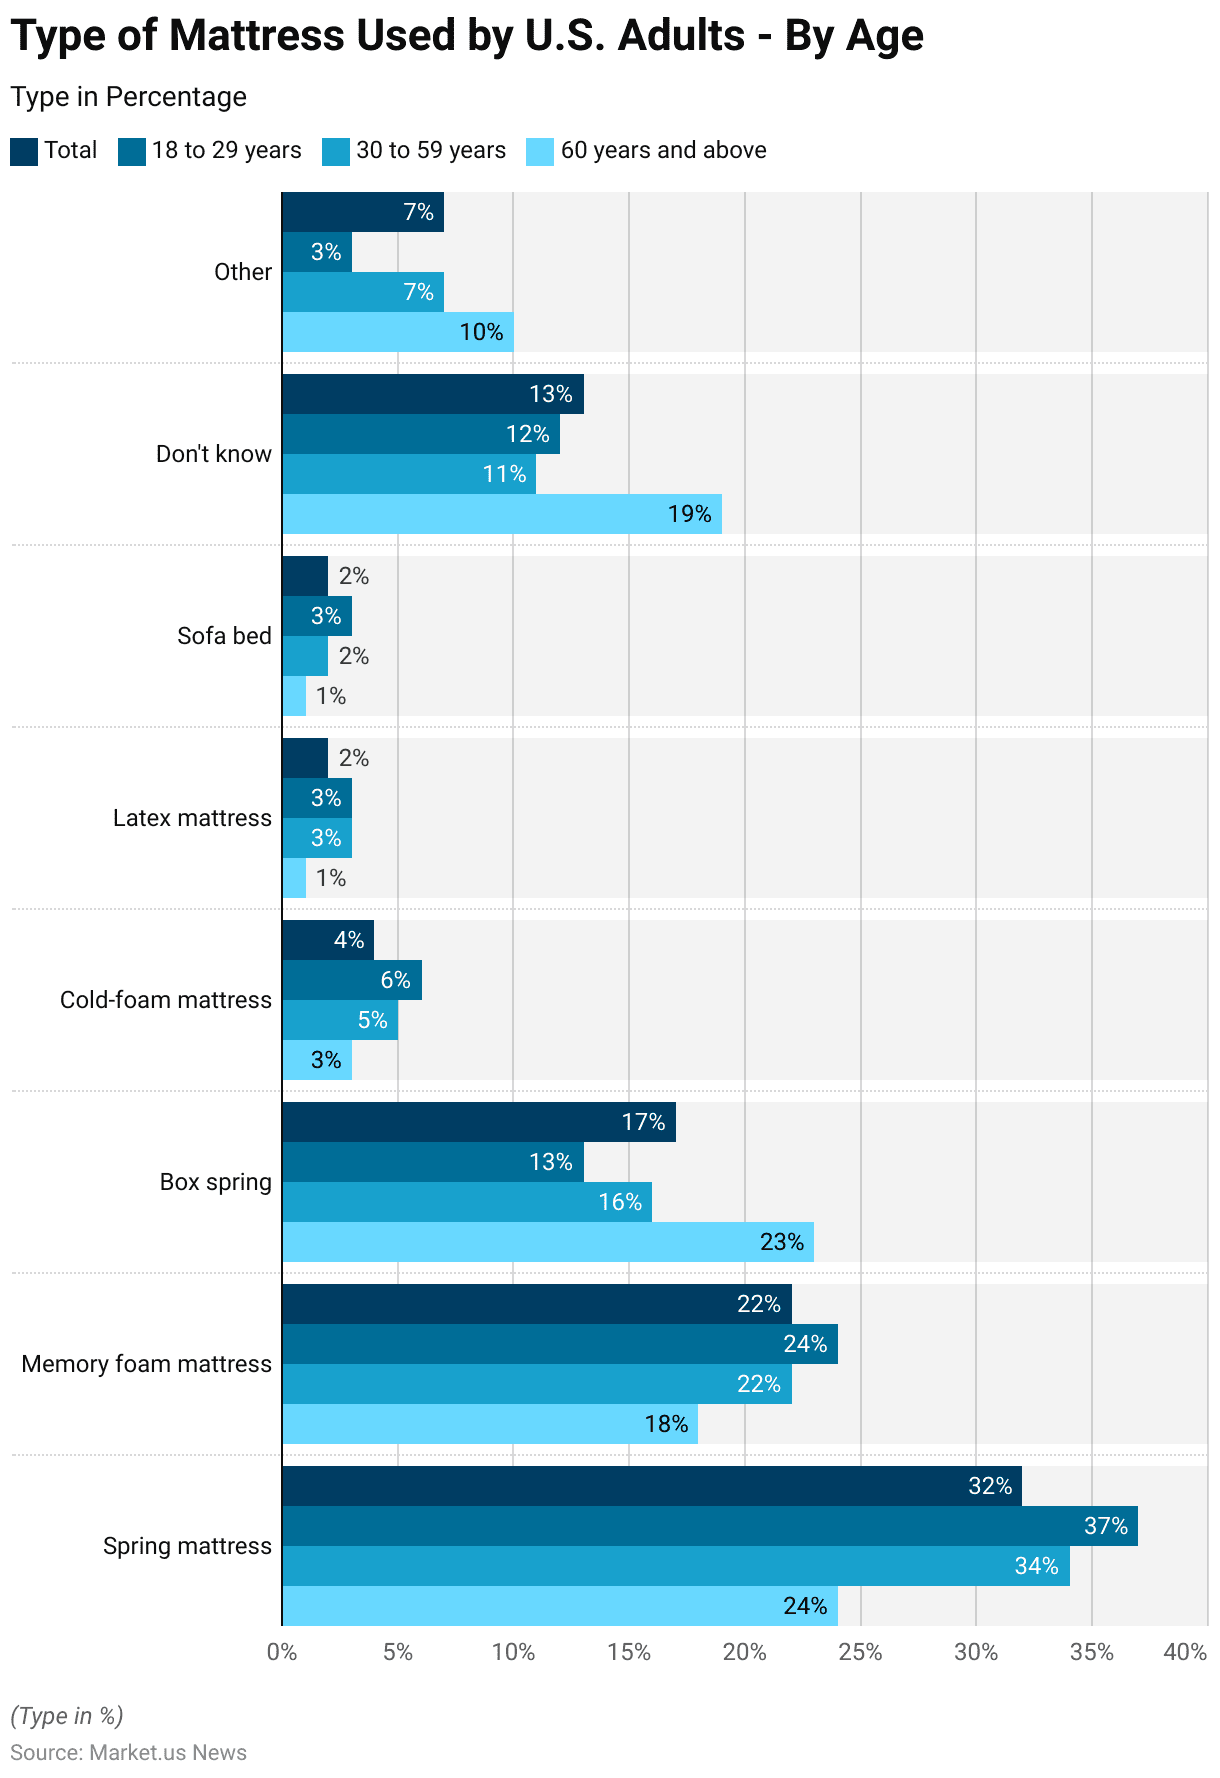
Type of Mattress Used by Adults – By Age Statistics
- In a 2017 survey analyzing the types of mattresses used by U.S. adults across different age groups. It was observed that preferences varied significantly by age.
- Spring mattresses were the most popular overall, used by 32% of respondents, with higher preferences noted among the younger age groups (37% of 18 to 29-year-olds and 34% of 30 to 59-year-olds) compared to only 24% among those aged 60 and above.
- Memory foam mattresses were the second most popular, preferred by 22% of all adults. Showing slightly higher usage among 18 to 29-year-olds at 24% and the least among those over 60, at 18%.
- Box spring mattresses were used by 17% of all participants, with a notable preference among those aged 60 and above at 23%, higher than the younger cohorts.
- Cold-foam mattresses, less common, were used by 4% of respondents, with slightly higher usage reported by 18 to 29-year-olds and 30 to 59-year-olds at 6% and 5%, respectively.
- Latex mattresses and sofa beds were the least used. Each garnering only 2% overall, with minimal usage among those aged 60 and above.
- Interestingly, 13% of participants were unsure about their type of mattress, with uncertainty increasing with age—19% among those 60 and older.
- Other types of mattresses accounted for 7% of the total, with 10% usage in the oldest age group. Suggesting some diversification in mattress preferences among older people.
- This distribution highlights significant differences in mattress choices across age groups. Reflecting varying needs and preferences for comfort and support among U.S. adults.
(Source: Statista)
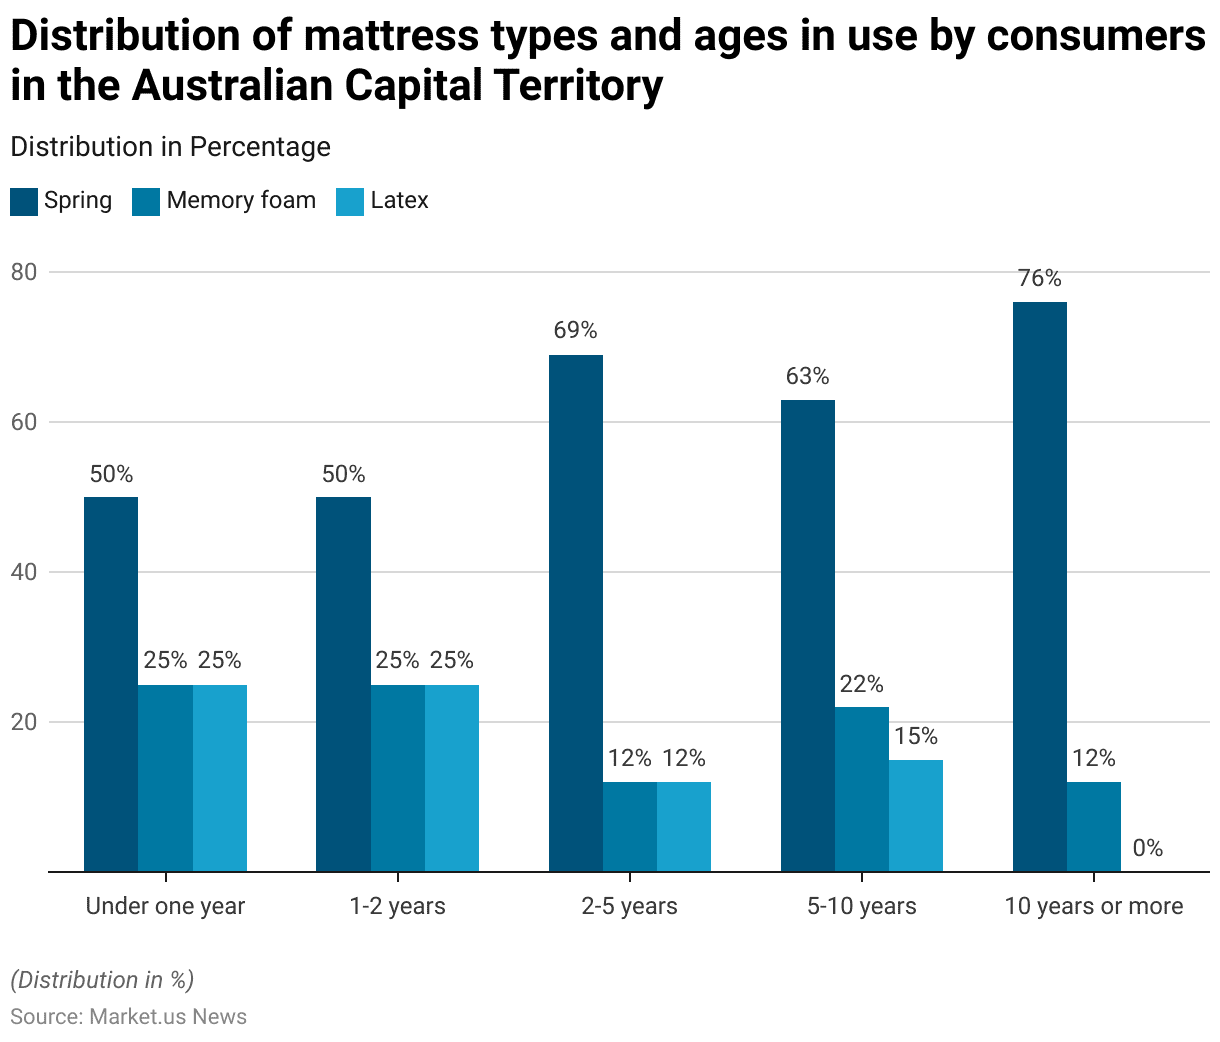
Type and Age of Mattress in Use Statistics
- In August 2018, a survey conducted in the Australian Capital Territory analyzed the distribution of mattress types based on the age of consumers who use them.
- The survey results indicated varying preferences for spring, memory foam, and latex mattresses over different durations of use.
- For mattresses that were under one year old, the distribution was evenly split, with 50% being spring mattresses and 25% each for memory foam and latex. This distribution pattern was consistent for mattresses aged between 1 and 2 years as well.
- However, as the mattresses aged, preferences shifted notably. From ages 2 to 5 years, 69% were spring mattresses. While memory foam and latex each accounted for 12%.
- For those between 5 and 10 years of age, spring mattresses constituted 63%, memory foam 22%, and latex 15%.
- Notably, for mattresses that were 10 years or older. A significant majority of 76% were spring mattresses, with memory foam dropping to 12% and latex mattresses completely absent.
- This data suggests that spring mattresses tend to be retained longer by consumers. Possibly due to their durability or consumer preference for the traditional spring support system over time.
- Memory foam mattresses also show longevity but tend to decrease in favor as they age beyond a decade. Latex mattresses, on the other hand, appear to be less favored for long-term use or might not hold up as well over extended periods.
(Source: Statista)
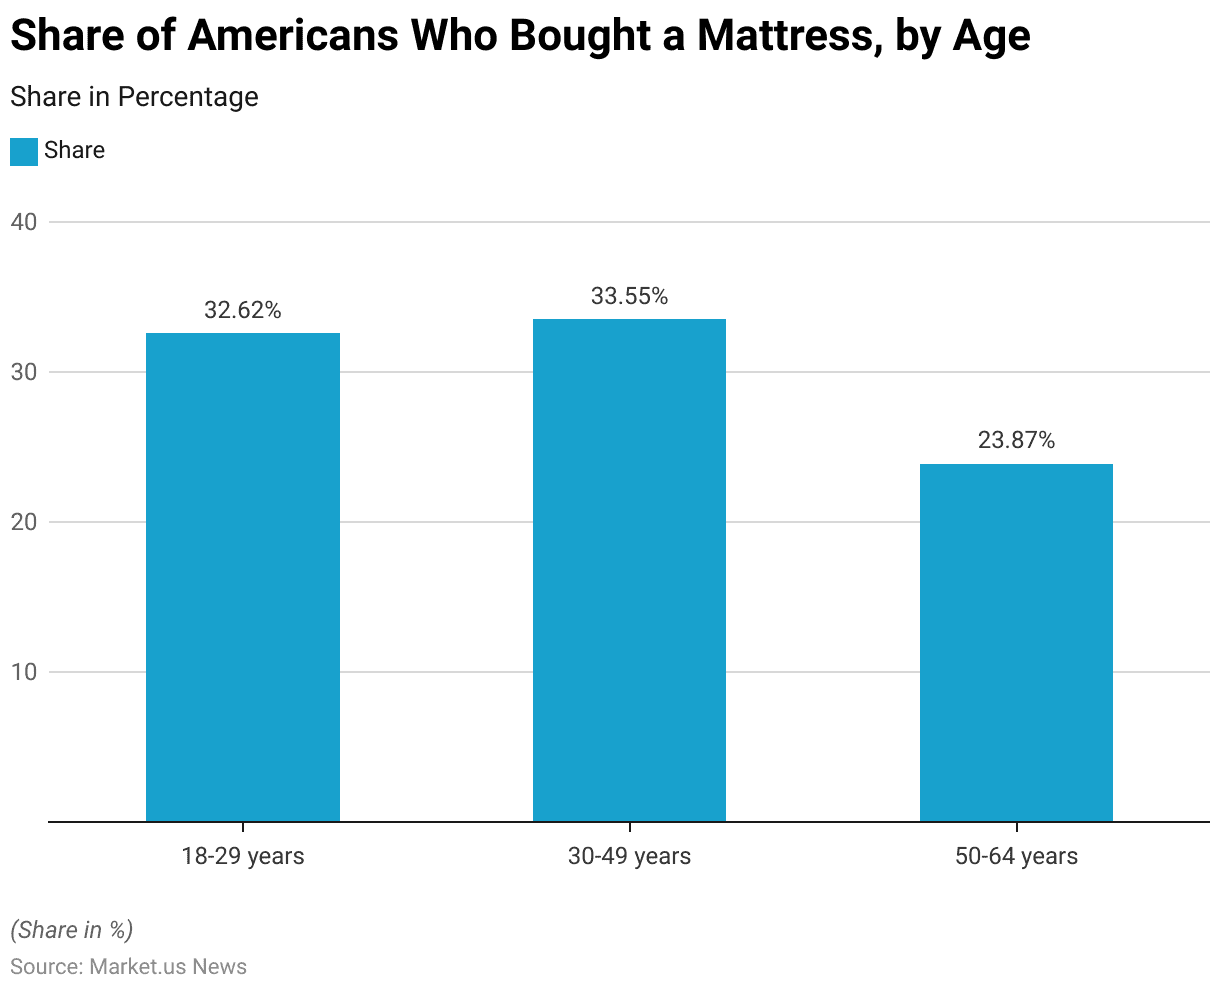
Purchase of a Mattress – By Age Statistics
- In 2018, a survey on the purchasing patterns of Americans for mattresses revealed distinct trends across different age groups within the last 12 months.
- Among younger adults aged 18-29 years, 32.62% reported having bought a mattress. Indicating a significant market engagement in this demographic. Possibly driven by life transitions such as moving to new homes or upgrading from older bedding.
- The 30-49 years age group had the highest proportion of mattress buyers, with 33.55% purchasing within the year. This age group likely represents established adults who are possibly investing in higher-quality bedding solutions for family needs or home improvements.
- However, for those aged 50-64 years, the share who purchased a mattress dropped to 23.87%, suggesting a decrease in the need to buy new mattresses. Possibly due to settled living situations or less frequent updates needed for their bedding.
- This data illustrates how mattress buying behavior can vary significantly with age, reflecting differing lifestyle needs and priorities.
(Source: Statista)
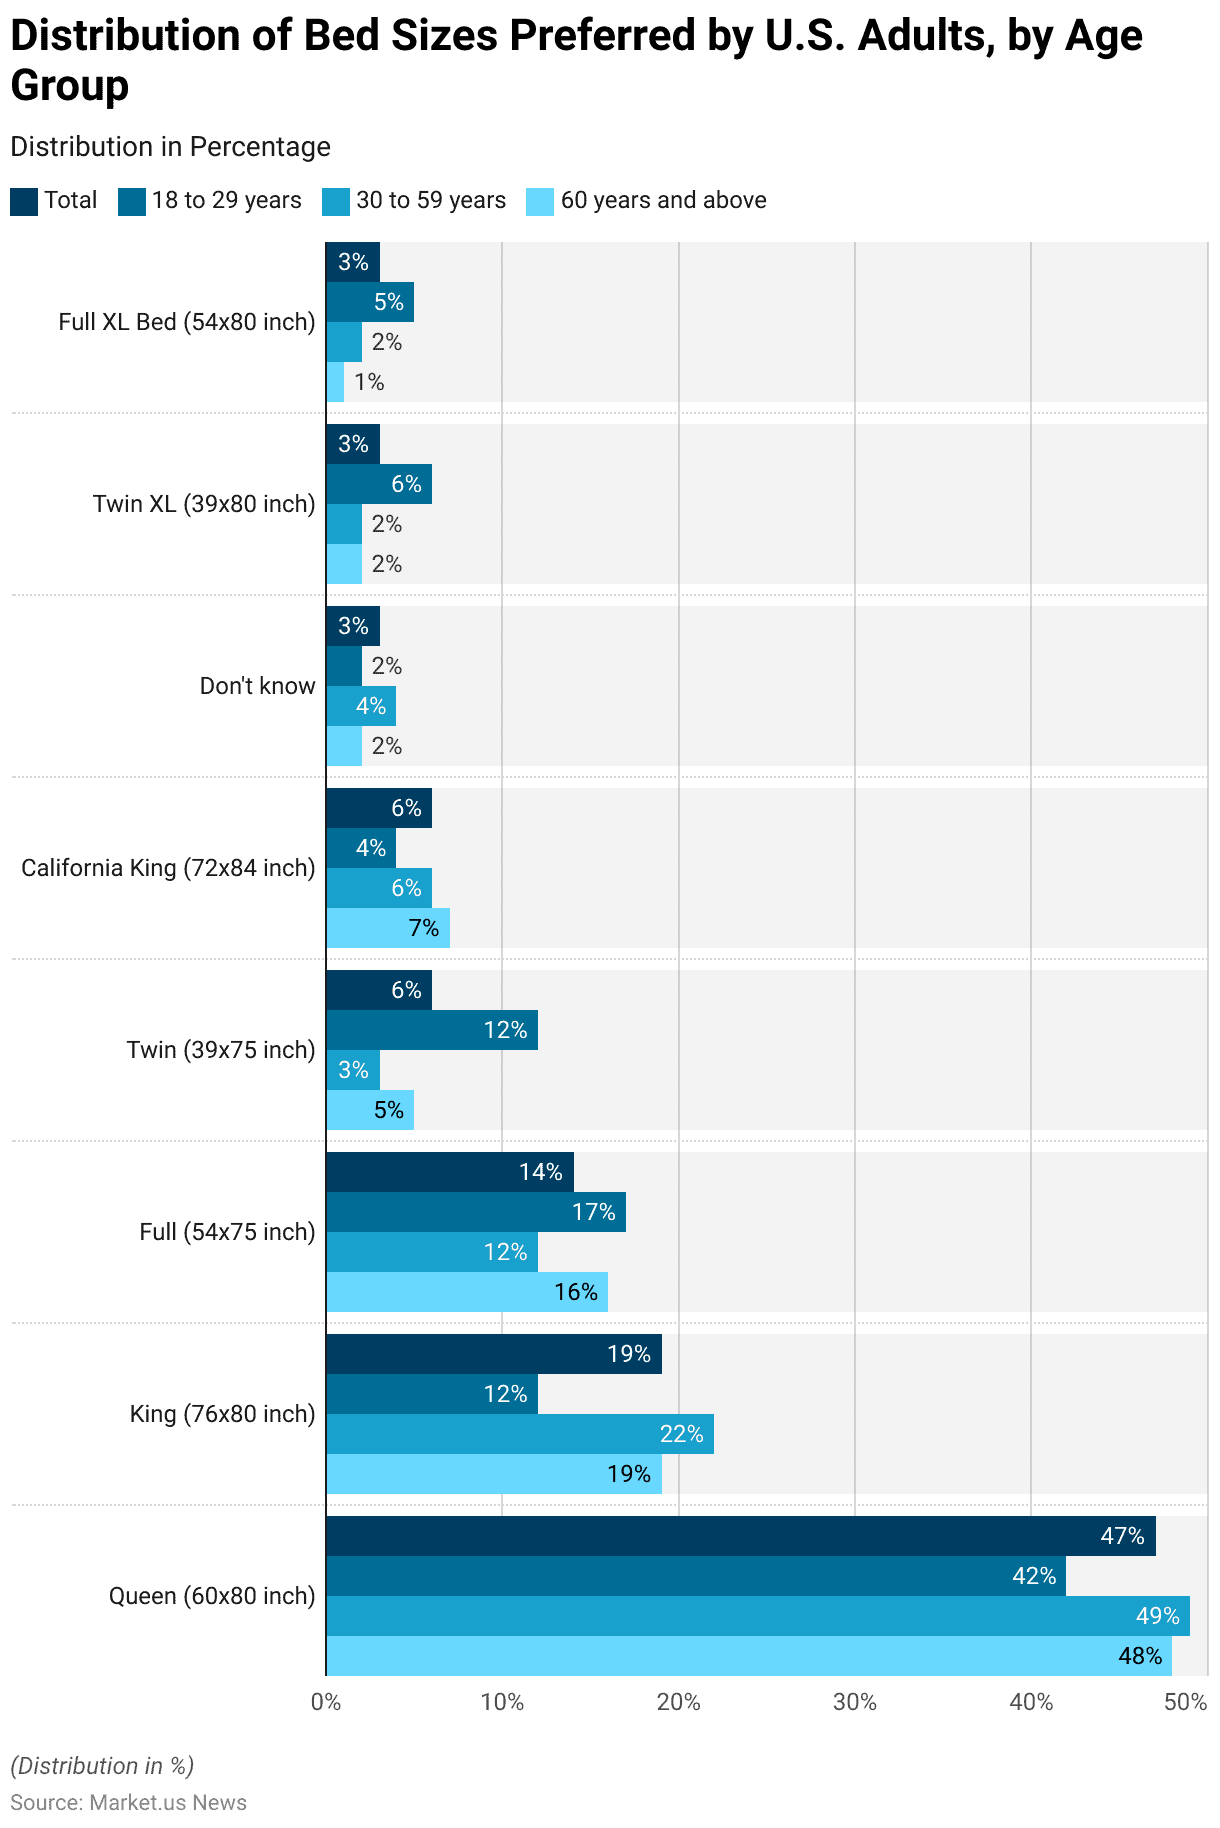
Mattress Sizes Preferred by Adults – By Age Group Statistics
- In 2017, a survey on U.S. adults’ bed size preferences revealed distinct variations across age groups.
- Queen-sized beds (60×80 inches) were the most popular choice among all age groups, with 47% of the total respondents opting for this size.
- Specifically, 42% of 18 to 29-year-olds, 49% of 30 to 59-year-olds, and 48% of those aged 60 years and above preferred this size.
- King-sized beds (76×80 inches) were the next popular choice, preferred by 19% of all respondents, but more favored among the 30 to 59-year age group at 22%, compared to 12% of younger adults and 19% of older adults.
- Full-sized beds (54×75 inches) were chosen by 14% of all participants, with a slightly higher preference among 18 to 29-year-olds at 17%.
- Twin beds (39×75 inches) accounted for 6% of the choices, with 12% of the younger group favoring them, which is significantly higher compared to other groups.
- California King beds (72×84 inches) and Twin XL beds (39×80 inches) each accounted for 6% and 3% of the total preferences, respectively.
- The least common was the Full XL bed (54×80 inches), preferred by 3% of the respondents, with a notable 5% preference among the 18 to 29-year-olds.
- Additionally, around 3% of respondents were unsure of their bed size. Indicating some uncertainty in mattress dimensions among the general populace.
(Source: Statista)
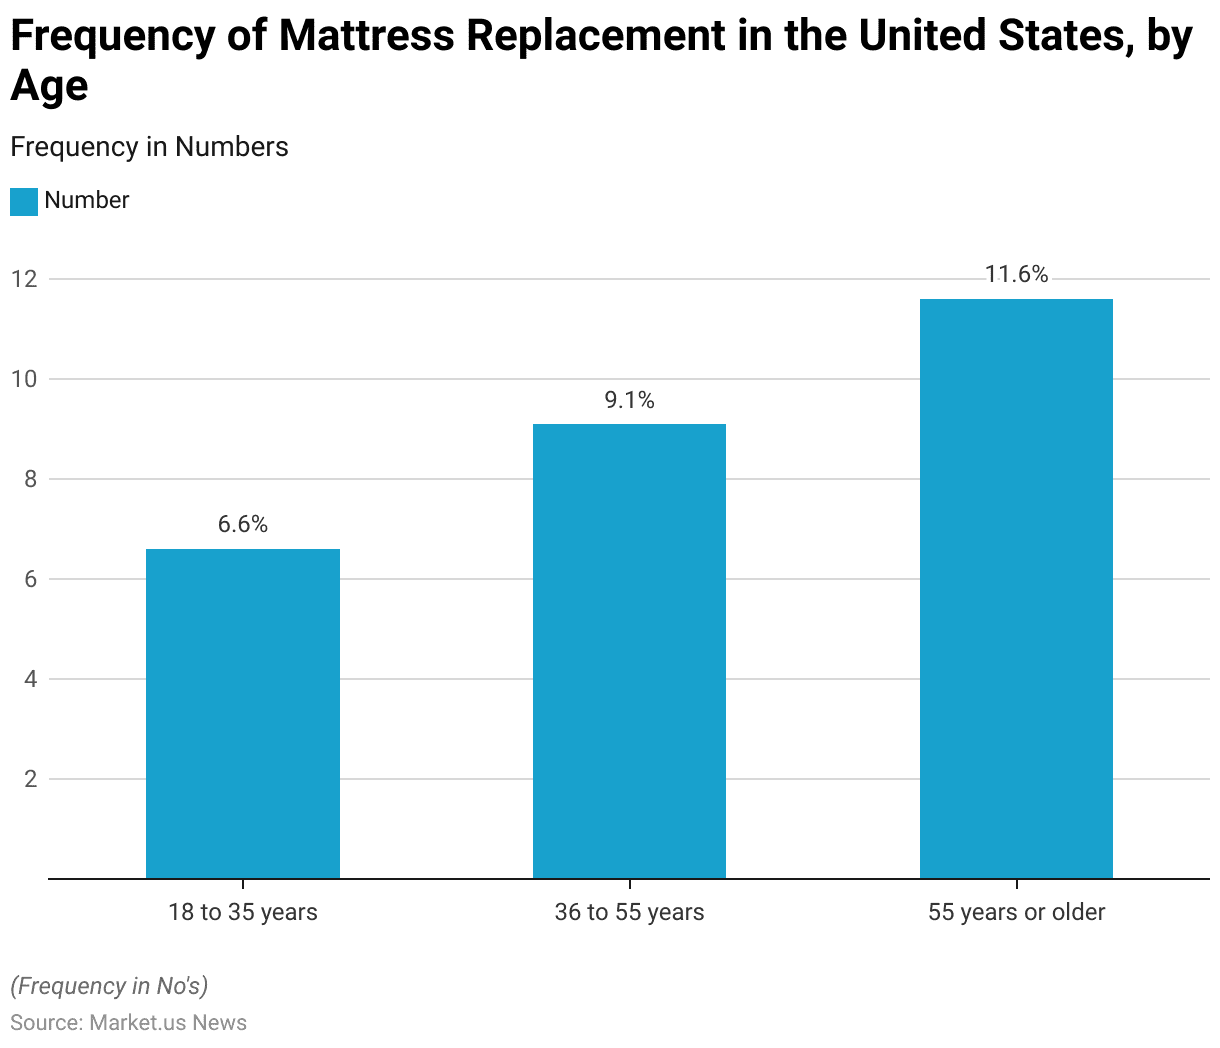
Frequency of Mattress Replacement – By Age Statistics
- In 2018, data on the frequency of mattress replacement among U.S. consumers highlighted variations based on age groups.
- Younger consumers, specifically those aged 18 to 35 years, typically expected to keep a new mattress for about 6.6 years.
- In contrast, the middle-aged group, from 36 to 55 years old. Tended to keep their mattresses for a longer period, averaging about 9.1 years.
- The oldest age group, those 55 years or older, showed the longest duration of mattress retention. Expecting to use their new mattresses for approximately 11.6 years.
- This trend suggests that as age increases, so does the length of time consumers expect to keep their mattresses. Possibly reflecting greater stability or a different valuation of comfort and durability in mattress usage among older adults.
(Source: Statista)
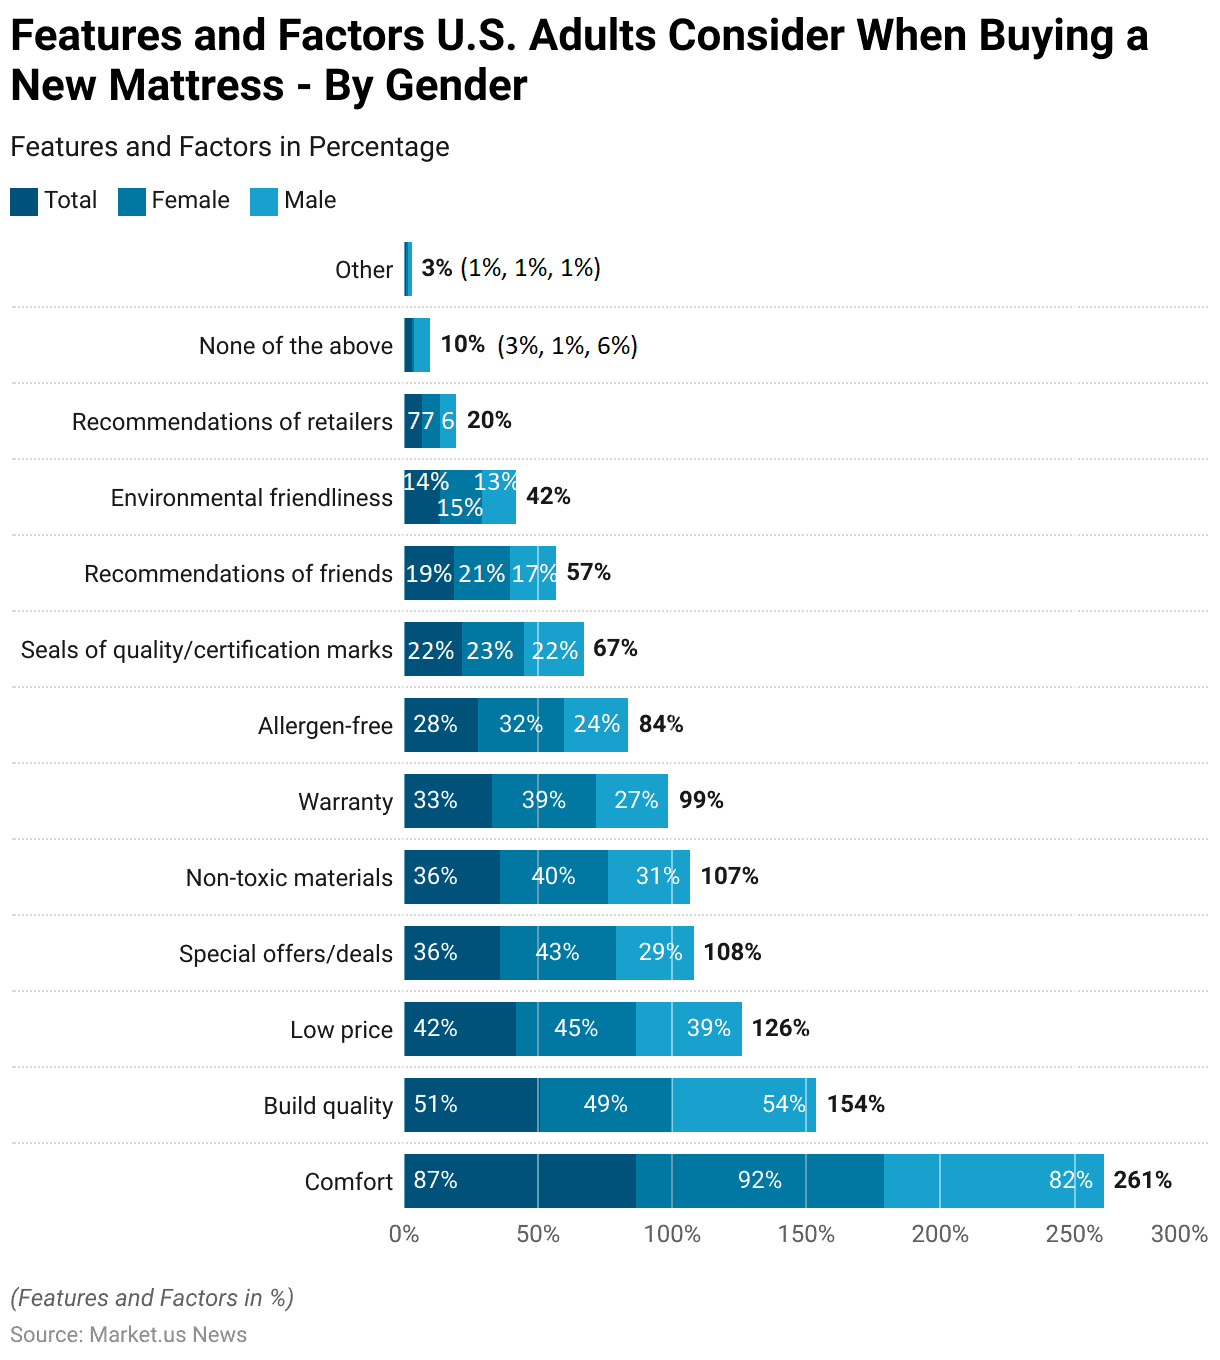
Features and Factors Adults Consider When Buying a New Mattress – By Gender Statistics
- In 2017, a survey highlighted the various features and factors that U.S. adults consider when purchasing a new mattress, revealing differences in preferences between genders.
- Comfort was the most significant factor for all respondents, with 87% overall valuing it. However, it was more important for females (92%) than for males (82%). Build quality was considered by 51% of all participants, with a slightly higher preference among males (54%) compared to females (49%).
- Price sensitivity was also notable, with 42% of all respondents looking for a low price, though females (45%) were more concerned with affordability than males (39%).
- Special offers and deals were more appealing to females (43%) compared to males (29%). Similarly, non-toxic materials were a priority for 36% of all respondents. Again with a higher percentage among females (40%) than males (31%).
- Warranty issues were important for 33% of the total, with a significant difference between females (39%) and males (27%).
More Insights
- Allergen-free options were preferred by 28% overall, with females (32%) showing more concern than males (24%). Seals of quality and certification marks were equally important across genders, considered by 22% of respondents.
- Other factors, such as recommendations from friends, influenced 19% of the total, with females (21%) slightly more likely to be influenced than males (17%).
- Environmental friendliness was a consideration for 14% of the respondents. Again females (15%) are slightly more concerned than males (13%). Recommendations from retailers were not as influential, cited by only 7% of respondents, with no significant gender difference.
- A small percentage, 3% of all respondents, indicated that none of the listed features or factors influenced their purchasing decision, with males more likely (6%) to select this option than females (1%).
- A negligible 1% cited other reasons, showing consistency across genders. This data illustrates a broad range of considerations impacting mattress purchasing decisions, with comfort standing out as the primary factor across both genders.
(Source: Statista)
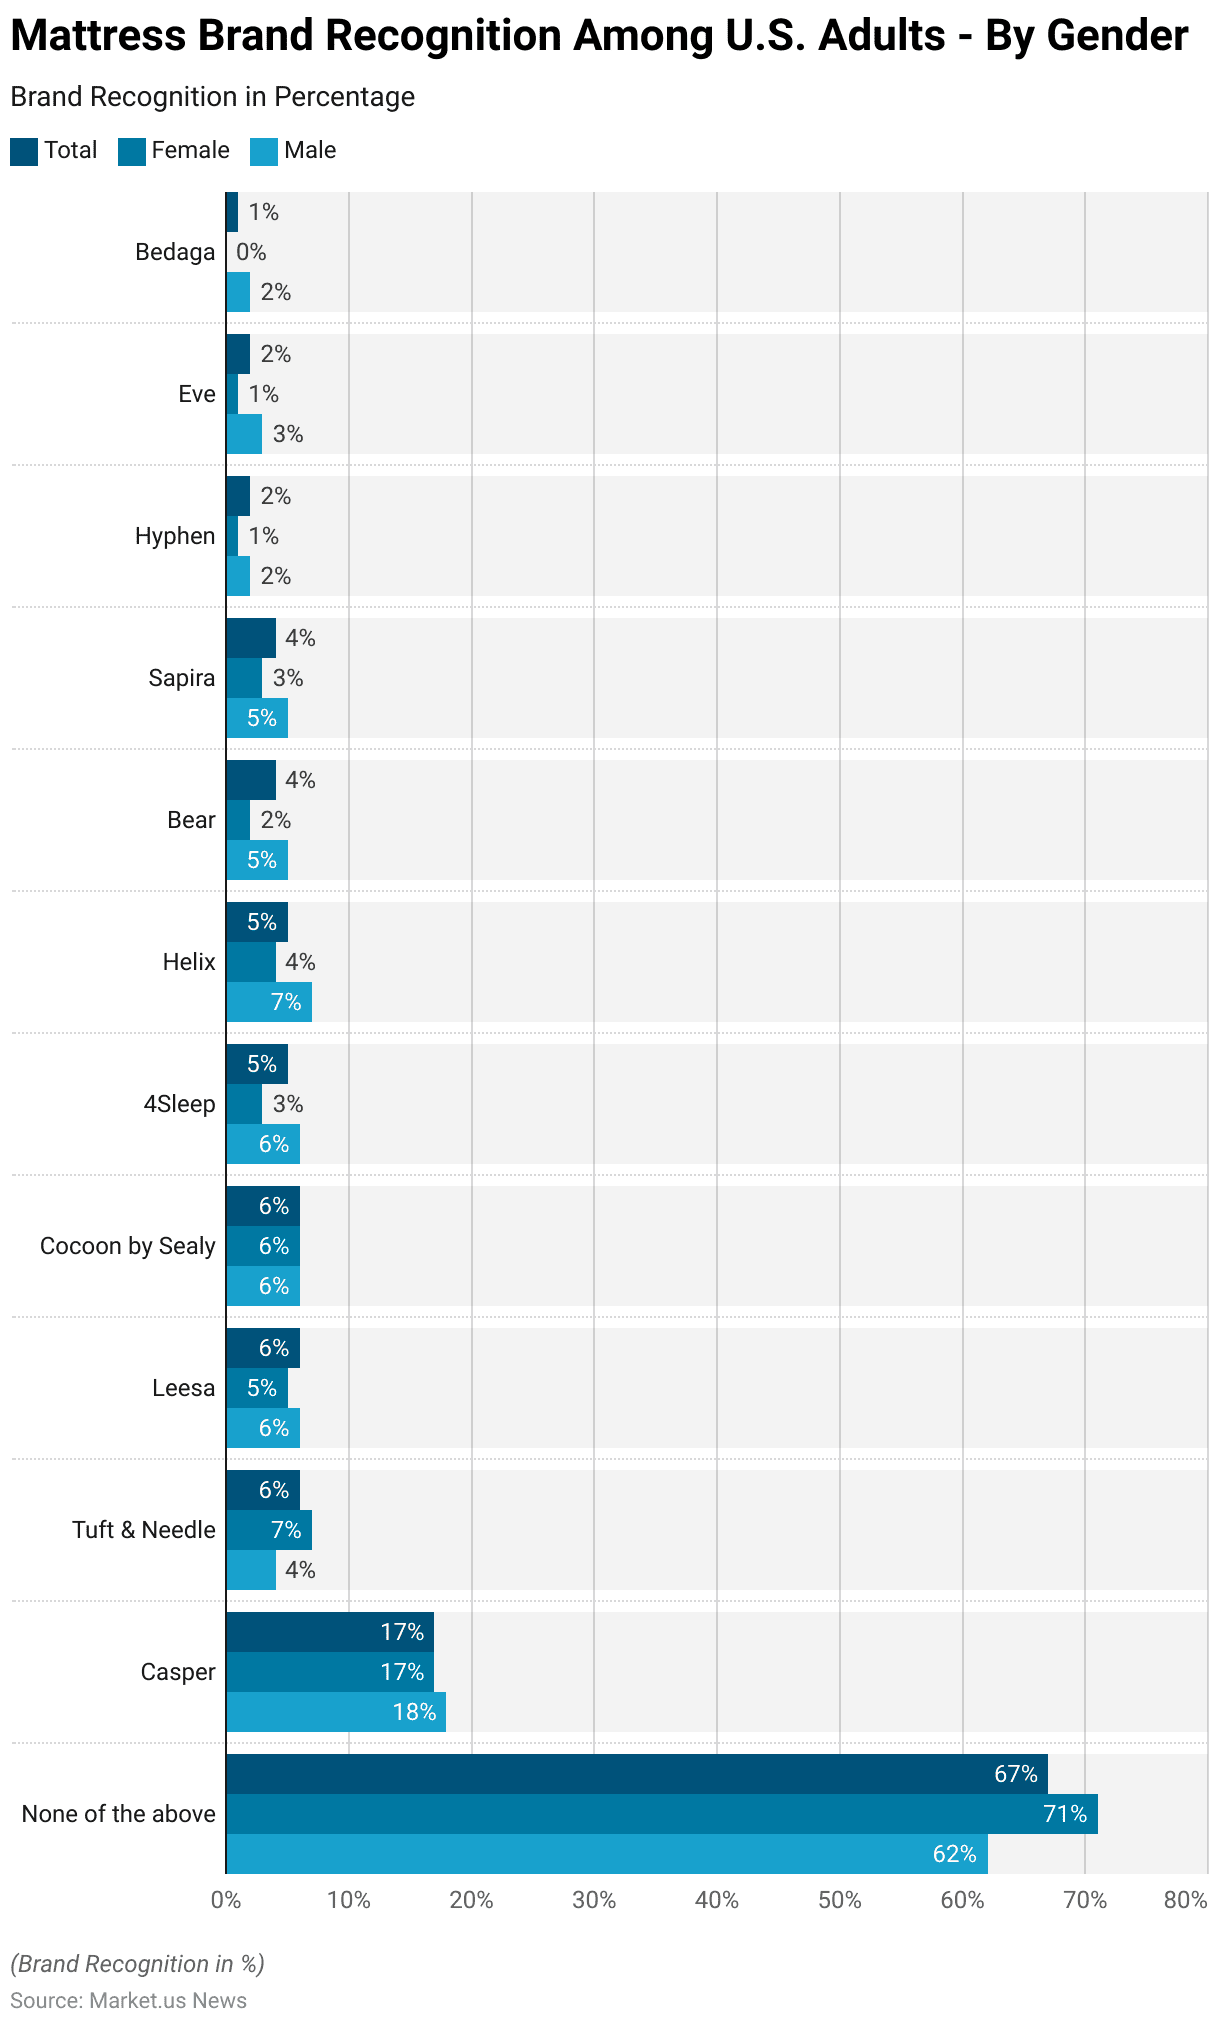
Mattress Brand Recognition Among Adults – By Gender Statistics
- In a 2017 survey concerning the recognition of direct-to-consumer mattress brands among U.S. adults. The results highlighted significant disparities in brand awareness between genders.
- The majority of respondents, 67% of the total, indicated that they did not recognize any of the listed mattress brands, with a higher proportion of females (71%) compared to males (62%) reporting no recognition.
- Among those who did recognize brands, Casper emerged as the most well-known, with 17% of the total respondents recognizing it. Equally known among females and slightly more among males (18%).
- Tuft & Needle, Leesa, and Cocoon by Sealy each was recognized by 6% of the total but with slight variations: Tuft & Needle was more familiar to females (7%) than males (4%). Whereas Leesa and Cocoon by Sealy saw equal recognition across genders.
- Other brands, such as 4Sleep and Helix, were recognized by 5% of the total, but Helix had a higher recognition rate among males (7%) than females (4%).
- Bear and Sapira were recognized by 4% of respondents. Again males (5%) are slightly more likely to recognize these brands than females (2% and 3%, respectively).
- Lesser-known brands included Hyphen, Eve, and Bedaga, each recognized by less than 3% of all respondents. Notably, Eve and Bedaga saw a higher recognition rate among males (3% and 2%, respectively) compared to females (1% and 0%).
- This data suggests that the majority of U.S. adults are unfamiliar with specific direct-to-consumer mattress brands. There is a modest gender difference in brand recognition among those who are aware.
(Source: Statista)
Mattress Industry Online Marketing Visibility to Adults – By Gender Statistics
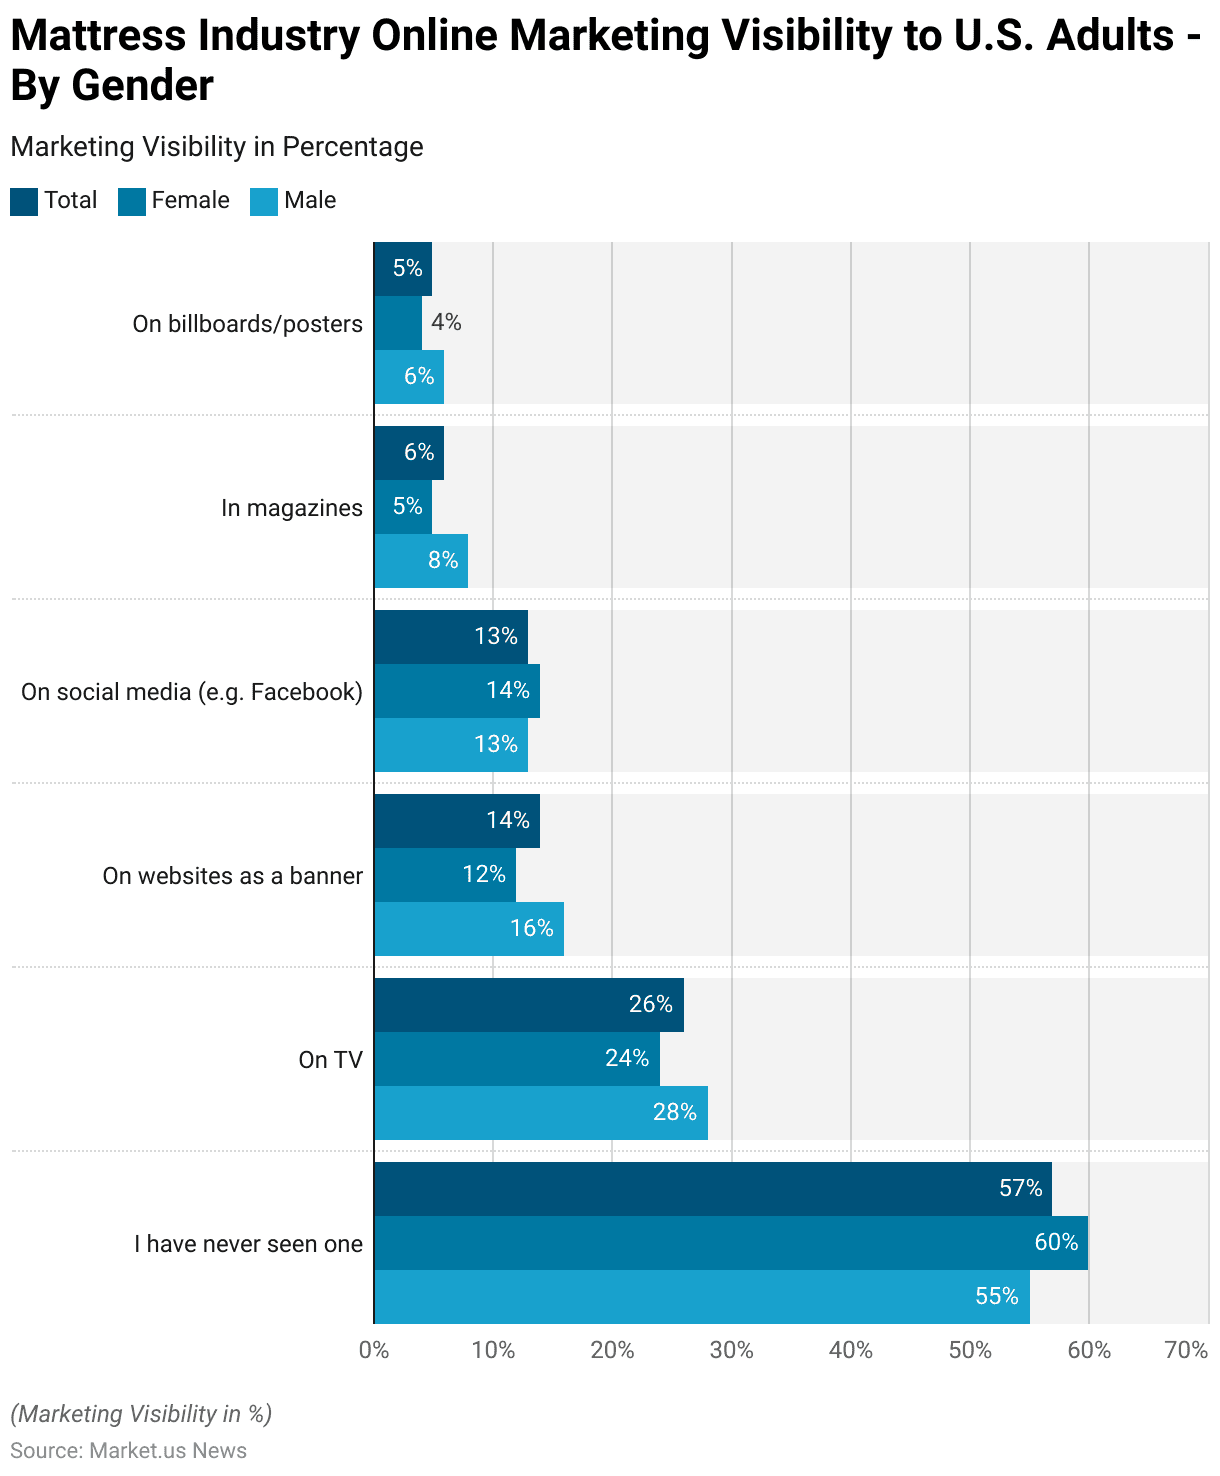
- In a 2017 survey exploring the visibility of direct-to-consumer mattress online store advertisements among U.S. adults, a notable difference in advertisement exposure was observed between genders.
- A majority of the respondents, 57% of the total, stated they had never seen an advertisement for such stores, with a slightly higher percentage of females (60%) than males (55%) reporting this lack of exposure.
- Television was the most common medium for those who had seen advertisements, with 26% of the total respondents reporting TV ads. Males were slightly more exposed to these ads, at 28%, compared to 24% of females.
- Website banners were the next most noted advertising medium, seen by 14% of respondents, with males (16%) encountering these more frequently than females (12%).
- Advertisements on social media platforms like Facebook were noted to account for 13% of the total, with a balanced exposure between females (14%) and males (13%).
- Magazine advertisements were less common, seen by only 6% overall, but again, males reported slightly higher exposure at 8% compared to 5% for females.
- Billboards and posters were the least observed, with only 5% noting this type of advertisement, and males (6%) were slightly more likely to see these than females (4%).
- These results illustrate that while a significant portion of the population remains unexposed to direct-to-consumer mattress advertising, those who do encounter such marketing see it most frequently on TV and online, with males generally experiencing slightly higher exposure across most media channels than females.
(Source: Statista)
Expenditure on Mattresses and Springs
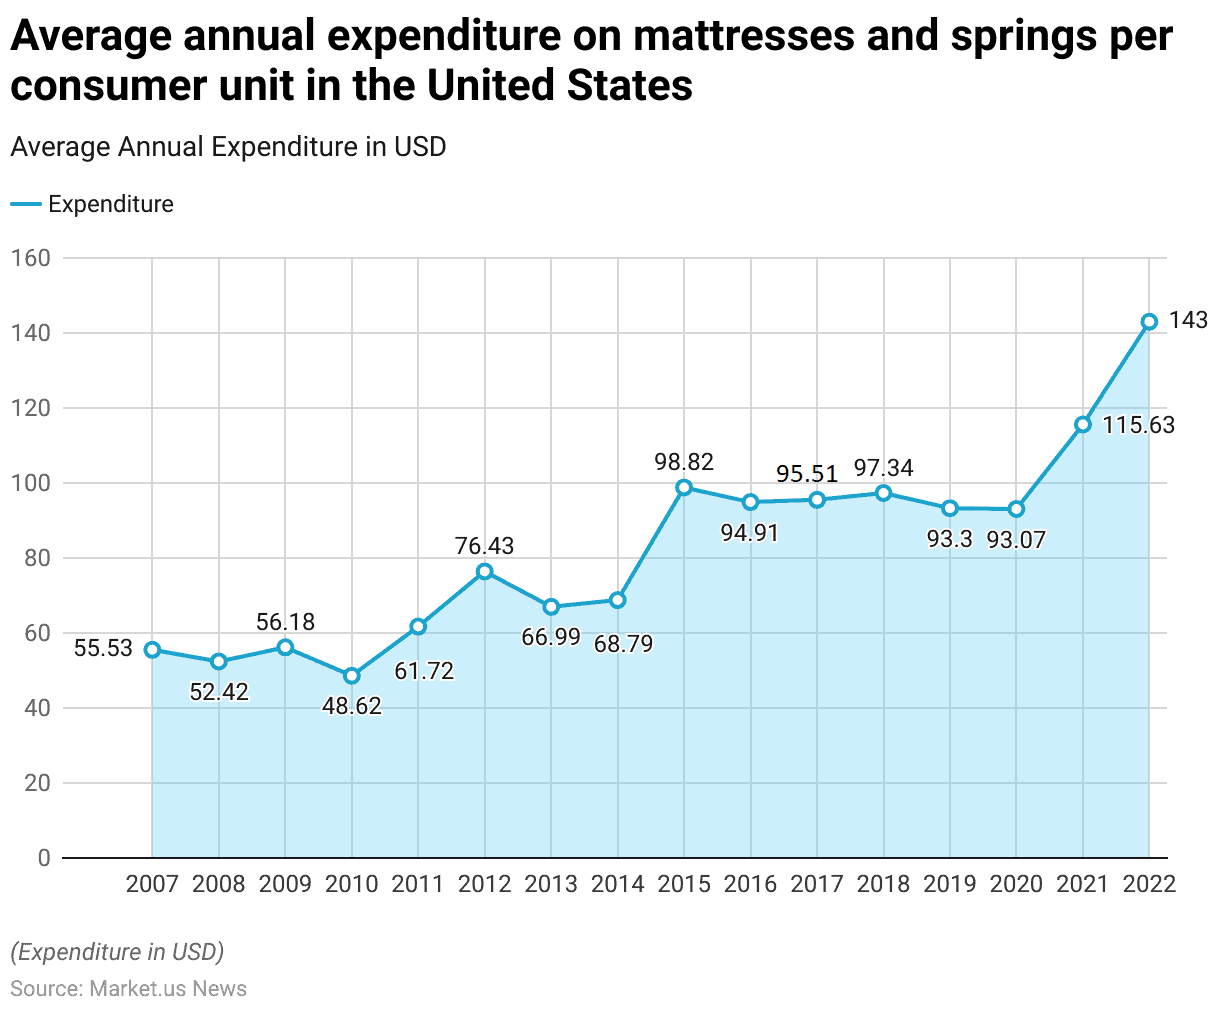
- From 2007 to 2022, the average annual expenditure on mattresses and springs per consumer unit in the United States exhibited a general upward trend with some fluctuations over the years.
- In 2007, the average spend was $55.53, which slightly decreased to $52.42 in 2008.
- It saw a small increase in 2009 to $56.18 but then dropped to its lowest point in 2010 at $48.62.
- The trend reversed in the following years, rising to $61.72 in 2011 and then jumping significantly to $76.43 in 2012.
- After a slight decline in 2013 to $66.99, it modestly increased in 2014 to $68.79.
- A notable surge occurred in 2015, where spending almost reached $100, standing at $98.82, and mostly hovered around the mid-90s in the subsequent years through 2020, with a slight dip in 2019 and 2020 to around $93.
- However, from 2021, there was a substantial increase, with expenditures rising to $115.63 and then making a remarkable jump to $143 in 2022.
- This substantial increase in the latter years suggests a growing consumer investment in quality mattresses and springs, possibly influenced by increased awareness of the importance of good sleep health and the availability of more premium products.
(Source: Statista)
Price of Different Mattresses
Average Price of a Mattress – By Type Statistics
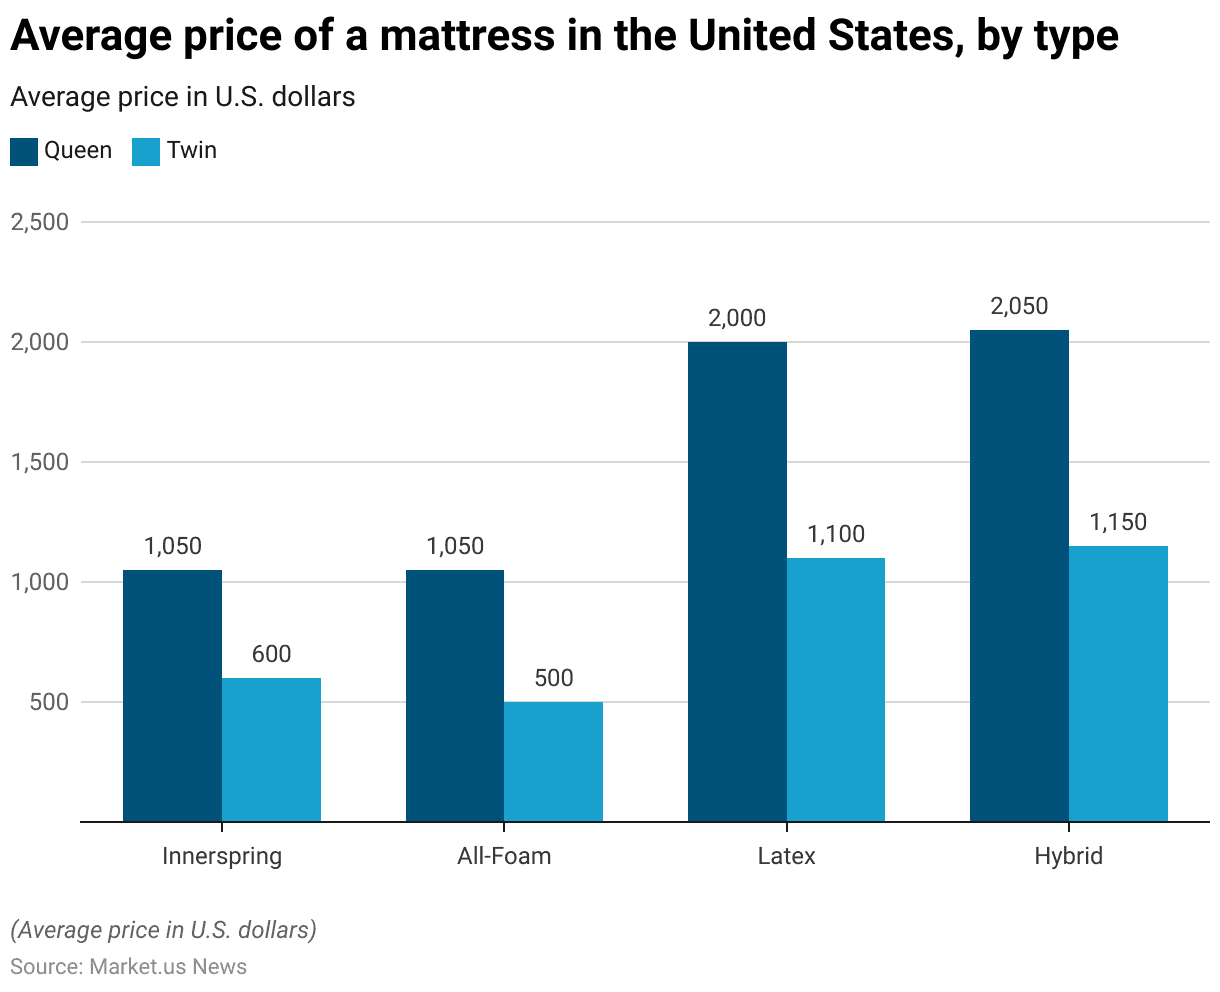
- In 2023, the average prices for mattresses in the United States varied significantly by type and size.
- For Queen-sized mattresses, innerspring and all-foam types were both priced at $1,050.
- Latex mattresses, known for their durability and comfort, were considerably more expensive, averaging $2,000.
- Hybrid mattresses, which combine elements of innerspring and foam, topped the price range at $2,050 for the Queen size.
- For Twin-sized mattresses, the prices were lower across all types. Innerspring models were the most affordable, costing $600, followed by all-foam mattresses at $500.
- Latex mattresses for the Twin size were priced at $1,100, while hybrid mattresses were slightly more expensive at $1,150.
- This pricing structure reflects the diverse materials and construction techniques used in different mattress types, with advanced materials and hybrid designs commanding higher prices.
(Source: Statista)
King-size Mattresses Statistics
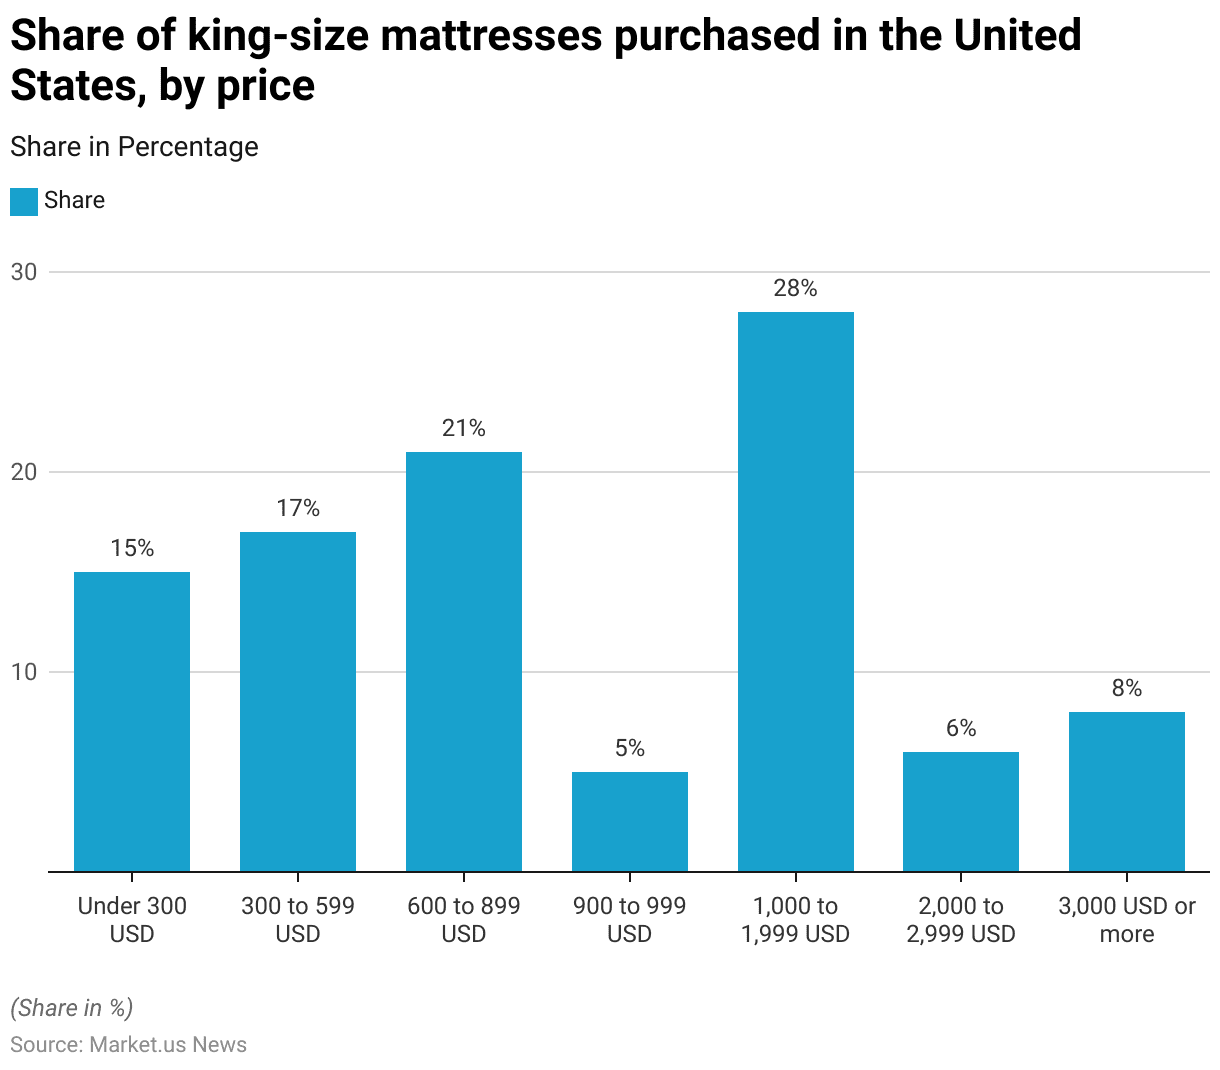
- In 2016, the purchasing patterns for king-size mattresses in the United States showed a wide distribution across various price ranges.
- The most commonly purchased king-size mattresses fell into the $1,000 to $1,999 range, accounting for 28% of purchases, indicating a preference for mid- to high-range products.
- The next most popular price segment was $600 to $899, with 21% of buyers opting for mattresses in this range, suggesting that a significant number of consumers were looking for moderately priced options.
- Mattresses priced between $300 and $599 were also fairly popular, representing 17% of purchases.
- Surprisingly, mattresses under $300 constituted 15% of the market, demonstrating a demand for budget-friendly options among a sizable segment of consumers.
- The $900 to $999 price range was less favored, making up only 5% of purchases.
- Higher-end mattresses priced between $2,000 and $2,999 were purchased by 6% of consumers, and those priced at $3,000 or more were chosen by 8% of buyers, highlighting a niche market for luxury mattress products.
- This data reflects a diverse market where price preferences vary widely, yet most consumers gravitate towards mid-priced to moderately expensive mattress options.
(Source: Statista)
Consumer Perceptions and Trends
Most Important Mattress Purchase Drivers to Consumers Statistics
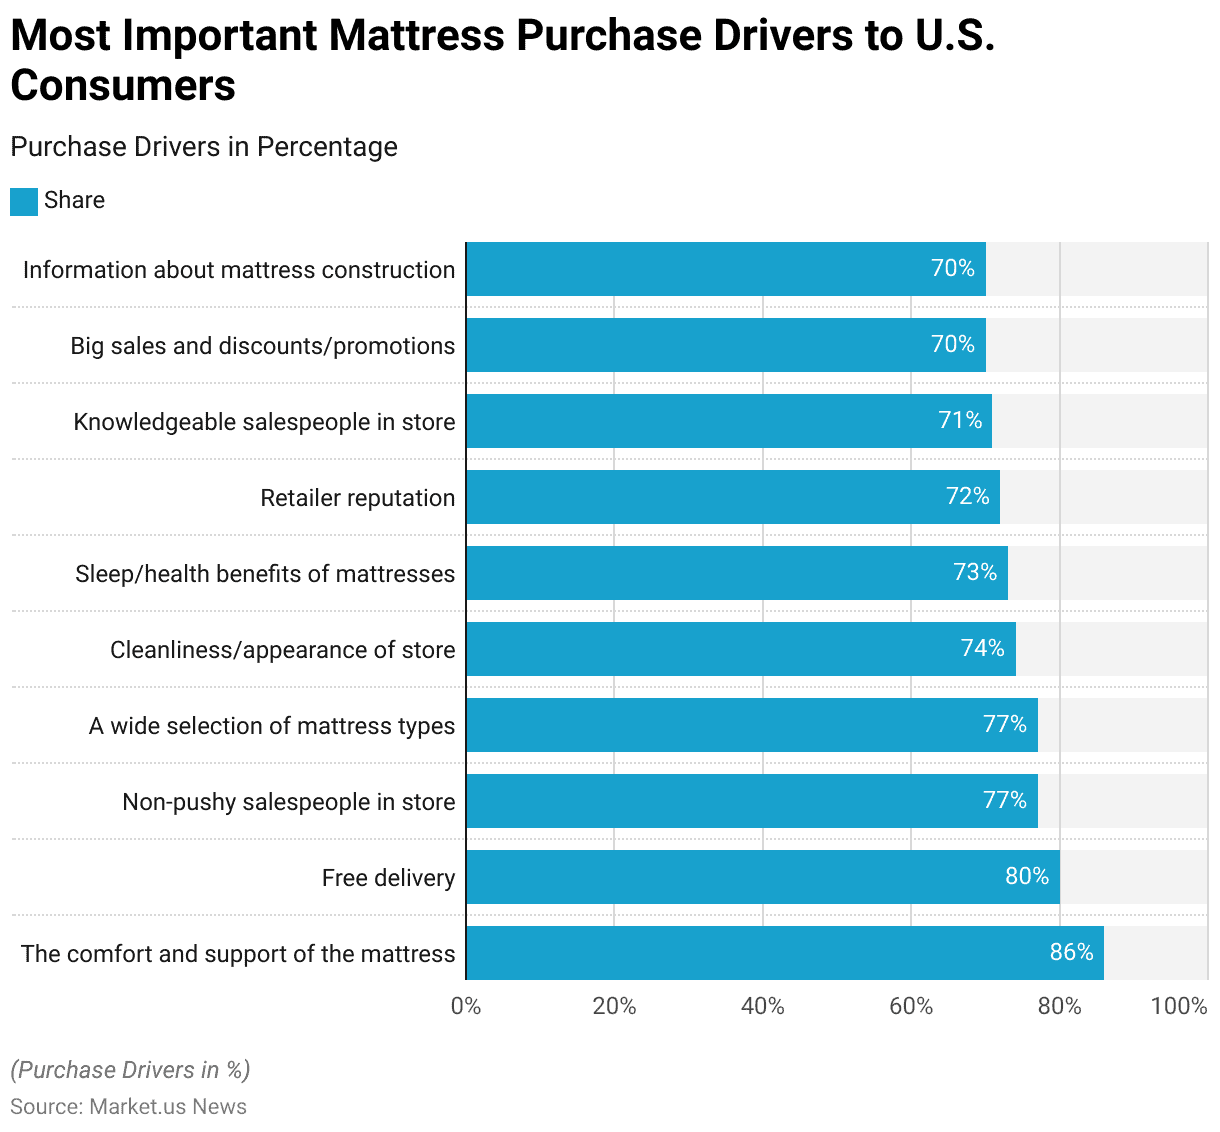
- In a 2016 survey exploring key factors that influence U.S. consumers’ decisions when purchasing mattresses, comfort and support emerged as the most critical aspect, with 86% of respondents considering it essential.
- Following closely, free delivery was valued by 80% of the participants, highlighting convenience as a significant consideration.
- The behavior of sales staff also played an important role, with 77% of consumers preferring non-pushy salespeople and another 77% appreciating a wide selection of mattress types, which suggests that variety and a pressure-free shopping environment are crucial to customer satisfaction.
- Cleanliness and appearance of the store were important for 74% of respondents, indicating that the retail environment significantly impacts purchasing decisions.
- The sleep and health benefits provided by the mattresses were considered important by 73% of shoppers, underlining the growing consumer awareness of health-oriented product features.
- Retailer reputation mattered to 72% of respondents, closely linked to trust and credibility in the buying process.
- Additionally, having knowledgeable sales staff was deemed important by 71% of shoppers, which underscores the value of expert advice in making informed choices.
- Economic incentives such as big sales and discounts were crucial for 70% of the consumers, as were detailed information about mattress construction, highlighting the role of price and product transparency in consumer decisions.
- This array of factors illustrates a multifaceted decision-making process where practical, economic, and experiential elements all play significant roles in influencing mattress purchases among U.S. consumers.
(Source: Statista)
Features of a Good Mattress According to Consumers Statistics
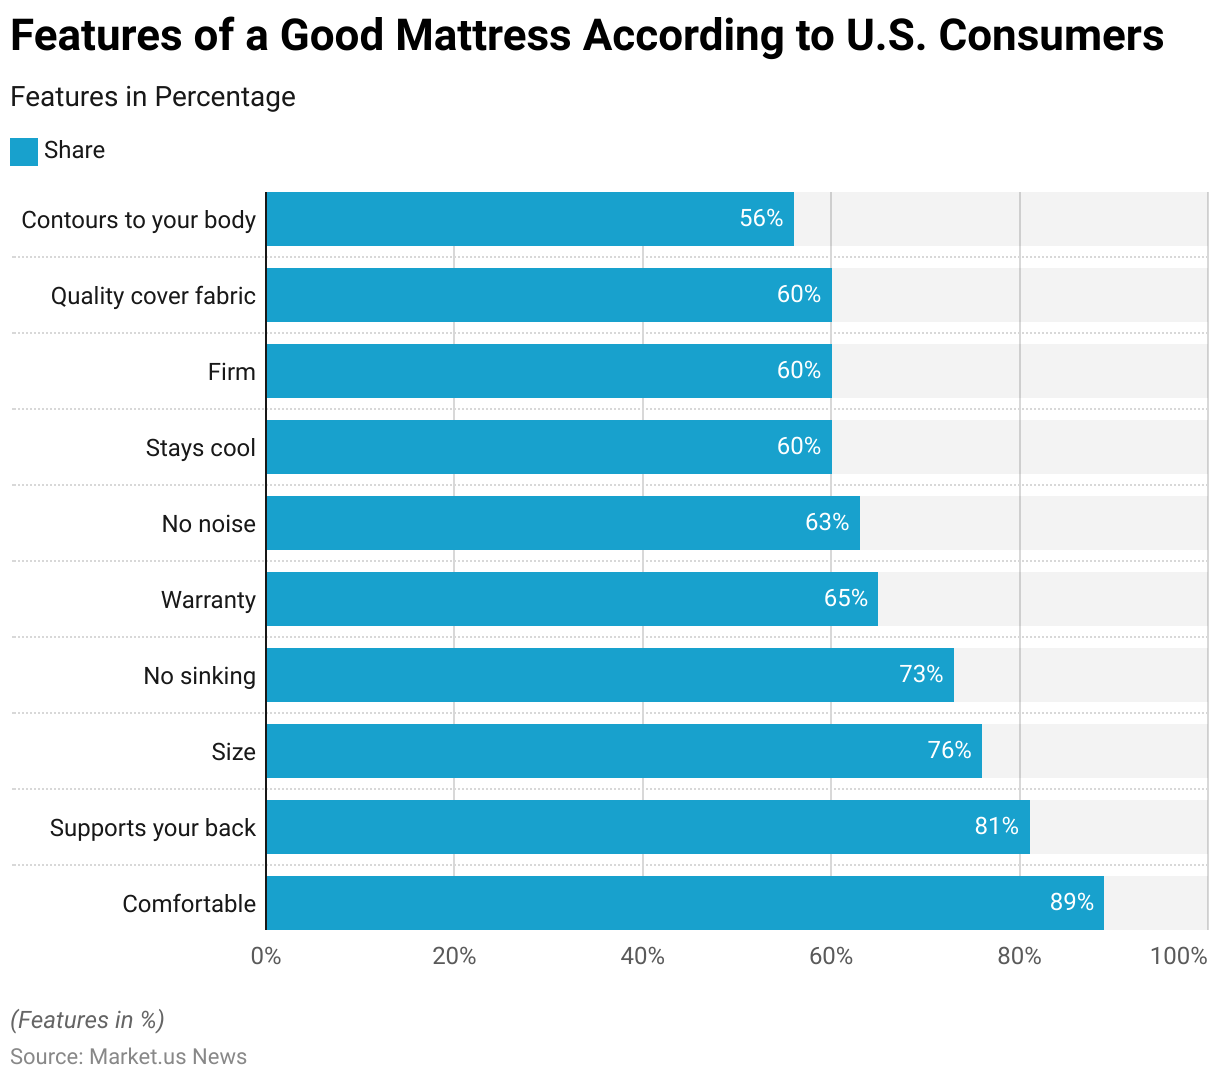
- In 2016, a survey among U.S. consumers highlighted the key features they consider important in a good mattress.
- Comfort topped the list, with a significant 89% of respondents emphasizing its importance, indicating that overall comfort is the paramount factor in mattress selection.
- Following comfort, 81% of respondents valued back support, underscoring the importance of ergonomics and health in their choice of mattress.
- The size of the mattress was also a major consideration for 76% of participants, pointing to the need for adequate space as a priority for consumers.
- Resistance to sinking was important to 73% of those surveyed, suggesting a preference for mattresses that maintain their shape and offer a consistent level of support over time.
- A 65% majority placed importance on having a warranty, which likely reflects concerns about the longevity and quality assurance of their purchase.
- Noise reduction was critical for 63% of consumers, indicating a preference for mattresses that do not disrupt sleep with sound when moving.
- Temperature control was highlighted by 60% of respondents who preferred mattresses that stay cool throughout the night, demonstrating the value placed on thermal comfort.
- Equally, 60% of those surveyed favored both a firm feel and quality cover fabric, indicating a balanced interest in both the tactile and aesthetic aspects of mattresses.
- Lastly, 56% appreciated mattresses that contour to the body, which suggests a significant interest in personalized comfort and support.
- This range of priorities reflects a well-rounded set of expectations that U.S. consumers have for their mattresses, balancing comfort, support, durability, and sensory qualities.
(Source: Statista)
Mattress Material Preferred by Consumers Statistics
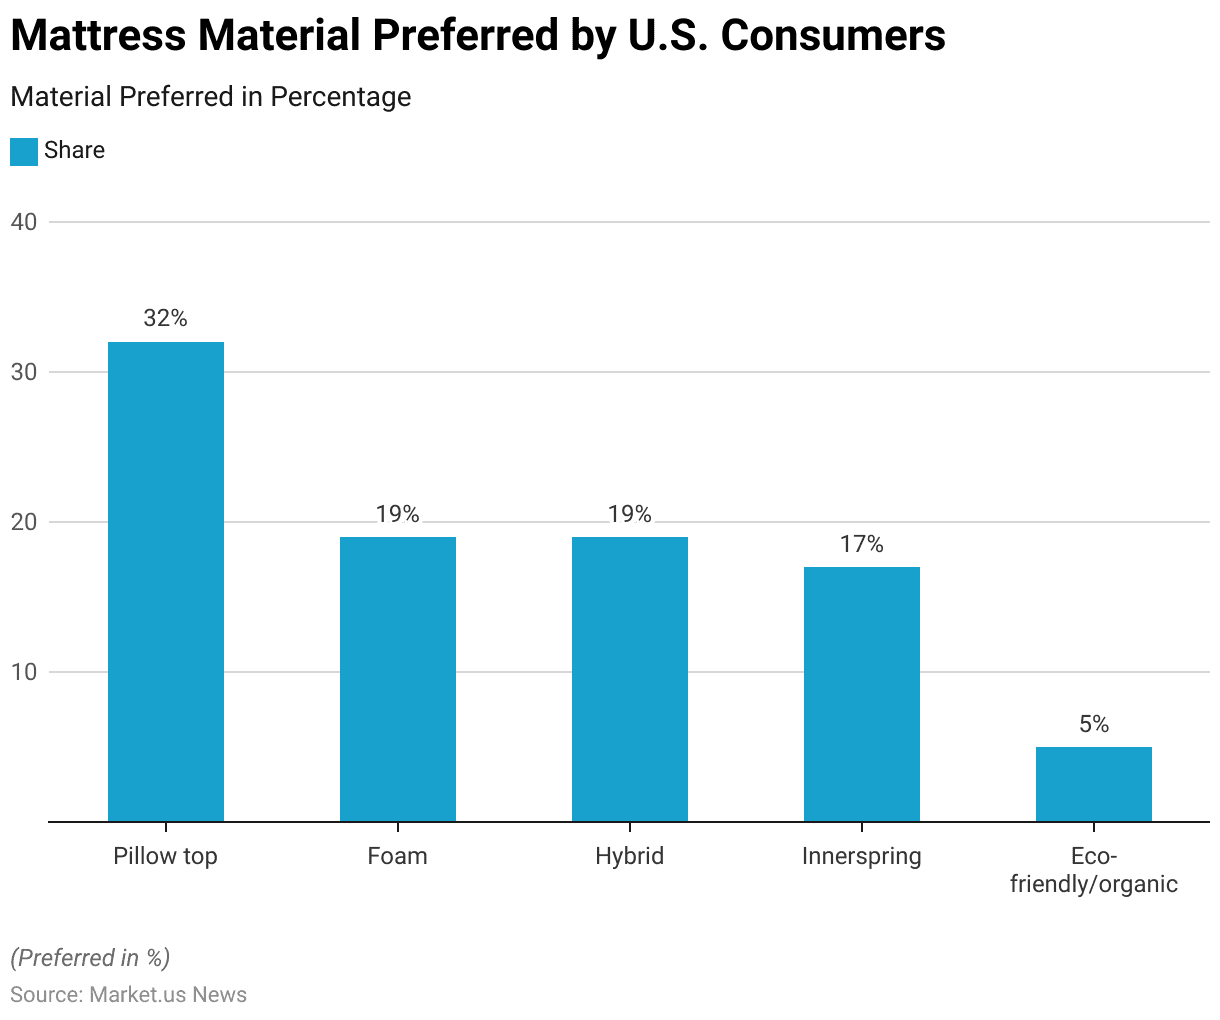
- In a 2018 survey focusing on U.S. consumers’ preferences for mattress materials, pillow top mattresses emerged as the favorite, with 32% of respondents preferring them.
- This was followed by foam and hybrid mattresses, each garnering 19% of consumer preferences, indicating a substantial interest in these contemporary materials that offer a combination of support and comfort.
- Innerspring mattresses, traditionally popular, were preferred by 17% of the respondents, showing that while still significant, they are less favored compared to newer mattress types.
- Eco-friendly or organic mattresses, although the least preferred, still captured the interest of 5% of consumers, reflecting a niche market that prioritizes environmental concerns in their purchasing decisions.
- This variety in preferences highlights the diverse needs and values of consumers when selecting mattresses, ranging from comfort and support to environmental sustainability.
(Source: Statista)
Consumers’ Foam Mattress Material Preference – By Type Statistics
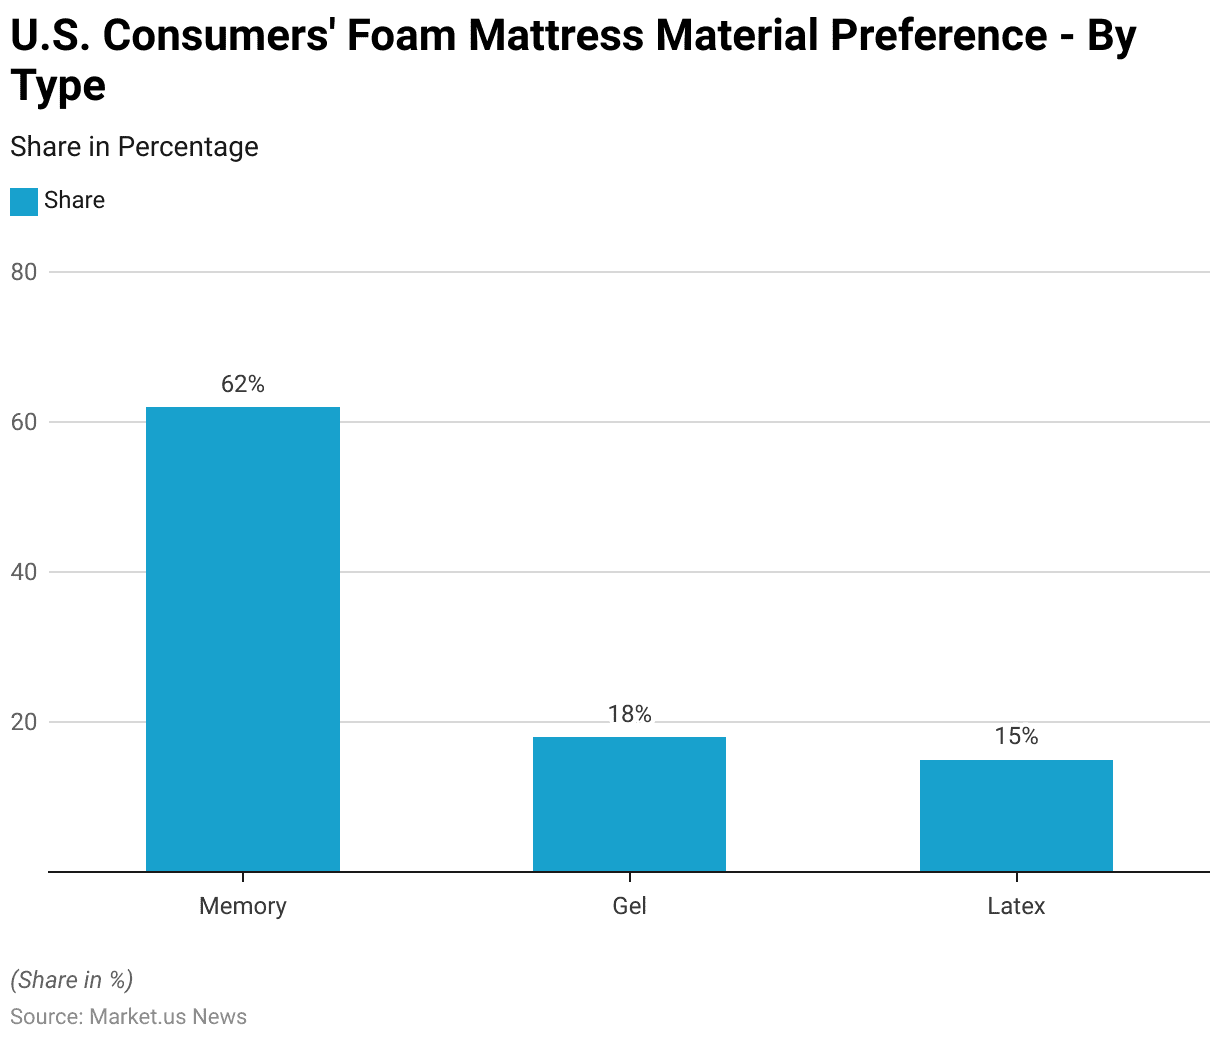
- In a 2016 survey assessing U.S. consumers’ preferences for foam mattress materials, the results indicated clear favoritism towards memory foam, with a majority of 62% of respondents identifying it as the best type of foam for a good mattress.
- Gel foam was the second most preferred type, chosen by 18% of those surveyed, while latex foam was selected by 15% of respondents.
- This distribution suggests that memory foam is highly valued among consumers for its comfort and support characteristics, significantly outpacing the preference for gel and latex foams, which are also appreciated but to a lesser extent.
(Source: Statista)
Leading Mattress Retailers – By Offline Customer Satisfaction Statistics
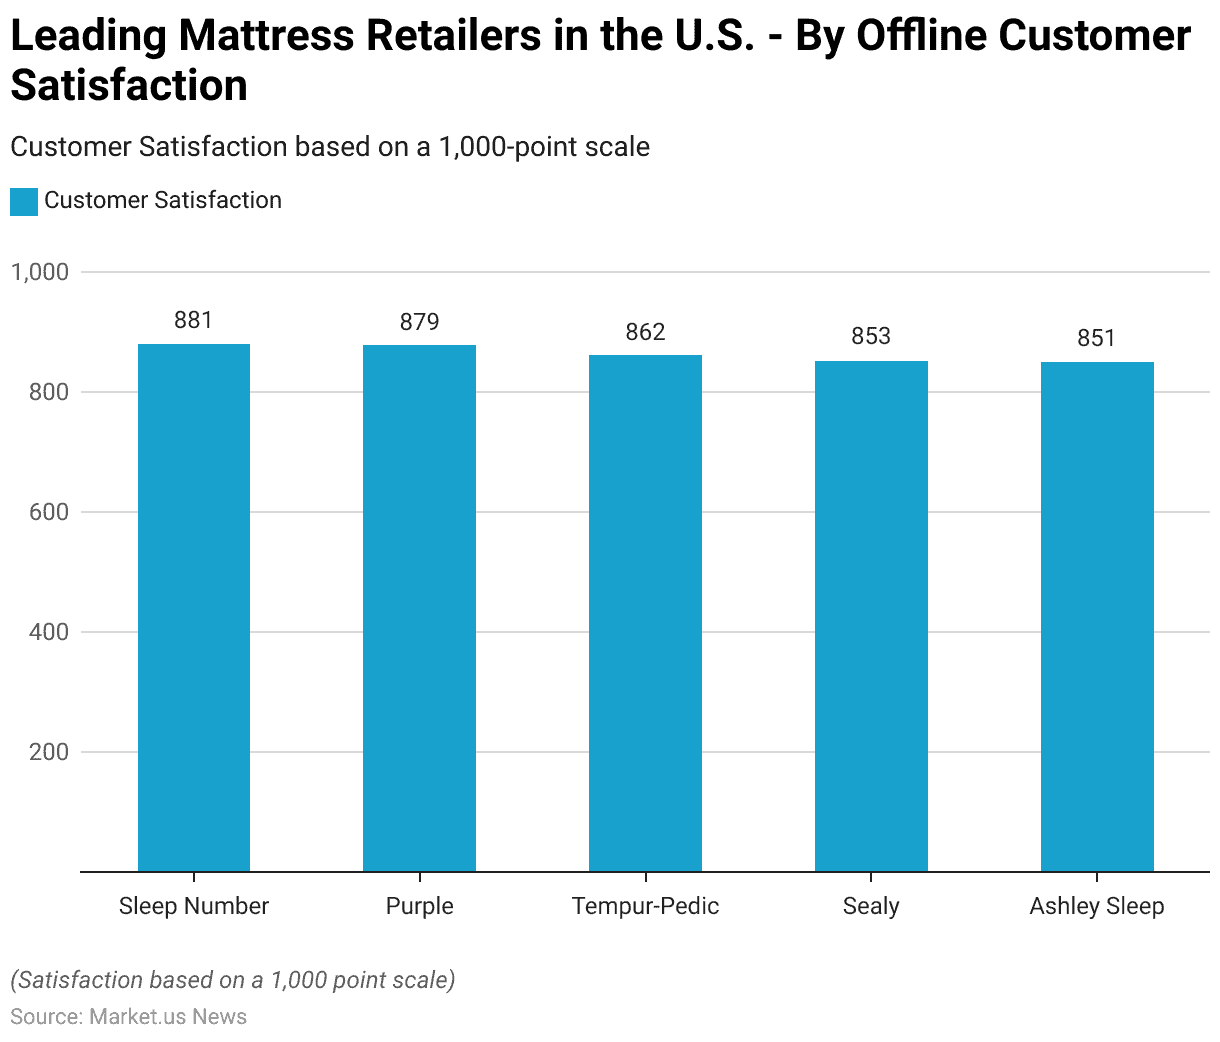
- In 2023, a survey evaluating in-store customer satisfaction among leading mattress companies in the United States revealed that Sleep Number topped the list with a score of 881 out of a possible 1,000 points.
- Close behind was Purple, which scored 879, indicating a high level of customer satisfaction as well.
- Tempur-Pedic also performed well, achieving a customer satisfaction score of 862.
- Sealy and Ashley Sleep followed, with scores of 853 and 851, respectively.
- These scores reflect the quality of customer service and product satisfaction provided by these companies, showcasing a competitive landscape where top mattress brands closely vie for consumer approval in the retail environment.
(Source: Statista)
Online Mattress Purchase Perception Statistics
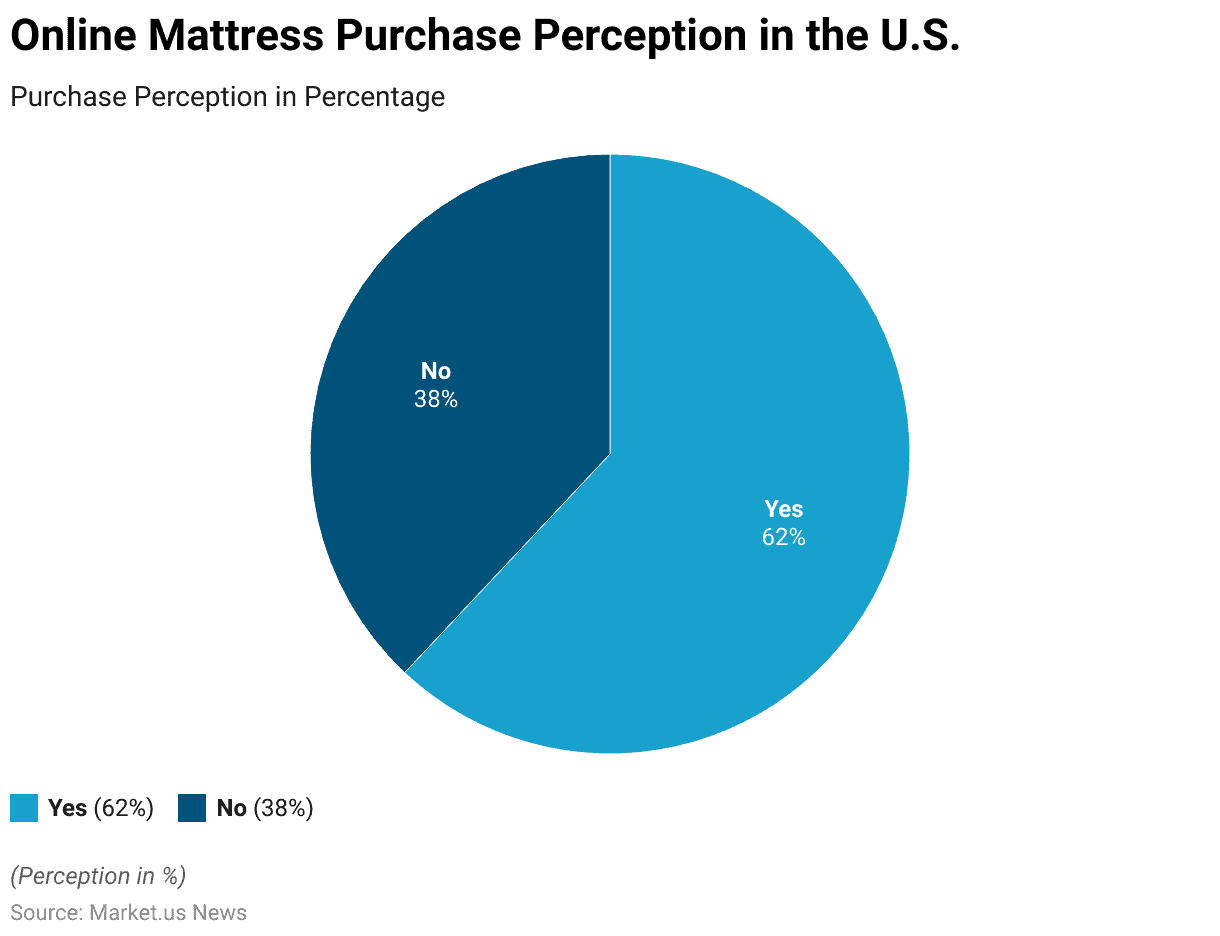
- In a 2018 survey examining U.S. consumer behavior regarding mattress purchases, it was found that a significant majority, 62% of respondents, considered buying their mattress online.
- This indicates a substantial inclination towards the convenience and variety offered by online shopping platforms.
- On the other hand, 38% of the respondents did not consider purchasing their mattress online, possibly due to preferences for experiencing the product in person or concerns about the feasibility of online transactions for such significant purchases.
- This data reflects a notable divide in consumer purchase behaviors, with a major shift towards online shopping, yet a significant portion of the market still adheres to traditional buying methods.
(Source: Statista)
Online Retailers Where Consumers Buy Mattresses – By Type Statistics
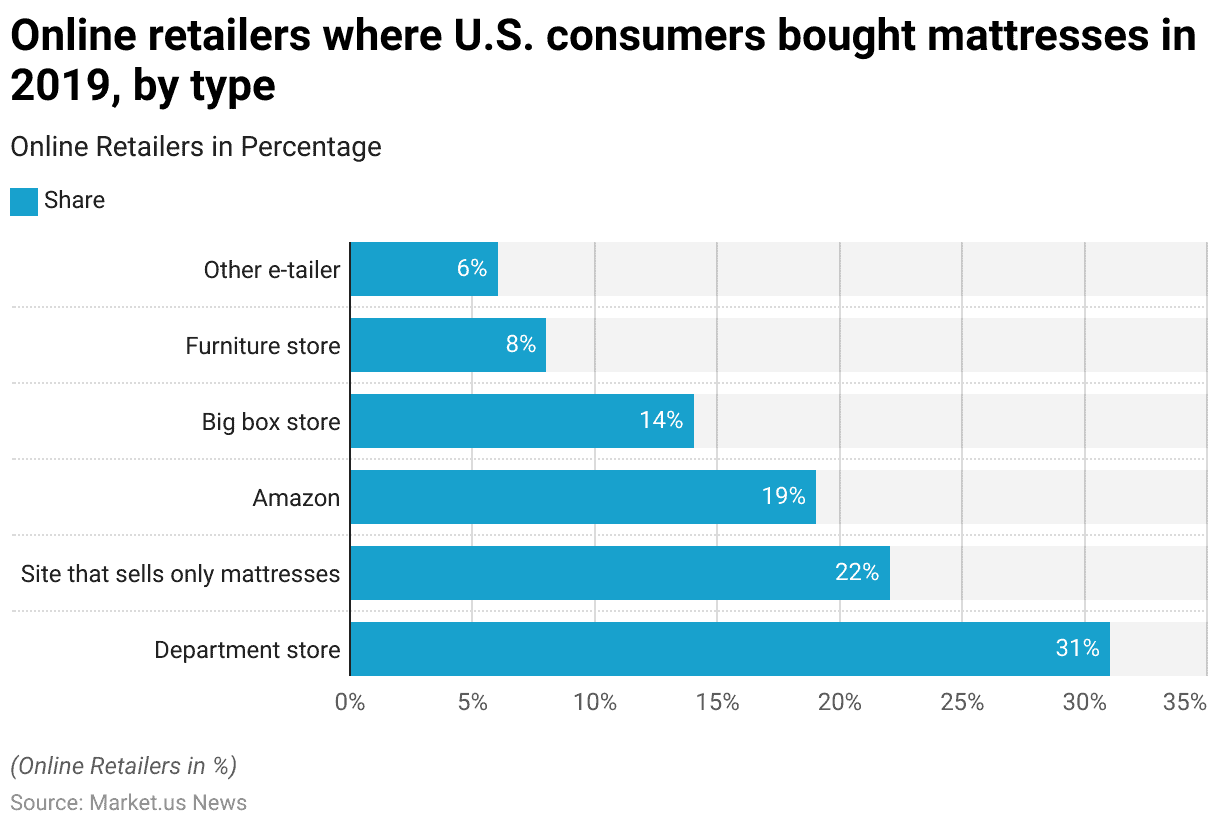
- In 2019, a survey on U.S. consumers’ online mattress purchasing habits revealed diverse preferences for where they chose to buy.
- The majority, 31% of respondents, purchased their mattresses from department stores online, indicating trust in traditional retail brands even in the digital shopping realm.
- Websites dedicated solely to selling mattresses were the next most popular choice, attracting 22% of online buyers. This shows a significant consumer preference for specialized retailers that might offer a wider variety of mattress options and possibly more detailed product information.
- Amazon also held a substantial share, with 19% of consumers buying mattresses through the platform, highlighting its influence as a versatile online marketplace.
- Big box stores accounted for 14% of online mattress purchases, underscoring their role in the home goods sector.
- Meanwhile, furniture stores, which traditionally serve as primary outlets for such items, captured only 8% of the online market, possibly due to more focused competition from specialized and general e-tailers.
- Other e-tailers, encompassing various online shops not specifically categorized, made up 6% of purchases, indicating a fragmented segment of the market that includes niche and possibly bespoke vendors.
- This distribution reflects the shifting patterns of consumer behavior towards online shopping, offering insights into the competitive landscape of mattress retailing on digital platforms.
(Source: Statista)
Recent Developments
Acquisitions and Mergers:
- Tempur Sealy acquires Dreams: In 2023, Tempur Sealy International, one of the world’s largest mattress manufacturers, acquired Dreams, a UK-based bedding retailer, for $475 million. This acquisition strengthens Tempur Sealy’s retail presence in Europe and expands its product distribution in a rapidly growing market.
- Serta Simmons merges with Tuft & Needle: In early 2023, Serta Simmons Bedding announced a merger with Tuft & Needle, a leading direct-to-consumer mattress brand. This deal, valued at $300 million, aims to enhance Serta Simmons’ digital presence and capitalize on the increasing demand for online mattress purchases.
New Product Launches:
- Purple Mattress introduces GelFlex Grid™ technology: In mid-2023, Purple Mattress launched a new line of mattresses featuring GelFlex Grid™ technology, designed to provide superior pressure relief and cooling. This product targets consumers looking for ergonomic support and comfort, with sales projected to increase by 20% due to the innovative design.
- Casper launches hybrid mattresses with recycled materials: In early 2024, Casper, a leader in online mattress sales, introduced a new line of hybrid mattresses made from recycled materials, including eco-friendly foams and sustainable fabrics. This launch aligns with growing consumer demand for sustainable products and is expected to drive 15% of Casper’s annual sales growth.
Funding:
- Eight Sleep raises $86 million for smart mattresses: In late 2023, Eight Sleep, a company specializing in tech-enabled sleep products, raised $86 million to develop its smart mattresses, which monitor sleep patterns and adjust temperature. This funding will accelerate research into AI-driven sleep optimization technologies, aiming to reach 1 million customers by 2025.
- Helix Sleep secures $50 million for personalized mattress expansion: In 2023, Helix Sleep, known for its customizable mattresses, raised $50 million to expand its product offerings and enhance its mattress customization algorithms. The funding will help Helix develop new sleep solutions tailored to individual body types and sleeping habits.
Technological Advancements:
- Smart mattresses with AI integration: By 2025, 30% of high-end mattresses are expected to incorporate AI technology to monitor and analyze sleep data, helping users improve their sleep quality through real-time adjustments in temperature and firmness.
- Sustainable materials in mattress production: With sustainability becoming a major focus, it is projected that 25% of mattresses produced by 2026 will incorporate eco-friendly materials like organic cotton, recycled foam, and natural latex, reducing the environmental impact of mattress manufacturing.
Conclusion
Mattress Statistics – Diverse consumer preferences and dynamic trends characterize the mattress market. Comfort and support are paramount, with memory foam and hybrid mattresses gaining popularity due to their superior qualities.
Pricing varies widely, appealing to both budget-conscious buyers and those seeking luxury products, with a noticeable shift toward online shopping enhancing the convenience and range available to consumers.
The competitive landscape is tight, with leading brands vying for customer satisfaction through quality and service.
Additionally, an increasing number of consumers are prioritizing eco-friendly and health-conscious choices in their mattresses, reflecting a growing trend toward sustainability in the industry.
Overall, the mattress market continues to evolve, driven by technological advancements and changing consumer behaviors, with successful companies adapting to these trends while maintaining high standards of quality and customer care.
FAQs
The average lifespan of a mattress is 7 to 10 years, depending on the material and usage. Latex and high-quality memory foam tend to last longer, while innerspring and lower-density foam may wear out sooner.
A mattress’s support level ensures spinal alignment and comfort. Poor support can lead to sleep disturbances and physical discomfort, particularly in the back and neck. A supportive foundation is also crucial for extending the mattress’s durability.
Traditional memory foam can trap heat, but many newer models incorporate cooling technologies, such as gel-infused foam or breathable covers, to improve temperature regulation.
Prices vary based on materials, construction quality, brand, and additional features like cooling technologies or eco-friendly components. Higher-priced mattresses often offer superior durability, comfort, and support.
Yes, many brands now offer mattresses made from organic materials like natural latex, organic cotton, and wool. These options avoid harmful chemicals and are often sustainable.


