Table of Contents
- Introduction
- Editor’s Choice
- Global Furniture Market Size
- Office Furniture Market Statistics
- Global Home Office Furniture Market Revenue Statistics
- Wholesale Revenue of Office Furniture in Different Nations Statistics
- Office Furniture Companies Revenue Statistics
- Office Furniture Sales Statistics
- Office Furniture Purchase Preferences Statistics
- Wooden Office Furniture Import and Export Statistics
- Impact of Hybrid Work
- Key Investments
- Innovations and Developments in Office Furniture Statistics
- Recent Developments
- Conclusion
- FAQs
Introduction
Office Furniture Statistics: Office furniture includes essential items like desks, chairs, storage units, conference tables, and reception furniture, all designed to support productivity and organization.
Desks and ergonomic chairs cater to individual work needs. While storage units like file cabinets and bookshelves help maintain an organized workspace.
Conference tables facilitate meetings, and reception furniture creates a welcoming environment for visitors.
Additionally, cubicles and workstations provide semi-private spaces, while breakroom and lounge furniture promote relaxation.
Key considerations include ergonomics, space utilization, durability, and aesthetics. Modern trends focus on flexibility and comfort to enhance productivity and employee well-being.
Editor’s Choice
- By 2026, the global office furniture market is anticipated to achieve a valuation of USD 85.00 billion.
- In 2023, the United States led the global office furniture market with a revenue of USD 254,952.7 million.
- In 2023, Herman Miller emerged as the leading office furniture company worldwide, generating a revenue of USD 3.63 billion.
- In 2020, U.S. consumers prioritized specific types of home office furniture. With desks and chairs leading the list, each selected by 27% of respondents.
- In 2020, 34% of U.S. consumers planned to purchase home office furniture within the next month and 43% within 2-3 months, reflecting strong near-term demand.
- In 2023, the value of wooden office furniture imports in the United States fell to USD 838.25 million.
- Innovations in the office furniture industry in 2023 have focused on creating dynamic, eco-friendly, and technologically integrated workspaces.

Global Furniture Market Size
- The global furniture market is projected to experience steady growth from 2022 to 2030.
- In 2022, the market was valued at USD 546 billion and increased to USD 579 billion in 2023.
- This upward trajectory is expected to continue, with the market estimated to reach USD 614 billion in 2024, USD 651 billion in 2025, and USD 690 billion in 2026.
- Further growth is anticipated, with projections of USD 732 billion in 2027, USD 776 billion in 2028, and USD 823 billion in 2029.
- By 2030, the global furniture market is forecasted to reach USD 873 billion. Reflecting consistent expansion driven by increasing consumer demand and evolving market dynamics.
(Source: Statista)
Office Furniture Market Statistics
Global Office Furniture Market Value Statistics
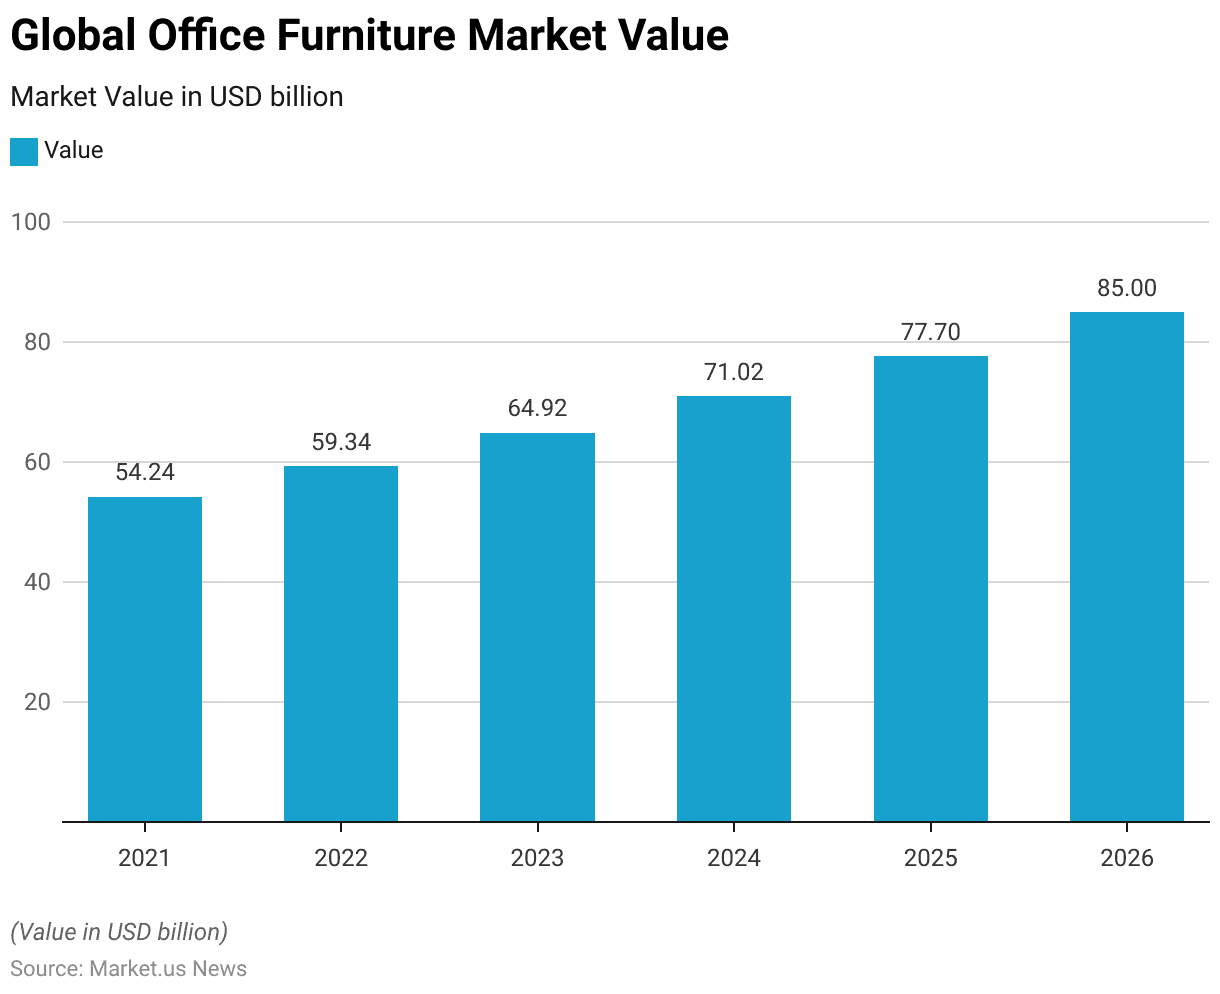
- The global office furniture market has exhibited consistent growth from 2021 to 2026.
- In 2021, the market was valued at approximately USD 54.24 billion, increasing to USD 59.34 billion in 2022.
- This upward trend continued in 2023, with the market value reaching USD 64.92 billion.
- Projections indicate further substantial growth, with the market expected to expand to USD 71.02 billion in 2024 and USD 77.70 billion in 2025.
- By 2026, the global office furniture market is anticipated to achieve a valuation of USD 85.00 billion. Underscoring a robust annual increase and reflecting the sustained demand for office furniture across the world.
(Source: Statista)
Global Office Furniture Market Revenue – By Country Statistics
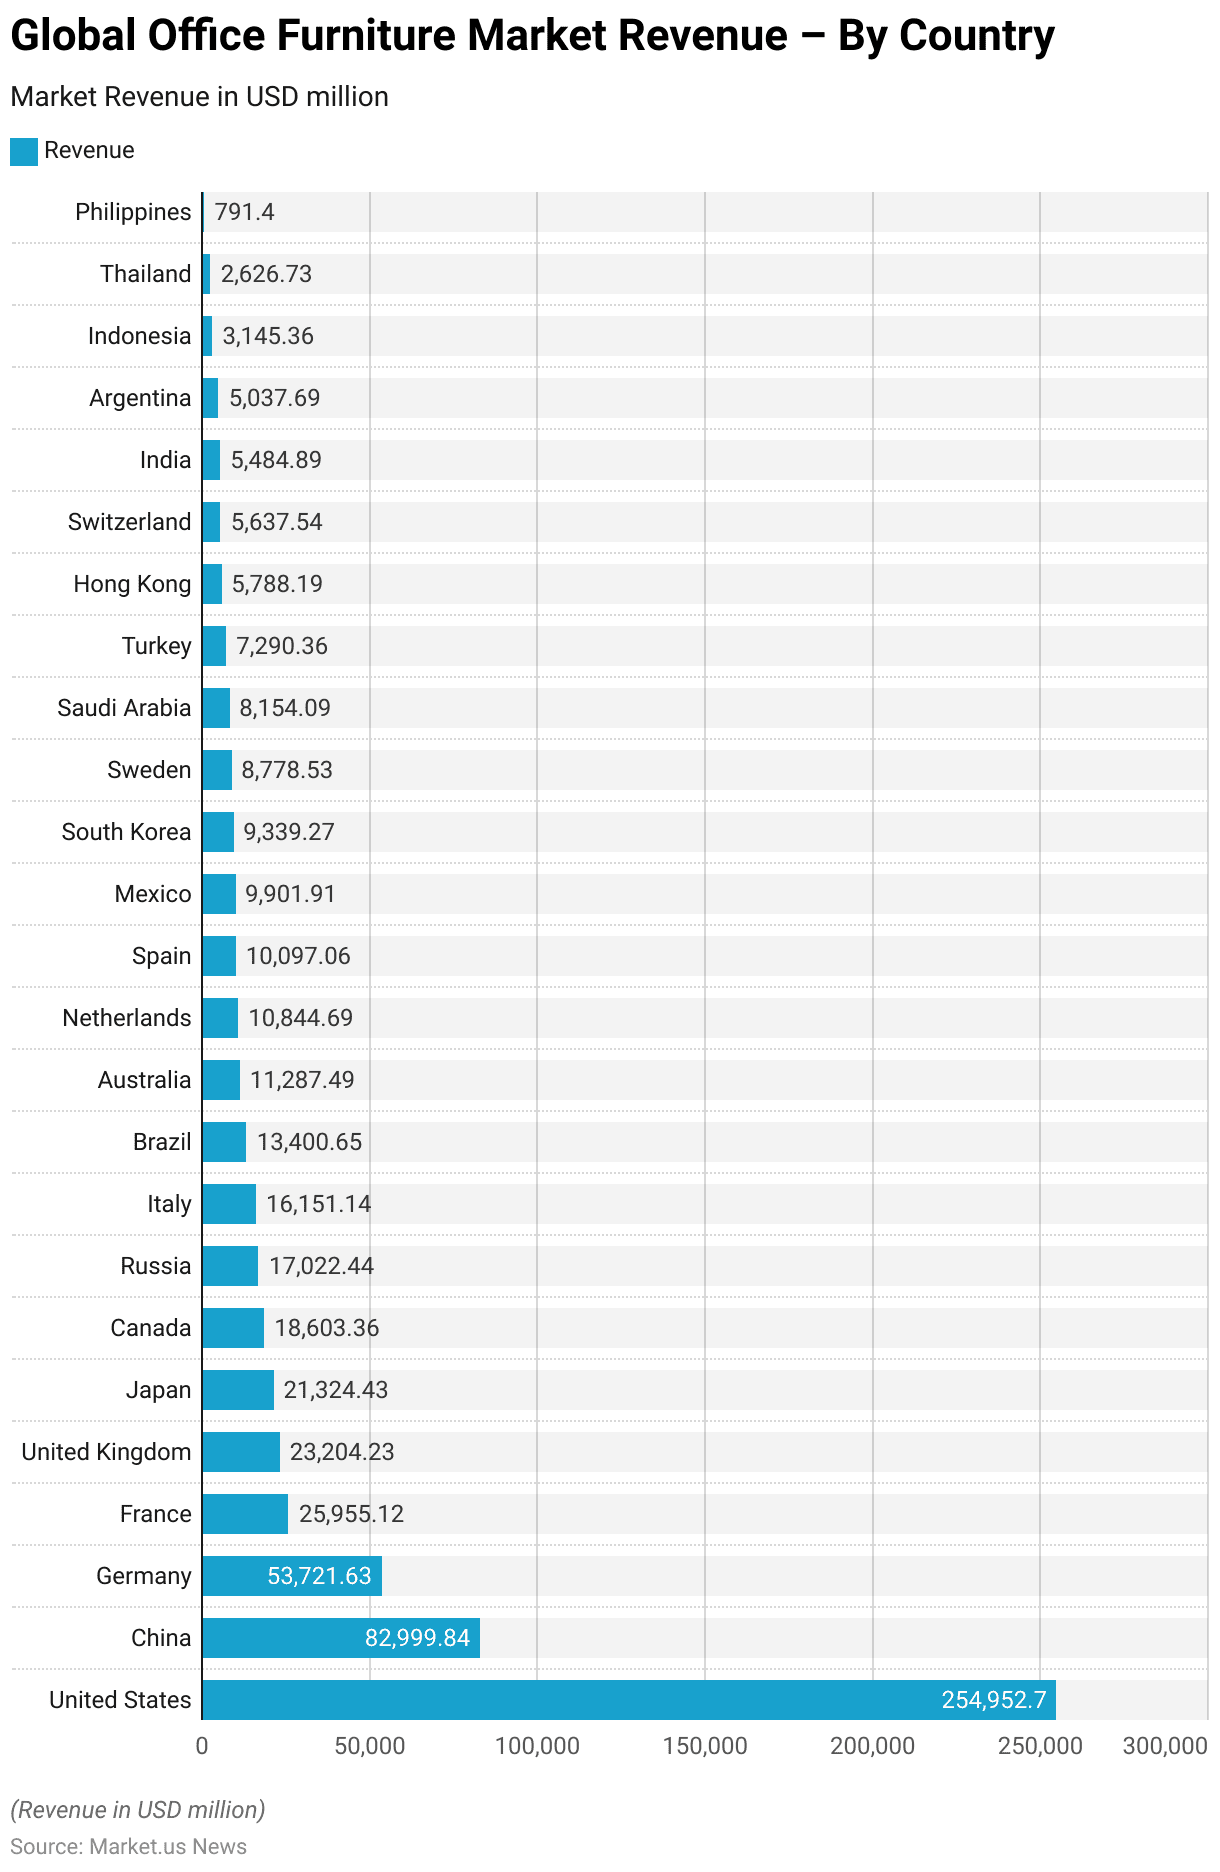
- In 2023, the global office furniture market demonstrated significant variation in revenue generation across different countries.
- The United States led the market with an impressive revenue of USD 254,952.7 million. Followed by China at USD 82,999.84 million and Germany at USD 53,721.63 million.
- Other major contributors included France with USD 25,955.12 million. The United Kingdom with USD 23,204.23 million, and Japan with USD 21,324.43 million.
- Canada generated USD 18,603.36 million, while Russia and Italy recorded revenues of USD 17,022.44 million and USD 16,151.14 million, respectively.
- Brazil contributed USD 13,400.65 million, and Australia accounted for USD 11,287.49 million.
- Additional significant markets included the Netherlands, with USD 10,844.69 million, Spain, with USD 10,097.06 million, and Mexico, with USD 9,901.91 million.
- South Korea, Sweden, and Saudi Arabia generated revenues of USD 9,339.27 million, USD 8,778.53 million, and USD 8,154.09 million, respectively.
- Turkey contributed USD 7,290.36 million, Hong Kong USD 5,788.19 million, and Switzerland USD 5,637.54 million.
- India, Argentina, and Indonesia had revenues of USD 5,484.89 million, USD 5,037.69 million, and USD 3,145.36 million, respectively.
- Smaller markets included Thailand at USD 2,626.73 million and the Philippines at USD 791.4 million.
- This data highlights the dominant role of developed nations in the global office furniture market. With emerging economies also contributing significantly.
(Source: Statista)
Global Home Office Furniture Market Revenue Statistics
- The global home office furniture market has shown steady growth from 2018 and is forecasted to continue expanding through 2028.
- In 2018, the market revenue stood at USD 40 billion. Increasing slightly to USD 41 billion in 2019 and USD 42 billion in 2020.
- A significant surge occurred in 2021, with revenue reaching USD 47 billion. Followed by a slight dip to USD 45 billion in 2022.
- Growth resumed in 2023, with the market estimated at USD 48 billion.
- Projections indicate a consistent upward trend, with revenues expected to reach USD 50 billion in 2024, USD 52 billion in 2025, and USD 55 billion in 2026.
- By 2027, the market is anticipated to generate USD 57 billion, reaching USD 60 billion by 2028. Highlighting the increasing demand for home office furniture driven by changing work environments and consumer preferences.
(Source: Statista)
Wholesale Revenue of Office Furniture in Different Nations Statistics
Germany
- From 2009 to 2020, the revenue of office furniture wholesale (NACE Rev. 2 G4665) in Germany showed a consistent upward trend, with occasional fluctuations.
- In 2009, revenue stood at USD 1,108 million, increasing to USD 1,170 million in 2010.
- A notable rise occurred in 2011, reaching USD 1,428 million. Followed by steady growth to USD 1,466 million in 2012 and USD 1,615 million in 2013.
- A significant surge was observed in 2014, with revenue jumping to USD 2,697 million. Though it slightly decreased to USD 2,418 million in 2015.
- Recovery ensued in 2016 with USD 2,662 million, followed by continuous growth to USD 2,852 million in 2017 and USD 3,046 million in 2018.
- The momentum continued with USD 3,185 million in 2019 and increased to USD 3,263 million in 2020.
- This sustained growth reflects the robust demand for wholesale office furniture in Germany during this period.
(Source: Statista)
India
- Between 2008 and 2018, the revenue of office furniture wholesale (SIC 46.65) in India exhibited significant fluctuations and steady growth in later years.
- In 2008, revenue was valued at USD 953 million but experienced a sharp decline in the subsequent years, falling to USD 691 million in 2009 and USD 687 million in 2010, reaching its lowest point at USD 664 million in 2011.
- A robust recovery occurred in 2012, with revenue surging to USD 1,089 million.
- This was followed by a slight decrease to USD 976 million in 2013 before rising again to USD 1,062 million in 2014.
- In the following years, the market demonstrated consistent growth, with revenues of USD 1,050 million in 2015, USD 1,084 million in 2016, USD 1,119 million in 2017, and finally reaching USD 1,157 million in 2018.
- This trend reflects a recovery and growth phase in the office furniture wholesale sector in India over the period.
(Source: Statista)
Poland
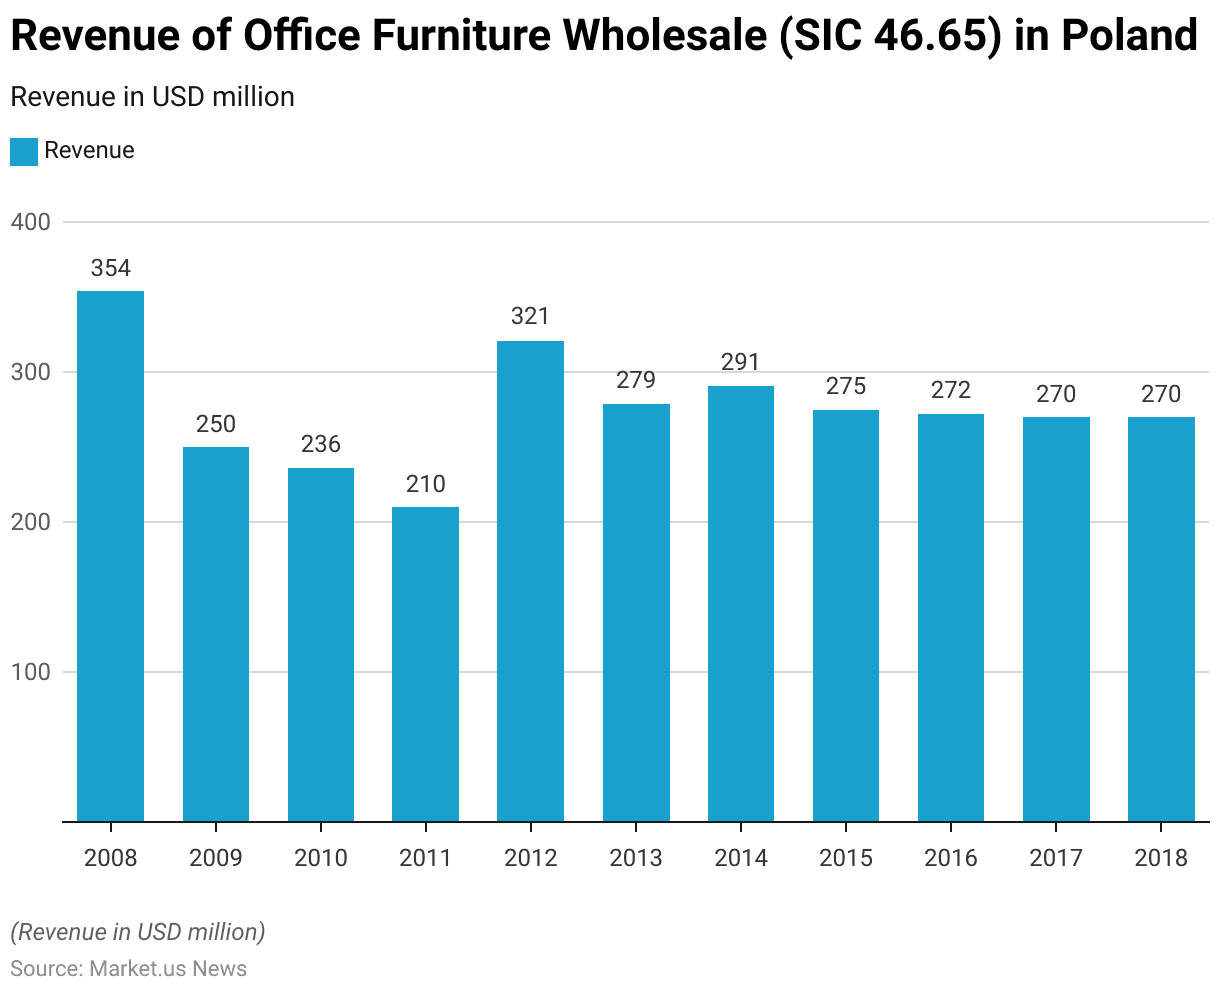
- Between 2008 and 2018, the revenue of office furniture wholesale (SIC 46.65) in Poland exhibited fluctuations, with both declines and recovery periods.
- In 2008, revenue reached USD 354 million, but it declined significantly to USD 250 million in 2009 and further to USD 236 million in 2010.
- The downward trend continued into 2011, with revenue decreasing to USD 210 million.
- A strong recovery occurred in 2012, with revenues rebounding to USD 321 million.
- However, this was followed by a slight decline to USD 279 million in 2013 before increasing again to USD 291 million in 2014.
- From 2015 onwards, the market stabilized, with revenues of USD 275 million in 2015, USD 272 million in 2016, and USD 270 million in both 2017 and 2018.
- This trend reflects a challenging period for the office furniture wholesale sector in Poland, marked by initial volatility and later stabilization.
(Source: Statista)
Canada
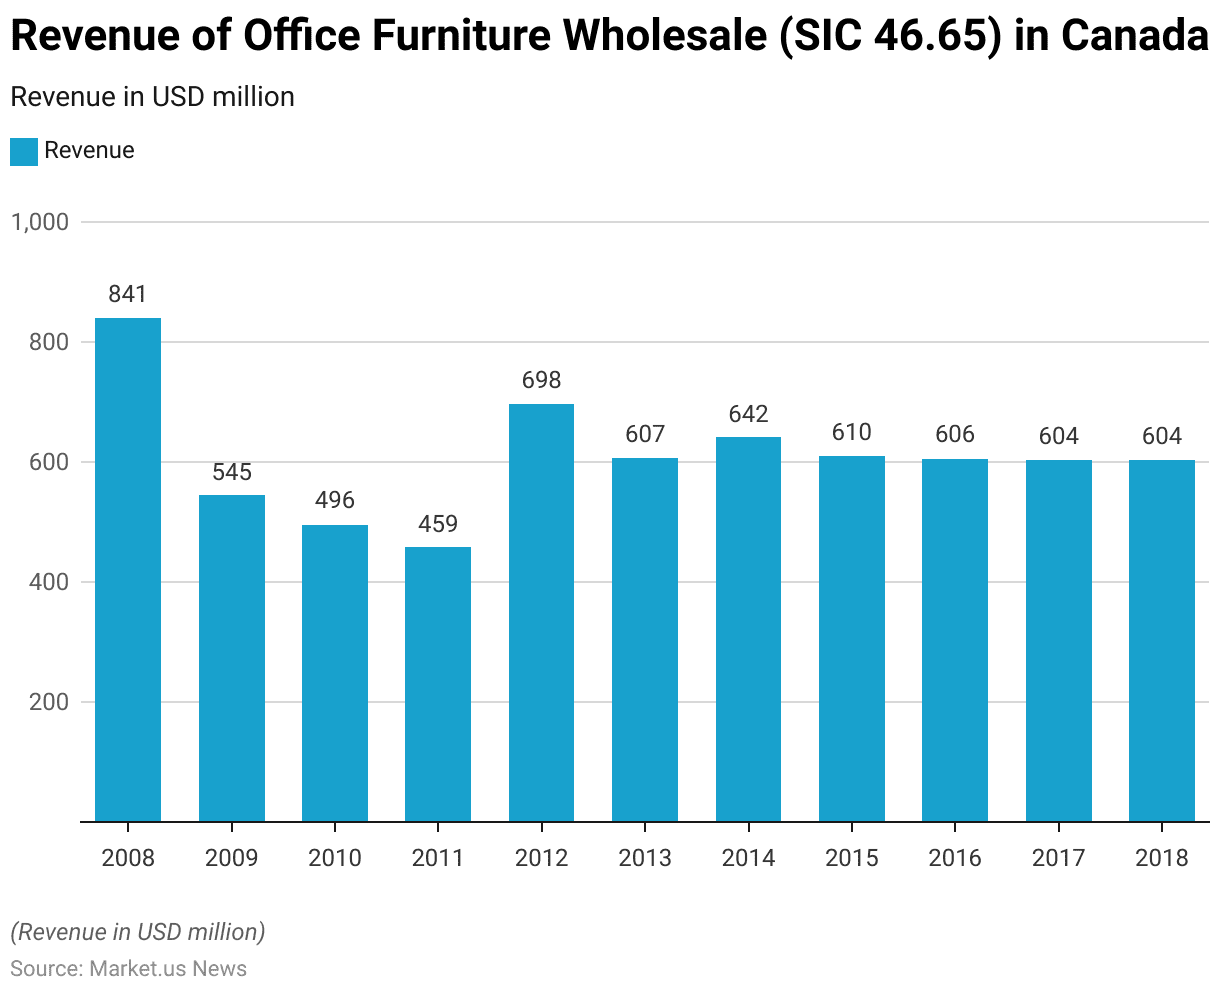
- Between 2008 and 2018, the revenue of office furniture wholesale (SIC 46.65) in Canada demonstrated a pattern of decline followed by recovery and stabilization.
- In 2008, revenue was at its peak of USD 841 million, but it declined significantly to USD 545 million in 2009 and further to USD 496 million in 2010.
- The downward trend continued into 2011, with revenue reaching USD 459 million.
- A strong recovery began in 2012, with revenues rebounding to USD 698 million, followed by USD 607 million in 2013.
- In 2014, revenues increased to USD 642 million before stabilizing at USD 610 million in 2015 and USD 606 million in 2016.
- In the final two years of the period, 2017 and 2018, revenues leveled off at USD 604 million.
- This data highlights the volatility of the sector during the global economic downturn and its eventual stabilization in the later years.
(Source: Statista)
Mexico
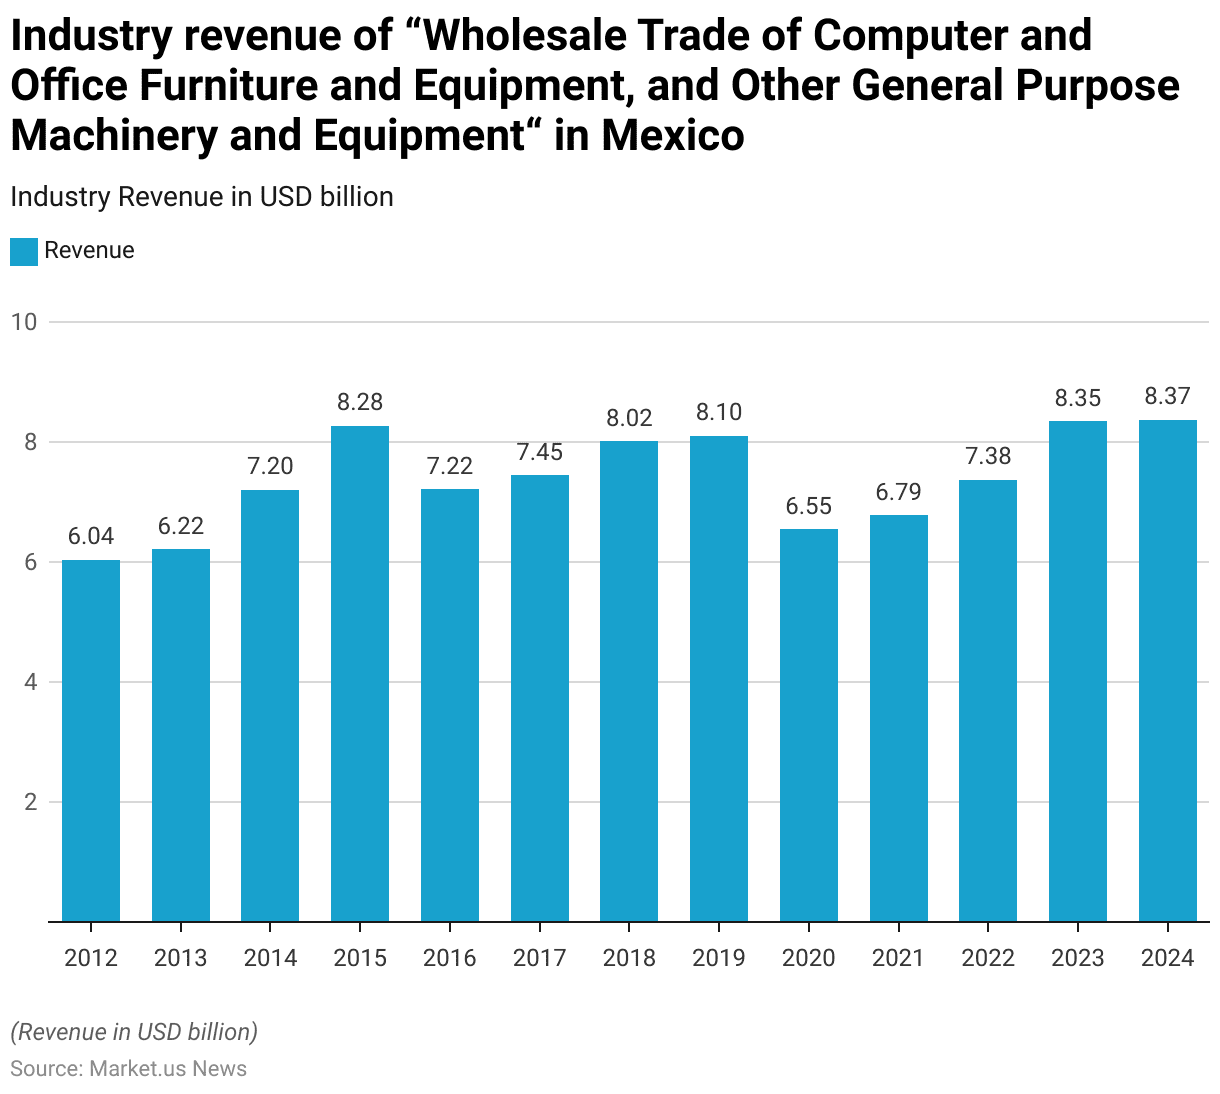
- Between 2012 and 2024, the revenue of the wholesale trade of computer and office furniture and equipment, along with other general-purpose machinery and equipment in Mexico, displayed fluctuations but maintained an overall growth trajectory.
- In 2012, revenue stood at USD 6.04 billion, increasing slightly to USD 6.22 billion in 2013.
- A significant rise followed in 2014, reaching USD 7.2 billion, and further to USD 8.28 billion in 2015.
- However, a decline occurred in 2016, with revenues dropping to USD 7.22 billion before recovering to USD 7.45 billion in 2017.
- Revenue climbed again to USD 8.02 billion in 2018 and peaked at USD 8.1 billion in 2019.
- The COVID-19 pandemic in 2020 caused a sharp decline to USD 6.55 billion, but gradual recovery followed, with USD 6.79 billion in 2021 and USD 7.38 billion in 2022.
- The industry is projected to grow steadily, reaching USD 8.35 billion in 2023 and USD 8.37 billion in 2024.
- This trend highlights resilience and recovery in the sector, driven by increasing demand for office and general-purpose equipment.
(Source: Statista)
Office Furniture Companies Revenue Statistics
Leading Office Furniture Companies Worldwide – By Revenue Statistics
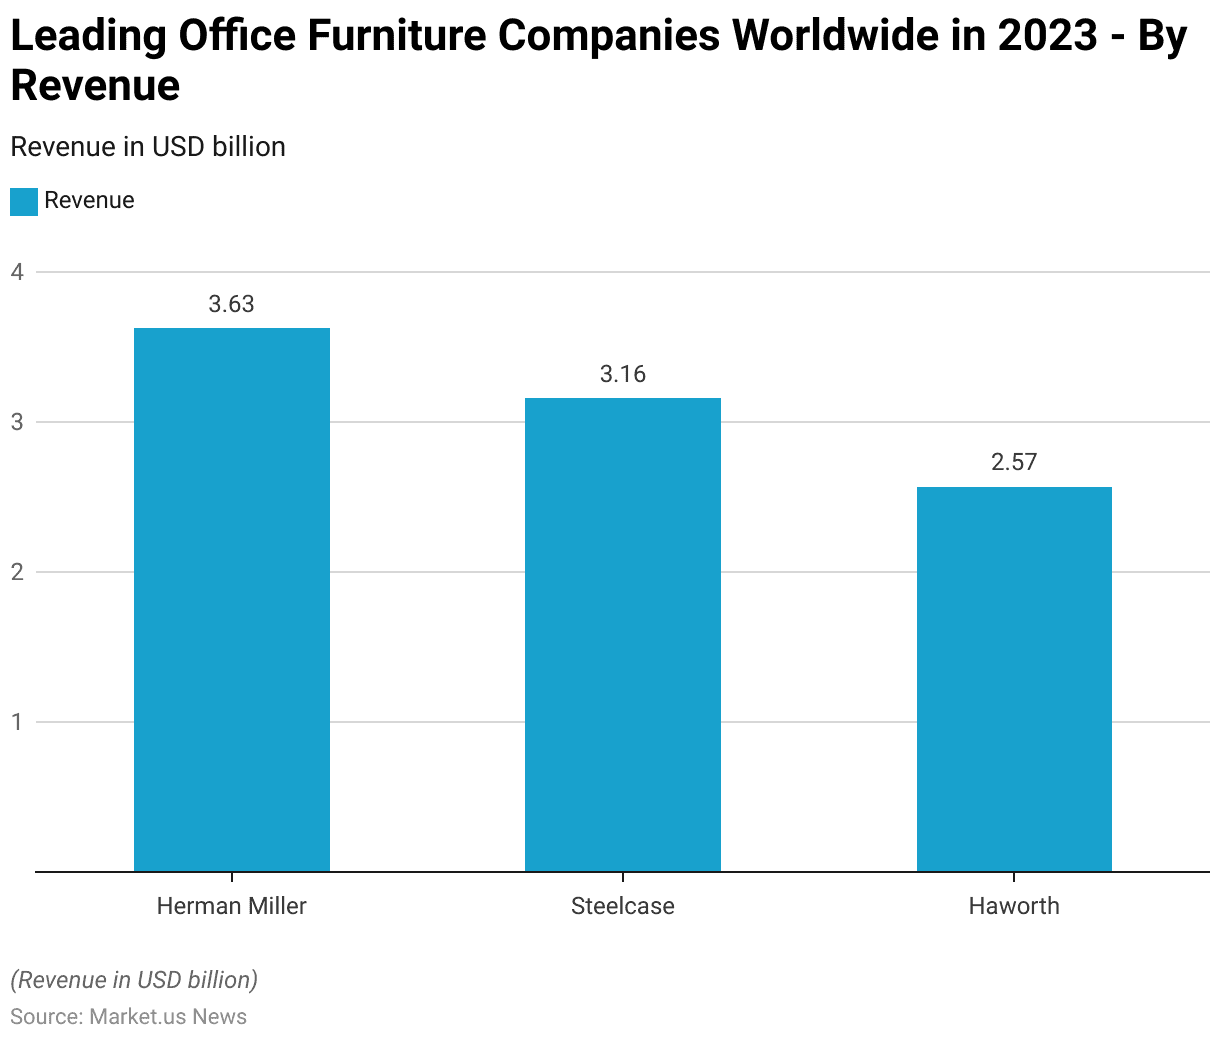
- In 2023, Herman Miller emerged as the leading office furniture company worldwide, generating a revenue of USD 3.63 billion.
- Steelcase followed closely, recording revenues of USD 3.16 billion.
- Haworth secured the third position with a total revenue of USD 2.57 billion.
- These figures underscore the competitive positioning and market dominance of these companies within the global office furniture industry.
(Source: Statista)
Revenue of Office Furniture Companies Worldwide – By Market Statistics
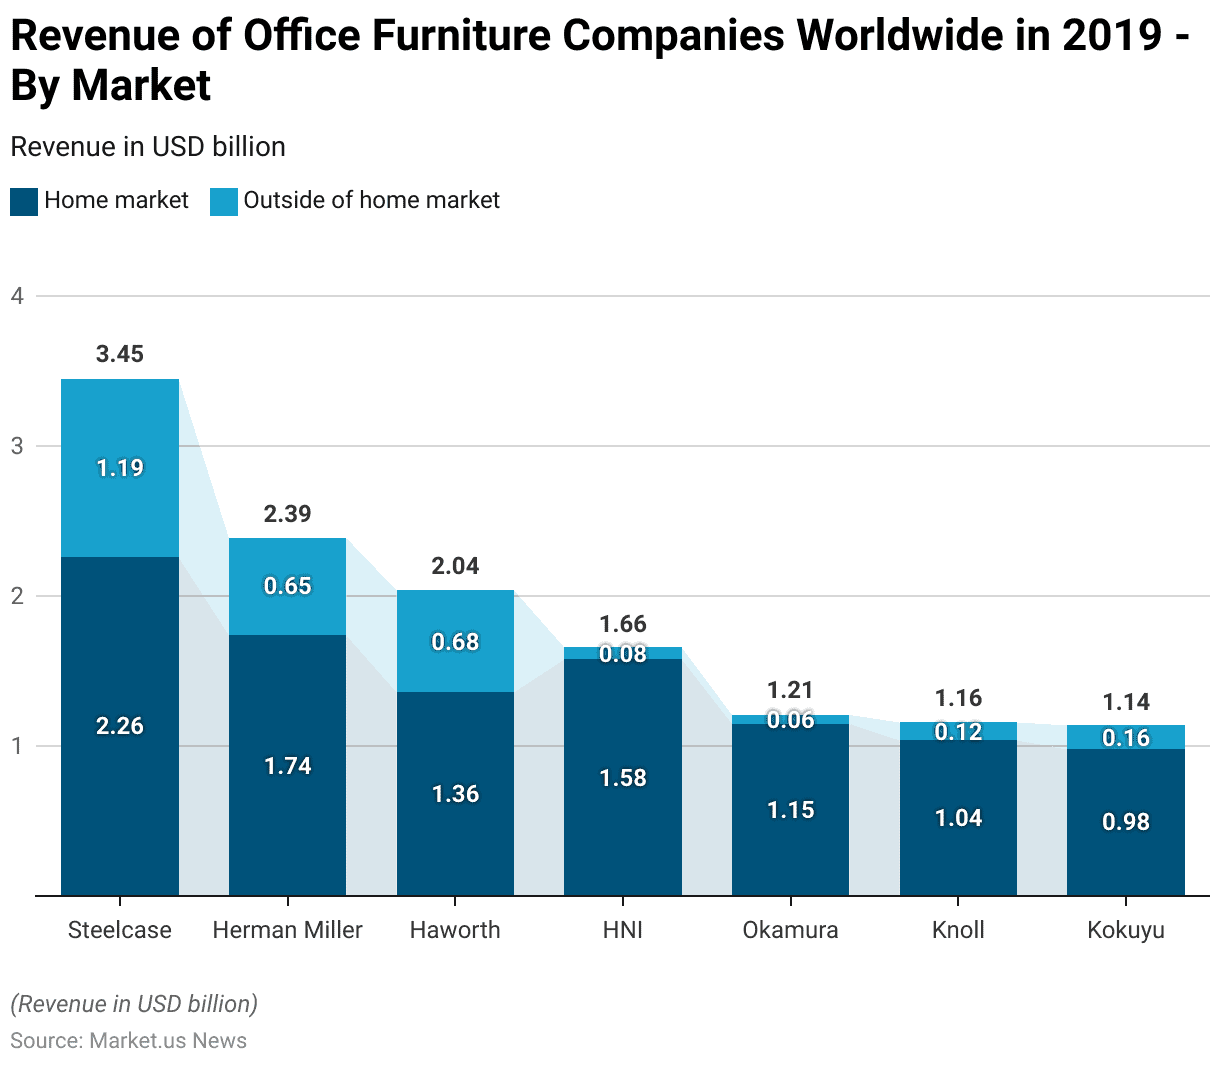
- In 2019, the revenue of selected office furniture companies worldwide showed notable differences between their home and their home regions.
- Steelcase led with revenues of USD 2.26 billion in its home market and USD 1.19 billion from markets outside.
- Herman Miller followed with USD 1.74 billion in its home market and USD 0.65 billion internationally.
- Haworth recorded USD 1.36 billion domestically and USD 0.68 billion outside its home market.
- HNI generated USD 1.58 billion in its home market but only USD 0.08 billion abroad.
- Okamura achieved USD 1.15 billion domestically and USD 0.06 billion internationally.
- Knoll’s revenue included USD 1.04 billion in its home market and USD 0.12 billion outside, while Kokuyu earned USD 0.98 billion domestically and USD 0.16 billion internationally.
- This data highlights a significant reliance on home markets for the majority of these companies, with varying levels of success in penetrating international markets.
(Source: Statista)
Office Furniture Sales Statistics
United States (Category)
- During the coronavirus pandemic in 2020, the United States witnessed significant increases in sales of various office furniture categories, reflecting a surge in demand due to the shift toward remote work.
- Office chairs experienced the highest growth, with sales increasing by 74.8%, followed by desks, which saw a 62.8% rise.
- Both bookshelves and décor items recorded identical growth rates of 38.1%, demonstrating increased interest in organizing and enhancing home office spaces.
- Filing cabinets also showed notable growth, with sales increasing by 30.8%.
- These trends highlight the emphasis on creating functional and aesthetically pleasing home workspaces during the pandemic.
(Source: Statista)
United States (Retail Sales)
- Between 2012 and 2019, the retail sales of home office ready-to-assemble (RTA) furniture in the United States showed a gradual fluctuation followed by consistent growth.
- In 2012, retail sales stood at USD 1.06 billion, but this decreased to USD 1.02 billion in 2013 and further to USD 1.01 billion in 2014.
- By 2015, sales dropped slightly to USD 1 billion before rebounding to USD 1.02 billion in 2016 and USD 1.04 billion in 2017.
- A notable upward trend emerged in 2018, with sales increasing to USD 1.11 billion and reaching USD 1.14 billion in 2019.
- This gradual growth reflects the increasing demand for RTA furniture, likely driven by evolving consumer preferences and the need for flexible home office solutions.
(Source: Statista)
United States (Manufacturers)
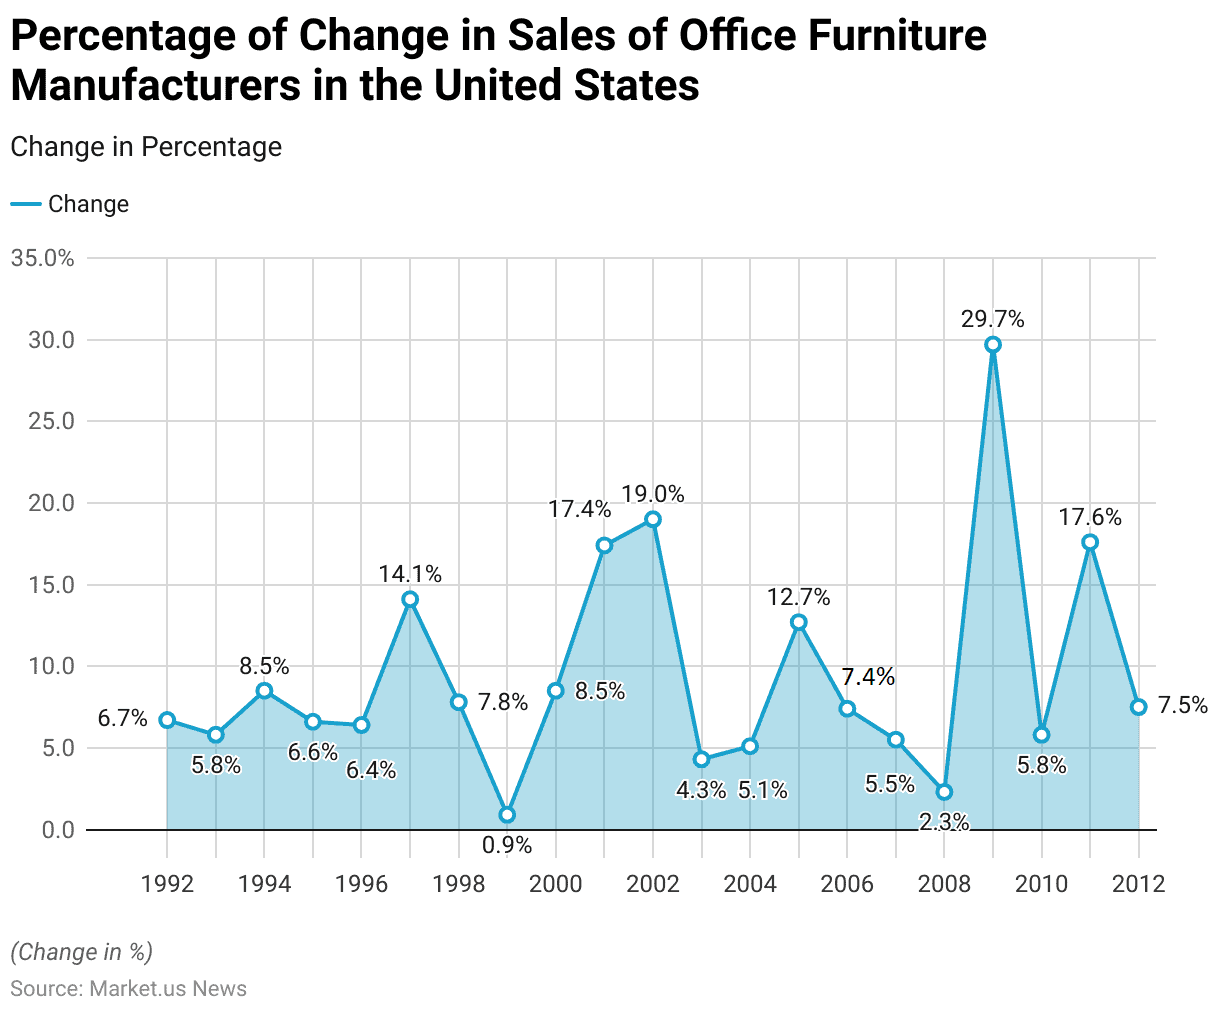
- Between 1992 and 2012, the percentage change in sales of office furniture manufacturers in the United States exhibited notable fluctuations, reflecting both growth periods and challenges.
- In 1992, sales increased by 6.7%, followed by a slight decline to 5.8% in 1993.
- Growth peaked at 8.5% in 1994 and stabilized around 6.6% and 6.4% in 1995 and 1996, respectively.
- A significant jump to 14.1% occurred in 1997, before settling at 7.8% in 1998.
- However, 1999 saw minimal growth at 0.9%, followed by a rebound to 8.5% in 2000.
- The years 2001 and 2002 experienced robust growth rates of 17.4% and 19%, respectively.
- Growth slowed to 4.3% in 2003, then gradually increased to 5.1% in 2004 and 12.7% in 2005.
- In 2006 and 2007, sales rose by 7.4% and 5.5%, respectively, but dropped sharply to 2.3% in 2008.
- The financial crisis of 2009 triggered a dramatic decline, with sales plummeting by 29.7%.
- Recovery began in 2010 with a 5.8% increase, followed by a strong growth of 17.6% in 2011 and 7.5% in 2012.
- These trends highlight the cyclical nature of the industry, influenced by economic conditions and market demand.
(Source: Statista)
United Kingdom
- In 2023, the United Kingdom’s office and shop furniture manufacturing industry recorded notable unit sales across various product categories.
- Metal office furniture, excluding seating, led the market with 2,721,000 units sold, followed closely by wooden office furniture, excluding seating, at 2,597,000 units.
- Wooden shop furniture, excluding seating, accounted for 1,675,000 units sold, while swivel seats reached sales of 1,195,000 units.
- Non-upholstered seats with wooden frames saw sales of 349,000 units, and non-upholstered seats with metal frames accounted for 220,000 units.
- These figures reflect a strong demand for a diverse range of office and shop furniture products in the UK market.
(Source: Statista)

United Kingdom (Manufacturers)
- Between 2008 and 2023, the sales value of office and shop furniture manufactured in the United Kingdom exhibited fluctuations.
- In 2008, sales were valued at £1,452 million, but the following year saw a sharp decline to £1,032 million, with a further reduction to £1,011 million in 2010.
- A recovery began in 2011, with sales rising to £1,100 million and continuing to £1,217 million in 2012.
- However, in 2013, it experienced a drop to £1,081 million before rebounding to £1,185 million in 2014.
- The market remained relatively stable, with sales at £1,170 million in 2015 and increasing to £1,265 million in 2016.
- In 2017, sales fell to £1,141 million, followed by a slight increase to £1,165 million in 2018 and £1,272 million in 2019.
- A significant decline occurred in 2020, when sales dropped to £962 million, likely impacted by the COVID-19 pandemic.
- The market rebounded to £1,223 million in 2021 and remained strong, reaching £1,271 million in 2022 and £1,225 million in 2023.
- This data illustrates the resilience and cyclical nature of the UK office and shop furniture market over the 15 years.
(Source: Statista)
Europe (Manufacturers)
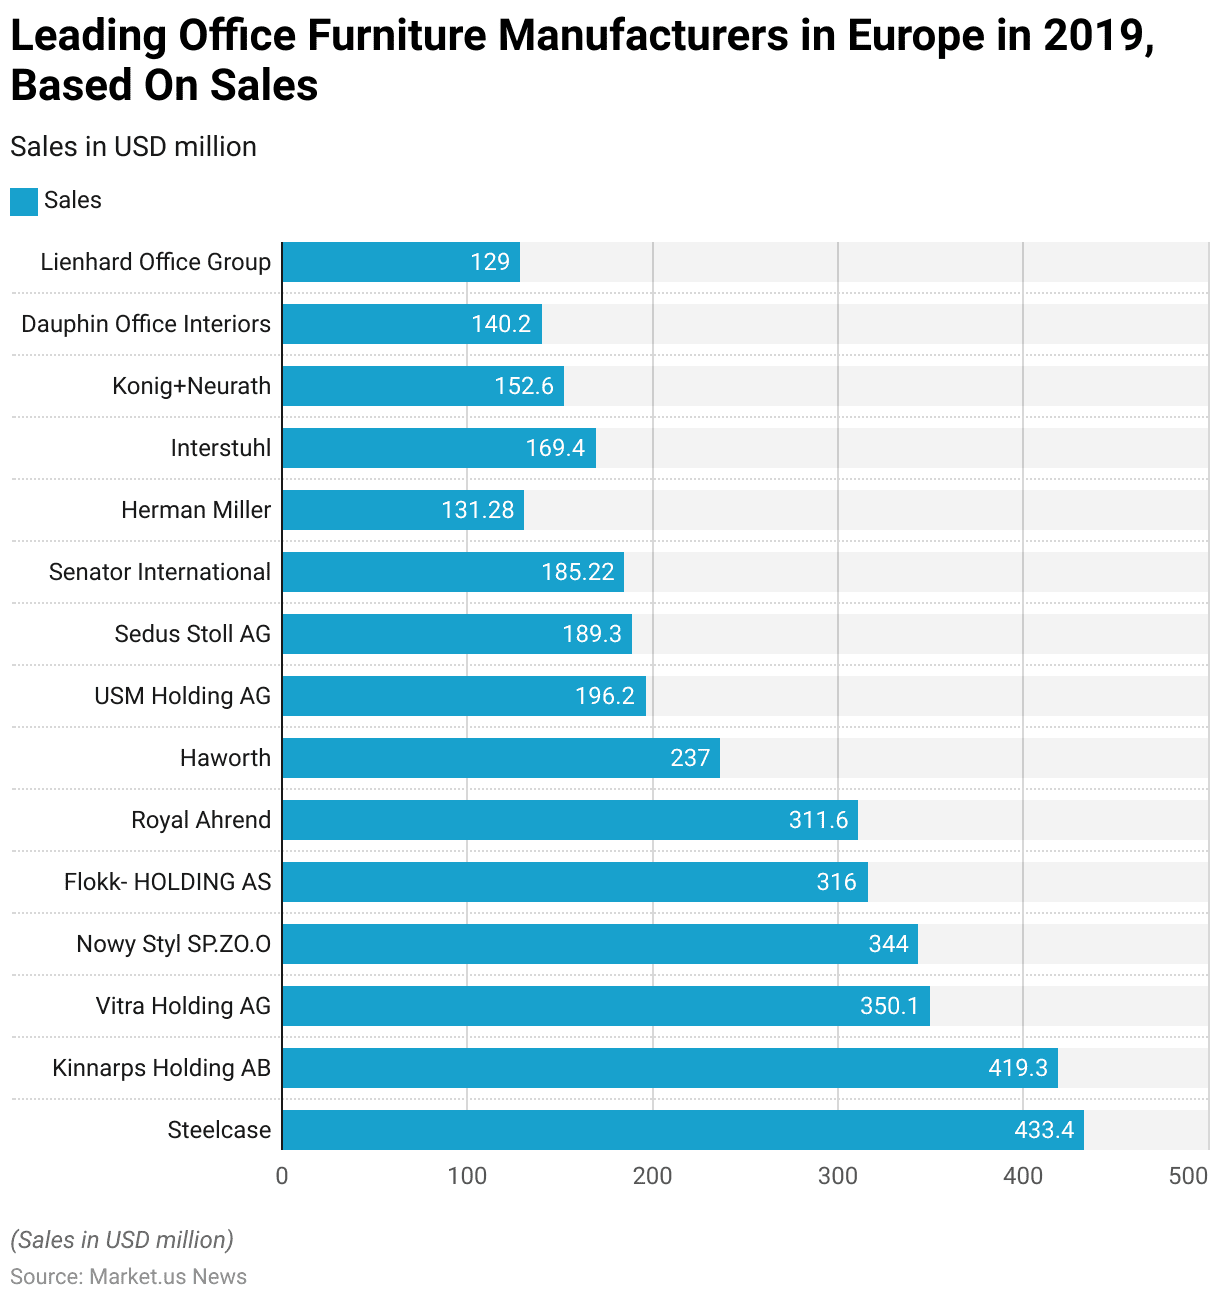
- In 2019, Europe’s leading office furniture manufacturers achieved notable sales figures, highlighting their dominance in the market.
- Steelcase topped the list with sales of €433.4 million, followed closely by Kinnarps Holding AB at €419.3 million.
- Vitra Holding AG recorded €350.1 million in sales, while Nowy Styl SP.ZO.O achieved €344 million.
- Flokk-HOLDING AS and Royal Ahrend followed with sales of €316 million and €311.6 million, respectively.
- Haworth generated €237 million, and USM Holding AG reached €196.2 million.
- Sedus Stoll AG recorded €189.3 million, while Senator International generated €185.22 million.
- Interstuhl contributed €169.4 million, and Konig+Neurath recorded €152.6 million in sales.
- Dauphin Office Interiors achieved €140.2 million, and Lienhard Office Group rounded out the list with €129 million in sales.
- These figures underscore the robust performance and market presence of these manufacturers within the European office furniture industry.
(Source: Statista)
Italy (Companies)
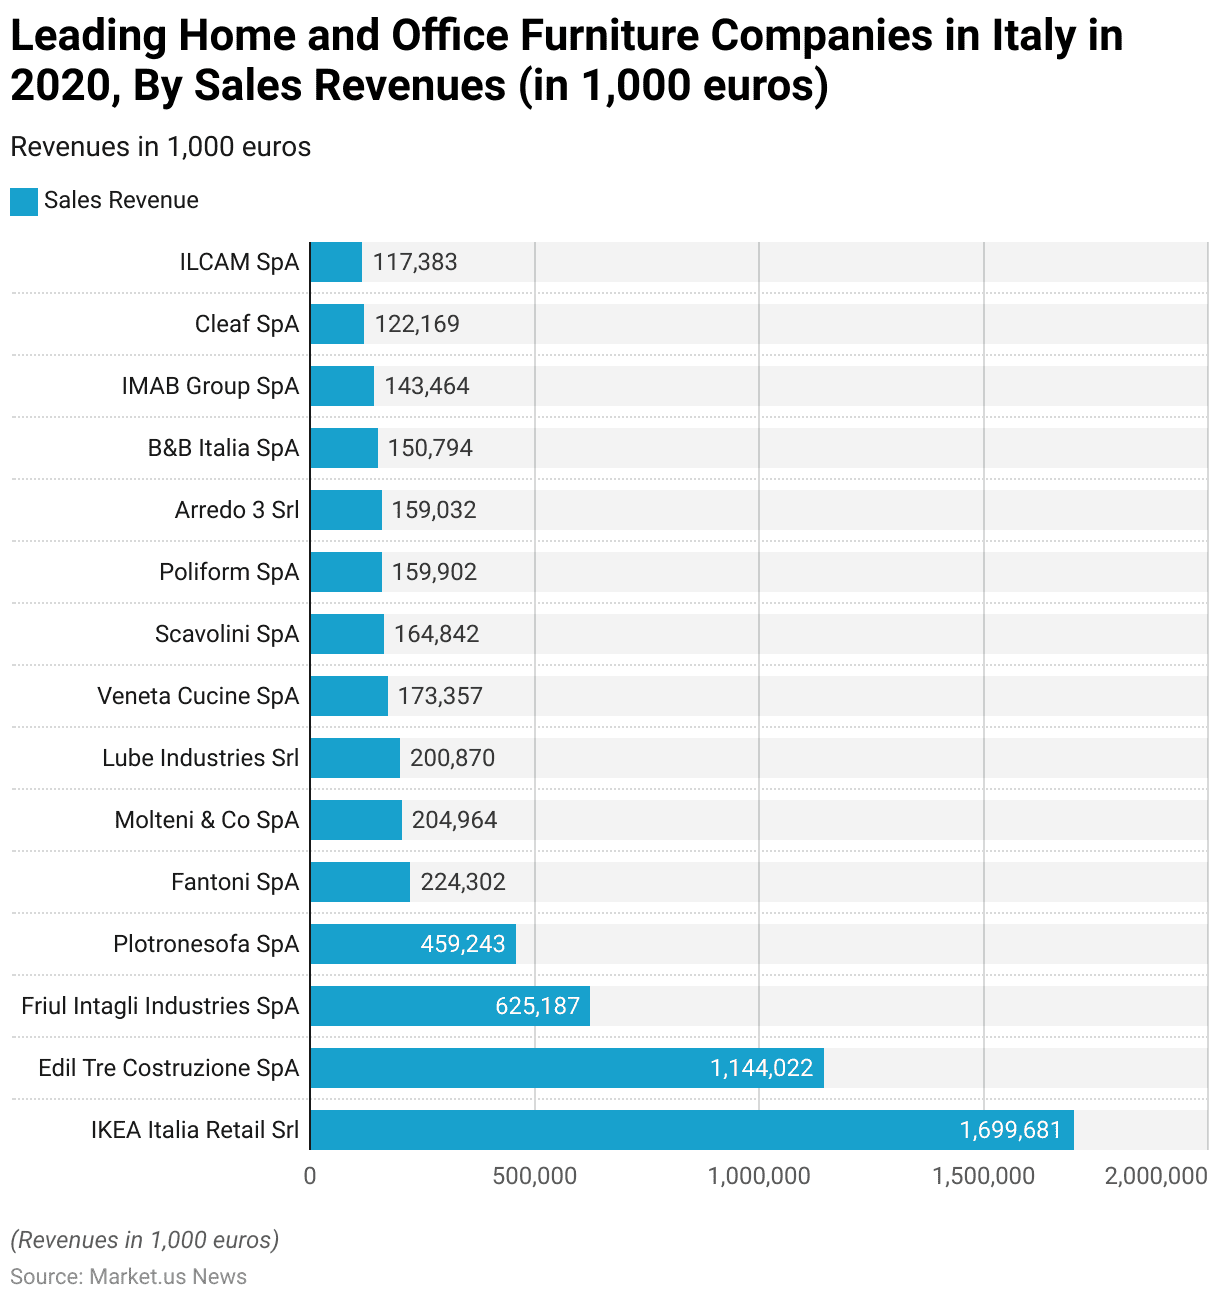
- In 2020, Italy’s leading home and office furniture companies achieved significant sales revenues, with IKEA Italia Retail Srl dominating the market at €1,699,681,000.
- Edil Tre Costruzione SpA followed with €1,144,022,000, while Friul Intagli Industries SpA recorded €625,187,000.
- Plotronesofa SpA generated €459,243,000, and Fantoni SpA achieved €224,302,000 in sales.
- Molteni & Co SpA and Lube Industries Srl reported revenues of €204,964,000 and €200,870,000, respectively.
- Veneta Cucine SpA and Scavolini SpA followed closely with €173,357,000 and €164,842,000, respectively.
- Poliform SpA and Arredo 3 Srl both recorded similar revenues of €159,902,000 and €159,032,000, while B&B Italia SpA contributed €150,794,000.
- IMAB Group SpA generated €143,464,000, with Cleaf SpA and ILCAM SpA rounding out the list at €122,169,000 and €117,383,000, respectively.
- These figures highlight the robust contributions of these companies to Italy’s furniture industry in 2020.
(Source: Statista)
Office Furniture Purchase Preferences Statistics
Home Office Purchase Plans Per Generation – By Category
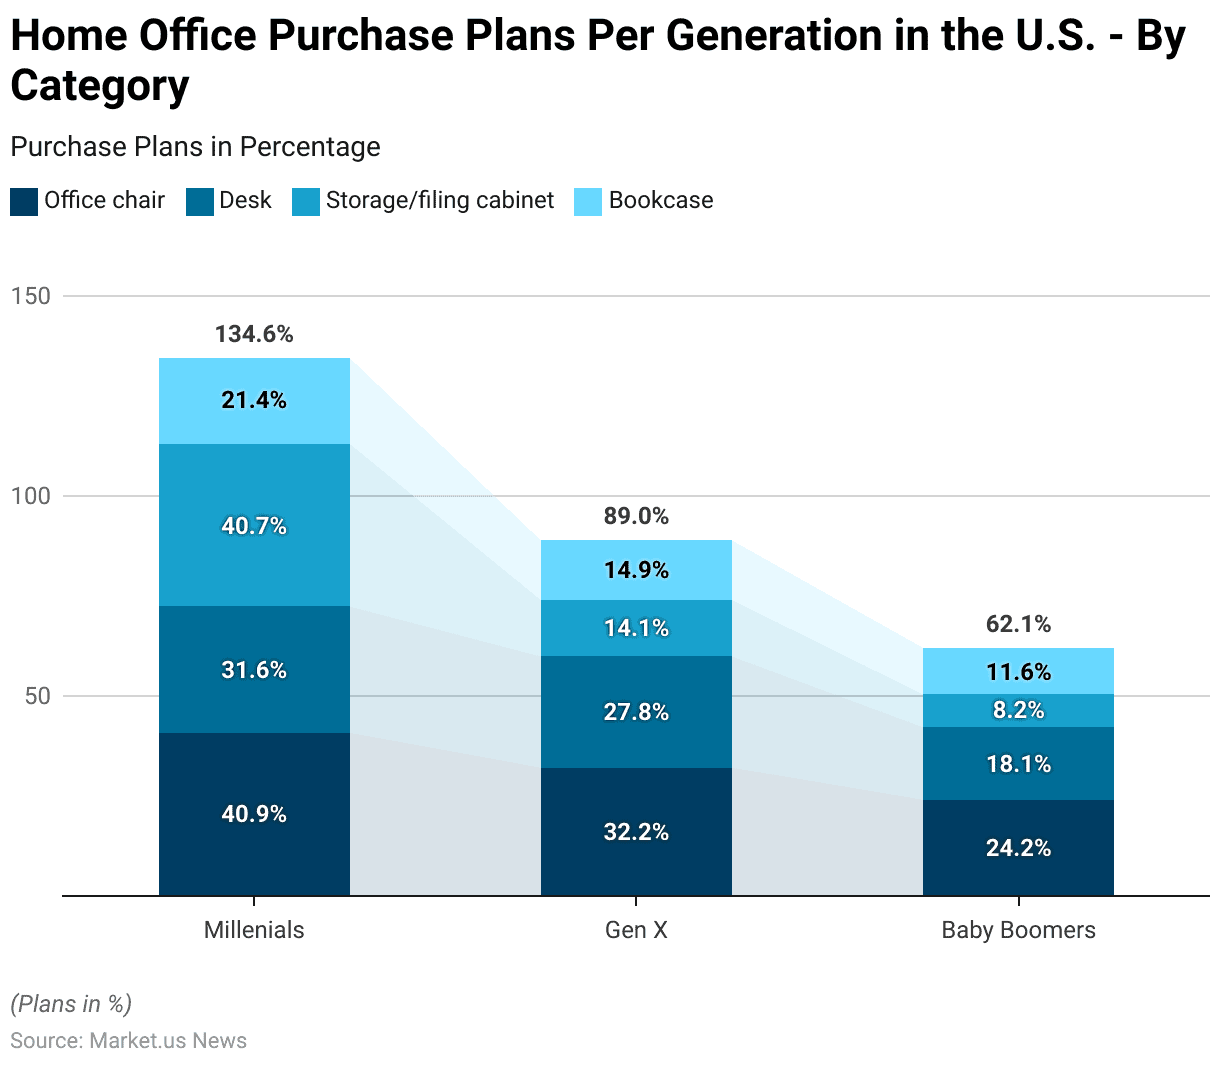
- In 2021, home office furniture purchase plans in the United States varied significantly among Millennials, Gen X, and Baby Boomers, reflecting generational preferences.
- Among Millennials, 40.9% planned to purchase office chairs, followed by 40.7% considering storage or filing cabinets, 31.6% desks, and 21.4% bookcases.
- For Gen X, 32.2% expressed interest in office chairs, 27.8% in desks, 14.1% in storage or filing cabinets, and 14.9% in bookcases.
- Baby Boomers showed the least interest across all categories, with 24.2% planning to purchase office chairs, 18.1% desks, 8.2% storage or filing cabinets, and 11.6% bookcases.
- These trends indicate a higher inclination among Millennials toward investing in home office setups compared to older generations.
(Source: Statista)
Timeline for Buying Home Office Furniture for Consumers Statistics
- In 2020, U.S. consumers exhibited varying timelines for their planned home office furniture purchases.
- A significant 34% of respondents intended to make their purchases within the next month, while 43% planned to do so within the next 2-3 months, indicating a strong near-term demand.
- Another 17% expected to make their purchases within 4-6 months, and only 6% indicated plans to buy home office furniture beyond six months.
- This data highlights an urgency among a majority of consumers to invest in home office furniture within a short timeframe, likely driven by the growing need for functional home workspaces.
(Source: Statista)
Home Office Furniture Priorities Among Consumers – By Type Statistics
- In 2020, U.S. consumers prioritized specific types of home office furniture, with desks and chairs leading the list, each selected by 27% of respondents.
- Storage cabinets and printer stands were next, each favored by 10% of respondents.
- Standing desks were chosen by 9% while filing cabinets and laptop stands each garnered 8%.
- Other types of furniture were mentioned by only 1% of respondents.
- This distribution reflects a strong emphasis on essential furniture items like desks and chairs, with moderate interest in supplementary items such as storage solutions and ergonomic setups.
(Source: Statista)
Most Purchased Office or Study Room Furniture
- In 2022, the most purchased office or study room furniture in South Korea reflected consumer priorities for functionality and organization.
- Chairs were the most popular, purchased by 28.4% of respondents, followed by desks at 20.4%.
- Bookcases were also a notable choice, with 14.2% of respondents acquiring them.
- These preferences highlight a focus on essential items for creating comfortable and efficient work or study spaces.
(Source: Statista)
Home Office Furniture Purchase Funding Plans of Consumers Statistics
- In 2020, consumers in the United States planned to fund their home office furniture purchases through various means.
- A majority, 66% of respondents, intended to use their finances to cover the costs.
- Meanwhile, 17% planned to utilize government stimulus checks, and 16% relied on company stipends provided by their employers.
- Only 1% of respondents indicated they would use other methods.
- These findings highlight that personal funds were the primary source for home office furniture purchases, with supplemental support from government and employer initiatives playing a smaller but notable role.
(Source: Statista)
Wooden Office Furniture Import and Export Statistics
Imports
- From 2015 to 2023, the value of wooden office furniture imports to the United States experienced fluctuations, reflecting changes in market demand and trade conditions.
- In 2015, imports were valued at USD 964.02 million, increasing steadily to USD 1,036.53 million in 2016 and peaking at USD 1,147.85 million in 2017.
- However, by 2018, the value declined slightly to USD 1,052.2 million and further to USD 959.46 million in 2019.
- A significant drop occurred in 2020, with imports falling to USD 882.96 million, likely influenced by the global COVID-19 pandemic.
- The market rebounded slightly in 2021, with imports reaching USD 954.49 million, followed by a modest decline to USD 941.16 million in 2022.
- In 2023, the value of imports fell further to USD 838.25 million.
- This trend highlights the variable dynamics of the U.S. wooden office furniture import market over the observed period.
(Source: Statista)
Exports
- Between 2015 and 2023, the value of wooden office furniture exports from the United States exhibited notable fluctuations.
- In 2015, exports were valued at USD 156 million, followed by a decline to USD 134.77 million in 2016.
- The export value rebounded to USD 155.66 million in 2017 and peaked at USD 168.6 million in 2018.
- However, this growth was short-lived, as exports decreased to USD 158.43 million in 2019.
- A significant drop occurred in 2020, with the export value falling to USD 130.03 million, likely impacted by global disruptions caused by the COVID-19 pandemic.
- While there was a slight recovery in 2021 with USD 135.28 million in exports, the figures declined again to USD 133.26 million in 2022 and further to USD 124.58 million in 2023.
- This trend reflects the challenges and variability in the U.S. wooden office furniture export market over the years.
(Source: Statista)
Impact of Hybrid Work
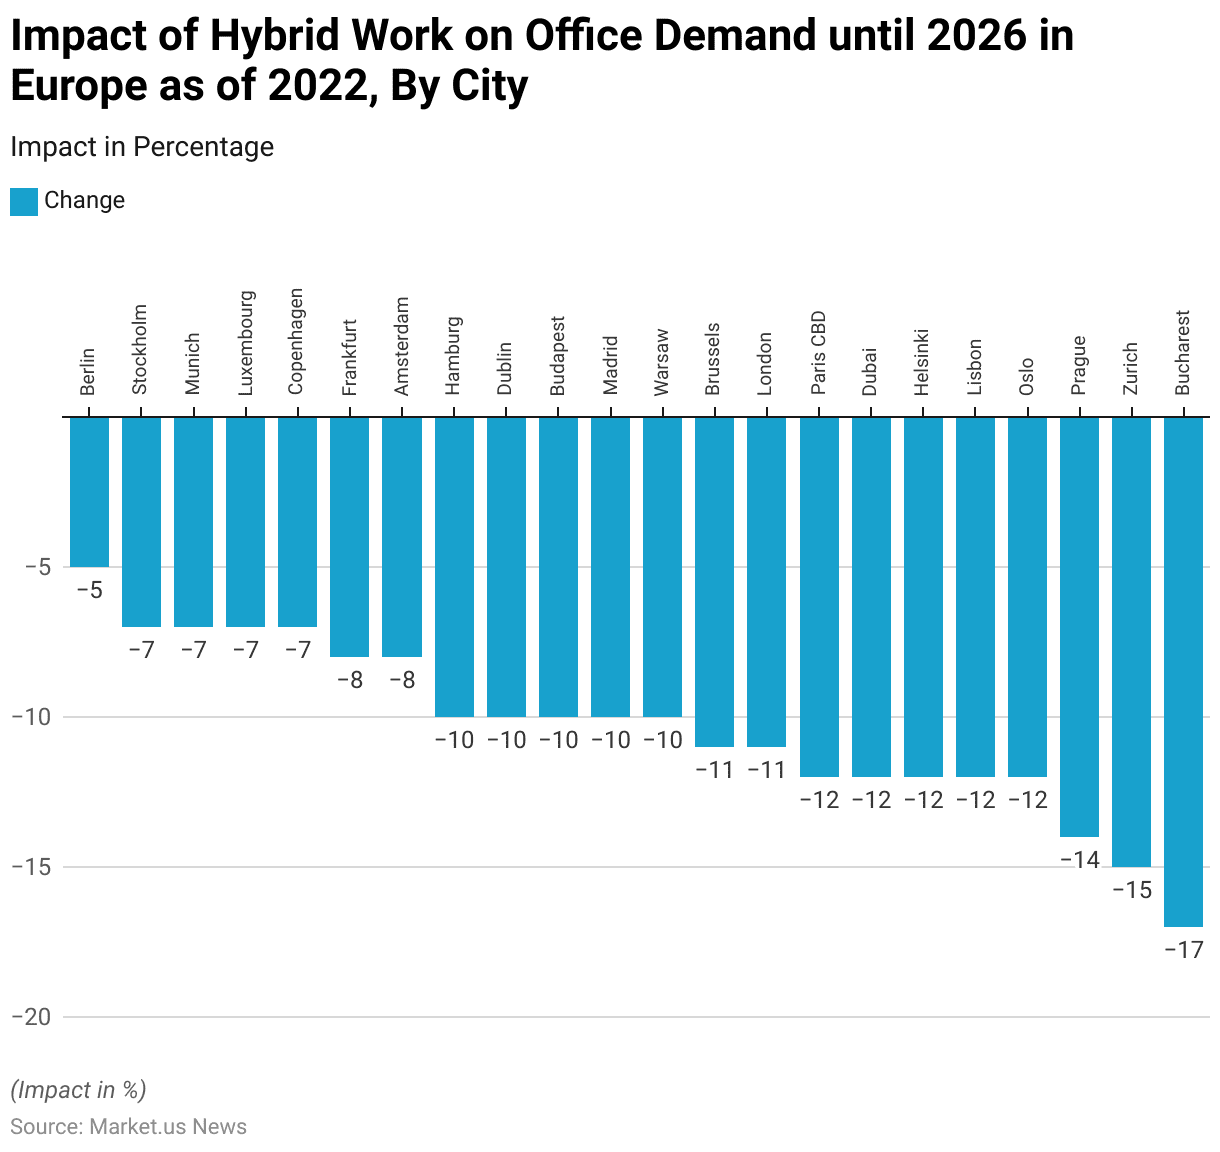
- As of 2022, the potential impact of hybrid work and desk sharing on office space demand across selected cities in Europe and beyond is projected to result in notable reductions by 2026.
- Berlin is expected to experience the smallest decrease in demand at 5%, followed by Stockholm, Munich, Luxembourg, and Copenhagen with 7% each.
- Frankfurt and Amsterdam are projected to see reductions of 8%.
- Larger declines of 10% are anticipated in Hamburg, Dublin, Budapest, Madrid, and Warsaw.
- Brussels and London are expected to see office space demand decrease by 11%.
- Cities like Paris CBD, Dubai, Helsinki, Lisbon, and Oslo are forecasted to experience a 12% drop.
- More significant reductions are projected for Prague at 14%, Zurich at 15%, and Bucharest, facing the largest decline of 17%.
- These trends reflect the growing adoption of flexible work models and the shift towards optimizing office space utilization in response to hybrid working arrangements.
(Source: Statista)
Key Investments
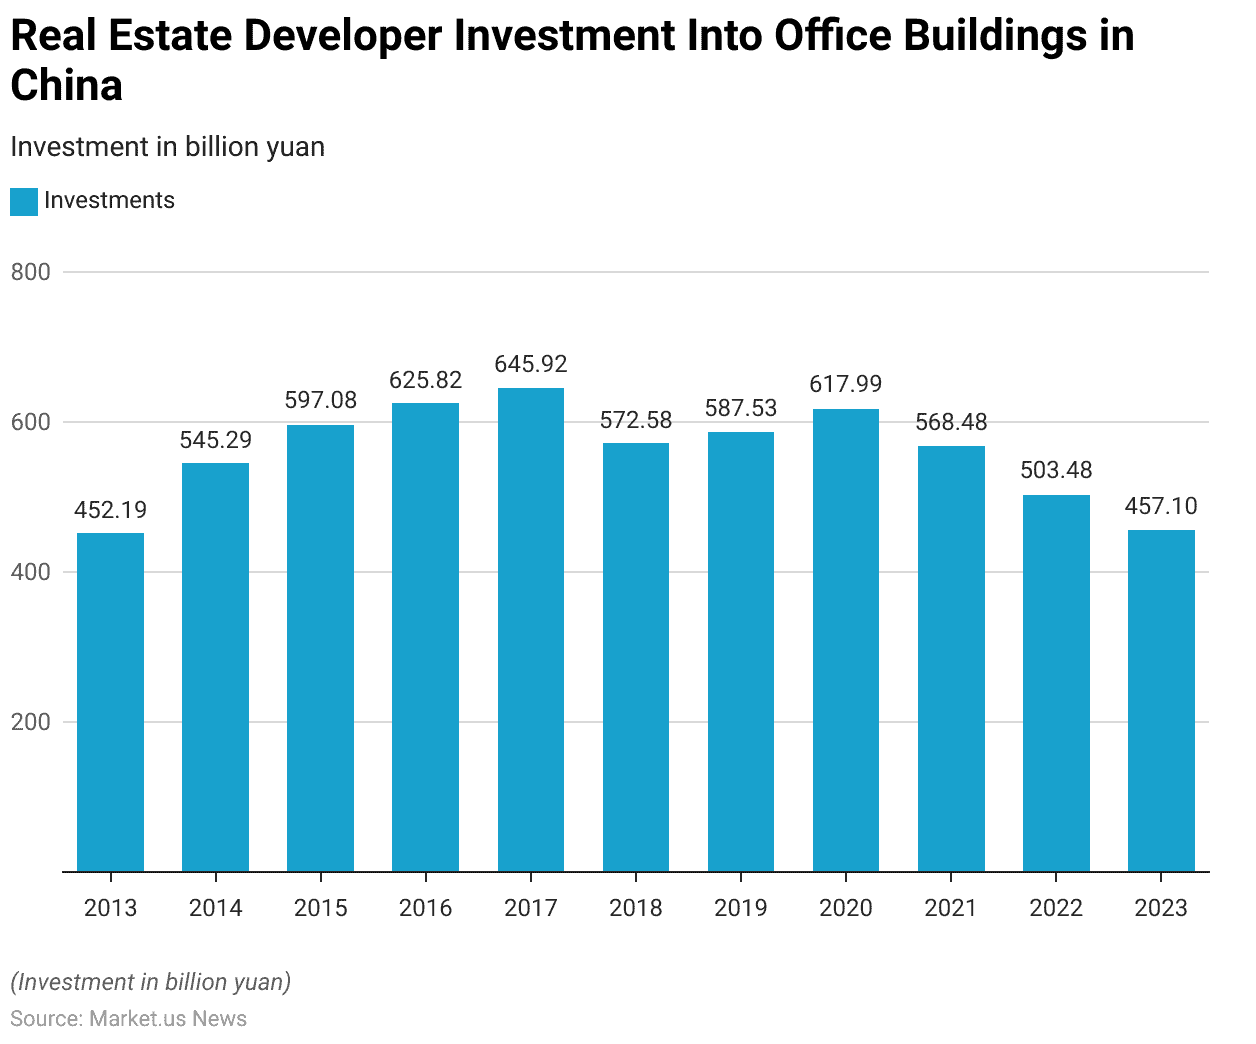
- Between 2013 and 2023, real estate developer investment in office buildings in China showed significant fluctuations.
- In 2013, investments totaled 452.19 billion yuan, increasing steadily to 545.29 billion yuan in 2014 and 597.08 billion yuan in 2015.
- The upward trend continued, with investments reaching 625.82 billion yuan in 2016 and peaking at 645.92 billion yuan in 2017.
- However, a decline began in 2018, when investments fell to 572.58 billion yuan, followed by a slight recovery to 587.53 billion yuan in 2019.
- In 2020, investments rose again to 617.99 billion yuan but dropped to 568.48 billion yuan in 2021.
- The downward trend continued in 2022, with investments decreasing to 503.48 billion yuan and further to 457.1 billion yuan in 2023.
- This pattern reflects both the highs of the earlier years and the challenges faced by the sector in the later years, influenced by market dynamics and economic conditions.
(Source: Statista)
Innovations and Developments in Office Furniture Statistics
- Innovations in the office furniture industry in 2023 have focused on creating dynamic, eco-friendly, and technologically integrated workspaces.
- A major trend has been the emphasis on sustainable and multi-functional furniture, accommodating the diverse needs of modern work environments.
- For instance, the use of sustainable materials and designs that adapt for multiple uses are prominent, reflecting a shift towards more environmentally conscious business practices.
- Technological integration has also been significant, with office furniture incorporating smart features like built-in charging ports and cable management systems to enhance connectivity and productivity.
- Moreover, the office furniture market has seen a variety of designs that emphasize flexibility and employee well-being.
- Products like ergonomic seating and adjustable desks that cater to the hybrid work model are increasingly popular, supporting both in-office and remote work scenarios efficiently.
- Companies are also leveraging online platforms and augmented reality to offer personalized shopping experiences, showcasing their commitment to combining convenience with innovation.
- This evolution in office furniture design not only caters to immediate functional needs but also strategically positions companies to attract and retain talent by enhancing workplace aesthetics and comfort, promoting a healthier, more collaborative, and more productive work environment.
(Source: Sedus – What’s Up, Gebesa, Stamford Office Furniture, Archipro)
Recent Developments
Acquisitions and Mergers:
- Herman Miller’s Acquisition of Knoll: In April 2021, Herman Miller announced plans to acquire competitor Knoll in a cash-and-stock deal valued at approximately $1.8 billion. This strategic move aimed to expand Herman Miller’s product portfolio and strengthen its position in the global office furniture market.
Product Launches:
- Better Homes & Gardens’ New Furniture Colors: In November 2024, Better Homes & Gardens, in partnership with Walmart, unveiled new color options for eight popular furniture pieces in the Lillian and Juliet lines. These updates include the Juliet Narrow Arch Bookcase now available in deep green for $148 and the Juliet Expandable Dining Table in black for $248, offering stylish and functional solutions for various spaces, including offices.
Conclusion
Office Furniture Statistics – In conclusion, the office furniture market has shown consistent growth globally, driven by changing work environments and evolving consumer preferences.
While demand has fluctuated across regions, key markets such as the United States, China, and Europe have remained significant contributors.
The shift toward remote and hybrid work models has further fueled the need for functional and ergonomic office furniture, with particular growth in categories like office chairs and desks.
Despite challenges posed by economic disruptions, the sector is expected to continue its upward trajectory, driven by innovation and a focus on optimizing workspaces for flexibility and comfort.
FAQs
The primary factors driving the growth of the office furniture market include the rise of remote and hybrid work models, increasing demand for ergonomic and comfortable furniture, and the expansion of co-working spaces. Additionally, the need for aesthetically pleasing, functional workspaces and advancements in furniture design and materials are contributing to market growth.
The COVID-19 pandemic accelerated the adoption of remote work, leading to a surge in demand for home office furniture, particularly office chairs, desks, and storage solutions. In the long term, the shift towards hybrid work models has continued to drive demand for flexible, ergonomic office furniture both for home and office settings.
The most popular types of office furniture include office chairs, desks, filing cabinets, storage cabinets, bookcases, and ergonomic accessories such as standing desks and laptop stands. Office chairs and desks remain the highest priorities for consumers, particularly those working from home.
The future of the office furniture market is expected to be shaped by continued demand for flexible, ergonomic, and sustainable products. With more companies embracing hybrid work models, the market will likely see sustained growth in home office furniture. Additionally, innovations in furniture design, materials, and functionality will continue to meet the evolving needs of modern workspaces.
Popular trends include minimalistic and modular designs that promote flexibility, the use of sustainable and eco-friendly materials, ergonomic furniture to improve comfort and health, and multi-functional furniture that maximizes space. Additionally, companies are increasingly focusing on creating collaborative and aesthetically pleasing office environments.
Discuss your needs with our analyst
Please share your requirements with more details so our analyst can check if they can solve your problem(s)


