Table of Contents
- Introduction
- Editor’s Choice
- Global Athletic Footwear Industry Statistics
- Running Footwear Market Overview
- Running Shoes Market Overview
- Footwear and Running Shoes Sales Statistics – By Brand
- Consumer Demographics
- Consumer Preferences and Trends
- Price Trends for Various Types of Running Shoes
- Benefits and Advantages
- Concerns and Challenges
- Developments and Trends
- Recent Developments
- Conclusion
- FAQs
Introduction
Running Shoes Statistics: The running shoes market encompasses specialized footwear designed to enhance performance and minimize injury for runners.
Segmented by type (road, trail, and cross-training), material (mesh, synthetic, foam), and end-user (men, women, kids).
Driven by health and fitness trends, technological advancements, and increasing demand for customization. The market faces challenges such as intense competition and sustainability concerns. Major players include Nike, Adidas, ASICS, New Balance, and Puma.
Overall, the market is poised for steady growth, supported by rising participation in running events and the expansion of lifestyle footwear, with a focus on innovation and eco-friendly practices.
Editor’s Choice
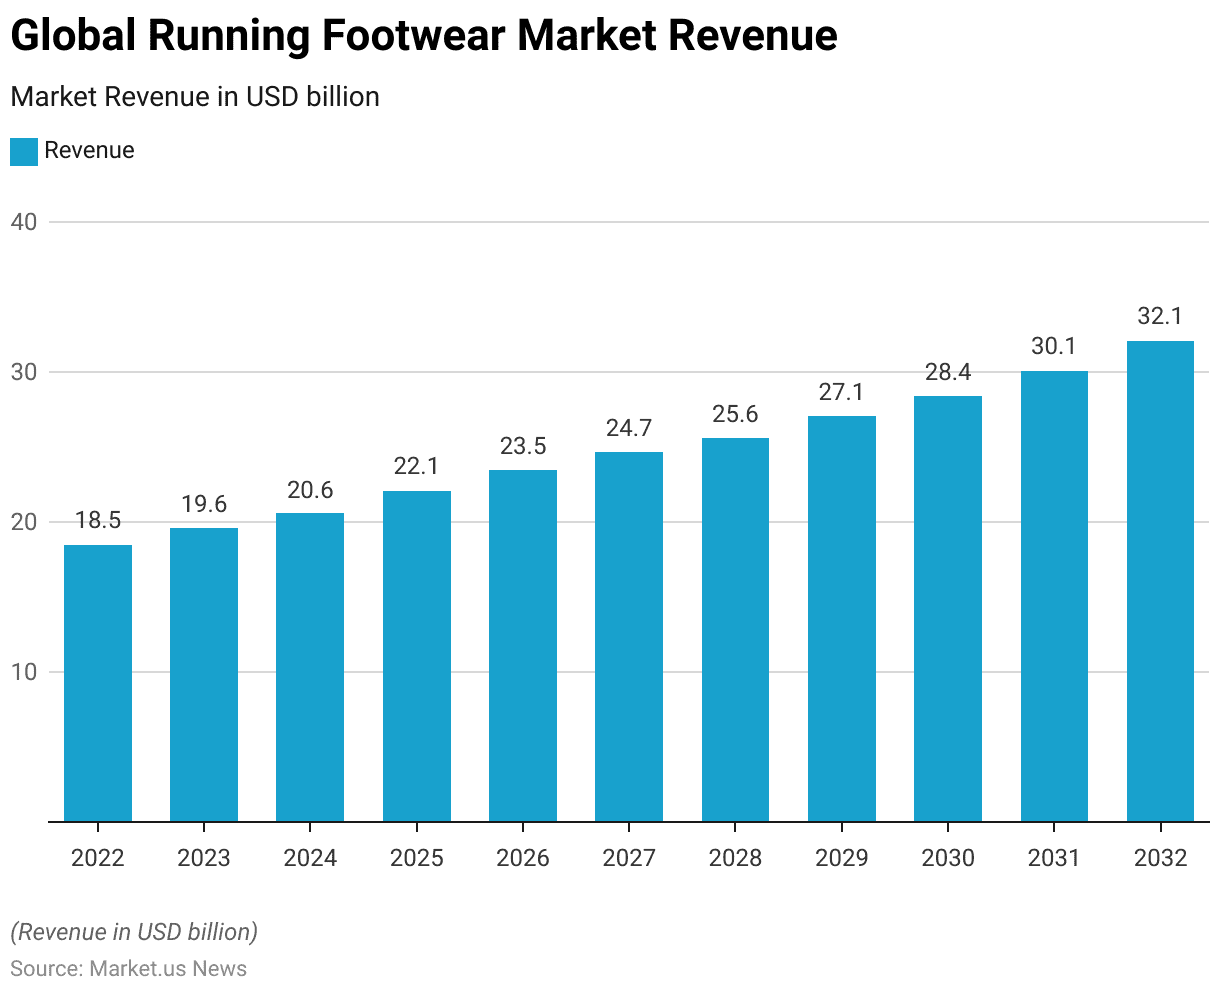
- The global running footwear market revenue is forecasted to reach $32.1 billion by 2032.
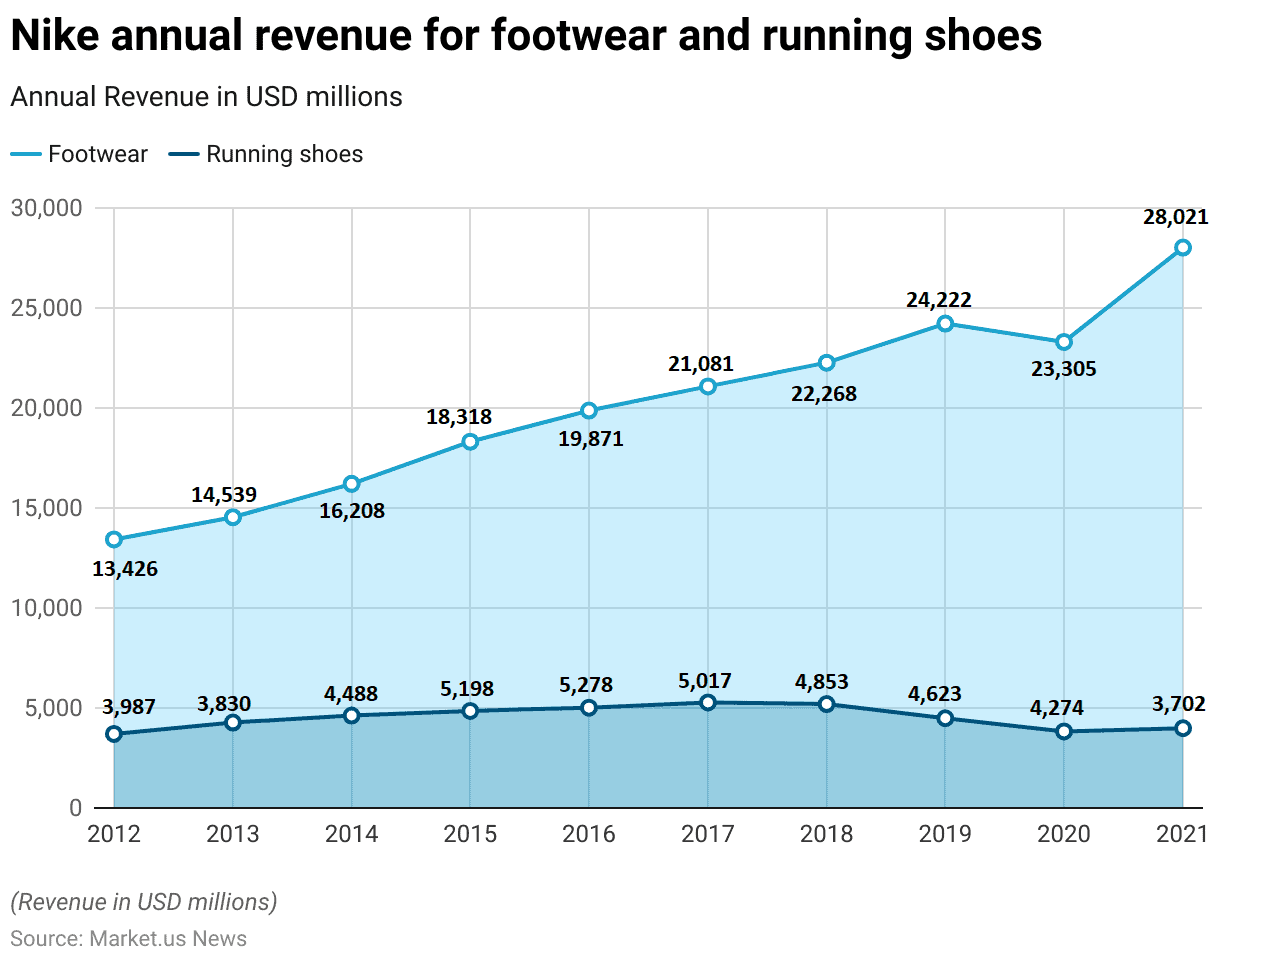
- The year 2020 witnessed a dip, with Nike footwear revenue at $23,305 million and running shoes at $3,830 million, likely due to market conditions influenced by global events.
- In a 2017 global survey examining factors that influence consumer choices when purchasing running shoes. Technical characteristics emerged as the most significant, with 34.40% of respondents citing this factor.
- In a survey regarding favorite running shoe brands, respondents showed diverse preferences, highlighting the competitive nature of the market. Asics emerged as the leading choice with 16% of the vote.
- In 2017, a survey regarding the diversity of running shoe brands owned by consumers worldwide revealed varied preferences. A significant proportion of respondents, 34.41%, reported owning running shoes from only one brand. Suggesting strong brand loyalty or satisfaction with their current choice.
- In 2017, a survey exploring the spending habits of consumers on running shoes worldwide revealed varied expenditure ranges. The majority of respondents, 25%, reported spending between $101 and $120 on their last pair of running shoes. Indicating a preference for mid-range priced footwear.
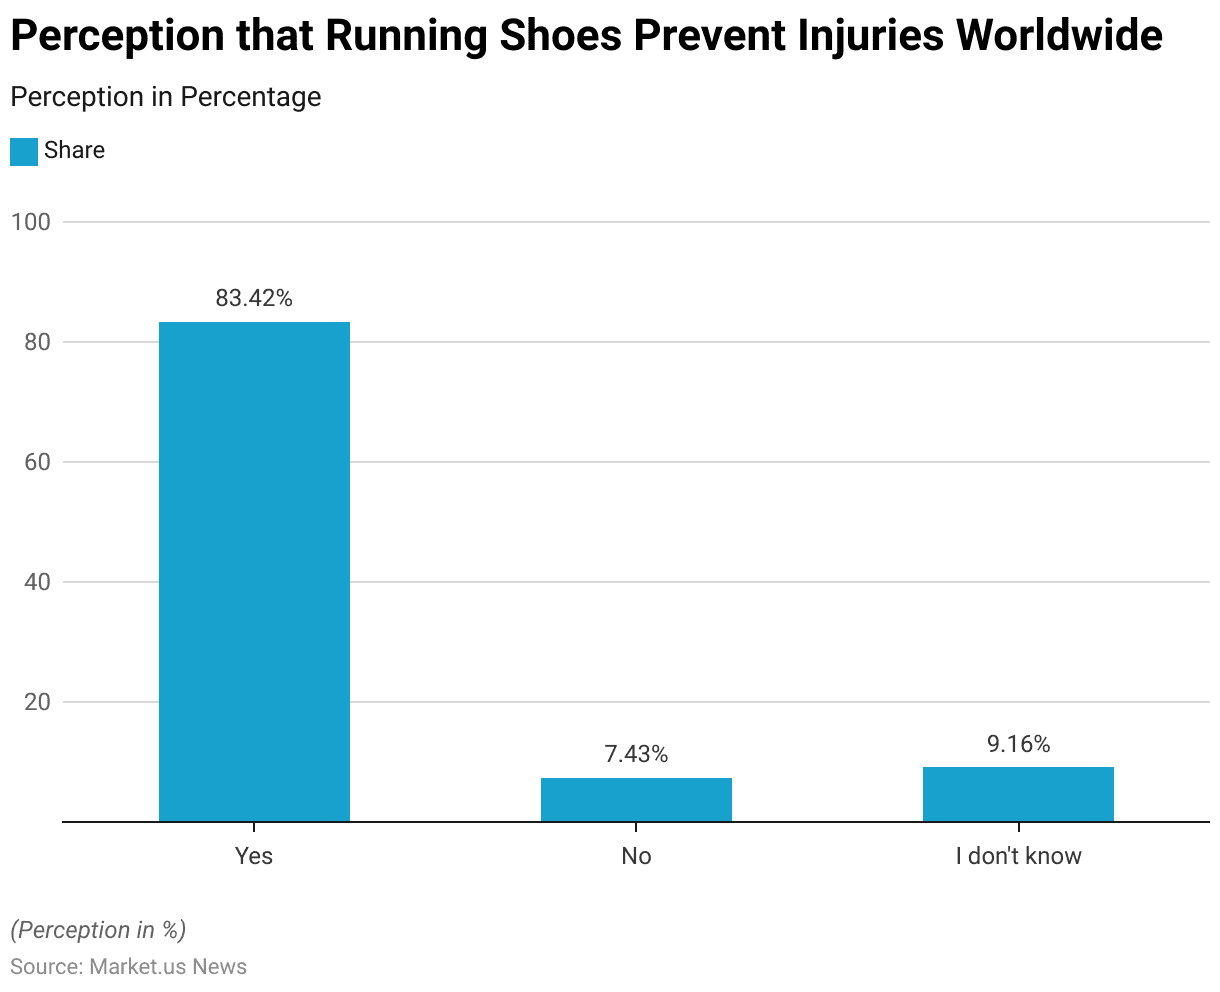
- In 2017, a survey on the perception that running shoes can prevent injuries showed that a significant majority of respondents worldwide, 83.42%. Believe that certain running shoes can prevent injuries.
- A notable innovation is from Skechers, which has developed the Maxroad 6 with an all-new Hyper Burst Ice midsole designed for enhanced comfort and performance. Particularly noted for its increased cushioning and improved durability of the upper.
Global Athletic Footwear Industry Statistics
Revenue of the Global Athletic Footwear Industry
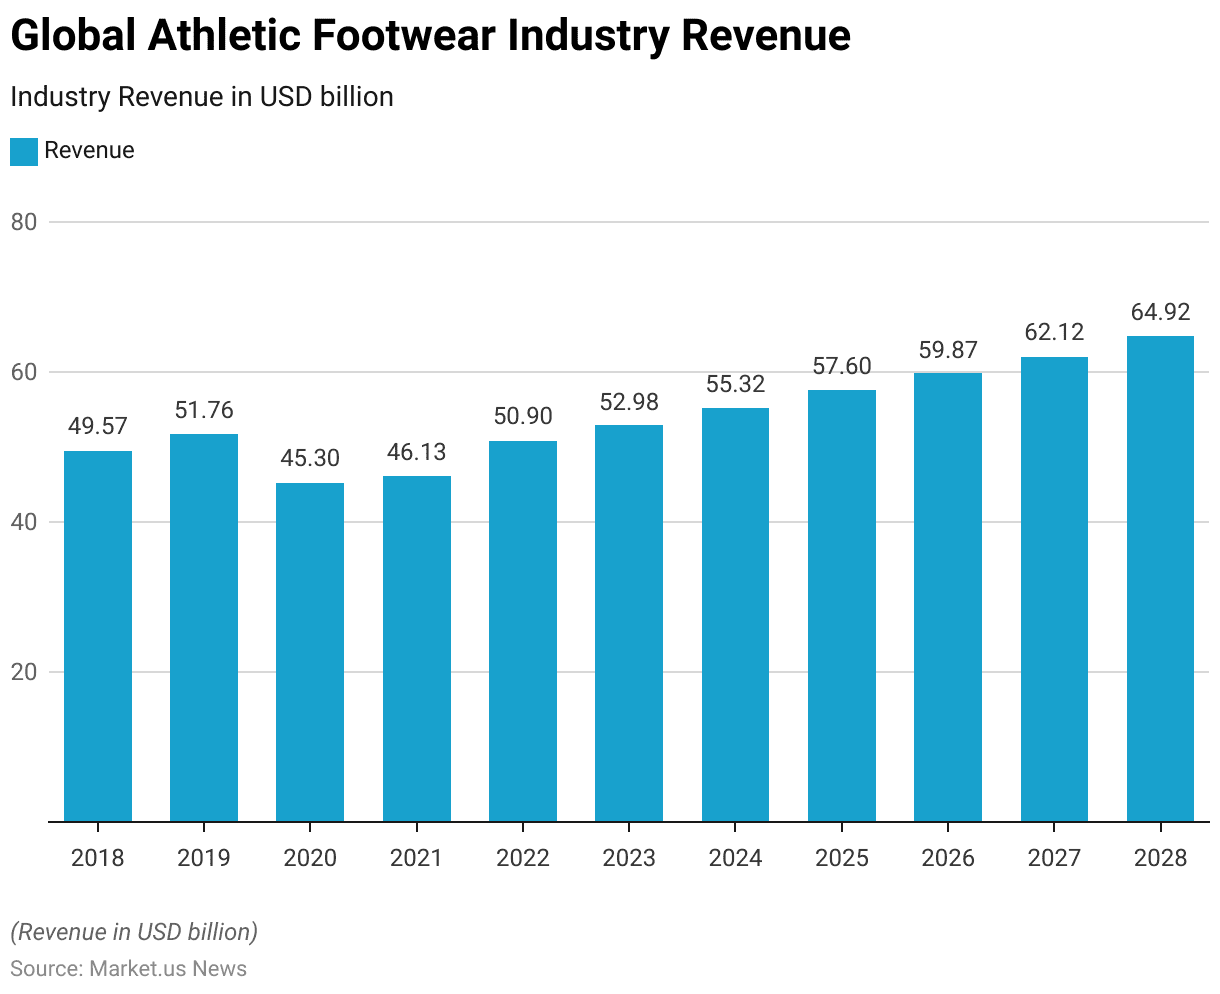
- The global athletic footwear industry has exhibited fluctuating revenue patterns from 2018 to 2028.
- Starting with a revenue of $49.57 billion in 2018, the industry saw an increase to $51.76 billion in 2019.
- However, there was a notable decline in 2020 when revenues fell to $45.30 billion, likely impacted by global economic conditions.
- A slight recovery was observed in 2021, with revenues rising to $46.13 billion.
- The upward trend resumed in 2022, with revenues increasing to $50.90 billion, and continued growth is expected in the subsequent years.
- By 2023, revenues are forecasted to reach $52.98 billion and further to $55.32 billion in 2024.
- The industry is projected to maintain this growth, with revenues anticipated to be $57.60 billion in 2025, $59.87 billion in 2026, $62.12 billion in 2027, and $64.92 billion by 2028.
- This growth trajectory highlights the industry’s resilience and ongoing adaptation to market demands and consumer preferences.
(Source: Statista)
Athletic Footwear Market Share Worldwide – By Region
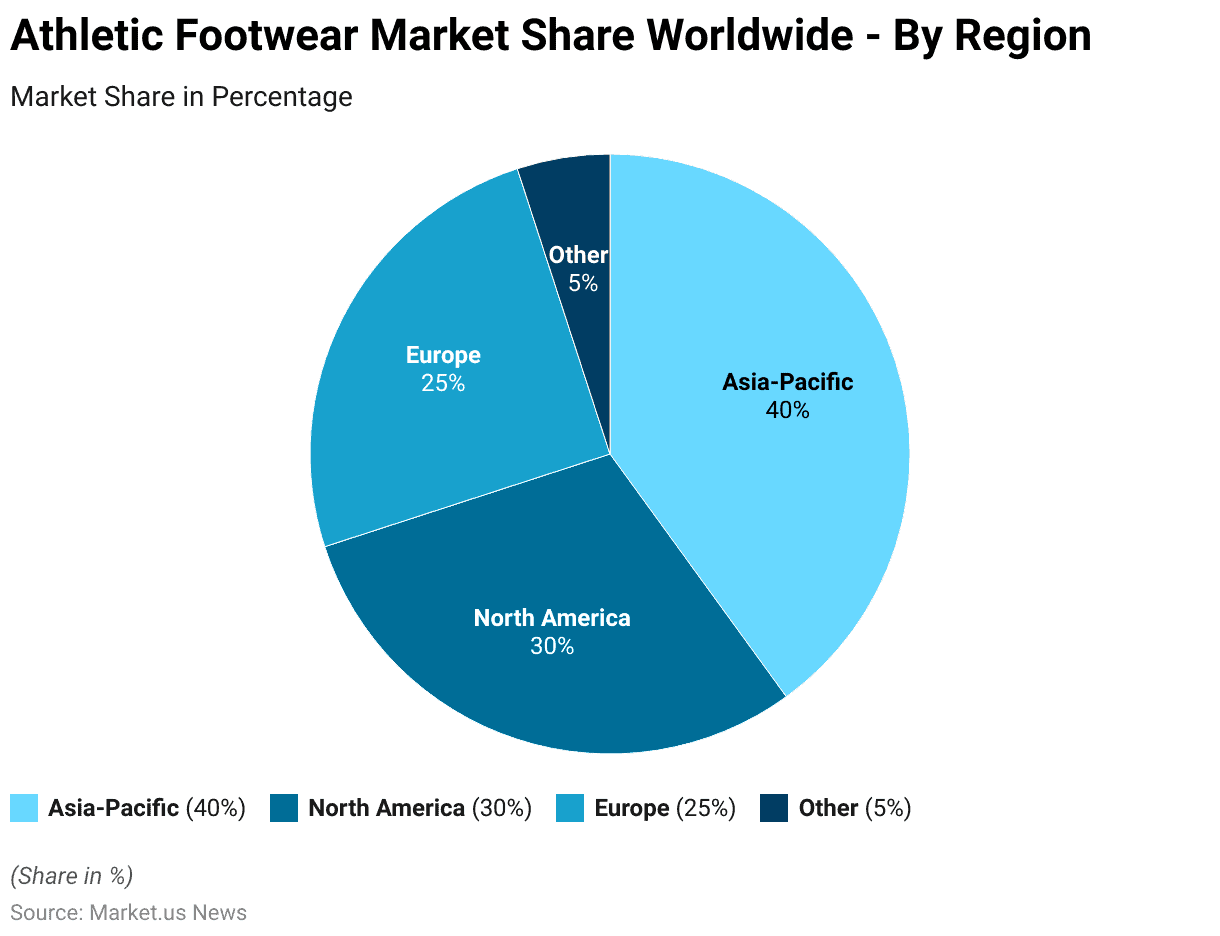
- In 2020, the global athletic footwear market share was notably dominated by the Asia-Pacific region, which held 40% of the market.
- North America followed with a significant 30% share, while Europe accounted for 25% of the market.
- Other regions combined contributed a smaller portion, making up 5% of the market share.
- This distribution underscores the strong market presence and consumer demand within Asia-Pacific and highlights North America and Europe as key players in the athletic footwear industry.
(Source: Statista)
Revenue of the Athletic Footwear Market Worldwide – By Country
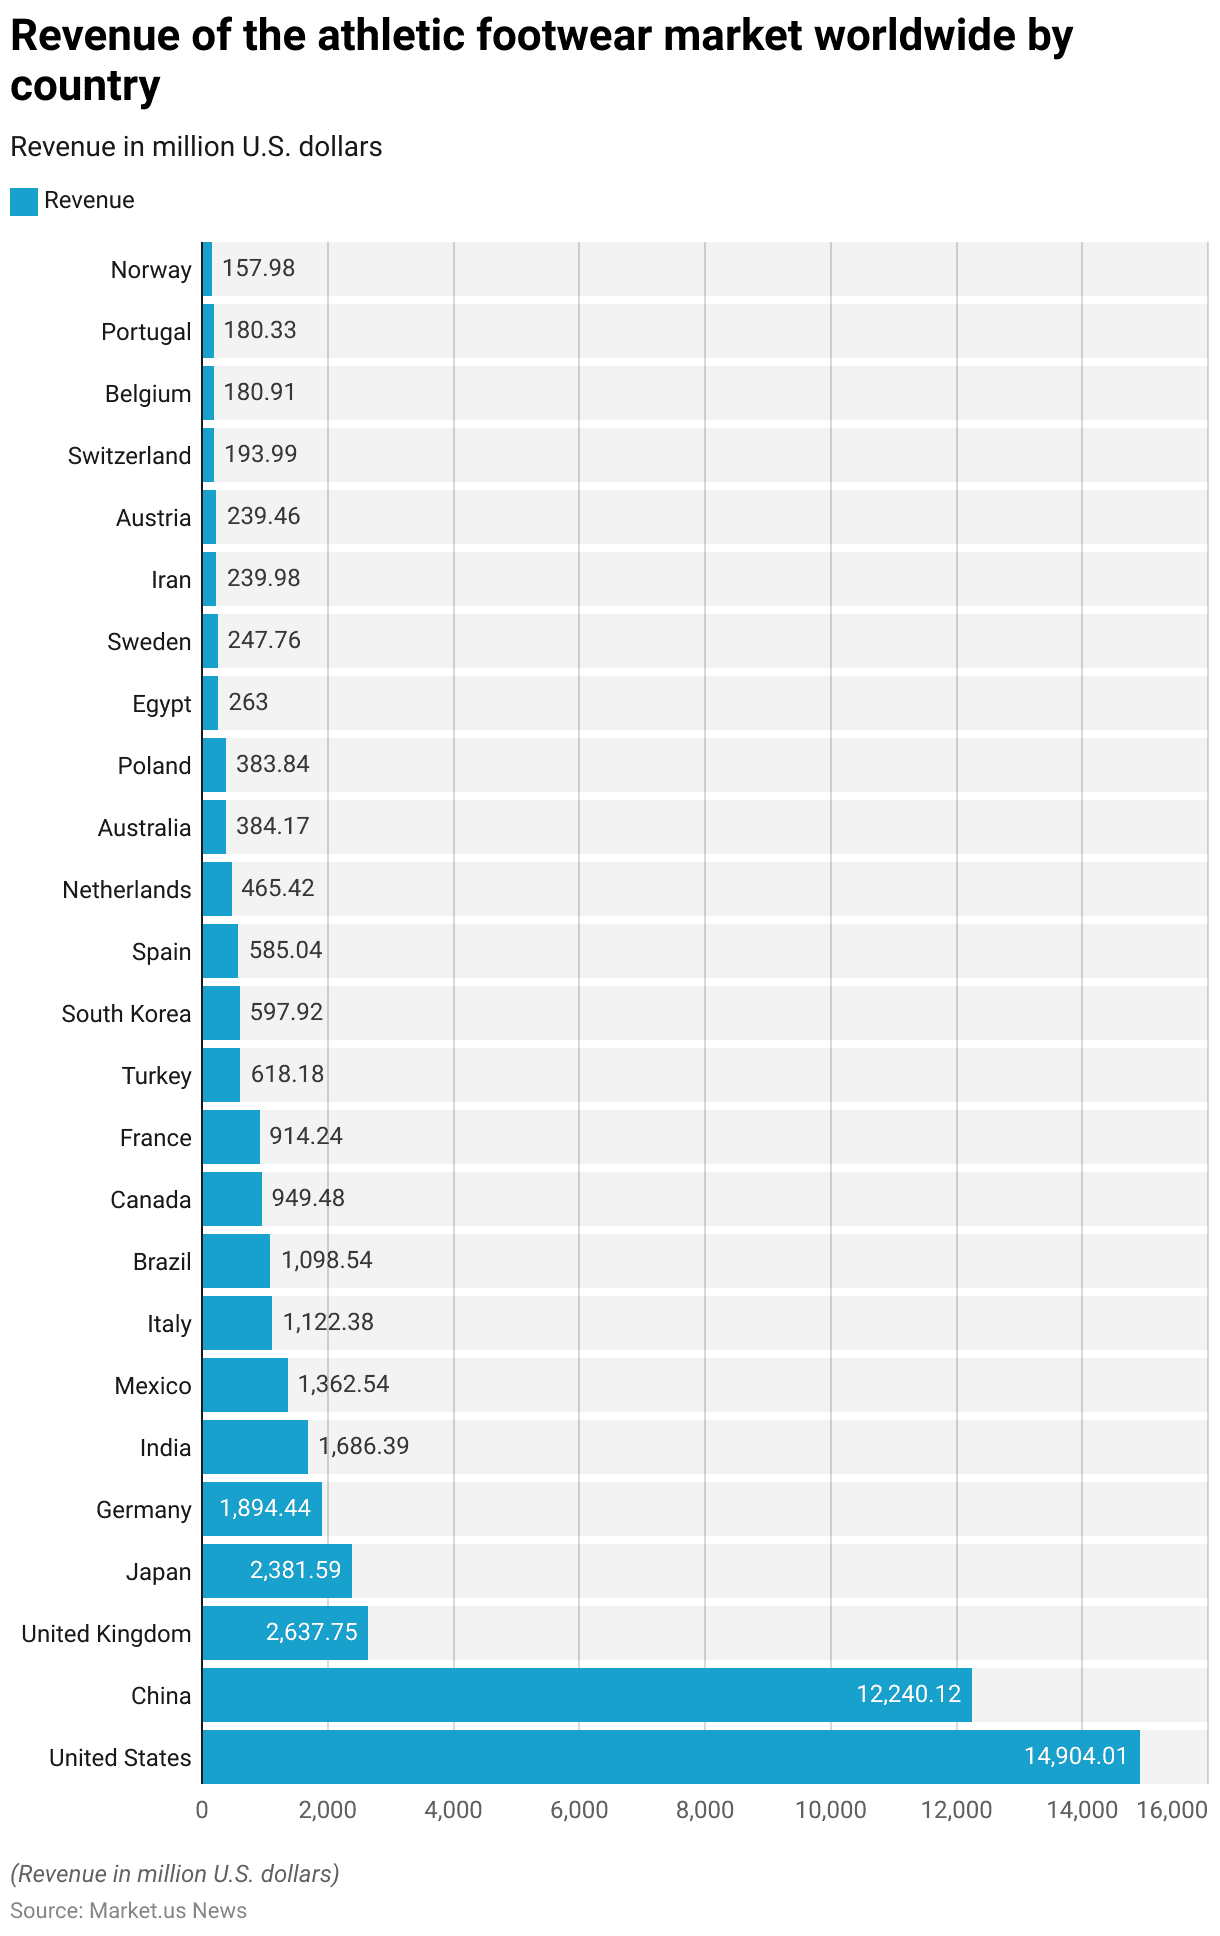
- In 2023, the revenue distribution in the global athletic footwear market varied significantly by country.
- The United States led with a substantial revenue of $14,904.01 million. Closely followed by China, which generated $12,240.12 million.
- The United Kingdom and Japan also held significant shares, with revenues of $2,637.75 million and $2,381.59 million, respectively.
- Germany and India contributed $1,894.44 million and $1,686.39 million, respectively. While Mexico and Italy generated $1,362.54 million and $1,122.38 million, respectively.
- Brazil’s market size was slightly less but still substantial at $1,098.54 million.
- Other notable contributions came from Canada and France, with revenues of $949.48 million and $914.24 million, respectively.
- Smaller yet significant markets included Turkey, South Korea, and Spain. With revenues of $618.18 million, $597.92 million, and $585.04 million, respectively.
- Additional contributions came from the Netherlands, Australia, and Poland, among others. Demonstrating a diverse and robust global demand for athletic footwear.
(Source: Statista)
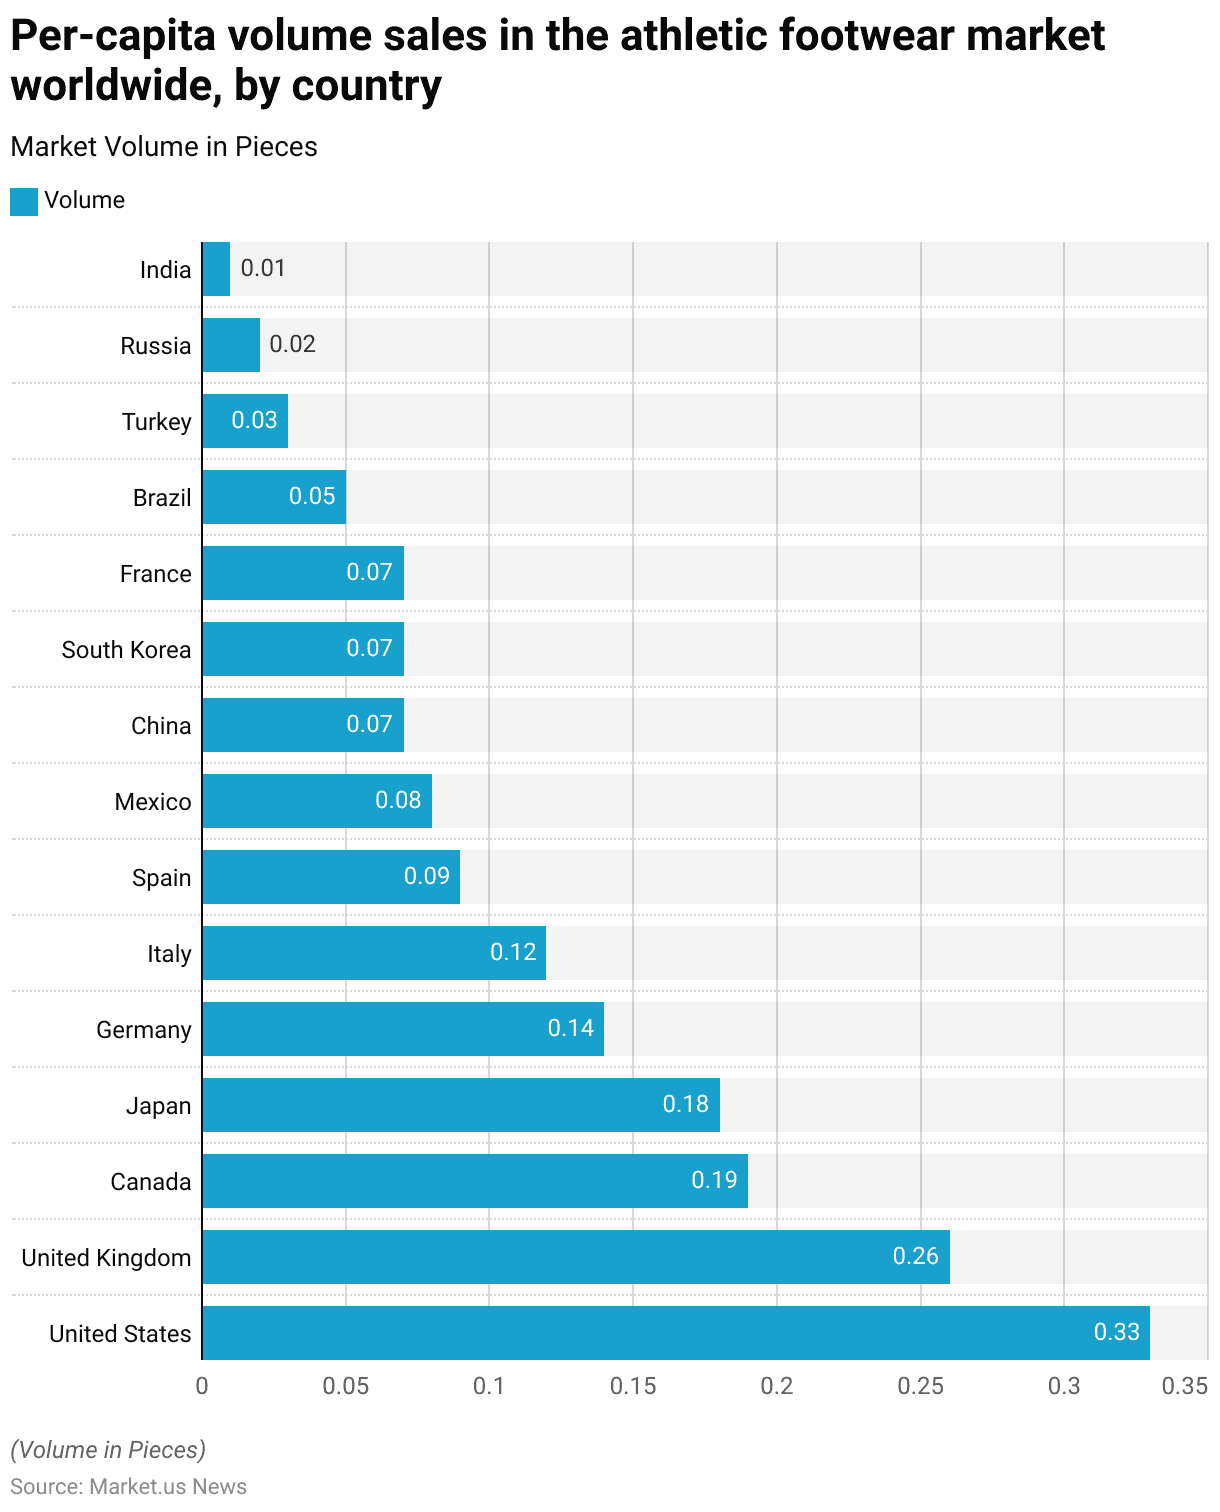
Per-capita Volume Sales in the Athletic Footwear Market Worldwide – By Country
- In 2023, per-capita volume sales in the athletic footwear market varied significantly across different countries.
- The United States led with the highest per-capita sales, averaging 0.33 pieces per person.
- This was followed by the United Kingdom, where the per-capita sales stood at 0.26 pieces.
- Canada and Japan also showed notable per-capita sales with 0.19 and 0.18 pieces, respectively.
- Germany and Italy recorded per-capita sales of 0.14 and 0.12 pieces, respectively. While Spain and Mexico followed with 0.09 and 0.08 pieces.
- China, South Korea, and France each reported per-capita sales of 0.07 pieces, indicating moderate market engagement compared to other countries.
- Lower per-capita sales were observed in Brazil at 0.05 pieces, and Turkey at 0.03 pieces. Russia at 0.02 pieces, and India, which had the lowest, at 0.01 pieces per person.
- These figures illustrate a diverse global landscape in athletic footwear consumption based on per-capita sales.
(Source: Statista)
Running Footwear Market Overview
Global Running Footwear Market Size
- The global running footwear market is forecasted to exhibit a progressive increase in revenue from 2022 through 2032.
- Starting in 2022, the market size was valued at $18.5 billion and is expected to rise to $19.6 billion in 2023.
- The upward trend continues, with revenues projected to reach $20.6 billion in 2024. Further increasing to $22.1 billion by 2025.
- The growth momentum is anticipated to carry on. Market revenue is expected to climb to $23.5 billion in 2026, $24.7 billion in 2027, and $25.6 billion in 2028.
- The market is projected to expand further, reaching $27.1 billion by 2029 and $28.4 billion by 2030.
- The growth trajectory remains strong in the subsequent years. With revenues forecasted to reach $30.1 billion in 2031 and $32.1 billion by 2032.
- This consistent growth reflects the increasing consumer interest in running as a fitness activity and advancements in footwear technology.
Running Shoes Market Overview
Global Running Shoes Market Size
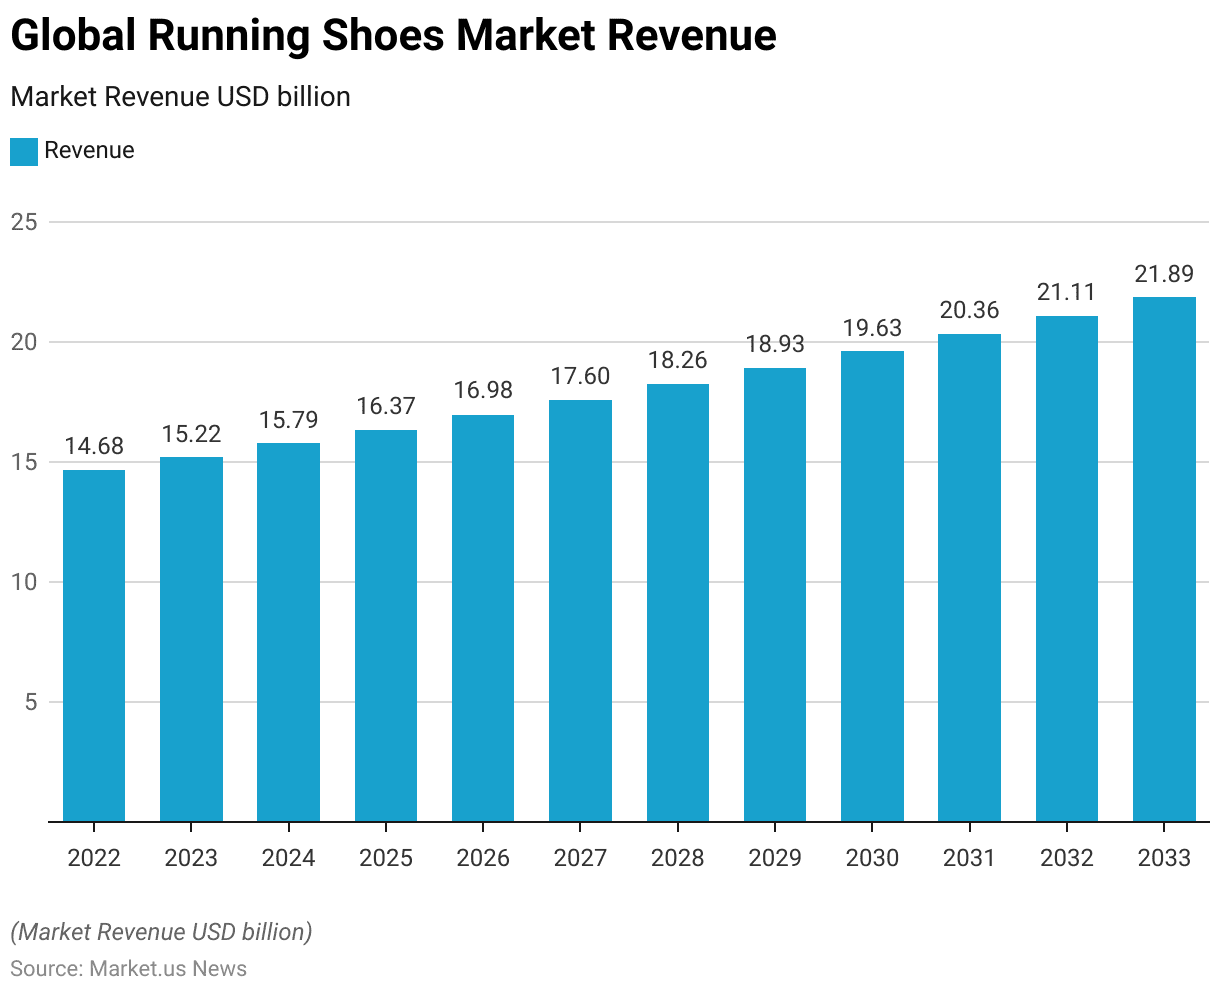
- The global running shoes market is projected to experience a steady growth trajectory from 2022 to 2033 at a CAGR of 3.7%.
- In 2022, the market revenue was estimated at $14.68 billion.
- This figure is expected to rise to $15.22 billion in 2023, reflecting an increase as the market responds to evolving consumer demand and trends in physical fitness.
- By 2024, the revenue is forecasted to reach $15.79 billion, followed by a consistent upward trend with revenues of $16.37 billion in 2025, $16.98 billion in 2026, and $17.60 billion in 2027.
- The growth pattern continues, with the market achieving $18.26 billion in 2028, $18.93 billion in 2029, and progressing to $19.63 billion by 2030.
- The upward trajectory is expected to sustain, with market revenues projected at $20.36 billion in 2031, $21.11 billion in 2032, and finally reaching $21.89 billion by 2033.
- This growth can be attributed to the increasing awareness of health benefits associated with running and advancements in running shoe technology.
(Source: market.us)
Footwear and Running Shoes Sales Statistics – By Brand
Nike Running Shoe Revenue
- Nike’s annual revenue from its footwear and running shoes segments has shown notable growth over the past decade.
- In 2012, the company reported $13,426 million in footwear revenue and $3,702 million from running shoes.
- Revenue from running shoes experienced growth, peaking in 2017 at $5,278 million, alongside footwear revenue of $21,081 million.
- The highest footwear revenue was achieved in 2021, amounting to $28,021 million, with running shoes contributing $3,987 million.
- Despite fluctuations, such as a dip in 2020, where footwear revenue was $23,305 million and running shoes brought in $3,830 million, the overall trend has been upward.
- The year 2018 saw $22,268 million from footwear and a substantial $5,198 million from running shoes, highlighting a strong performance, particularly in the running segment.
- The year 2020 witnessed a dip, with footwear revenue at $23,305 million and running shoes at $3,830 million, likely due to market conditions influenced by global events.
- This growth trajectory underscores Nike’s robust position in the athletic footwear market and its ability to adapt to consumer demands and market trends.
(Source: Nike)
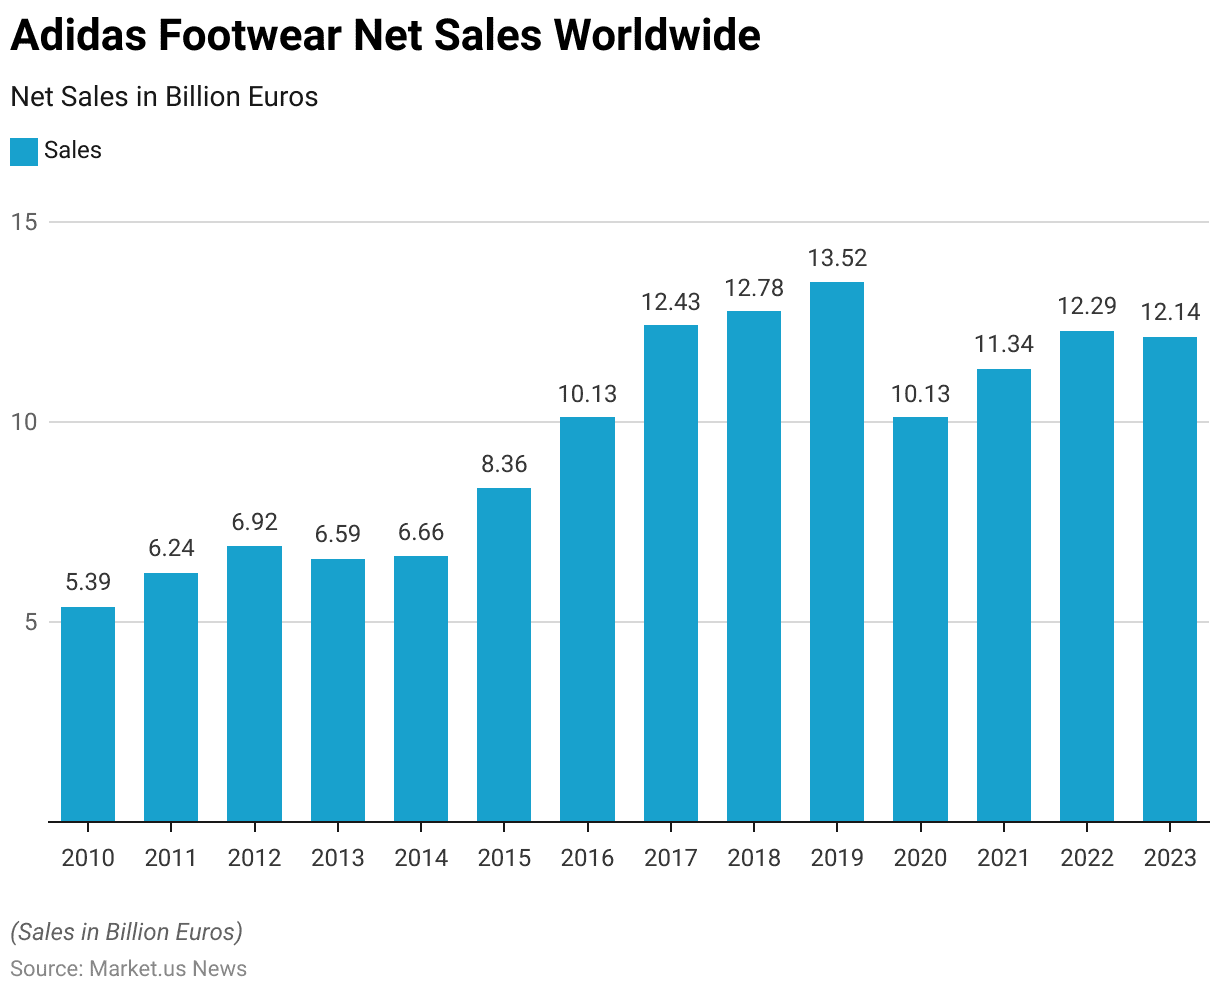
Adidas Footwear Net Sales Worldwide
- From 2010 to 2023, Adidas observed a general upward trend in its footwear net sales worldwide, albeit with some fluctuations.
- Starting in 2010 with sales of €5.39 billion, there was a steady increase over the following years, reaching €6.92 billion by 2012.
- A slight dip occurred in 2013, bringing sales down to €6.59 billion, but this was quickly recovered in the subsequent years.
- By 2015, sales had surged to €8.36 billion, marking a significant growth phase, which continued as sales climbed to €10.13 billion in 2016 and further to €12.43 billion in 2017.
- Sales peaked in 2019 at €13.52 billion before experiencing a downturn in 2020, likely impacted by global economic conditions, dropping to €10.13 billion.
- A recovery phase began in 2021, with sales increasing to €11.34 billion, followed by €12.29 billion in 2022, and slightly adjusting to €12.14 billion in 2023.
- This trajectory highlights Adidas’ resilience and ability to navigate through varying market conditions over the years.
(Source: Statista)
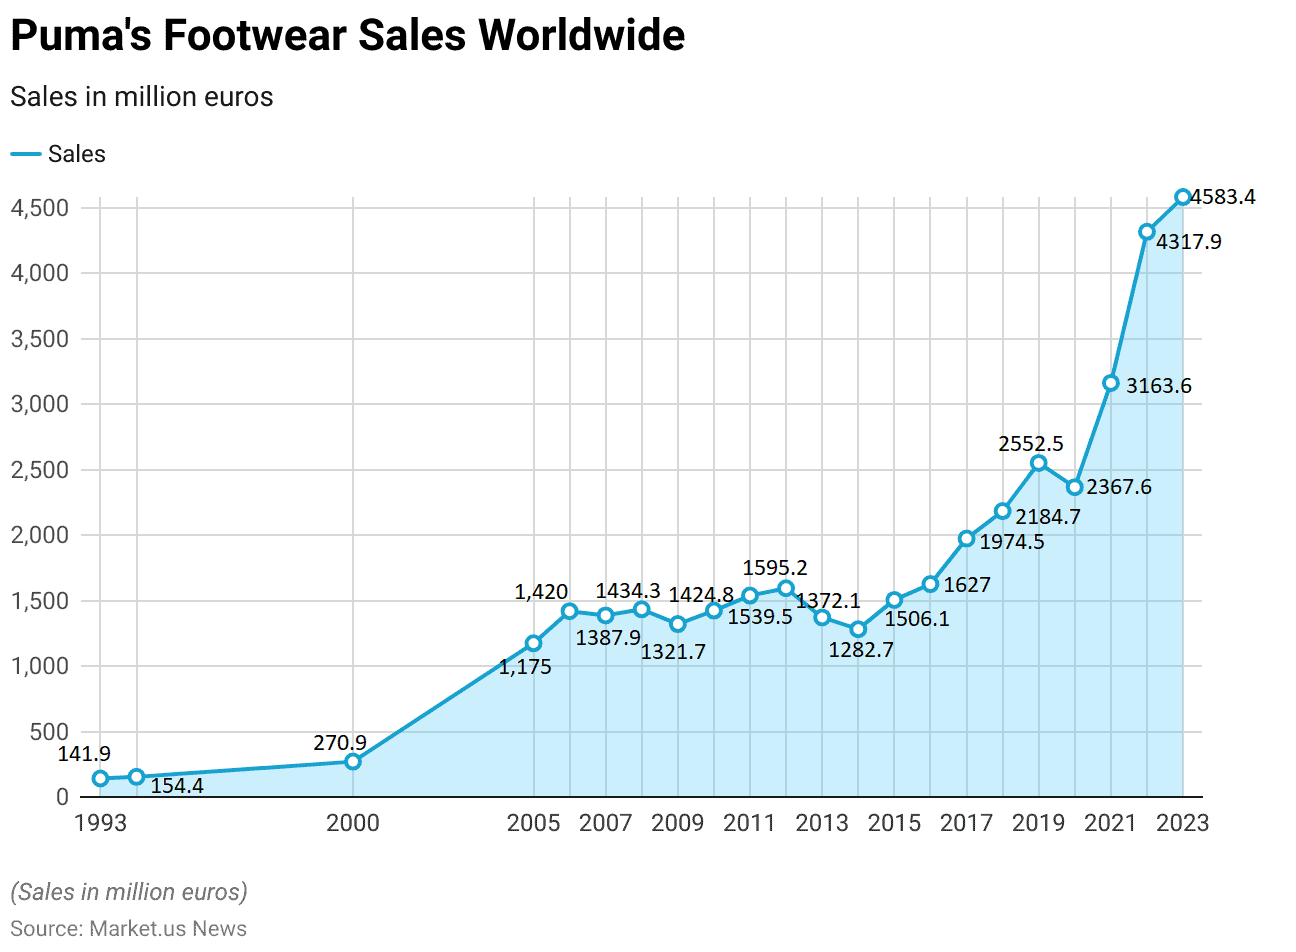
Puma’s Footwear Sales Worldwide
- Puma’s global footwear sales have shown a remarkable growth trajectory from 1993 to 2023, demonstrating the brand’s increasing market presence.
- Starting in 1993 with sales of €141.9 million, there was a gradual increase in sales, reaching €154.4 million in 1994 and further to €270.9 million by the year 2000.
- A significant growth was observed by 2005, with sales soaring to €1,175 million. The upward trend continued through the next years, achieving €1,420 million in 2006 and slightly dipping to €1,387.9 million in 2007.
- The sales fluctuated slightly over the following years, peaking at €1,434.3 million in 2008 and then dropping to €1,321.7 million in 2009 during the global financial crisis. However, recovery was evident as sales climbed to €1,539.5 million by 2011 and reached €1,595.2 million in 2012.
- After a slight decline in 2013 and 2014, with sales at €1,372.1 million and €1,282.7 million, respectively, there was a rebound to €1,506.1 million in 2015.
- The momentum continued with a steady increase, culminating in €1,974.5 million in 2017, €2,184.7 million in 2018, and a significant rise to €2,552.5 million in 2019.
- Despite a slight contraction in 2020 with €2,367.6 million, the subsequent years saw remarkable increases, reaching €3,163.6 million in 2021, a substantial jump to €4,317.9 million in 2022, and an impressive peak of €4,583.4 million in 2023.
- This growth pattern reflects Puma’s solid market expansion and adaptation to changing consumer preferences over the decades.
(Source: Statista)
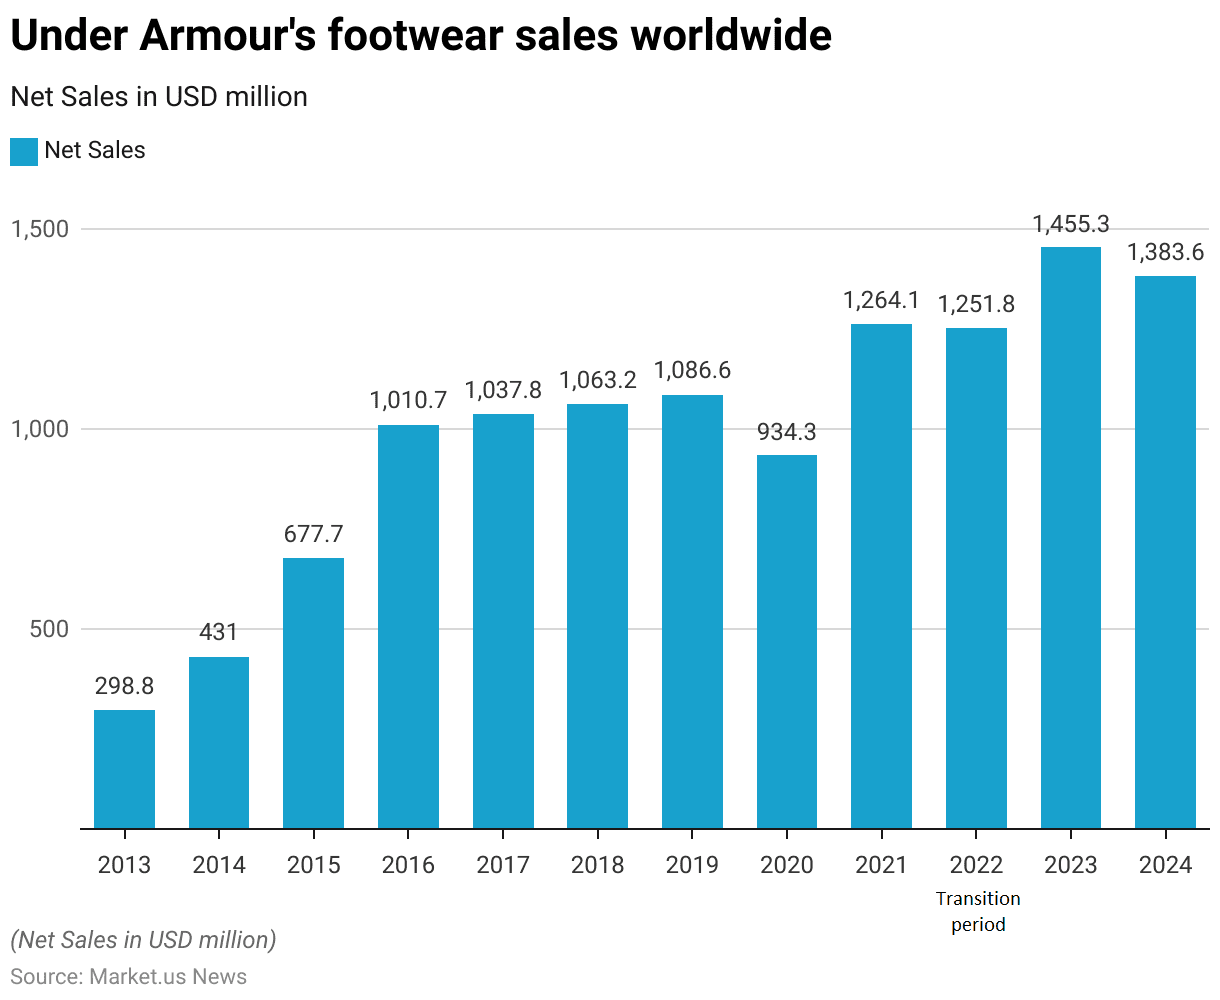
Under Armour’s Footwear Sales Worldwide
- Under Armour’s global footwear sales have shown significant growth and fluctuations from 2013 to 2024. In 2013, the company recorded net sales of $298.83 million.
- This figure grew steadily over the following years, reaching $430.99 million in 2014 and further increasing to $677.74 million in 2015.
- A remarkable growth was seen in 2016, with sales surpassing the billion-dollar mark at $1,010.69 million. This upward trajectory continued slightly in 2017 and 2018, with sales figures of $1,037.84 million and $1,063.18 million, respectively.
- In 2019, sales peaked at $1,086.55 million before experiencing a dip in 2020 to $934.33 million, likely influenced by global economic conditions. The rebound was strong in 2021, with sales reaching $1,264.13 million.
- During a transition period in 2022, sales slightly decreased to $1,251.78 million. However, in 2023, a significant increase was observed, with sales climbing to $1,455.27 million.
- The forecast for 2024 shows a slight reduction to $1,383.61 million, suggesting adjustments in market dynamics or strategic responses to external market factors.
- This data reflects Under Armour’s resilience and ability to navigate through varying economic landscapes while growing its footprint in the global athletic footwear market.
(Source: Statista)
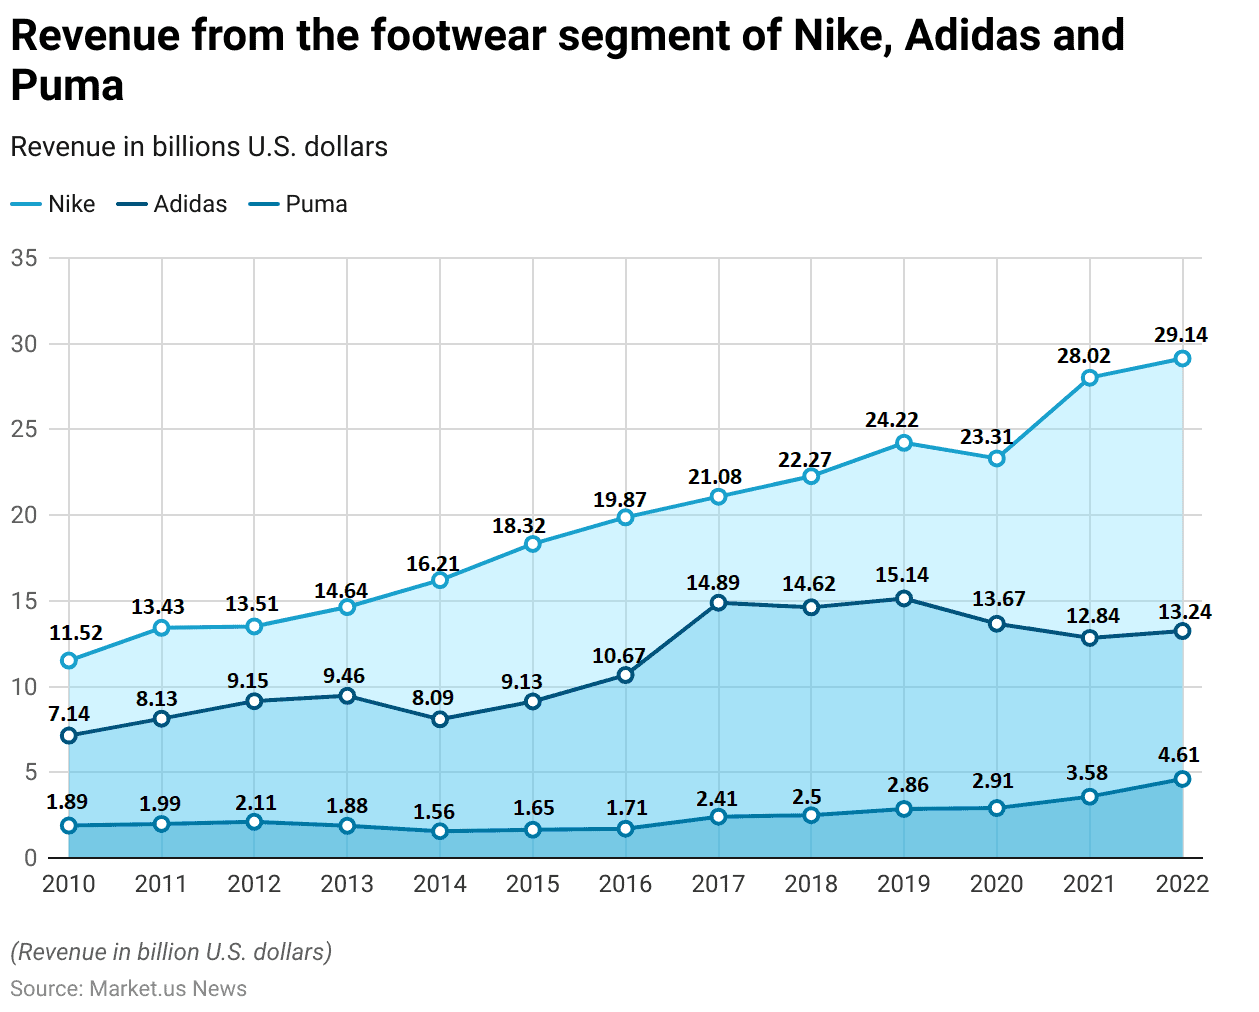
Comparative Analysis of Revenue from Footwear Segment of Nike, Adidas, and Puma
- From 2010 to 2022, the revenue from the footwear segment for Nike, Adidas, and Puma demonstrated distinctive trends, reflecting varying market dynamics and brand growth.
- In 2010, Nike’s revenue stood at $11.52 billion, Adidas at $7.14 billion, and Puma at $1.89 billion. Over the years, Nike showed a consistent increase in revenue, reaching $29.14 billion by 2022.
- Adidas also saw growth, although with some fluctuations, starting at $7.14 billion in 2010 and peaking at $15.14 billion in 2019 before slightly decreasing to $13.24 billion in 2022.
- Puma, while starting with the smallest base, exhibited a relatively steady growth, from $1.89 billion in 2010 to $4.61 billion in 2022, showing substantial gains, particularly in the latter years.
- This period highlights Nike’s dominance and continued expansion in the footwear market, Adidas’ fluctuating yet strong performance, and Puma’s gradual but consistent upward trajectory in revenue.
- Each brand’s progression illustrates different strategic responses to global market trends, consumer preferences, and possibly varying levels of investment in product innovation and marketing.
(Source: Statista)
Consumer Demographics
Age
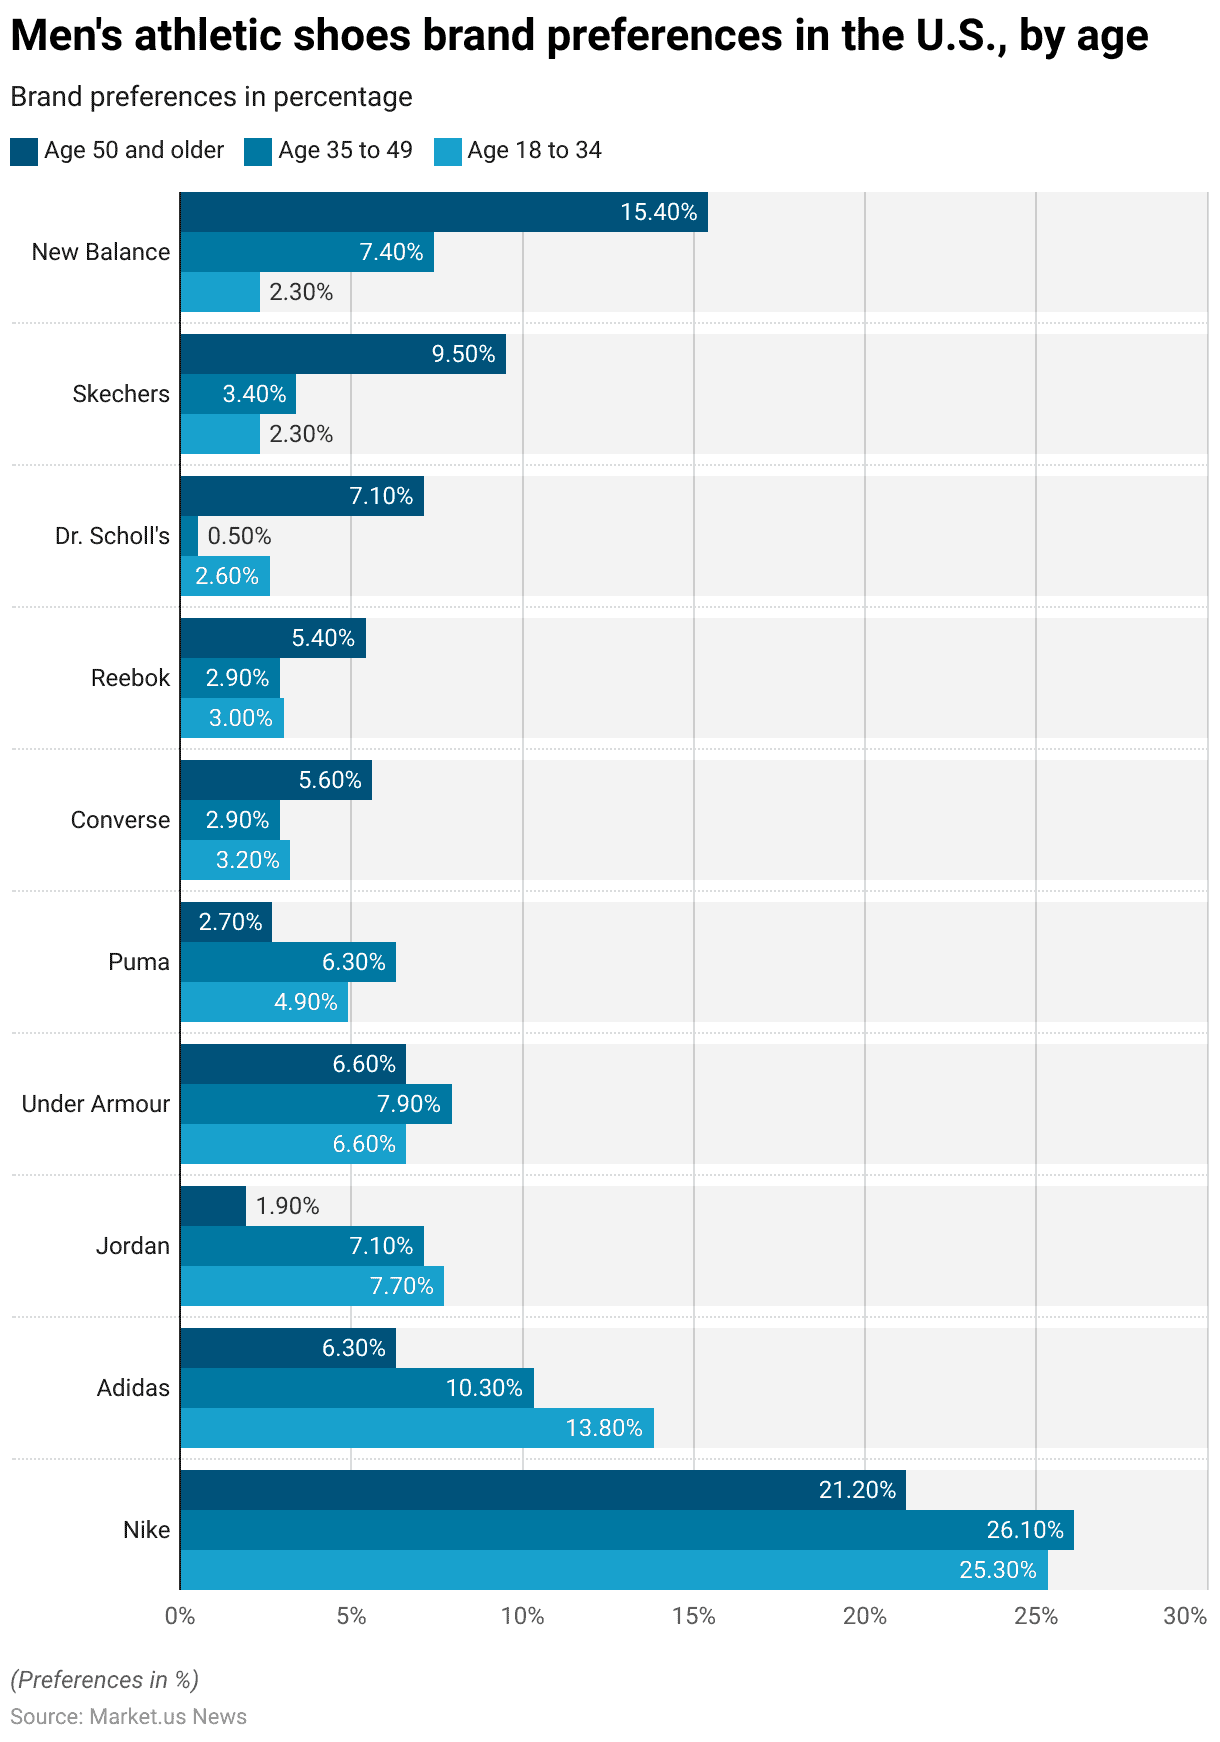
- During the period from October to December 2017, brand preferences for men’s athletic shoes in the United States showed distinct variations across different age groups.
- Nike was the most favored brand across all age brackets, capturing 21.20% of the preference among those aged 50 and older, 26.10% among those aged 35 to 49, and 25.30% among those aged 18 to 34.
- Adidas followed, with its popularity increasing among younger demographics—6.30% for those 50 and older, 10.30% for the middle age group, and 13.80% for the youngest group surveyed. Jordan and Under Armour also displayed stronger preferences in the middle and younger groups compared to older consumers.
- Conversely, brands like Skechers and New Balance showed a reverse trend. Skechers were preferred by 9.50% of the oldest age group but only 2.30% of the youngest, while New Balance had a significant 15.40% preference among those over 50, but this sharply dropped to 2.30% among those aged 18 to 34.
- Other brands such as Puma, Converse, Reebok, and Dr Scholl’s had varied preferences across the age groups, indicating diverse tastes and possibly different considerations such as style, comfort, and brand loyalty influencing purchase decisions.
- Dr Scholl’s, for instance, saw a high preference of 7.10% among the oldest age group but was much less popular among the youngest at 2.60%, possibly reflecting the brand’s focus on comfort appealing more to older consumers.
- This data illustrates the significant impact of age on brand preferences within the U.S. market for men’s athletic shoes.
Generation
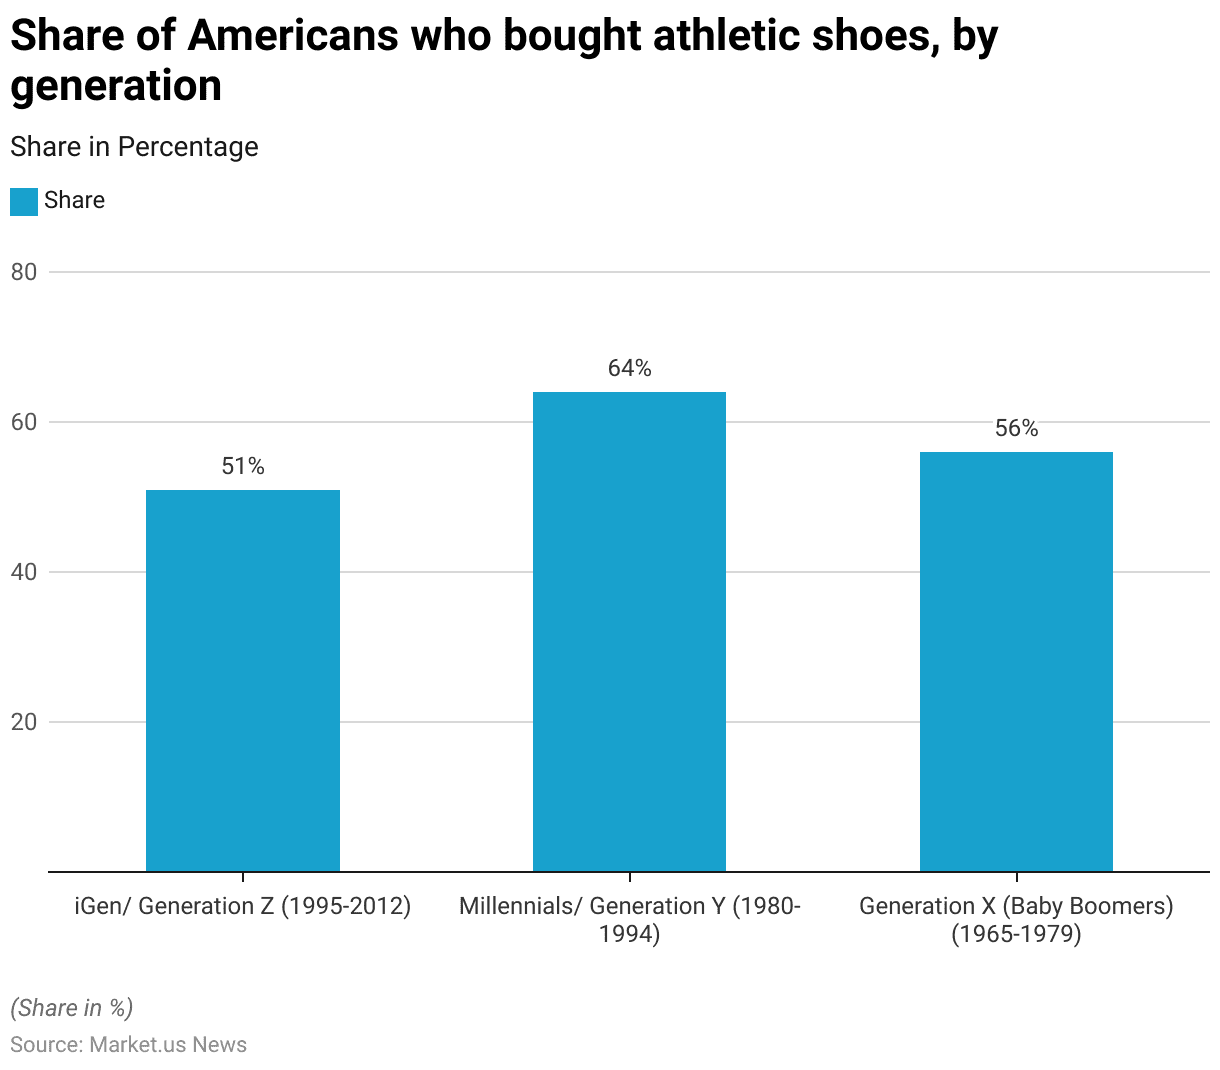
- In 2021, the purchasing patterns for athletic shoes across different generations in the United States demonstrated varied levels of engagement.
- Millennials, or Generation Y (born between 1980 and 1994), showed the highest propensity to buy athletic shoes within the last 24 months, with 64% of respondents indicating such purchases. This reflects a strong inclination towards fitness or casual athletic styling among this demographic.
- Generation X, slightly older, also showed a significant engagement, with 56% reporting purchases of athletic shoes, suggesting a sustained interest in active lifestyles or the utility of such footwear.
- The youngest demographic surveyed, iGen or Generation Z (born between 1995 and 2012), reported a slightly lower purchase rate at 51%, which might indicate varied interests or financial priorities among the youngest consumers.
- This data highlights generational differences in athletic footwear purchasing habits, emphasizing the influence of lifestyle, fashion, and possibly economic factors on consumer behavior in the U.S. market.
(Source: Statista)
Gender
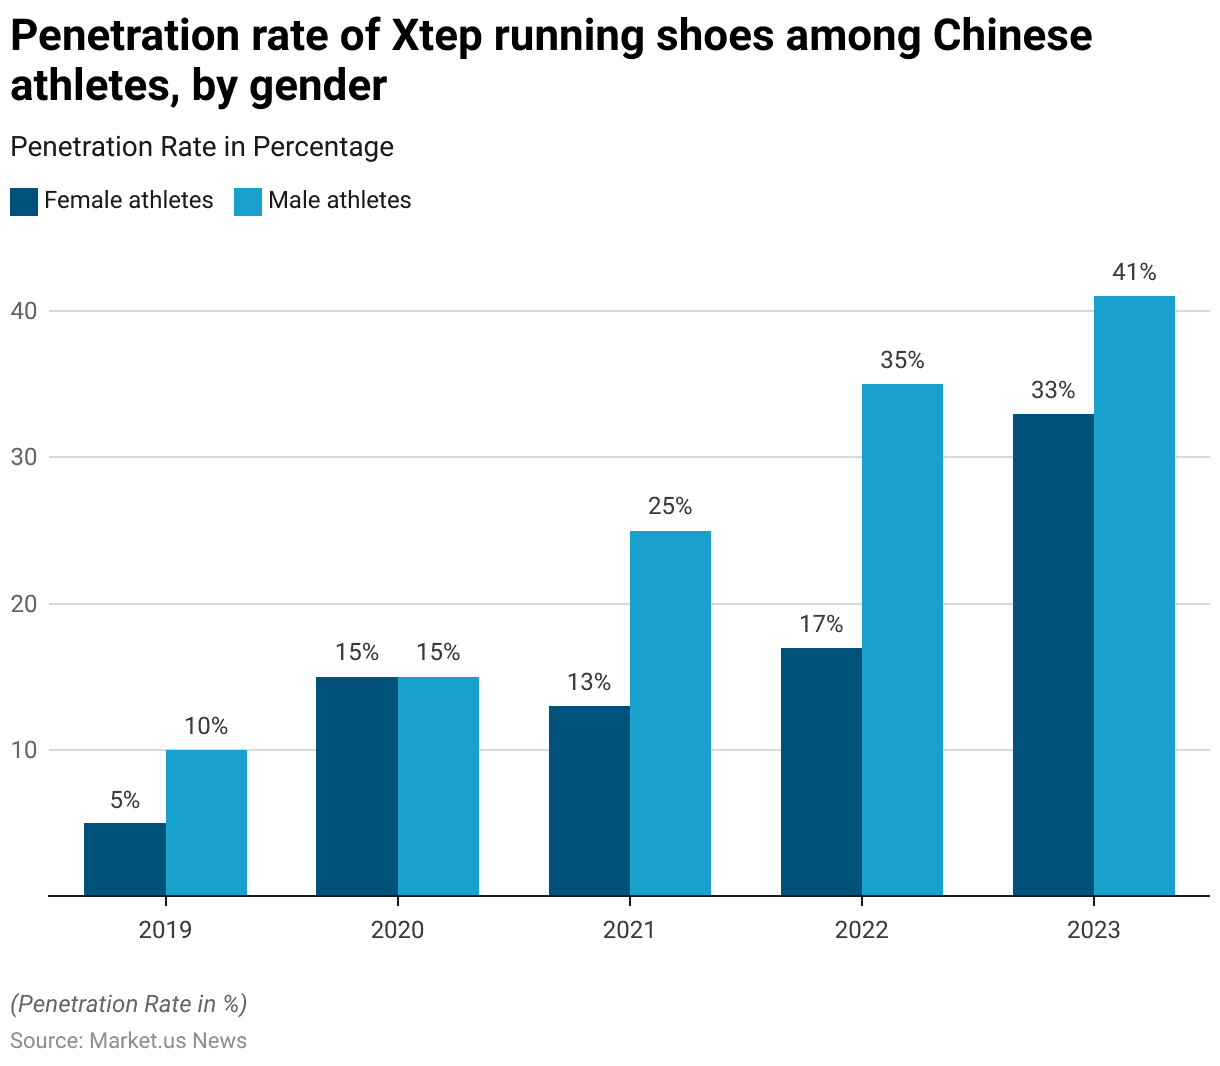
- From 2019 to 2023, the share of the top 100 running athletes in China who wore Xtep running shoes exhibited a notable upward trend for both male and female athletes, with males consistently ahead in adoption rates each year.
- In 2019, only 5% of female athletes and 10% of male athletes wore Xtep shoes. This figure grew significantly by 2020, reaching 15% for both genders.
- However, in 2021, the adoption rate among male athletes surged to 25%, while female athletes saw a slight decrease to 13%.
- The trend continued to diverge in 2022, with 35% of male athletes and 17% of female athletes using Xtep shoes.
- By 2023, both genders showed substantial increases in their adoption of Xtep footwear: 33% of female athletes and 41% of male athletes.
- This trend not only underscores Xtep’s growing popularity and market penetration among China’s elite runners but also highlights a more rapid and robust uptake among male athletes over the period.
(Source: Statista)
Consumer Preferences and Trends
Factors Influencing the Purchase of Running Shoes by Consumers Worldwide
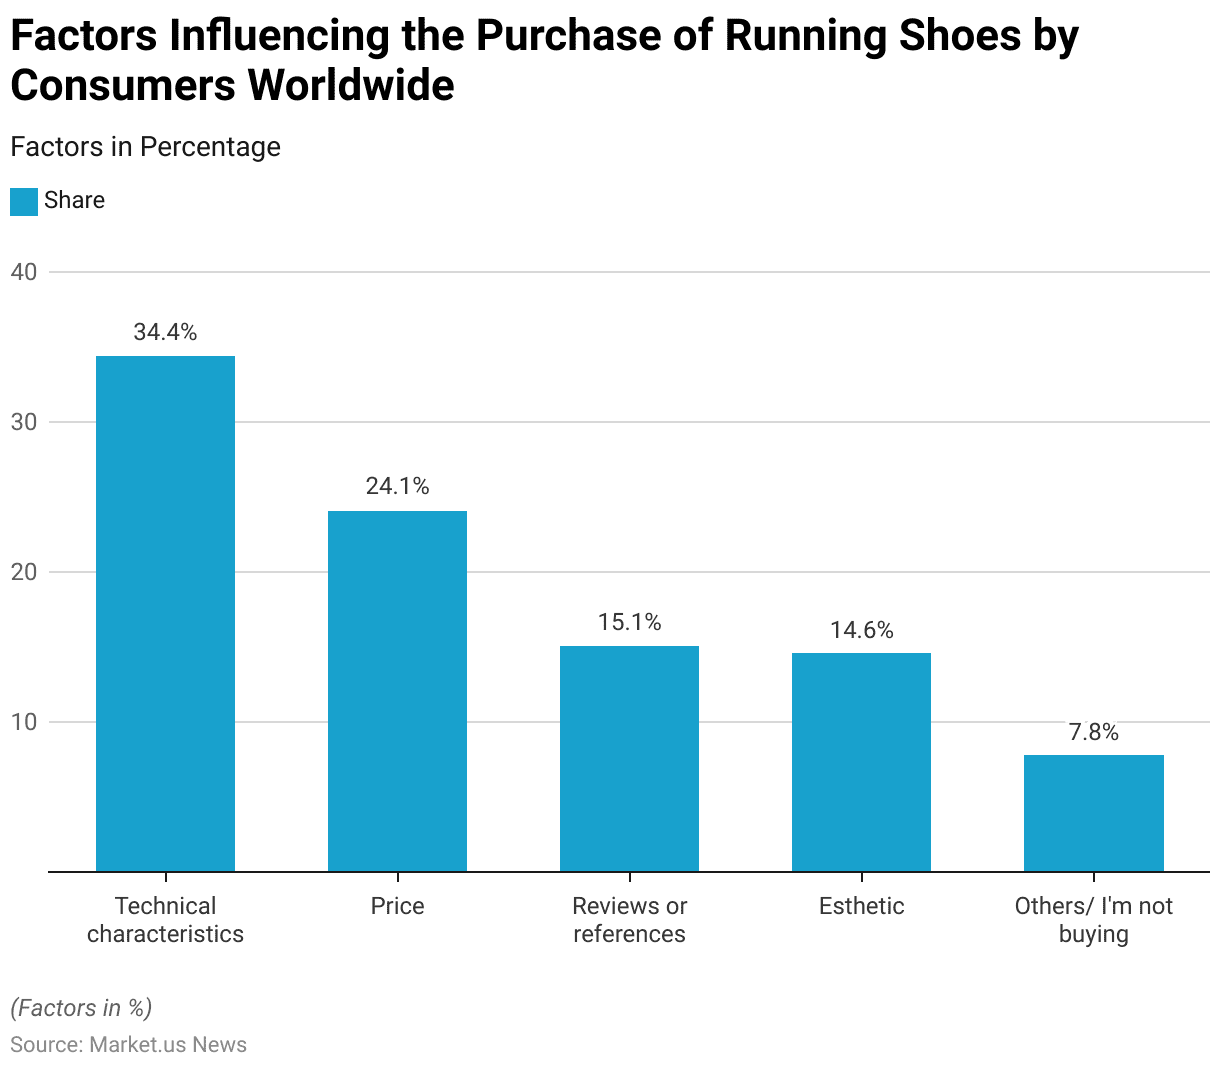
- In a 2017 global survey examining factors that influence consumer choices when purchasing running shoes, technical characteristics emerged as the most significant, with 34.40% of respondents citing this factor. This indicates that features such as support, durability, and material technology are paramount considerations for buyers.
- Price also plays a crucial role, influencing 24.10% of the consumers, suggesting that affordability and value for money are key determinants in the decision-making process.
- Reviews or references from other users affect 15.10% of the respondents, highlighting the impact of word-of-mouth and online testimonials in guiding purchases.
- Aesthetic appeal is also a notable factor, with 14.60% of consumers considering the visual design and style of the shoes.
- Lastly, a smaller segment, 7.80%, either consider other unspecified factors or are not involved in buying running shoes at all.
- This data underscores the varied and complex considerations that go into selecting running shoes and balancing functional attributes with economic and social influences.
(Source: Statista)
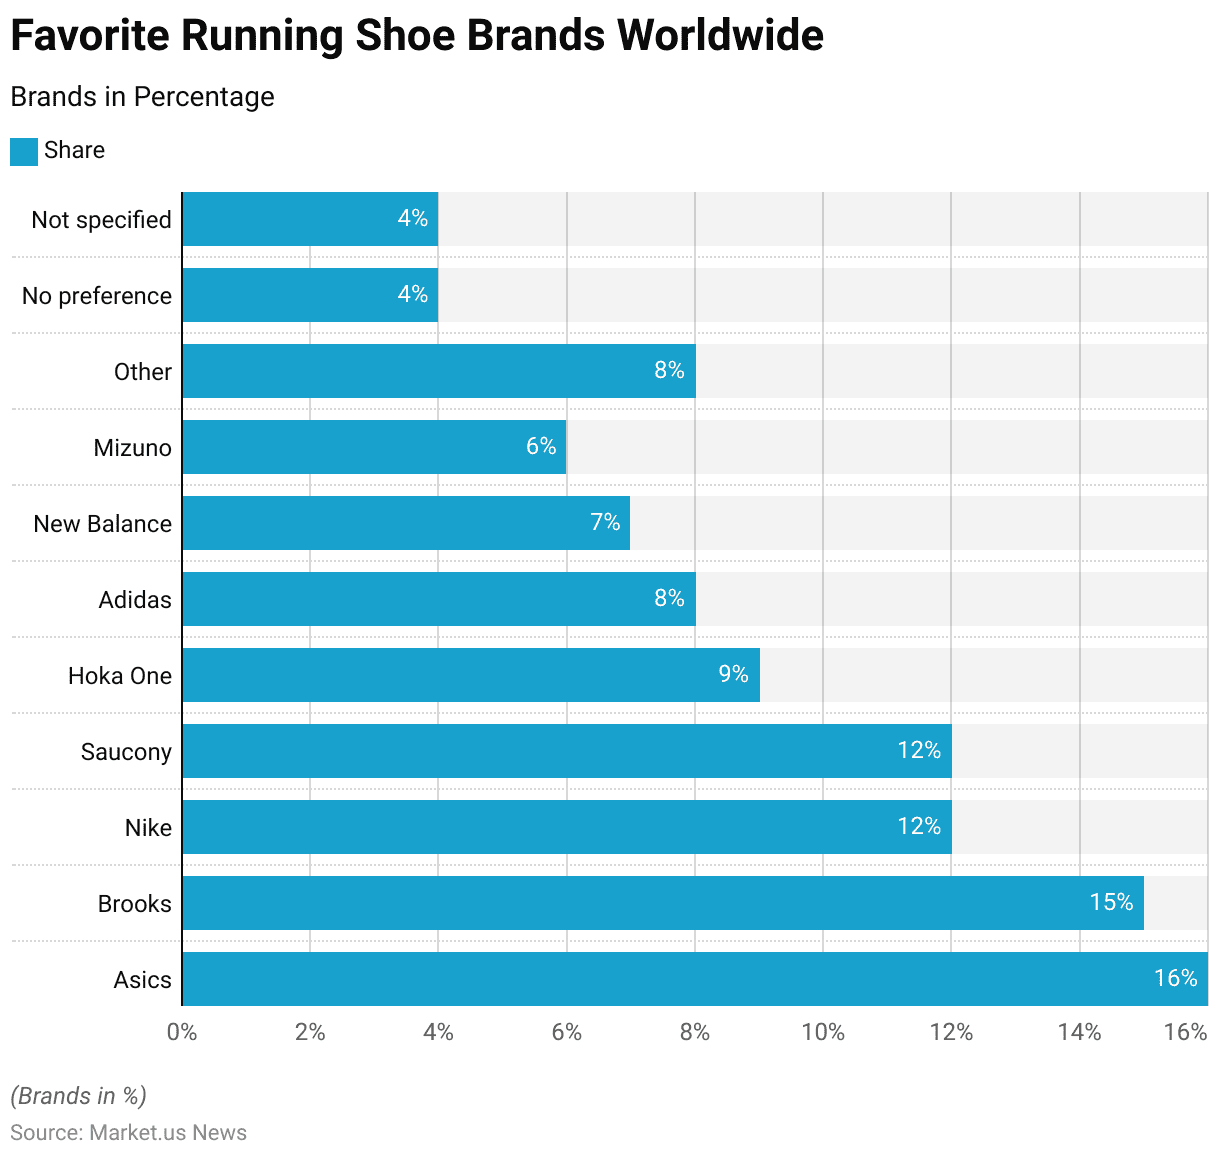
Favorite Running Shoe Brands Worldwide
- In a survey regarding favorite running shoe brands, respondents showed diverse preferences, highlighting the competitive nature of the market.
- Asics emerged as the leading choice with 16% of the vote, closely followed by Brooks at 15%.
- Both Nike and Saucony garnered 12% each, reflecting their strong market presence.
- Hoka One was preferred by 9% of the respondents, indicating a solid niche following.
- Adidas captured 8% of the responses, slightly ahead of New Balance with 7%.
- Mizuno, while smaller in market share, still held the attention of 6% of respondents.
- The category labeled “Other,” which includes various lesser-known or specialty brands, also took an 8% share, underscoring the fragmented nature of consumer choices in this segment.
- Interestingly, 4% of respondents expressed no particular preference, and another 4% did not specify their favorite brand, suggesting that a segment of the market remains unattached to specific brands, representing potential opportunities for newer or emerging companies in the running shoe industry.
(Source: Statista)
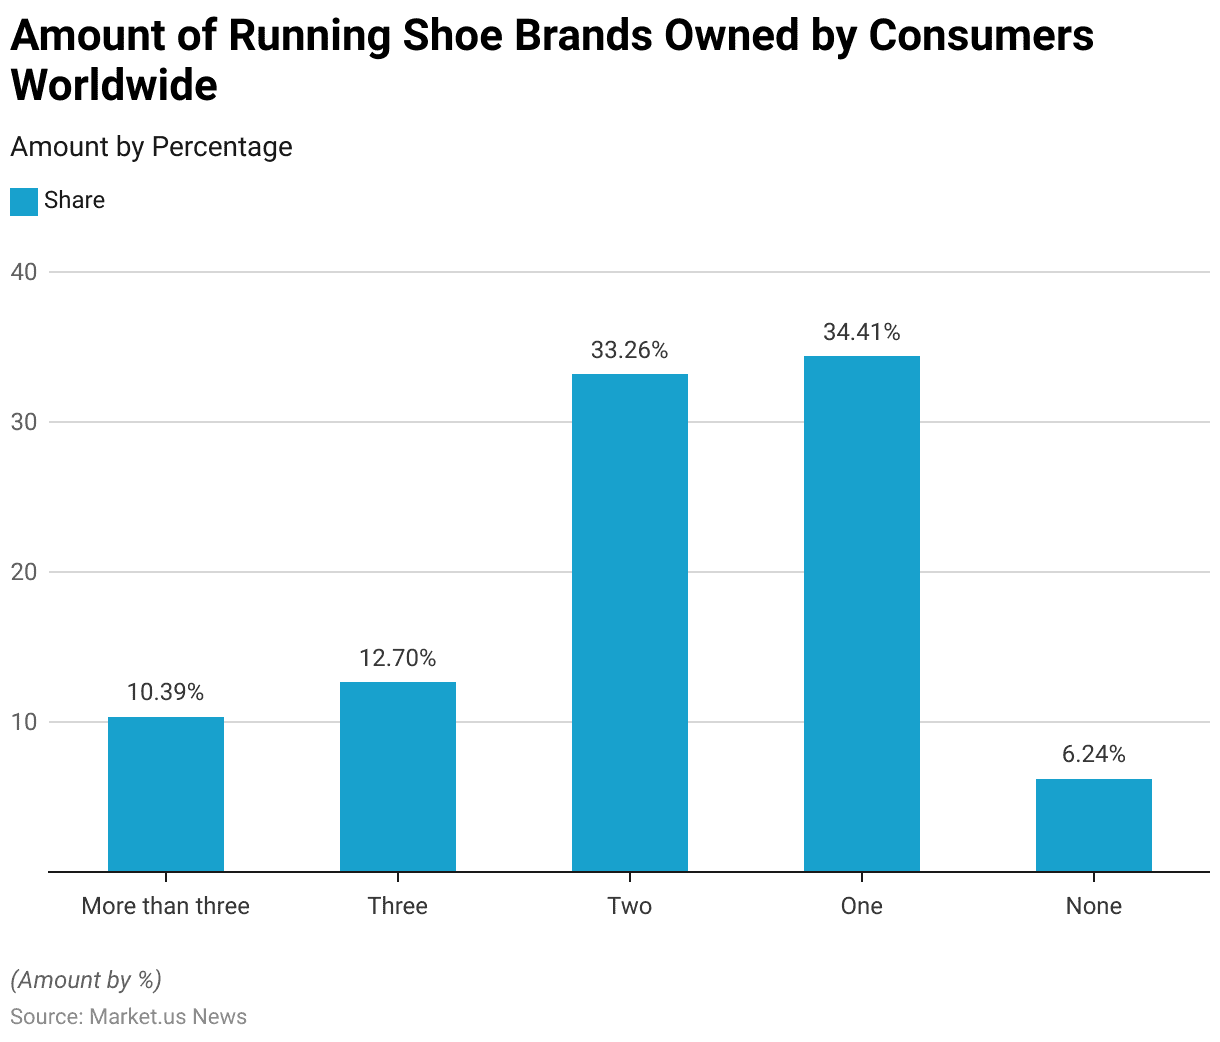
Amount of Running Shoe Brands Owned by Consumers Worldwide
- In 2017, a survey regarding the diversity of running shoe brands owned by consumers worldwide revealed varied preferences.
- A significant proportion of respondents, 34.41%, reported owning running shoes from only one brand, suggesting strong brand loyalty or satisfaction with their current choice.
- Another 33.26% of consumers owned running shoes from two different brands, indicating a willingness to explore options while still maintaining some brand preference.
- Those who expanded their choices to three brands made up 12.70% of respondents, reflecting a more diverse interest in running shoe features offered by various companies.
- Interestingly, 10.39% of the participants owned more than three brands, showcasing a segment of consumers who either prioritized specific features across different brands or enjoyed the variety.
- Conversely, a smaller segment, 6.24%, reported owning none, possibly indicating a lack of interest in running or alternative footwear preferences for their activities.
- This data underscores the diverse consumer behavior in the running shoe market, ranging from exclusive loyalty to one brand to a broader, more eclectic collection.
(Source: Statista)
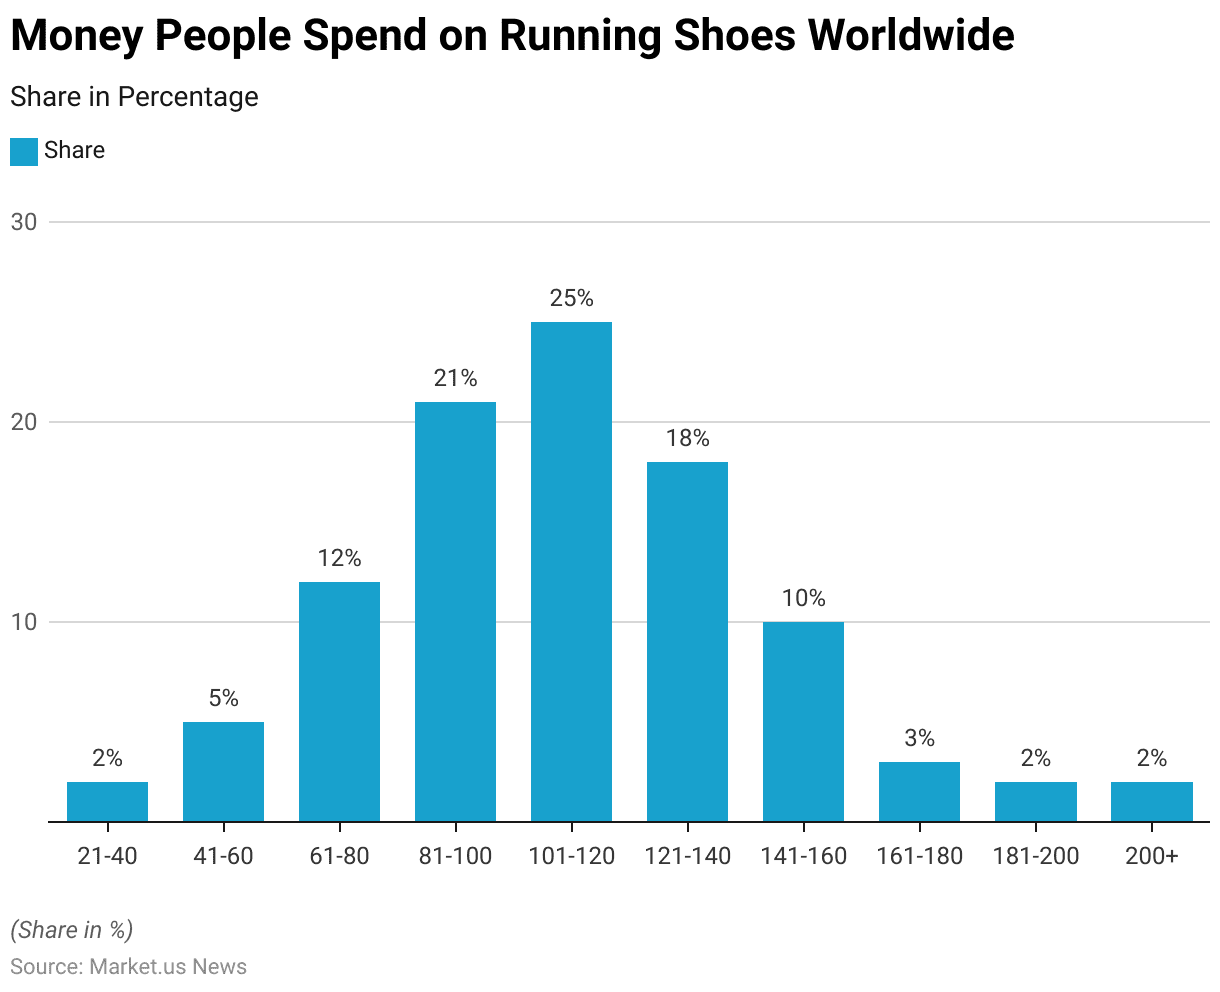
Money People Spend on Running Shoes Worldwide
- In 2017, a survey exploring the spending habits of consumers on running shoes worldwide revealed varied expenditure ranges.
- The majority of respondents, 25%, reported spending between $101 and $120 on their last pair of running shoes, indicating a preference for mid-range priced footwear.
- The next highest group, 21%, spent between $81 and $100, followed by 18% who spent between $121 and $140. These figures suggest that most consumers are willing to invest in quality running shoes, likely valuing durability and performance features.
- Smaller segments of the market showed different spending thresholds, with 12% spending between $61 and $80 and 10% opting for shoes priced between $141 and $160.
- The lower and higher ends of the market were less populated, with only 5% spending between $41 and $60 and similarly minimal percentages (2% each) spending under $40 or over $200.
- This distribution highlights a significant concentration of consumer spending within a specific mid-price range, reflecting perhaps both economic considerations and perceived value in terms of running shoe quality and features.
(Source: Statista)
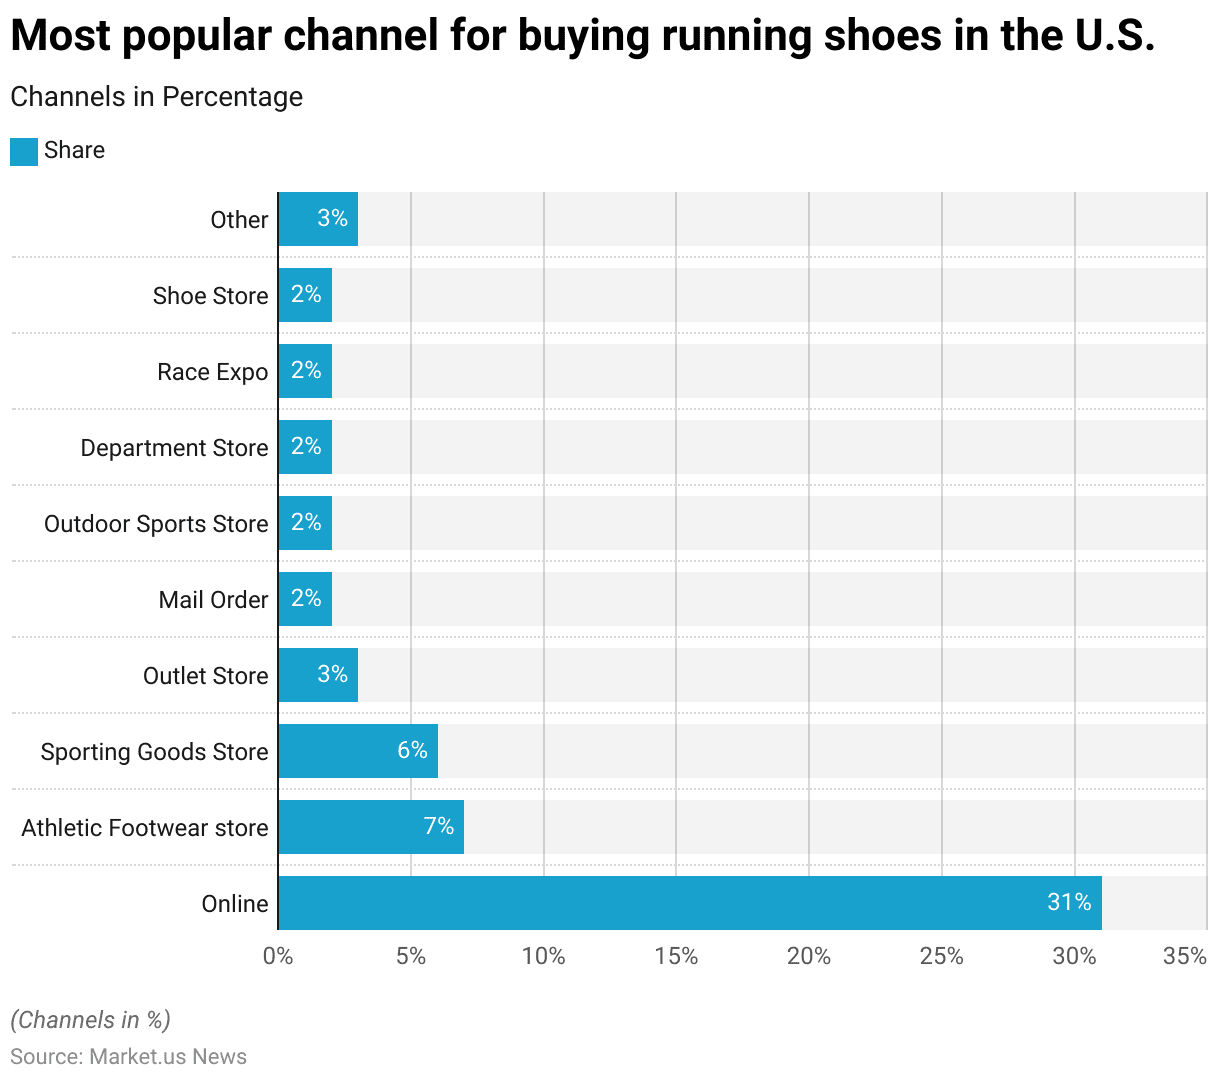
Popular Channels for Buying Running Shoes
- In 2016, a survey examining the most popular channels for purchasing running shoes in the U.S. revealed that online platforms were the predominant choice, with 31% of respondents buying their shoes this way. This indicates a strong preference for the convenience and variety offered by online shopping.
- Athletic footwear stores, such as Foot Locker and Finish Line, were the next most popular option, with 7% of consumers purchasing there.
- Sporting goods stores, including chains like Dick’s Sporting Goods and Big 5, accounted for 6% of purchases, underscoring their role in the market, albeit less dominant compared to online sales.
- Other purchase channels included outlet stores at 3% and various options such as mail order, outdoor sports stores like REI, department stores, race expos, and other shoe stores like DSW, each garnering 2% of consumer purchases.
- An additional 3% of purchases were categorized under “Other,” which could include less traditional or emerging retail formats.
- This distribution highlights the significant shift towards online shopping while still acknowledging the varied consumer preferences for different retail environments.
(Source: Statista)
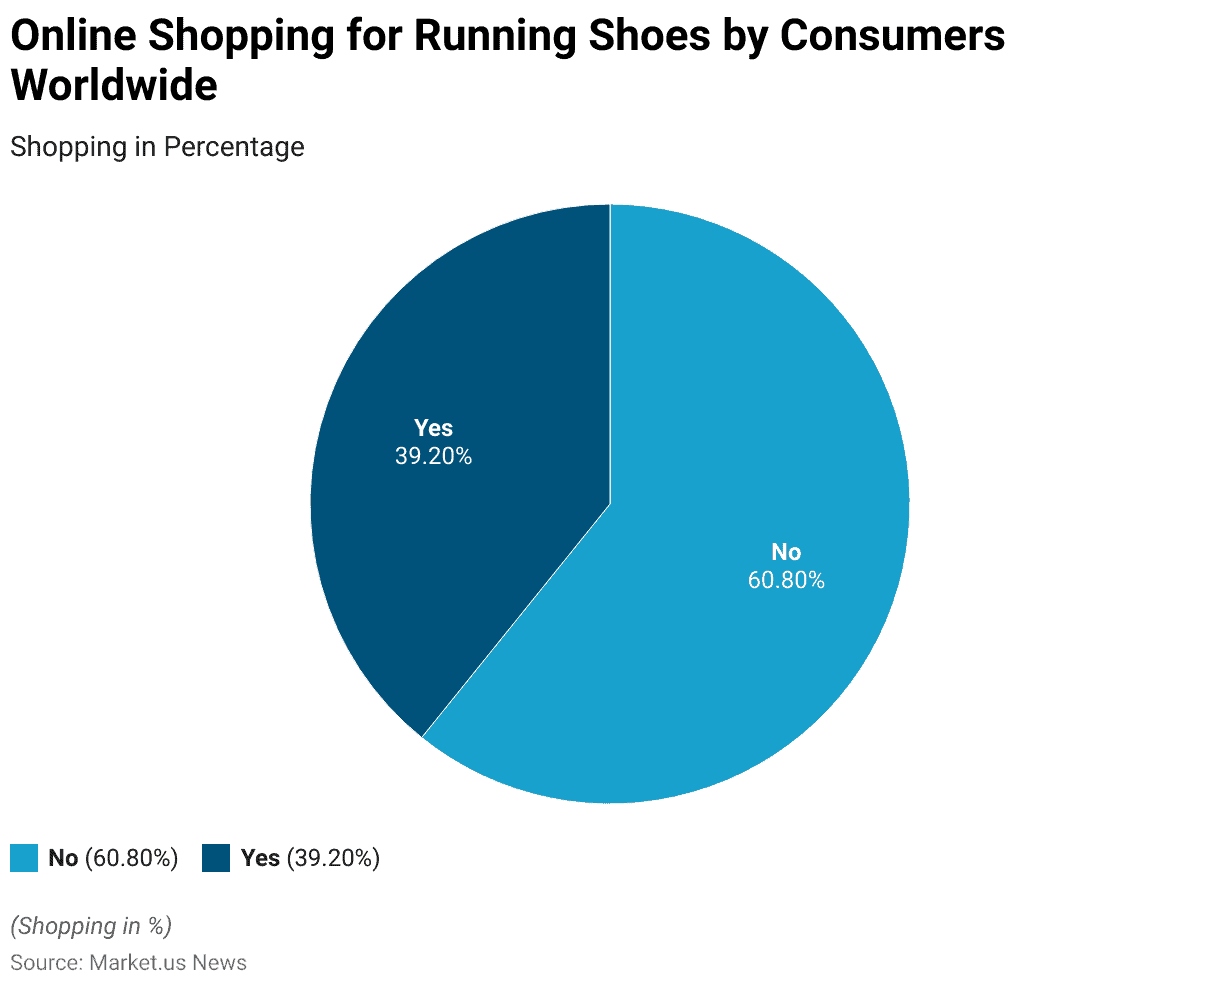
Online Shopping for Running Shoes by Consumers Worldwide
- In 2017, a global survey on the shopping preferences for running shoes revealed that the majority of consumers, 60.80%, preferred not to shop online for their running shoes.
- In contrast, 39.20% of respondents did favor purchasing running shoes online.
- This distribution suggests a significant portion of the market still values the traditional shopping experience, potentially due to the benefits of trying on shoes for fit and comfort before purchase.
- Meanwhile, the sizable minority who shop online indicates a robust market segment that appreciates the convenience and variety available through online channels.
- This demonstrates the diverse approaches consumers take to purchasing running shoes, influenced by personal preferences and the perceived advantages of each shopping method.
(Source: Statista)
Importance of Breathability of Running Shoes Worldwide
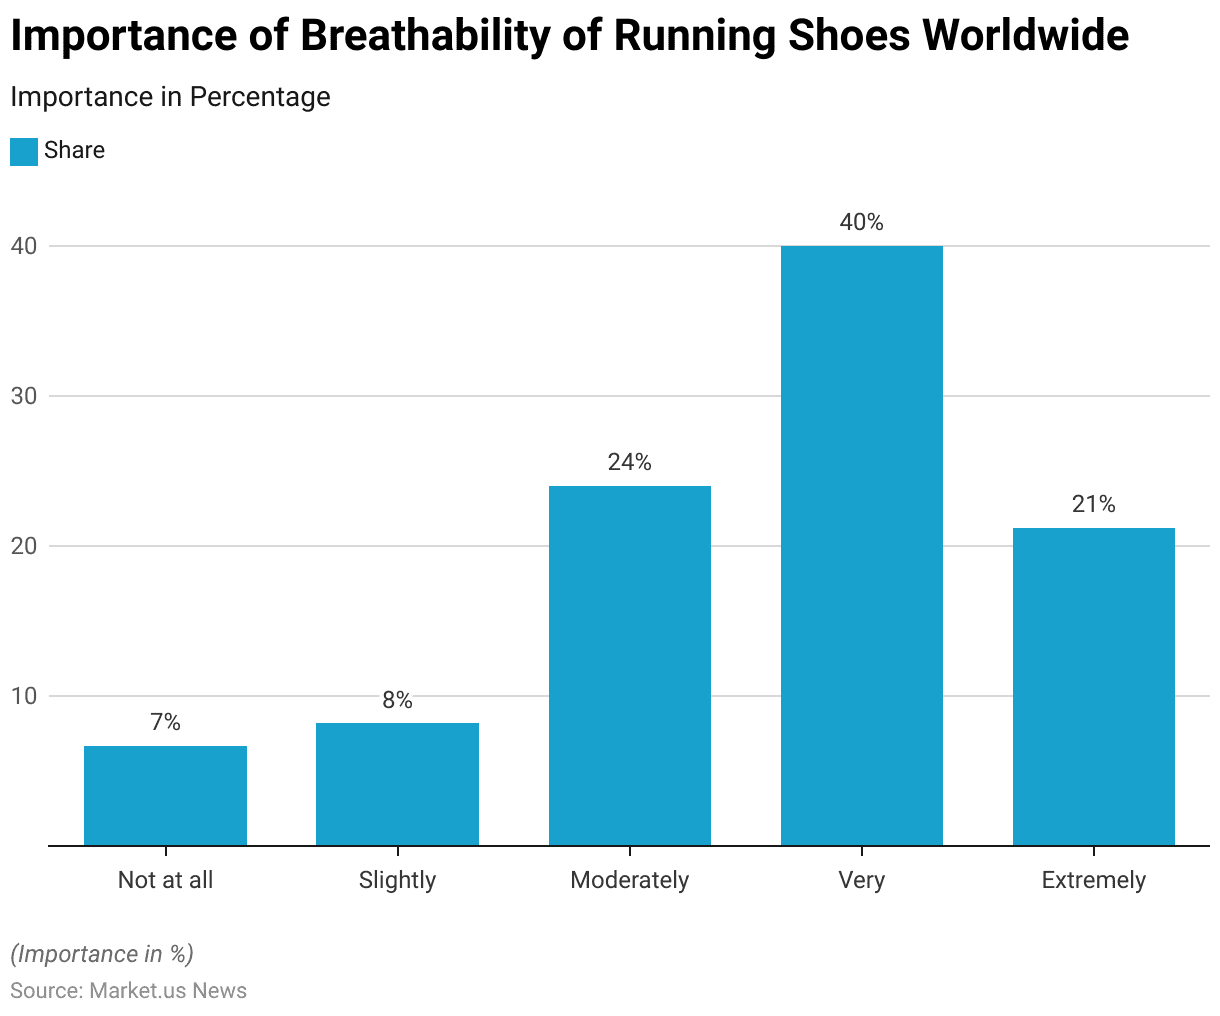
- In 2017, a survey assessing the importance of breathability in running shoes revealed that it is a significant consideration for the majority of consumers worldwide.
- A substantial 40% of respondents rated breathability as ‘very important’ when selecting running shoes, underscoring the preference for comfort and functionality during physical activities.
- Additionally, 21.20% of the participants considered it ‘extremely important,’ reflecting a strong demand for high-performance features that enhance airflow and reduce moisture.
- Together, these groups constitute over 61% of respondents who prioritize this feature highly.
- On the other hand, 24% of the respondents deemed breathability as ‘moderately important,’ indicating a balanced view that considers other factors such as price and durability.
- A smaller segment of the market, consisting of 8.20% and 6.70% of respondents, found breathability to be ‘slightly’ or ‘not at all’ important, respectively, suggesting that for these consumers, other characteristics of running shoes may take precedence.
- This data highlights the varied consumer preferences and the significant role that breathability plays in the purchasing decisions of running footwear.
(Source: Statista)
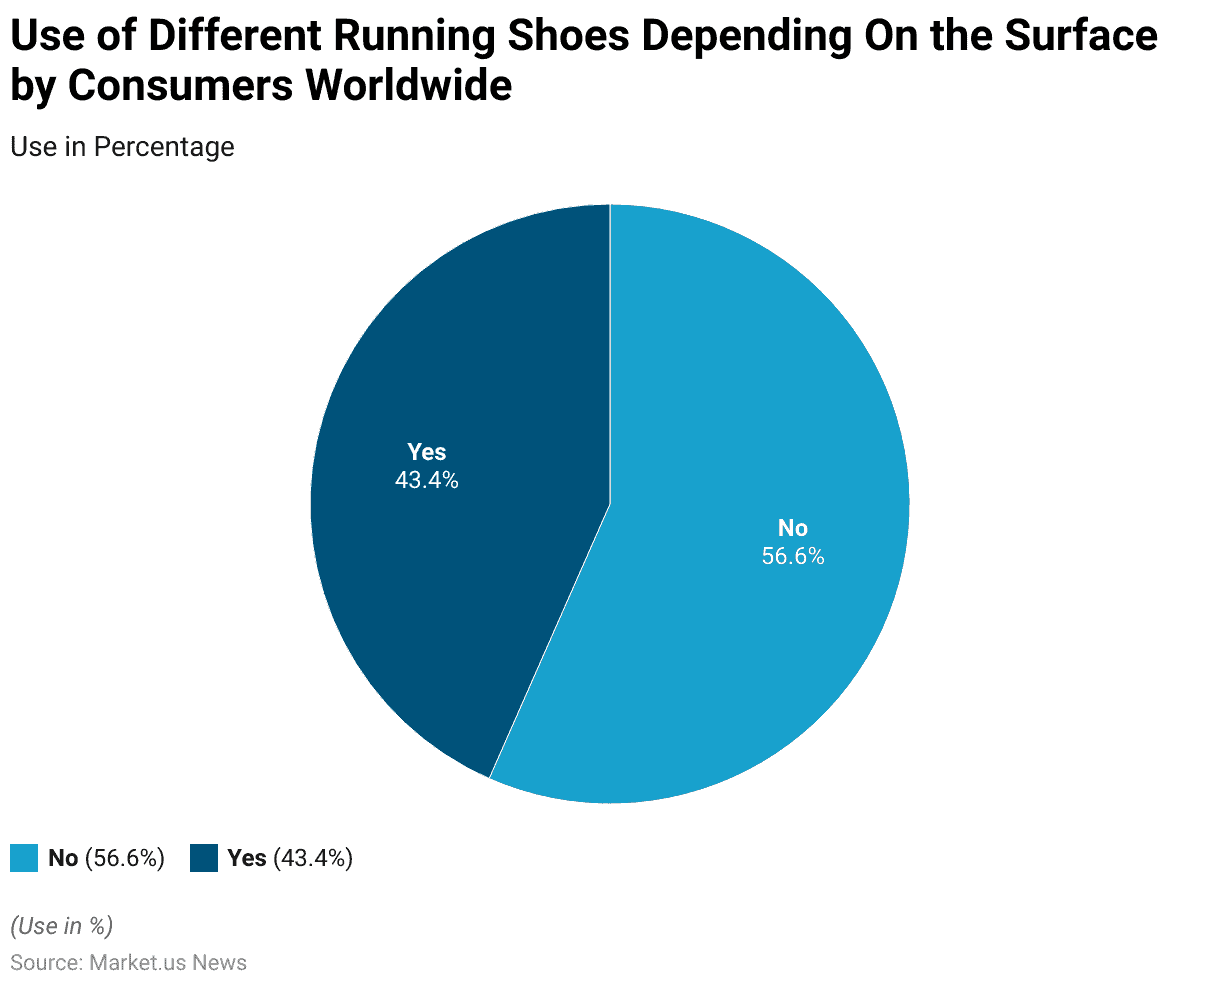
Use of Different Running Shoes Depending On the Surface by Consumers Worldwide
- In a 2017 global survey on running shoe usage, 56.60% of respondents indicated that they do not use different running shoes depending on the surface they run on, suggesting a preference for versatility and perhaps a perception that their shoes are adaptable to various conditions.
- Conversely, 43.40% of the participants reported that they do switch shoes based on the running surface, highlighting a segment of consumers who value specialized footwear to potentially enhance performance comfort or reduce injury risks on different terrains.
- This practice might be more common among more serious or professional runners who require specific types of support and traction for different environments, such as trails versus asphalt.
- The data illustrates diverse consumer practices and needs within the running community, reflecting varying levels of engagement and expertise in the activity.
(Source: Statista)
Importance of Price of Running Shoes by Consumers Worldwide
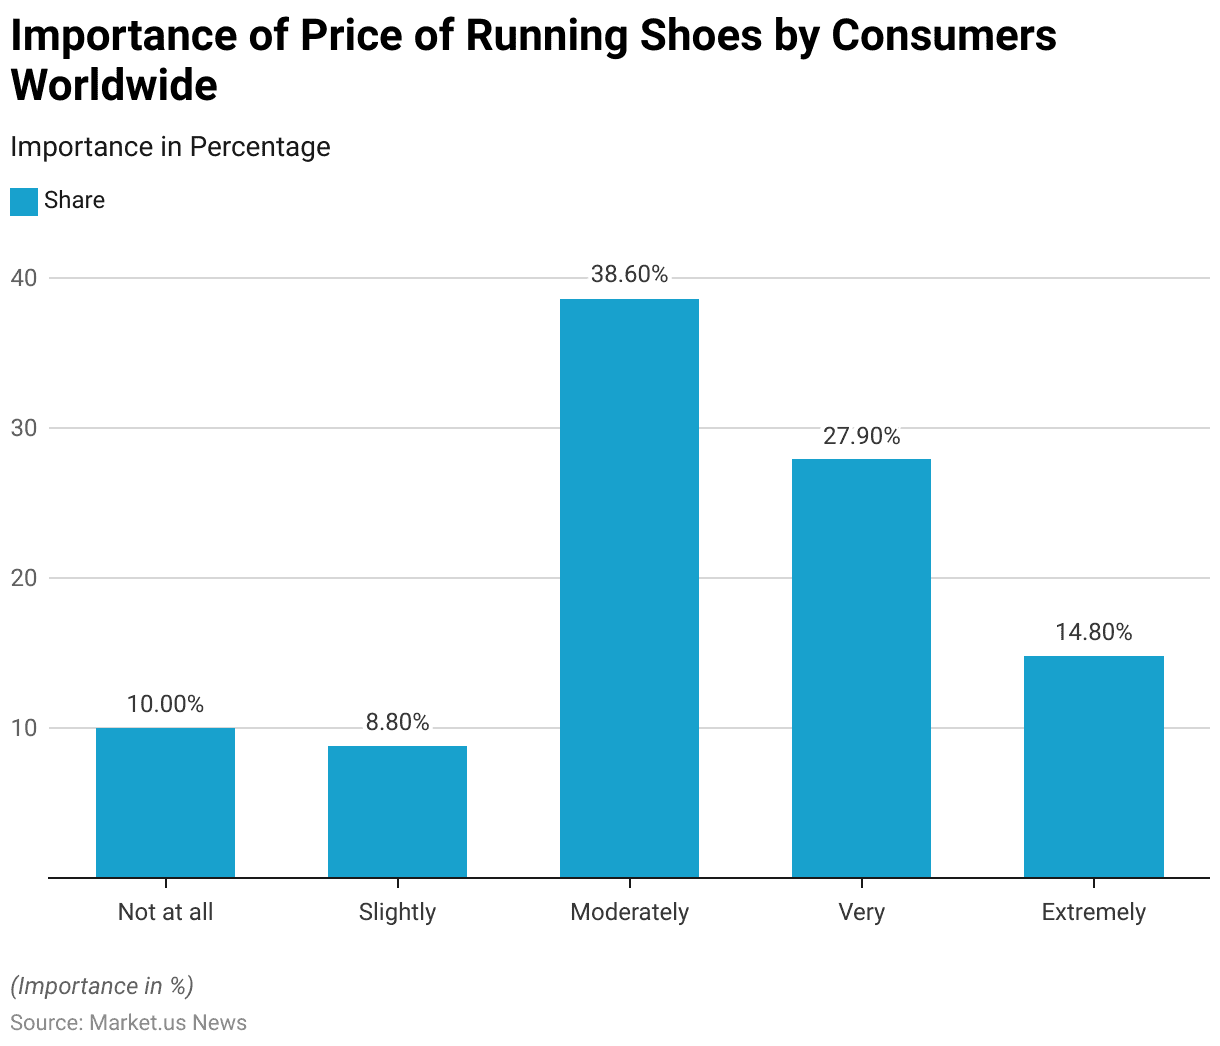
- In a survey analyzing the significance of price in the decision-making process for purchasing running shoes, consumers worldwide displayed a spectrum of perspectives.
- The largest share of respondents, 38.60%, indicated that price is a moderately important factor, suggesting that while price influences their choice, it is balanced with other factors like quality or brand loyalty.
- Additionally, 27.90% of the participants view price as very important, and 14.80% rate it as extremely important, underscoring a considerable portion of the consumer base that places a high priority on cost when selecting running shoes.
- Conversely, a smaller percentage of consumers are less influenced by price; 8.80% consider it slightly important, and 10% do not consider it important at all.
- This distribution highlights that while price is a critical factor for many, there is a significant diversity in the degree to which it affects consumer choices in the running shoe market.
(Source: Statista)
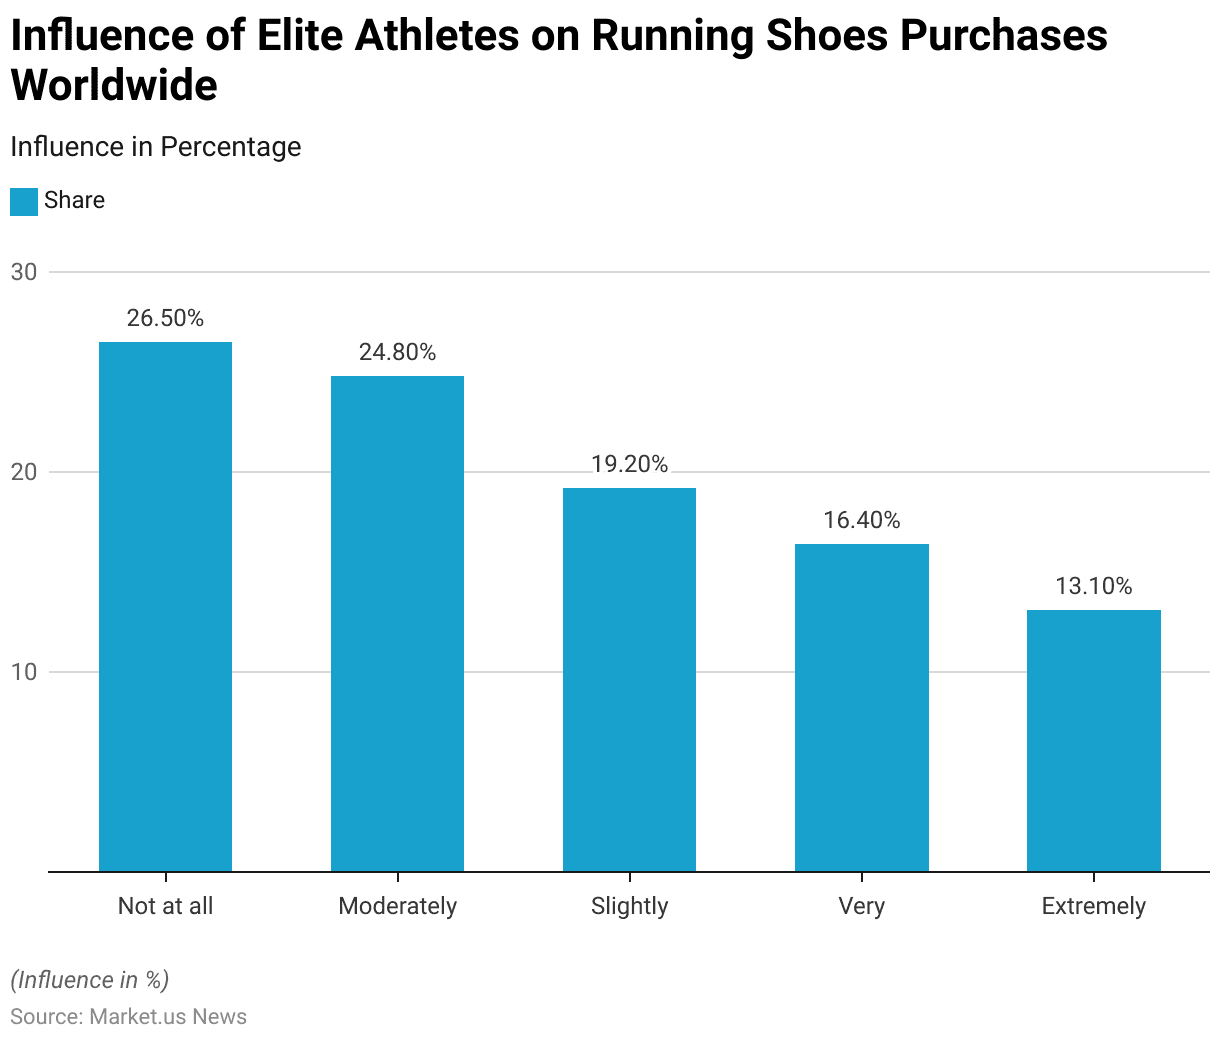
Influence of Elite Athletes on Running Shoes Purchases Worldwide
- In a 2017 survey examining the influence of elite athletes on consumer choices in running shoes, the responses indicated varying degrees of impact.
- A plurality of respondents, 26.50%, stated that their choice of running shoes is not influenced at all by what elite athletes wear, suggesting a focus on personal preferences or other factors such as comfort, price, and brand loyalty.
- However, a notable proportion of participants do consider the choices of professionals to some extent: 24.80% reported a moderate influence, and 19.20% felt only slightly influenced.
- On the other hand, 16.40% of respondents indicated that elite athletes very much influence their choices and 13.10% claimed they are extremely influenced, reflecting a segment of consumers who highly value the endorsements and preferences of professional runners, possibly viewing these choices as indicators of quality and performance.
- This spectrum of responses highlights the diverse criteria consumers use when selecting running shoes, ranging from complete independence to significant reliance on athletic endorsements.
(Source: Statista)
Price Trends for Various Types of Running Shoes
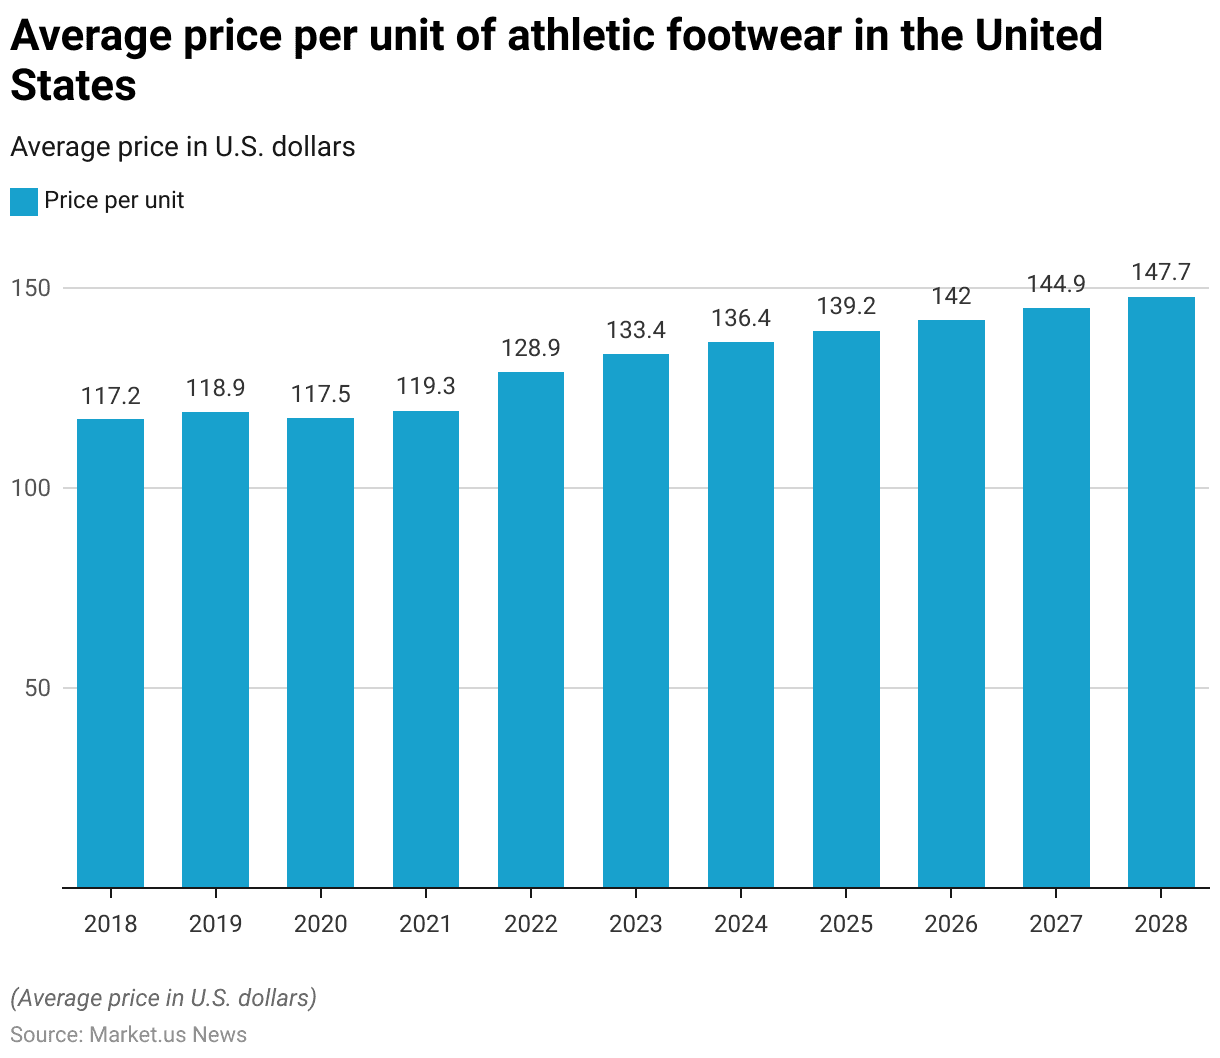
Athletic Footwear Price Per Unit
- From 2018 to 2028, the average price per unit of athletic footwear in the United States has shown a gradual increase, reflecting changes in market conditions and consumer preferences.
- In 2018, the average price was $117.16, followed by a slight increase in 2019 to $118.90.
- The price experienced a minor dip in 2020 to $117.46, possibly influenced by market dynamics during that period.
- However, it rebounded in 2021 to $119.29 and began a more pronounced upward trend from 2022 onwards.
- By 2022, the average price per unit had risen to $128.90, followed by $133.42 in 2023, indicating a strengthening market demand or increased cost inputs.
- The forecast for the subsequent years shows a consistent rise, with prices reaching $136.40 in 2024 and $139.18 in 2025 and continuing to increase annually until they reach $147.70 by 2028.
- This progression suggests ongoing inflationary pressures or enhancements in product quality that could be driving the upward price trajectory in the athletic footwear market.
(Source: Statista)
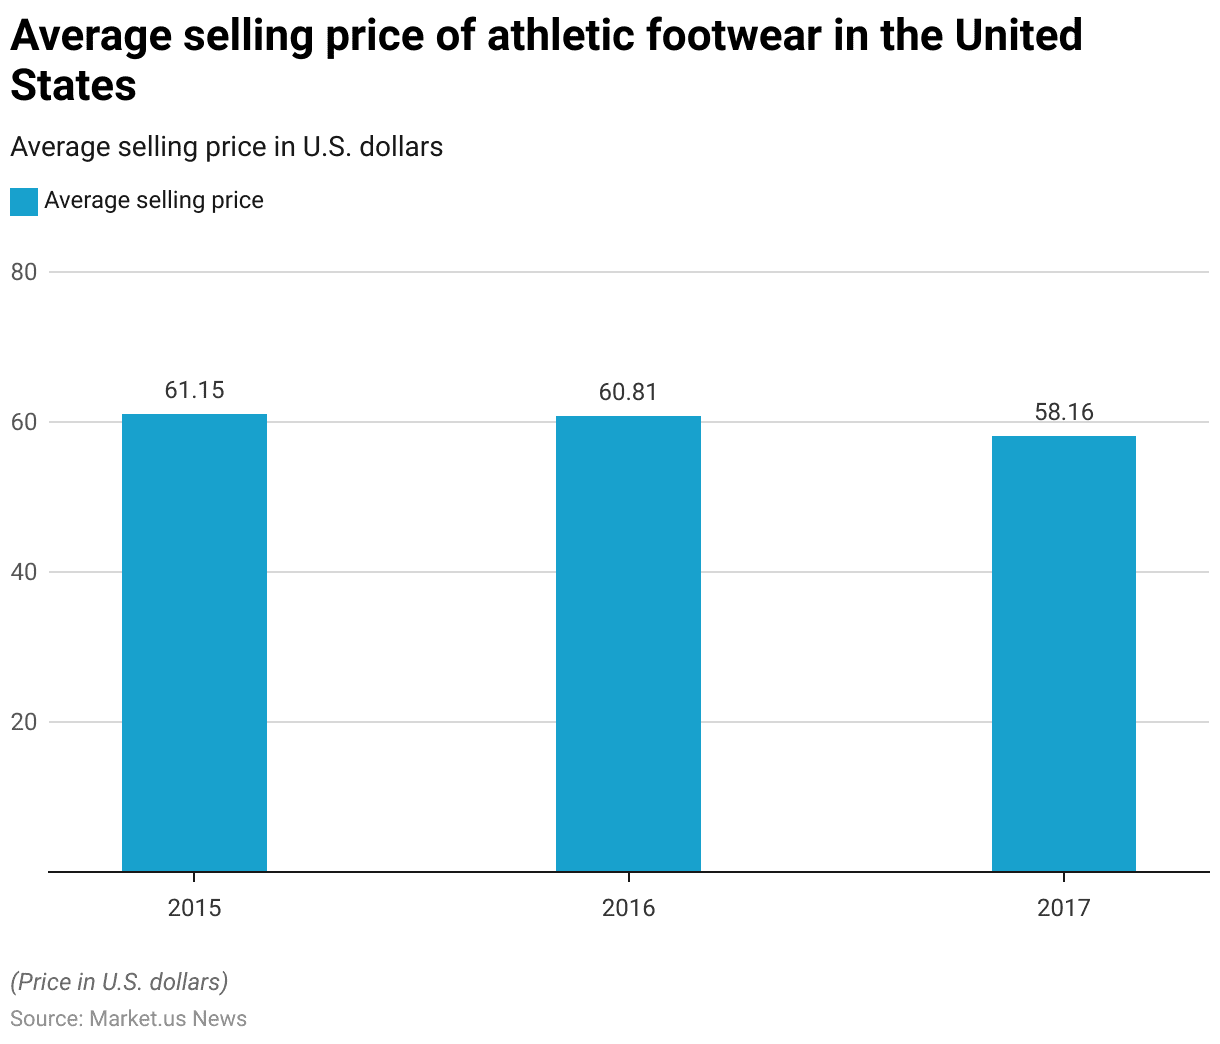
Athletic Footwear Average Selling Price
- From 2015 to 2017, the average selling price of athletic footwear in the United States exhibited a declining trend.
- In 2015, the average price was $61.15, which decreased slightly in 2016 to $60.81.
- By 2017, this downward trend continued, with the average price further reducing to $58.16.
- This decrease over the three years could suggest various market factors at play, such as increased competition, changes in consumer spending behavior, or advancements in production techniques that reduced costs.
- The data indicates a period where consumers may have benefited from lower prices in the athletic footwear segment.
(Source: Statista)
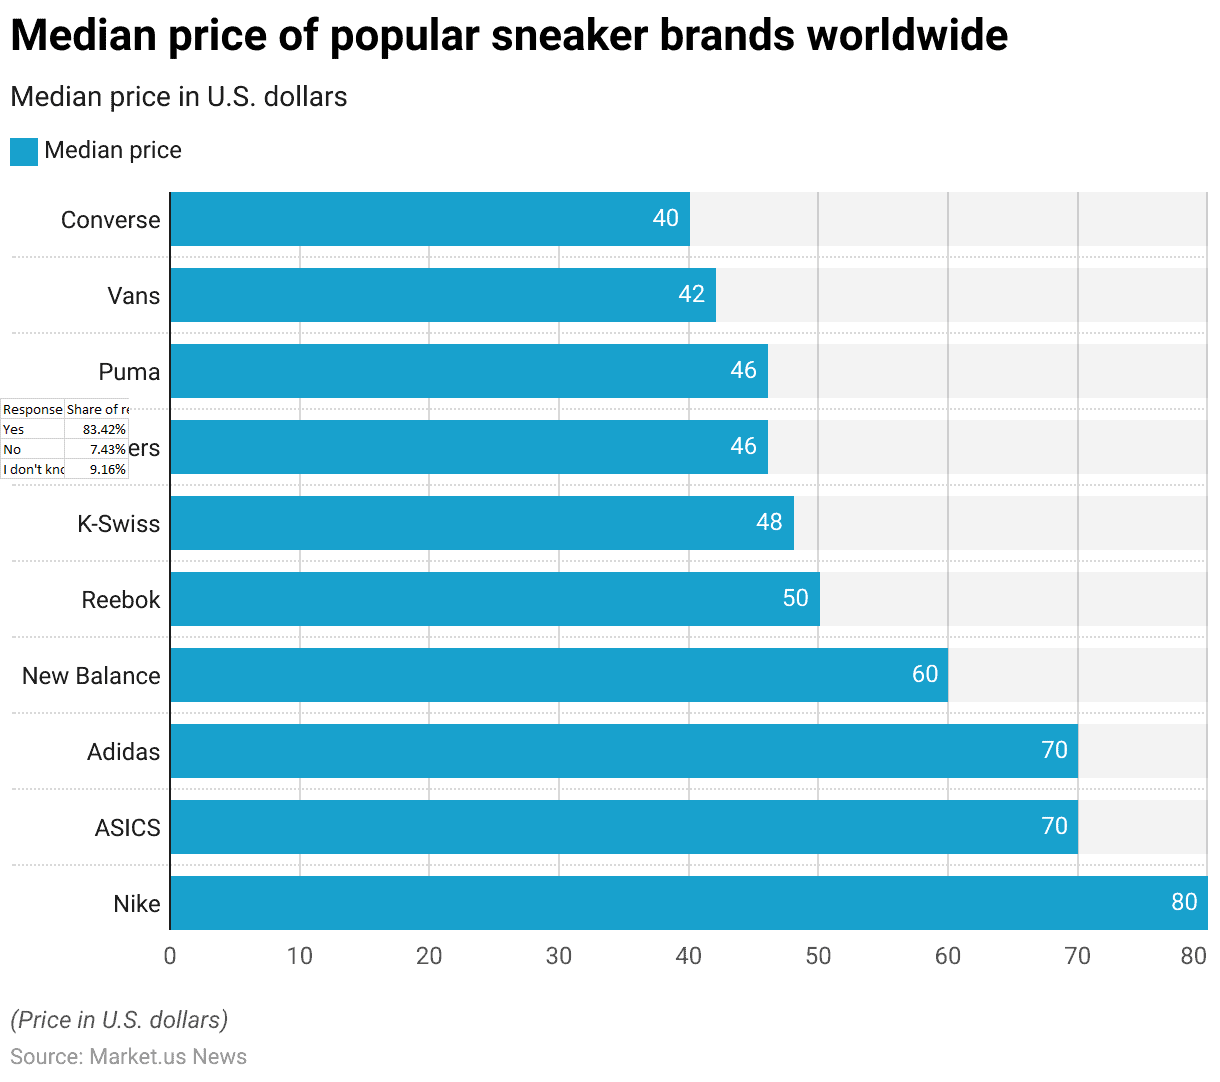
Popular Sneaker Brands Prices Worldwide
- As of 2017, the median price of popular sneaker brands worldwide varied significantly, reflecting a range of market positioning and target demographics.
- Nike topped the list with a median price of $80, indicative of its premium branding and strong market presence.
- ASICS and Adidas, both known for their technological innovations in sportswear, were tied with a median price of $70.
- New Balance followed with a slightly lower median price of $60, positioning itself as a competitive option for quality seekers.
- Reebok’s median price stood at $50, offering a more accessible price point within the athletic footwear market.
- K-Swiss and Skechers, both priced under $50, at $48 and $46, respectively, catered to budget-conscious consumers while still maintaining a focus on sports performance and casual wear.
- Puma matched Skechers at $46, balancing sportive functionality with lifestyle appeal.
- Vans, primarily recognized for its skateboarding and casual shoes, had a median price of $42, appealing particularly to the youth and young adults.
- Converse, the most affordable among the top brands, had a median price of $40 and is known for its classic designs and broad appeal across various age groups.
- This pricing strategy across brands illustrates their diverse approaches to capturing different segments of the market, from premium to more economically accessible options.
(Source: Statista)
Benefits and Advantages
The Perception that Running Shoes Prevent Injuries Worldwide
- In 2017, a survey on the perception that running shoes can prevent injuries showed that a significant majority of respondents worldwide, 83.42%, believe that certain running shoes can prevent injuries.
- This strong consensus reflects a common trust in the technological advancements and design features of modern running shoes that aim to offer better support and reduce the risk of injuries.
- Conversely, only a small fraction of the surveyed population, 7.43%, disagreed with this notion, indicating skepticism about the efficacy of running shoes in injury prevention.
- Additionally, 9.16% of respondents were unsure, reflecting some level of uncertainty or lack of awareness about the specific benefits that different types of running shoes might offer.
- This data highlights a widespread belief in the protective value of specialized running footwear among consumers globally.
(Source: Statista)
The Perception that Running Shoes Improve Performance by Consumers Worldwide
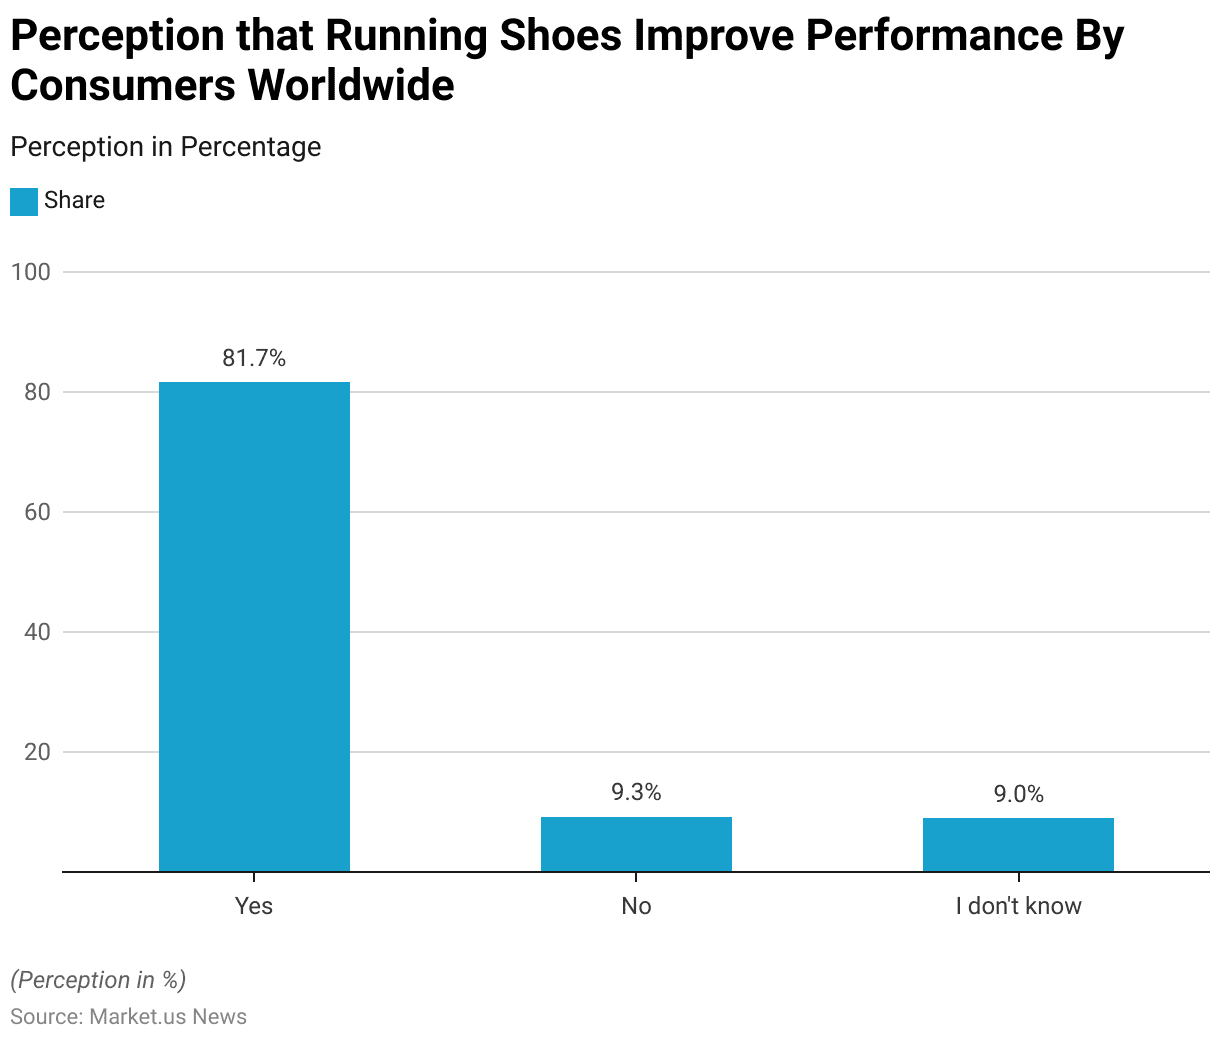
- In 2017, a significant majority of consumers worldwide, 81.70%, expressed their belief that certain running shoes can help improve performance. This strong affirmative response underscores the confidence in the impact of advanced footwear technology and design on enhancing athletic capabilities.
- On the other hand, a small segment of the population, 9.30%, did not believe that running shoes contribute to improved performance, possibly due to skepticism about marketing claims or personal experiences.
- Additionally, 9% of respondents were uncertain, indicating either a lack of personal experience or insufficient information to form an opinion.
- This data highlights the prevailing perception among consumers that the right choice in running footwear can play a crucial role in achieving better athletic performance.
(Source: Statista)
Concerns and Challenges
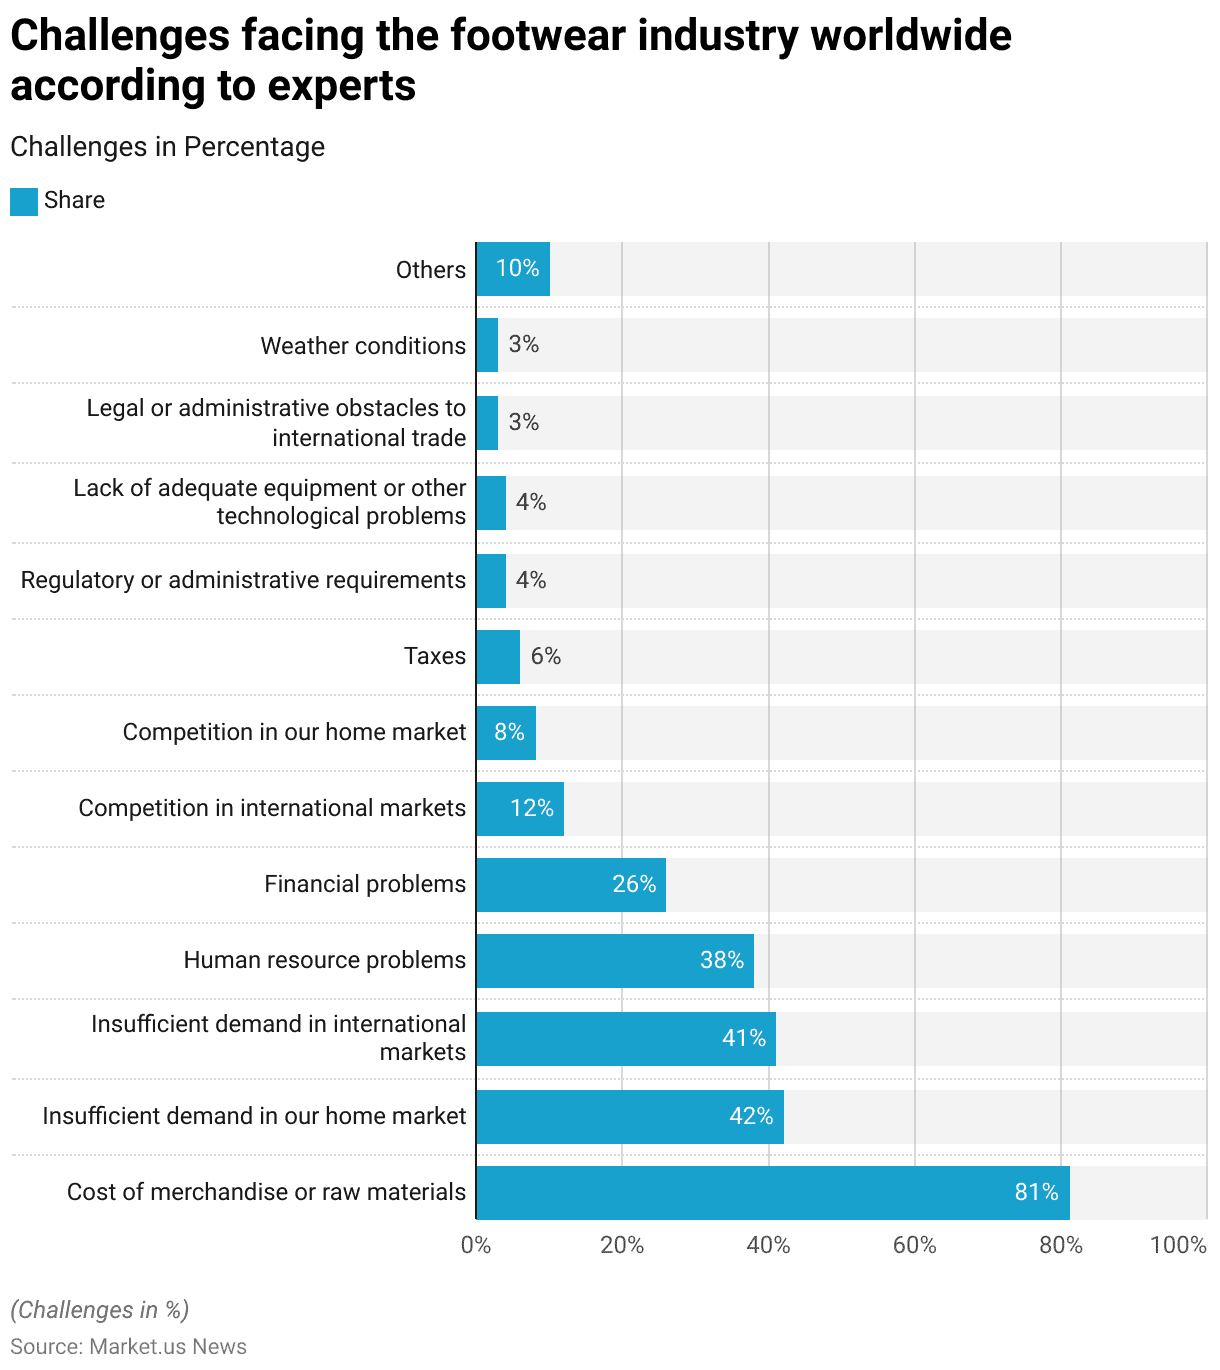
- In November 2022, footwear industry experts worldwide identified a range of challenges anticipated over the next six months, with the cost of merchandise or raw materials cited as the most significant, affecting 81% of respondents. This highlights the pervasive impact of rising material costs across the industry.
- Additionally, demand fluctuations pose considerable concerns, with 42% of experts pointing to insufficient demand in their home markets and 41% noting similar issues internationally, suggesting a global slowdown in consumer spending on footwear.
- Human resource problems were also a significant worry for 38% of respondents, indicating potential issues in staffing and labor management.
- Financial problems were noted by 26% of the respondents, reflecting ongoing economic pressures that could affect liquidity and capital management within companies.
- Competitive pressures were less pronounced but still notable, with 12% experiencing competition in international markets and 8% in home markets, revealing the intense market dynamics businesses face globally.
- Lower percentages of respondents were concerned with taxes (6%), regulatory or administrative requirements (4%), and technological challenges due to inadequate equipment (4%), suggesting these are less immediate but persistent issues.
- Legal or administrative obstacles to international trade and weather conditions each were a concern for only 3% of respondents, indicating these are relatively minor hurdles at present.
- An additional 10% of experts mentioned other unspecified challenges, pointing to the diverse and complex nature of difficulties facing the footwear industry.
- This comprehensive view underscores the multifaceted challenges that could impact the sector’s stability and growth in the near term.
(Source: Statista)
Developments and Trends
- The running shoe sector is experiencing robust growth and innovation, driven by increasing consumer demand and advancements in shoe technology. This growth is largely fueled by technological innovations across major brands and diversification in product offerings catering to different running surfaces and consumer needs.
- Leading companies like Nike, Adidas, and New Balance are at the forefront of this innovation, introducing new products that emphasize durability, comfort, and performance enhancement.
- For example, Adidas has been noted for integrating advanced cushioning technologies into their shoes, which aim to improve the runner’s comfort and performance.
- Another notable innovation is from Skechers, which has developed the Maxroad 6 with an all-new Hyper Burst Ice midsole designed for enhanced comfort and performance, particularly noted for its increased cushioning and improved durability of the upper.
- Additionally, niche brands like NOBULL and Speedland are making significant strides by focusing on specific segments of the market.
- NOBULL, for example, has expanded from CrossFit into performance running with technologies like Pebax midsoles and engineered mesh designs. At the same time, Speedland specializes in high-end trail running shoes, utilizing top-grade materials and technology such as Michelin outsoles and BOA Fit lacing systems.
(Sources: Believe in the Run, GearJunkie)
Recent Developments
Acquisitions and Mergers:
- Adidas Acquires Runtastic: In January 2024, Adidas announced the acquisition of the fitness app Runtastic for approximately $250 million. This acquisition aims to enhance Adidas’ digital presence and integrate performance tracking with its running shoe offerings.
- New Balance Partners with Tracksmith: In March 2024, New Balance and Tracksmith formed a strategic partnership to create a limited-edition running shoe line. The collaboration focuses on combining New Balance’s technology with Tracksmith’s heritage aesthetics, aiming for a launch in the summer of 2024.
New Product Launches:
- Nike Unveils Next-Gen Air Zoom: In February 2024, Nike launched the Air Zoom Pegasus 40, featuring advanced cushioning technology designed to improve comfort and performance for long-distance runners. Initial sales reached $5 million within the first month.
- Hoka One One Introduces Bondi 8: In April 2024, Hoka One One released the Bondi 8, boasting a new foam technology that promises 30% more cushioning than its predecessor. The launch was well-received, with over 100,000 pairs sold in the first quarter.
Funding:
- On Running Secures $50 Million: In March 2024, On Running, known for its innovative footwear, raised $50 million in a Series C funding round led by venture capital firms. The funds are intended for expanding global operations and enhancing product development.
- Allbirds Raises $25 Million for Sustainable Innovation: In February 2024, Allbirds announced it had raised $25 million to further its commitment to sustainable materials in running shoes, aiming to develop more eco-friendly products by 2025.
Technological Advancements:
- 3D Printing in Shoe Production: Several brands are adopting 3D printing technology to enhance customization options. By 2025, 15% of running shoes are expected to be produced using 3D printing methods, allowing for tailored fits and reduced waste.
- Integration of Smart Technology: The introduction of smart running shoes is on the rise, with predictions indicating that 20% of new running shoe models will feature integrated sensors by 2026, enabling real-time performance tracking.
Conclusion
Running Shoes Statistics – The running shoe market has shown dynamic growth, driven by technological innovations aimed at enhancing performance and comfort, which consumers value highly.
Price sensitivity remains a critical factor influencing brand loyalty and purchasing decisions, with consumers balancing costs against perceived benefits.
Brands like Nike and Adidas are fiercely competitive, adapting their strategies to meet diverse consumer preferences and overcome challenges such as raw material costs and fluctuating demand.
The shift towards online shopping and the popularity of using multiple brands also highlight evolving consumer behaviors.
The industry faces ongoing challenges, but opportunities abound for brands that can integrate consumer insights, maintain competitive pricing, and leverage sustainable practices and digital engagement to enhance customer experiences.
FAQs
Running shoes should typically be replaced every 300 to 500 miles (480 to 800 km). However, this can vary depending on factors such as your weight, running surface, and running style. Heavier runners or those running on hard surfaces like concrete may need to replace shoes sooner.
For runners with flat feet, stability or motion-control shoes are recommended. These shoes offer extra arch support and are designed to help control overpronation, which is when the foot rolls inward excessively during the stride.
Expensive running shoes often come with advanced materials and technology, such as better cushioning systems, lighter weight, or improved durability. However, the most important factor is finding a shoe that fits your foot shape, running style, and comfort needs. Higher cost doesn’t always guarantee better performance or comfort for every runner.
Yes, running shoes can impact performance. The right shoe can enhance comfort, reduce injury risk, and improve running efficiency. Features such as proper cushioning, fit, and arch support can influence the biomechanics of your stride, which in turn affects how efficiently you run.
Yes, some brands offer shoes specifically designed for beginner runners, which tend to focus on comfort, durability, and injury prevention. These shoes may have more cushioning, a neutral design to accommodate a variety of foot types, and durable outsoles for longer-lasting wear.
Running shoes should have about a thumb’s width of space in the toe box and should fit snugly but not tightly around the midfoot and heel. Ensure they don’t slip or cause any discomfort while running.


