Table of Contents
- Introduction
- Editor’s Choice
- General Personal Care Industry Statistics
- Shaving Market Overview
- Razors and Cartridge Razor Blades Sales Statistics
- Shaving Cream Sales Statistics
- Shaving Products Usage Frequency
- Razor Price Statistics
- Shaving Cream Price Statistics
- Gillette Shaving Foam for Men & its Users
- Consumer Preferences
- Expenditure on Shaving Needs Statistics
- Attitudes Towards Shavers & Razors Among Men
- Recent Developments
- Conclusion
- FAQs
Introduction
Shaving Statistics: Shaving is a grooming practice that involves hair removal from the skin’s surface, with methods including wet and dry shaving.
Essential tools include various types of razors (straight, safety, disposable, and electric), shaving creams or gels for lubrication, and aftershave products for post-shave care.
Preparation involves cleansing and hydrating the skin to soften hair, followed by applying shaving cream. It is generally recommended to shave in the direction of hair growth using light pressure to minimize irritation.
Post-shaving, rinsing with cool water, and applying moisturizer help soothe the skin. Proper maintenance of tools, including regular cleaning and drying of razors, is crucial for an effective shaving experience.
Editor’s Choice
- By 2029, the global shaving market revenue is anticipated to reach approximately USD 42.15 billion.
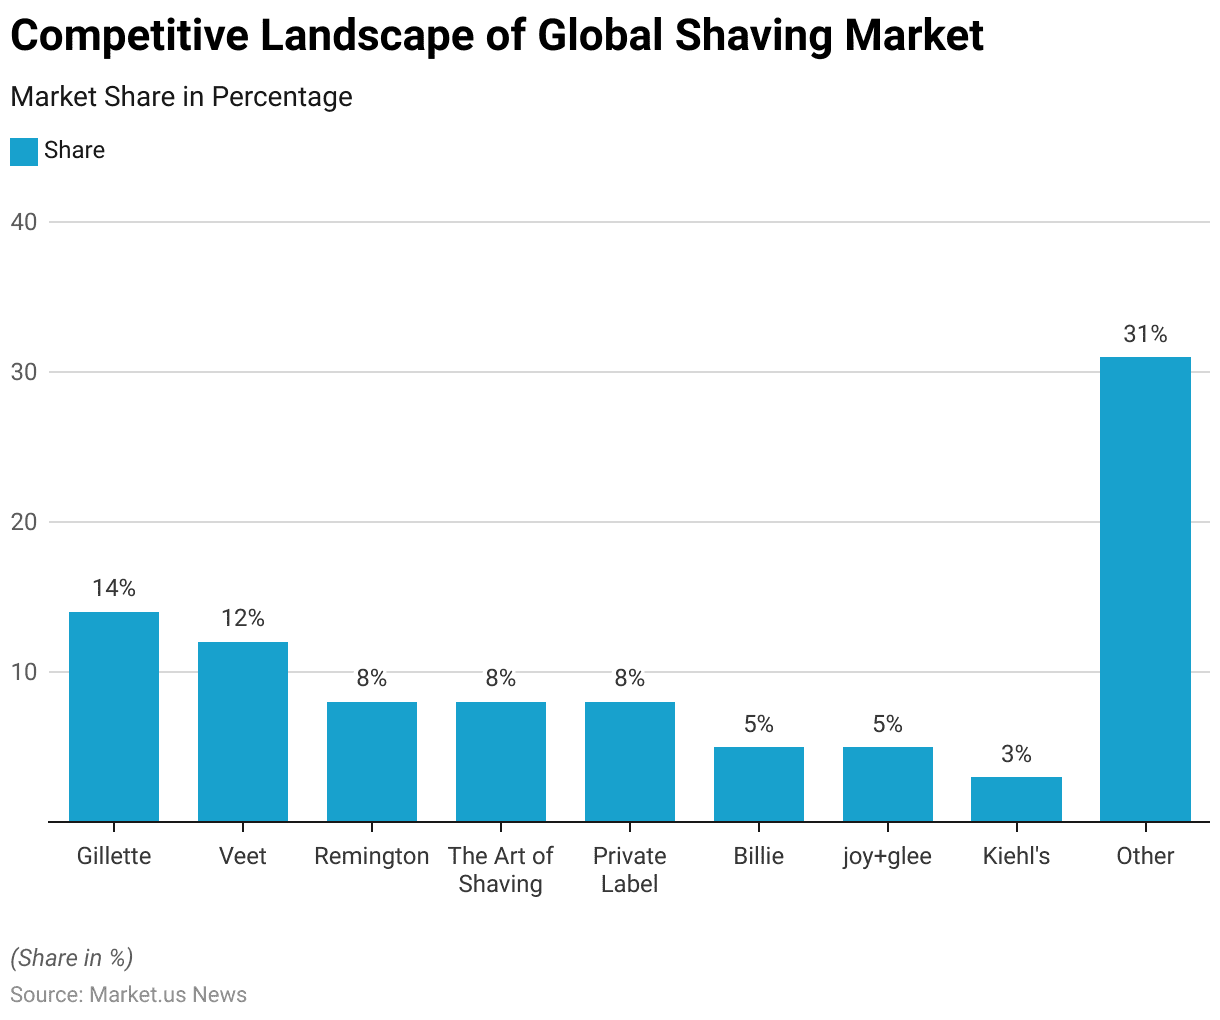
- A mix of established brands and emerging players characterized the competitive landscape of the global shaving market in 2022. Gillette held the largest market share at 14%.
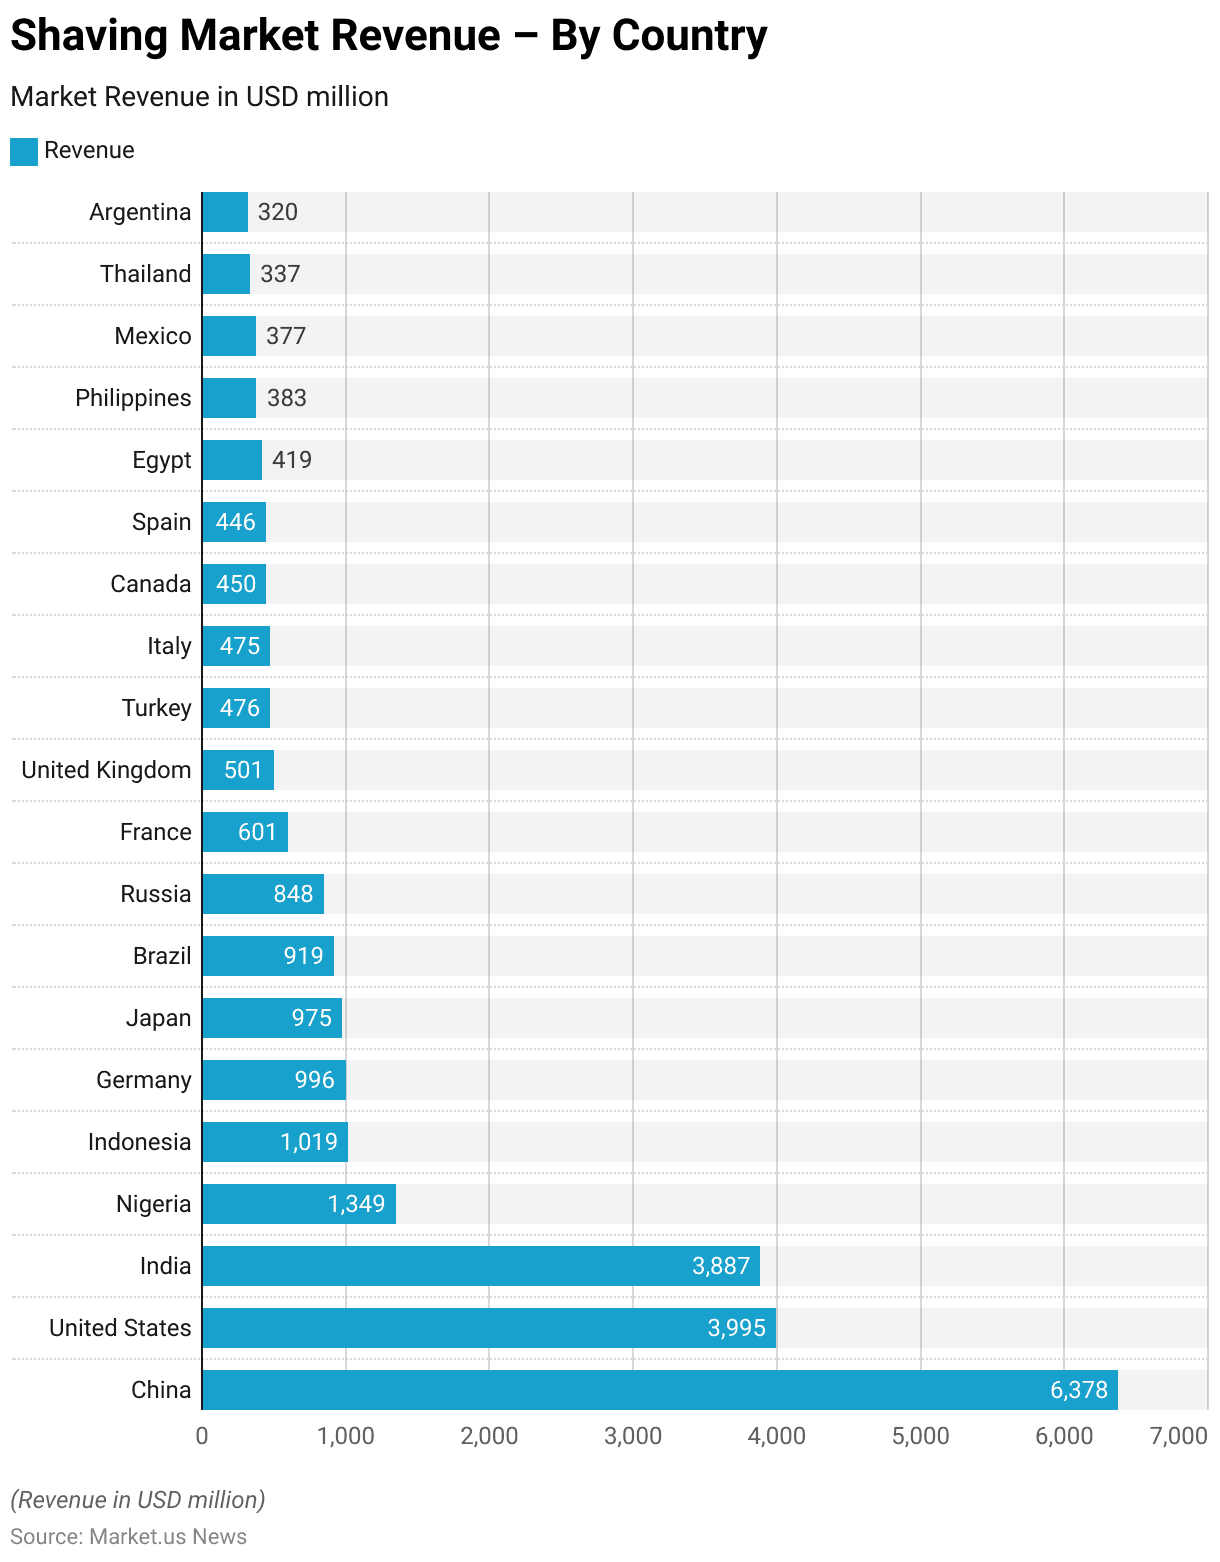
- In 2024, the global shaving market’s revenue distribution by country reveals significant regional variations, with China leading the market at USD 6,378 million.
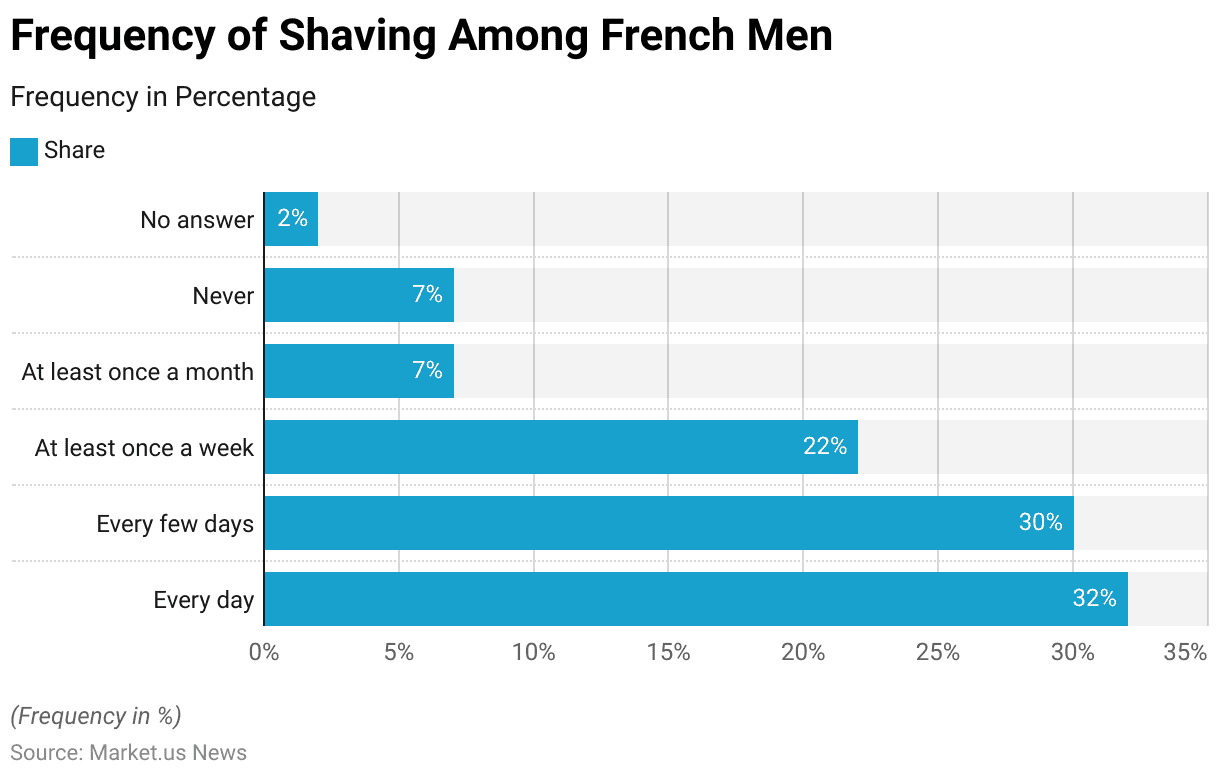
- In 2018, shaving frequency among French men varied significantly. A substantial portion, 32%, reported shaving every day.
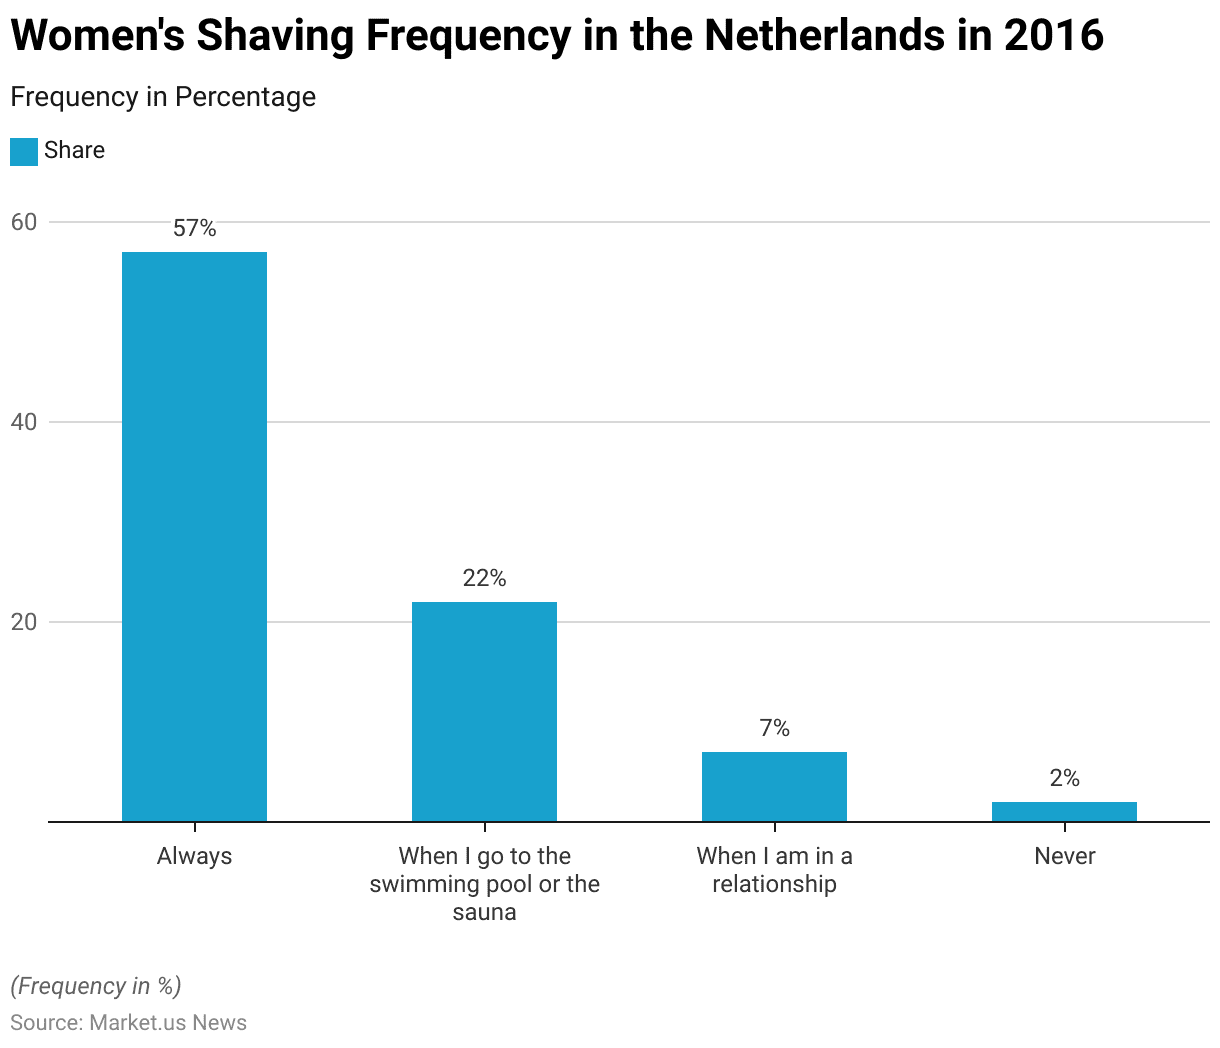
- In 2016, women’s shaving frequency in the Netherlands displayed varied practices. A majority of 57% of female respondents reported that they “always” shaved, indicating a consistent grooming routine.
- In 2023, brand loyalty among men in the United States for shavers and razors varied across leading brands. Gillette led with the highest loyalty, as 89% of respondents expressed a preference for it.
- In 2023, attitudes towards shavers and razors among men in the United States reflected a range of perspectives. The majority, 41%, expressed reliance on brands they know and trust for their shaving needs.
General Personal Care Industry Statistics
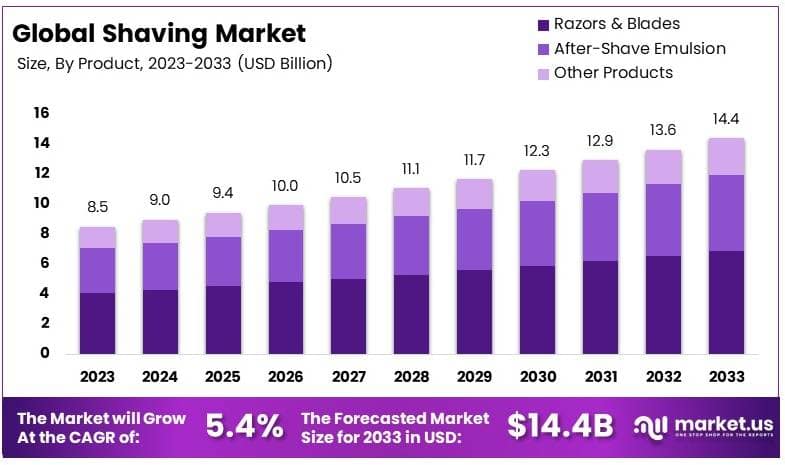
Global Beauty & Personal Care Market Revenue
- The global beauty and personal care market has shown a dynamic growth pattern from 2019 to 2029, reflecting both resilience and adaptation to changing consumer preferences.
- In 2019, the market generated USD 559.34 billion in revenue.
- However, in 2020, there was a decline to USD 530.79 billion, likely influenced by global disruptions due to the pandemic.
- The market rebounded in 2021, reaching USD 559.71 billion, and continued to grow to USD 581.89 billion in 2022.
- This upward trajectory persisted, with revenue reaching USD 627.42 billion in 2023 and further increasing to USD 648.56 billion in 2024.
- The market is expected to continue its expansion, reaching USD 670.22 billion in 2025.
- Although a slight dip to USD 649.69 billion is projected in 2026, the market is anticipated to resume its growth, with revenues climbing to USD 723.86 billion by 2027.
- The positive trend is expected to continue in the latter part of the decade, with revenues projected at USD 740.5 billion in 2028 and reaching USD 756.05 billion by 2029.
- This steady increase underscores the strong demand within the beauty and personal care market, driven by innovation, expanding consumer awareness, and a shift towards premium and personalized products.
(Source: Statista)
Global Skin Care Market Revenue
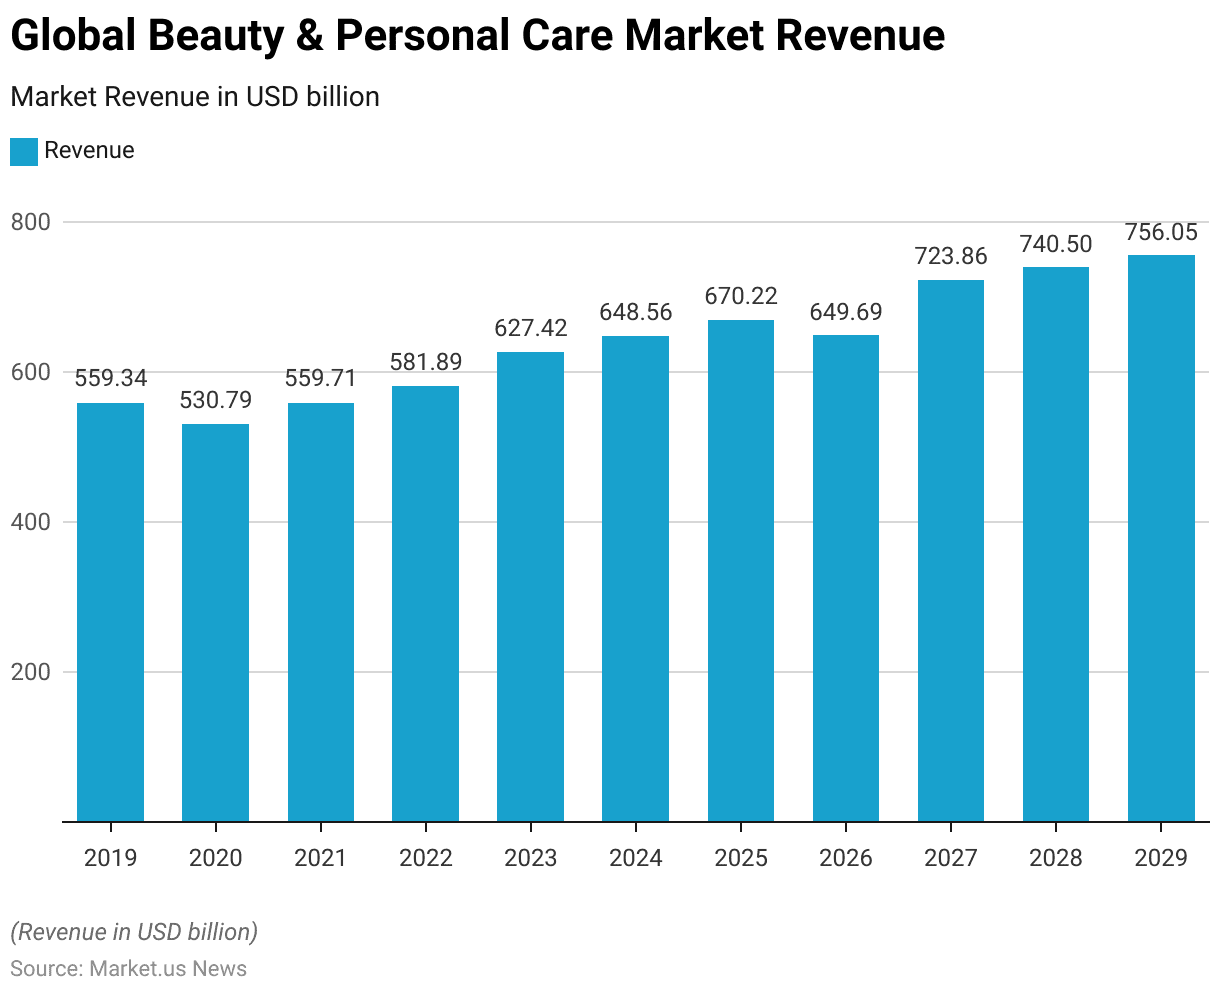
- The global skincare market has exhibited a robust growth trajectory from 2019 to 2029 despite some fluctuations.
- In 2019, the market generated a revenue of USD 163,785.91 million. This figure saw a slight dip in 2020, falling to USD 158,447.46 million, likely impacted by economic shifts and the global pandemic.
- However, recovery was swift, with the market rebounding to USD 164,357.41 million in 2021 and continuing to grow to USD 168,617.61 million in 2022.
- In 2023, the skincare market surged to USD 182,907.88 million, reflecting strong consumer demand for skincare products.
- This upward trend persisted through 2024 and 2025, with revenues of USD 188,584.60 million and USD 194,324.31 million, respectively.
- The market achieved a milestone in 2026, reaching over USD 200 billion with a total of USD 201,000.90 million. This growth continued steadily into 2027 with USD 209,042.61 million.
- An exceptional leap is projected in 2028, with the market revenue expected to reach USD 213,720.51 million, signifying accelerated growth likely driven by new product innovations, expanding consumer awareness, and heightened demand.
- By 2029, the market revenue is expected to reach USD 218,007.44 million, marking a sustainable growth path in the longer term. This data underscores the significant demand and expansion within the global skincare sector, fueled by trends in personal care, anti-aging products, and overall health consciousness.
(Source: Statista)
Men’s Personal Care Products Market Size
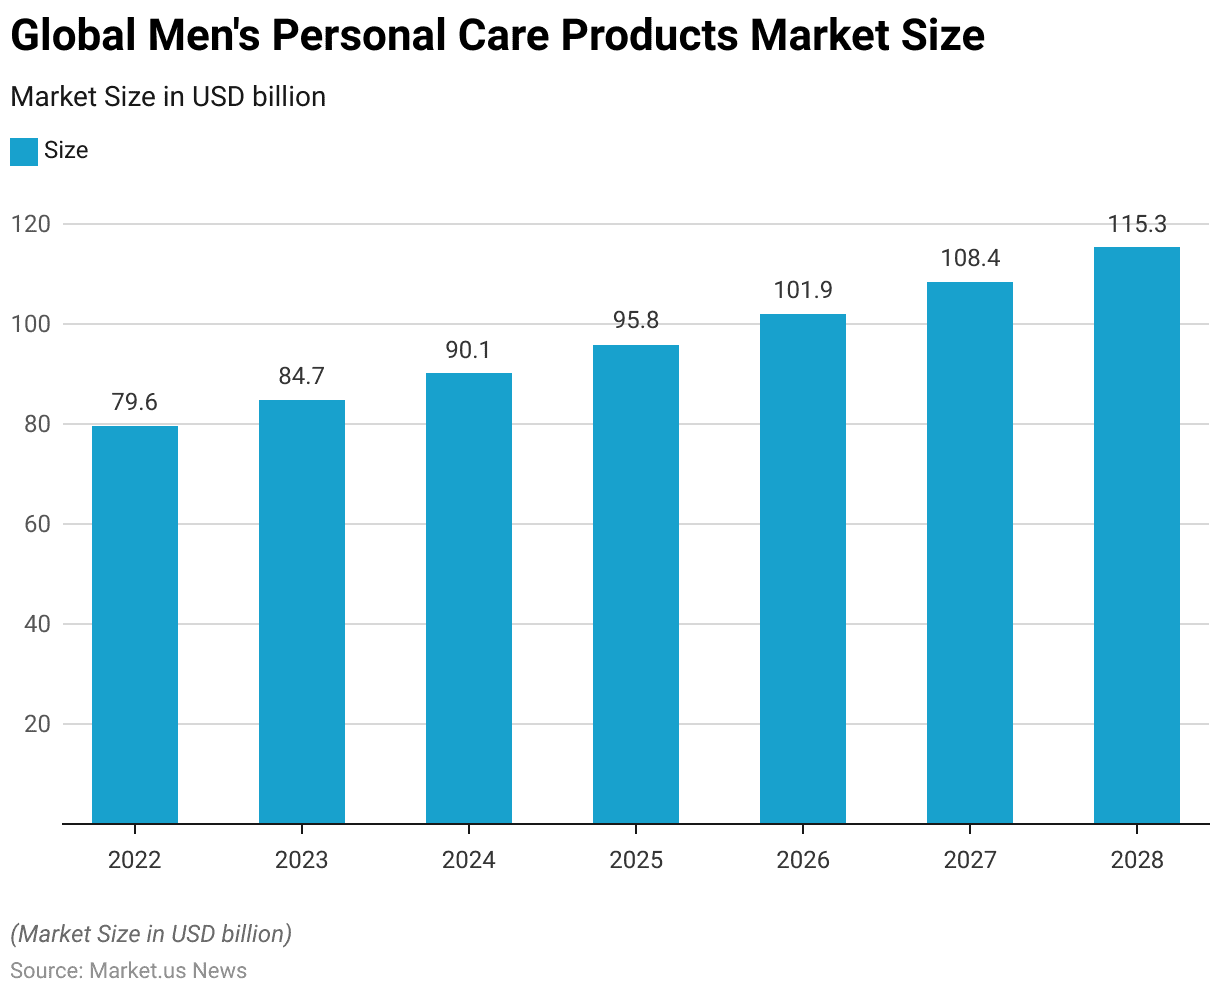
- The global men’s personal care products market is projected to experience substantial growth from 2022 to 2028.
- In 2022, the market size was valued at USD 79.6 billion, and it is expected to grow steadily, reaching USD 84.7 billion in 2023.
- This upward trend is anticipated to continue, with the market size estimated at USD 90.1 billion in 2024 and USD 95.8 billion in 2025.
- By 2026, the market is projected to surpass the USD 100 billion mark, reaching USD 101.9 billion, reflecting increasing consumer interest in male grooming and personal care products.
- Growth is expected to persist through 2027, with the market reaching USD 108.4 billion and further expanding to USD 115.3 billion by 2028.
- This consistent increase highlights a growing emphasis on personal care among male consumers, driven by trends in grooming, self-care, and the availability of specialized products targeting men’s unique needs.
(Source: Statista)
Shaving Market Overview
Global Shaving Market Size Statistics
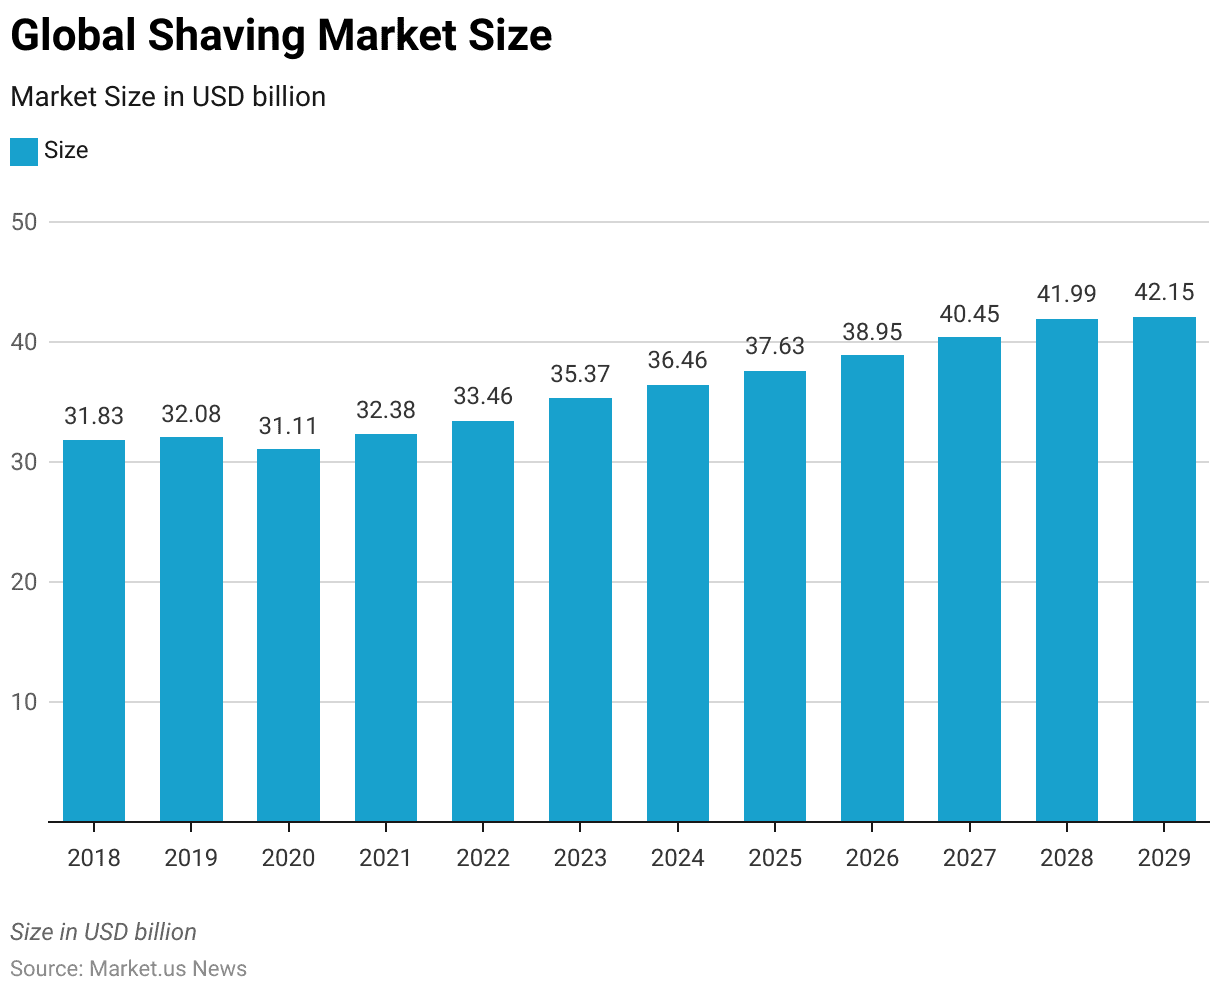
- The global shaving market has demonstrated a steady upward trajectory from 2018 to 2029 at a CAGR of 2.94%, with some fluctuations.
- In 2018, the market’s revenue was recorded at USD 31.83 billion, followed by a slight increase to USD 32.08 billion in 2019.
- However, 2020 saw a minor decline, with revenue decreasing to USD 31.11 billion.
- The market rebounded in 2021 with a revenue of USD 32.38 billion, continuing its growth in 2022, reaching USD 33.46 billion.
- This upward trend accelerated in the following years, as revenues increased to USD 35.37 billion in 2023 and further to USD 36.46 billion in 2024.
- Projections indicate that the market will maintain this growth trajectory, with revenues expected to reach USD 37.63 billion in 2025 and USD 38.95 billion in 2026.
- By 2027, the market is forecasted to generate USD 40.45 billion, followed by USD 41.99 billion in 2028.
- By 2029, the global shaving market revenue is anticipated to reach approximately USD 42.15 billion.
- This consistent growth reflects increasing consumer demand, driven by evolving grooming trends and expanding product innovations within the industry.
(Source: Statista)
Global Shaving Market Revenue Change Statistics
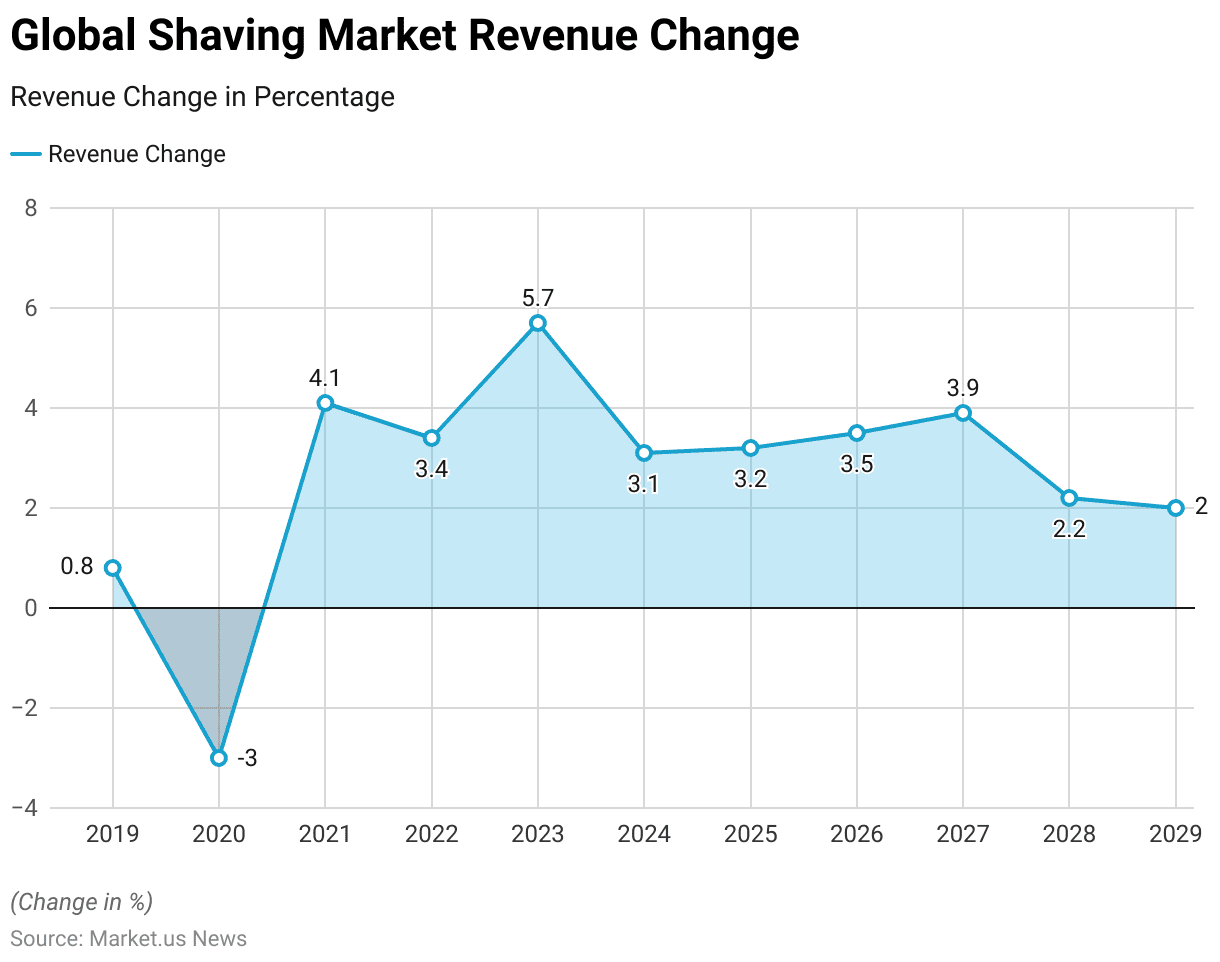
- The global shaving market has experienced varying rates of revenue growth between 2019 and 2029, reflecting shifts in consumer behavior and market conditions.
- In 2019, the market saw a modest increase of 0.8%.
- However, 2020 presented a setback with a revenue decline of 3.0%, likely due to disruptions caused by the global pandemic.
- Recovery began in 2021 with a notable growth rate of 4.1%, followed by a 3.4% increase in 2022.
- Growth surged in 2023 with a significant revenue expansion of 5.7%, the highest rate recorded over this period.
- The growth rate stabilized in the subsequent years, with a 3.1% increase in 2024 and a similar 3.2% rise in 2025.
- In 2026, the market continued its steady trajectory with a 3.5% growth, followed by a slightly higher increase of 3.9% in 2027.
- However, growth rates began to moderate in the final years, with a 2.2% increase in 2028 and a further slight reduction to 2.0% in 2029.
- This data suggests a trend of robust post-pandemic recovery, with growth gradually stabilizing towards the end of the decade as the market matures.
(Source: Statista)
Average Revenue Per Capita
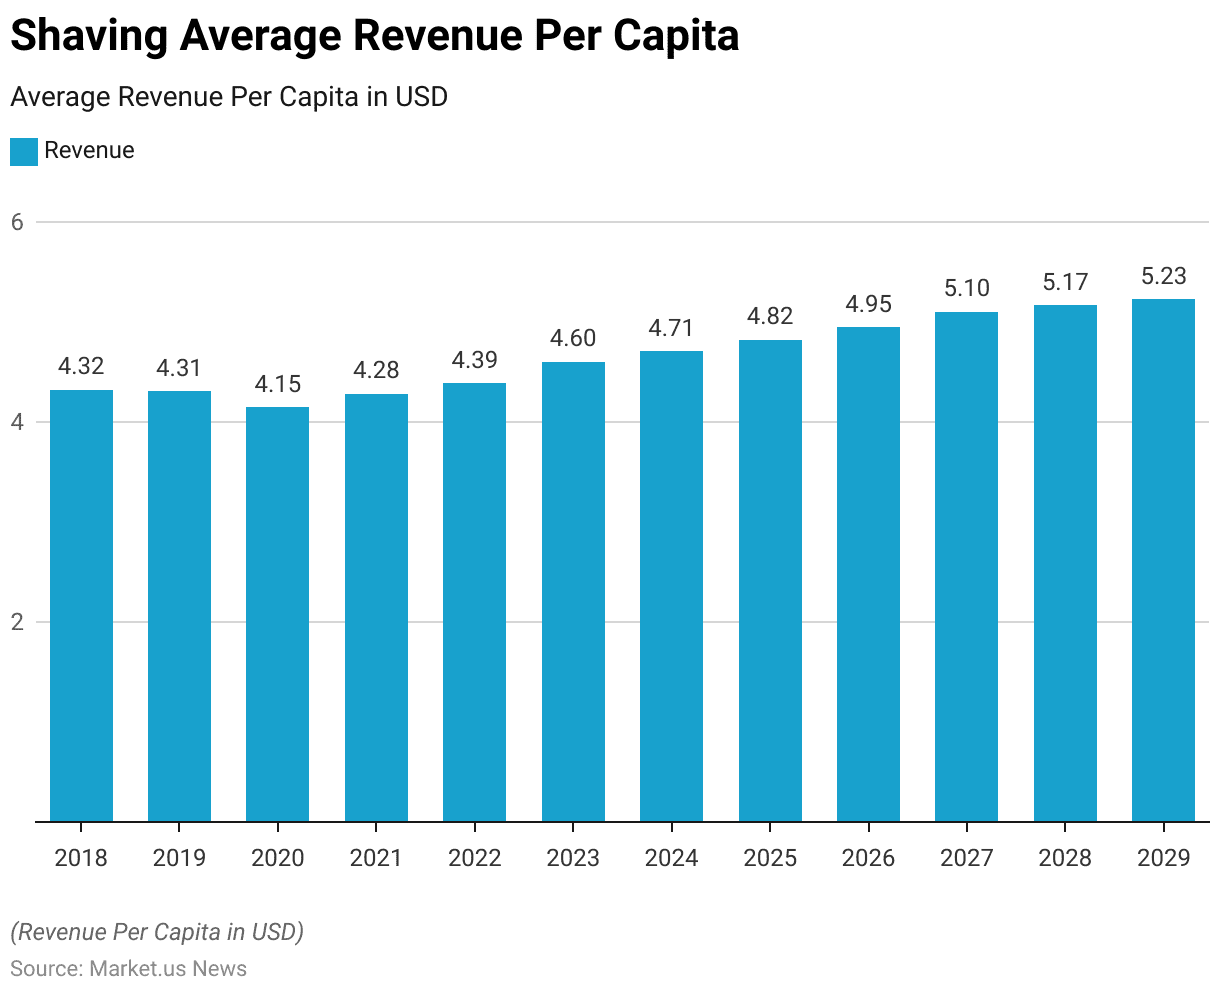
- The average revenue per capita in the global shaving market has exhibited a gradual upward trend from 2018 to 2029, with minor fluctuations in the initial years.
- In 2018, the per capita revenue stood at USD 4.32, experiencing a slight decline to USD 4.31 in 2019 and further to USD 4.15 in 2020.
- Recovery began in 2021, with the per capita revenue increasing to USD 4.28 and subsequently to USD 4.39 in 2022.
- In 2023, the revenue per capita reached USD 4.60, marking a notable increase.
- This growth continued steadily over the subsequent years, with the per capita figure projected to reach USD 4.71 in 2024 and USD 4.82 in 2025.
- By 2026, the per capita revenue is expected to climb to USD 4.95, surpassing the USD 5.00 mark by 2027 at USD 5.10.
- The trend is anticipated to continue, with per capita revenue reaching USD 5.17 in 2028 and USD 5.23 by 2029.
- This progressive rise in per capita revenue reflects an increasing expenditure on shaving products, likely driven by rising consumer preferences for grooming and higher-value product offerings in the market.
(Source: Statista)
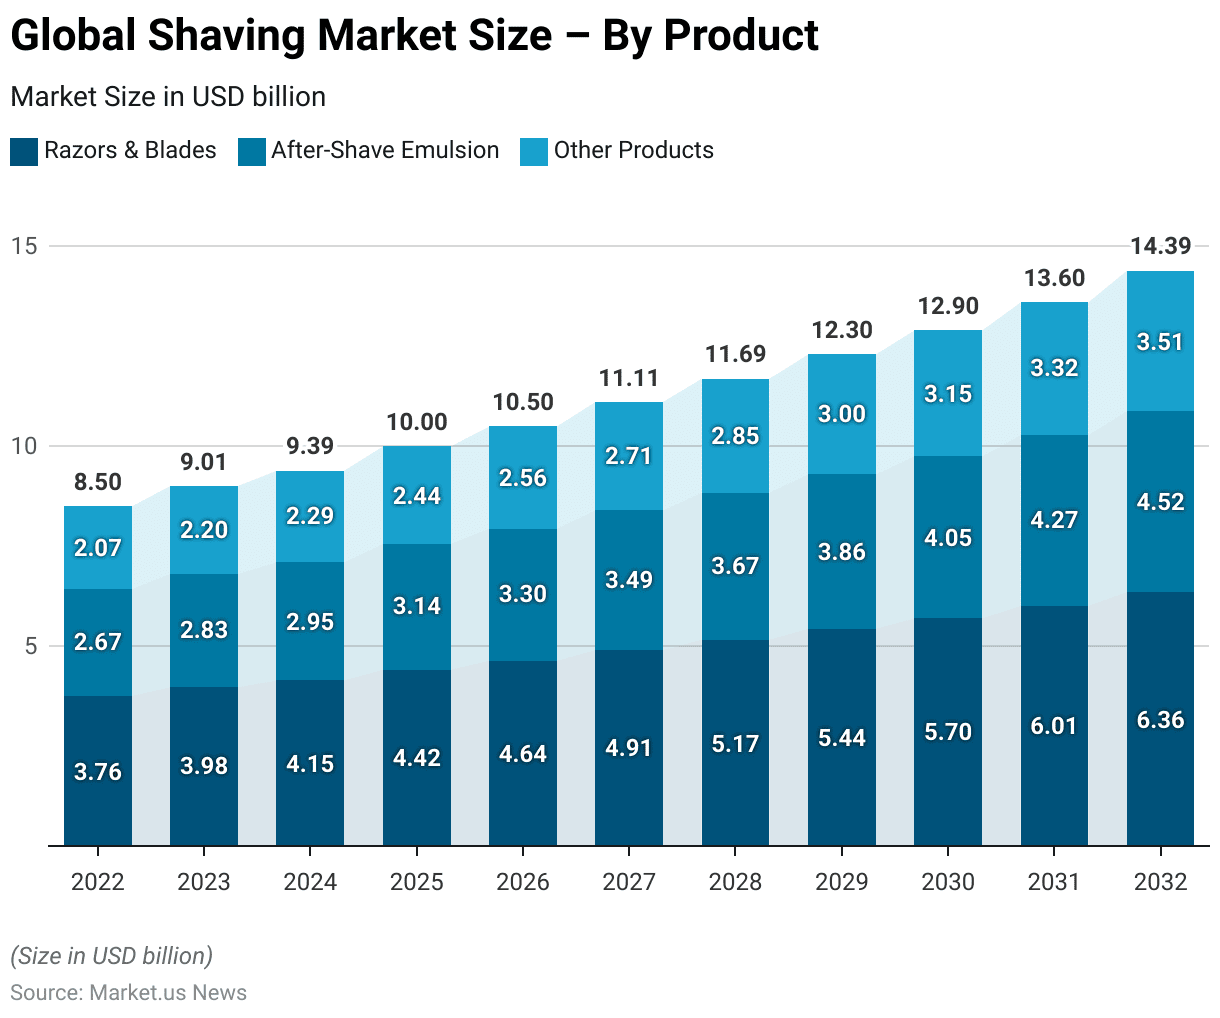
Global Shaving Market Size – By Product Statistics
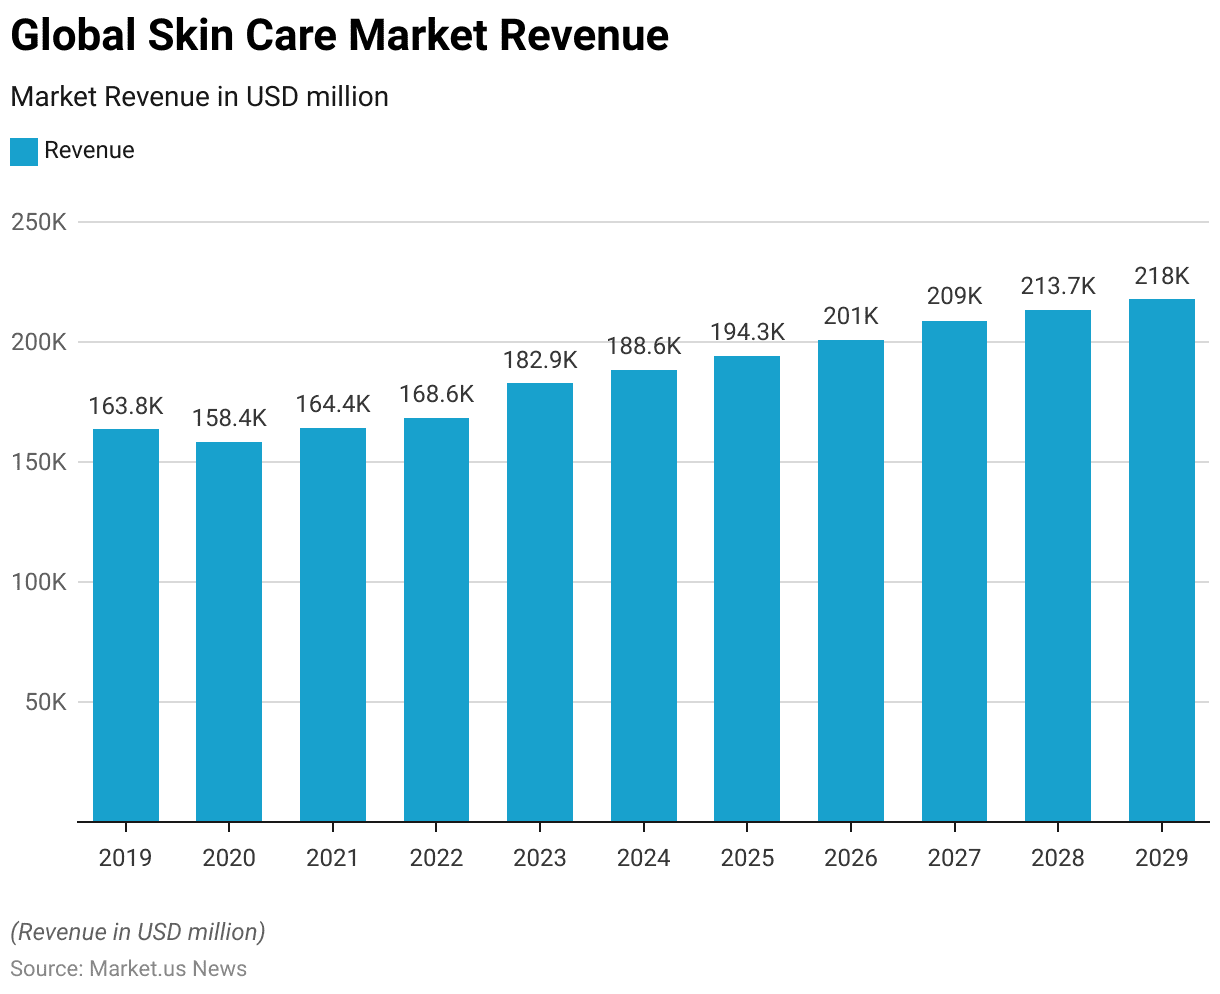
- The global shaving market, segmented by product types—Razors & Blades, Aftershave Emulsion, and Other Products—has shown consistent growth from 2022 to 2032.
- In 2022, the Razors & Blades segment led with USD 3.76 billion in revenue, followed by Aftershave Emulsion at USD 2.67 billion and Other Products at USD 2.07 billion.
- This trend continued with steady increases across all segments. By 2023, revenues rose to USD 3.98 billion for Razors & Blades, USD 2.83 billion for Aftershave Emulsion, and USD 2.20 billion for Other Products.
- Further growth is anticipated in the following years, with the Razors & Blades segment projected to reach USD 4.42 billion by 2025 and USD 5.44 billion by 2029.
- Similarly, the Aftershave Emulsion segment is expected to grow from USD 2.95 billion in 2024 to USD 3.86 billion by 2029. Other Products are projected to increase from USD 2.29 billion in 2024 to USD 3.00 billion by 2029.
- The decade concludes with significant growth across all segments: by 2032, Razors & Blades are anticipated to reach USD 6.36 billion, Aftershave Emulsion USD 4.52 billion, and Other Products USD 3.51 billion.
- This steady rise across all categories indicates expanding consumer demand and product innovation within the global shaving market, with each segment showing a consistent upward trajectory throughout the forecast period.
(Source: market.us)
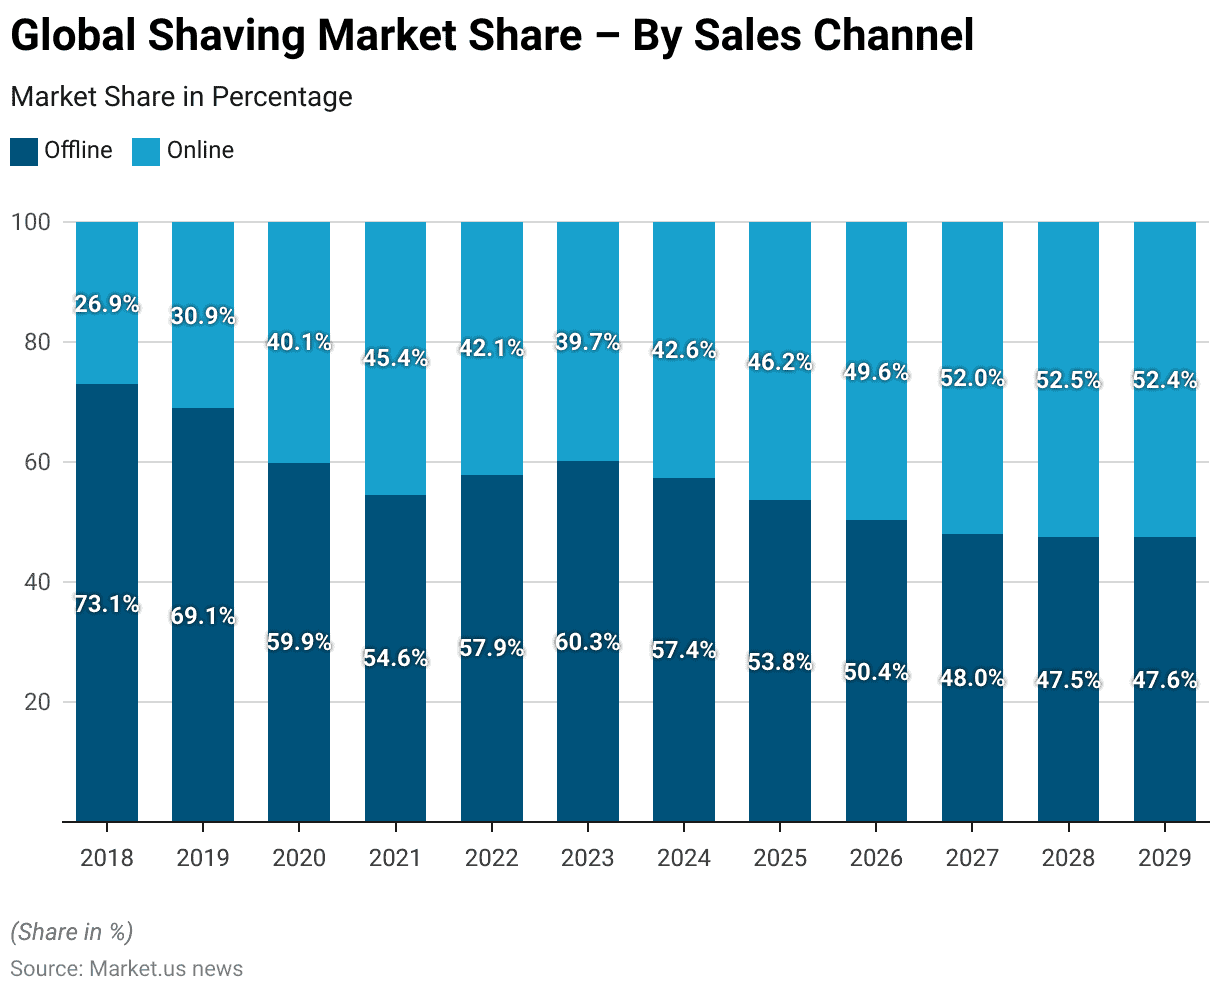
Global Shaving Market Share – By Sales Channel Statistics
2018-2023
- The global shaving market has seen a notable shift in sales channels from offline to online platforms between 2018 and 2023.
- In 2018, the offline channel dominated the market, holding 73.1% of the share compared to 26.9% for online sales.
- However, this dynamic began to change as consumer behavior increasingly favored online shopping.
- By 2019, the offline share had decreased to 69.1%, while the online share rose to 30.9%.
- This trend accelerated sharply in 2020, with offline sales dropping to 59.9% and online sales surging to 40.1%.
- The market continued to transition toward online sales, reaching a near balance in 2021, where offline and online shares were 54.6% and 45.4%, respectively.
- Though there was a slight fluctuation in 2022 and 2023, with offline shares at 57.9% and 60.3%, the general trend favored online channels, as indicated by the gradual increases in online sales to 42.1% and 39.7% for those years.
2024-2029
- The shift became more pronounced from 2024 onward.
- By 2025, online sales accounted for 46.2% of the market, and by 2026, the online channel nearly equaled offline with shares of 49.6% and 50.4%, respectively.
- By 2027, online sales had overtaken offline sales, reaching 52.0%.
- This trend solidified further by 2028 and 2029, with online channels capturing 52.5% and 52.4% of the market, respectively, compared to offline channels at 47.5% and 47.6%.
- This steady transition reflects the broader global trend of digitalization in retail, as consumers increasingly opt for the convenience and accessibility of online shopping, reshaping the sales dynamics in the global shaving market.
(Source: Statista)
Competitive Landscape of the Global Shaving Market Statistics
- A mix of established brands and emerging players characterized the competitive landscape of the global shaving market in 2022.
- Gillette held the largest market share at 14%, followed closely by Veet at 12%.
- Remington, The Art of Shaving, and Private Label brands each accounted for 8% of the market, collectively representing a significant portion of consumer preference within the shaving industry.
- Newer brands like Billie and joy+glee captured 5% of the market each, appealing to niche segments focused on innovation and personalization.
- Kiehl’s held a smaller share of 3%, reflecting its targeted approach within the premium shaving products segment.
- The remaining 31% of the market was distributed among various other brands, indicating a high level of fragmentation and the presence of numerous smaller players.
- This diverse composition highlights the competitive intensity within the global shaving market, with both established giants and newer entrants vying for consumer loyalty.
(Source: Statista)
Shaving Market Revenue – By Country Statistics
- In 2024, the global shaving market’s revenue distribution by country reveals significant regional variations, with China leading the market at USD 6,378 million.
- The United States follows as the second-largest market, generating USD 3,995 million, closely trailed by India, which contributed USD 3,887 million in revenue.
- Nigeria stands as the fourth-largest market, with a revenue of USD 1,349 million, followed by Indonesia at USD 1,019 million.
- Among European nations, Germany leads with USD 996 million, while Japan contributes USD 975 million to the market. Other significant markets include Brazil, which recorded USD 919 million, and Russia, with USD 848 million.
- France and the United Kingdom also represent important markets, generating USD 601 million and USD 501 million, respectively.
- Turkey and Italy have comparable market sizes, with revenues of USD 476 million and USD 475 million, respectively, while Canada’s market stands at USD 450 million, slightly ahead of Spain at USD 446 million.
- Egypt (USD 419 million), the Philippines (USD 383 million), and Mexico (USD 377 million) represent emerging markets with substantial growth potential.
- Lastly, Thailand and Argentina contribute USD 337 million and USD 320 million, respectively, underscoring the global reach and diverse demand within the shaving market.
(Source: Statista)
Razors and Cartridge Razor Blades Sales Statistics
Unit Sales of the Leading Razor Brands in the United States
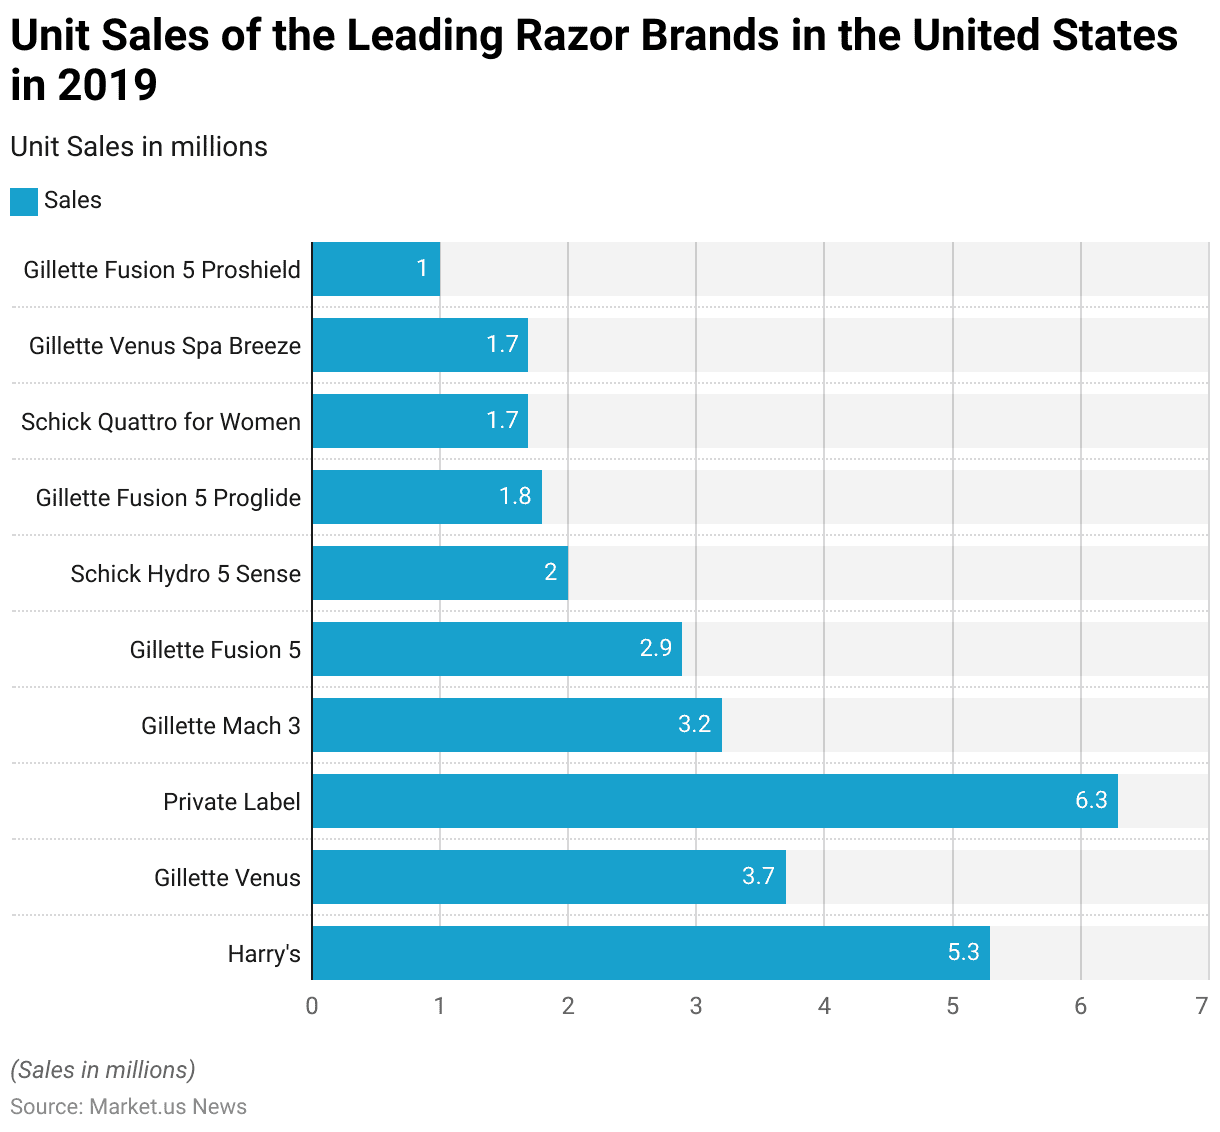
- In 2019, the leading razor brands in the United States demonstrated varying unit sales, highlighting consumer preferences across a range of products.
- Private Label razors led the market with 6.3 million units sold, followed by Harry’s with 5.3 million units, reflecting its popularity among consumers seeking quality and affordability.
- Gillette Venus came next with 3.7 million units sold, appealing particularly to female consumers.
- The Gillette Mach 3 model achieved 3.2 million unit sales, while the Gillette Fusion 5 followed with 2.9 million units sold.
- Schick Hydro 5 Sense recorded 2 million unit sales, showing competitive traction in the market.
- Additional Gillette products also maintained a significant presence, with the Fusion 5 Proglide selling 1.8 million units, the Venus Spa Breeze and Schick Quattro for Women, each reaching 1.7 million units, and the Fusion 5 Proshield recording 1 million units sold.
- This data indicates a competitive landscape within the U.S. razor market, with both legacy brands like Gillette and emerging brands such as Harry’s capturing considerable consumer interest.
(Source: Statista)
Percentage of Razor Sales in the United States – By Leading Brand
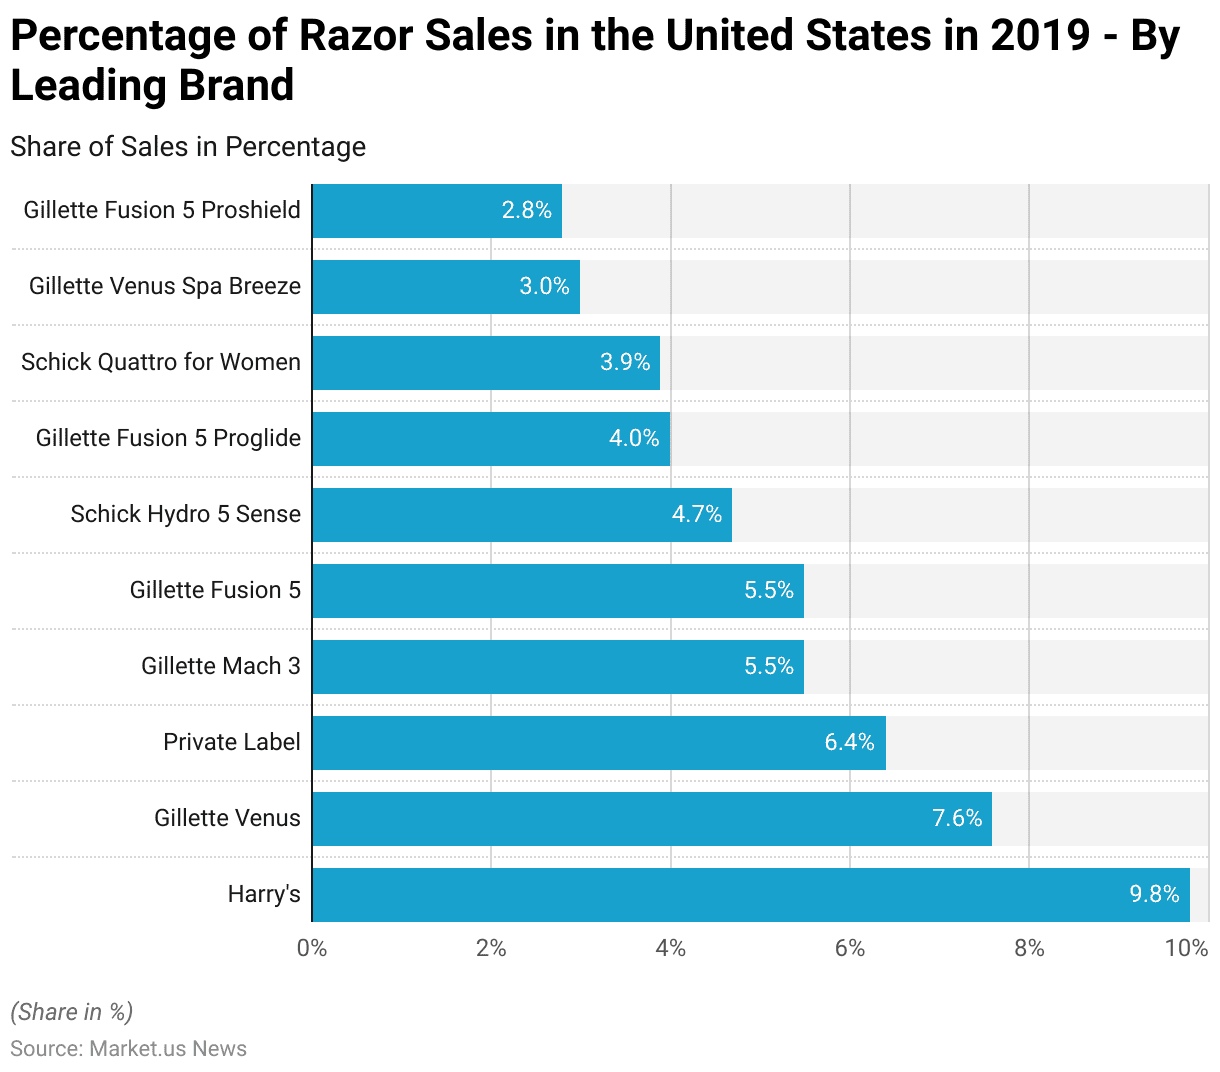
- In 2019, Harry’s led the U.S. razor market with a 9.8% share of total sales, reflecting its strong appeal among consumers.
- Gillette Venus followed, capturing 7.6% of the market, with Private Label razors close behind at 6.4%.
- Both Gillette Mach 3 and Gillette Fusion 5 held 5.5% of the market each, indicating their solid positions within the competitive landscape.
- Schick Hydro 5 Sense accounted for 4.7% of razor sales, while Gillette Fusion 5 Proglide held 4%.
- Schick Quattro for Women secured a 3.9% share, appealing primarily to female consumers.
- Gillette Venus Spa Breeze and Gillette Fusion 5 Proshield rounded out the top brands with 3% and 2.8% market shares, respectively.
- This distribution illustrates the highly competitive nature of the U.S. razor market, with a mix of established brands and emerging players, each securing significant portions of consumer purchases.
(Source: Statista)
Sales Growth of Leading Brands of Razors in the United States
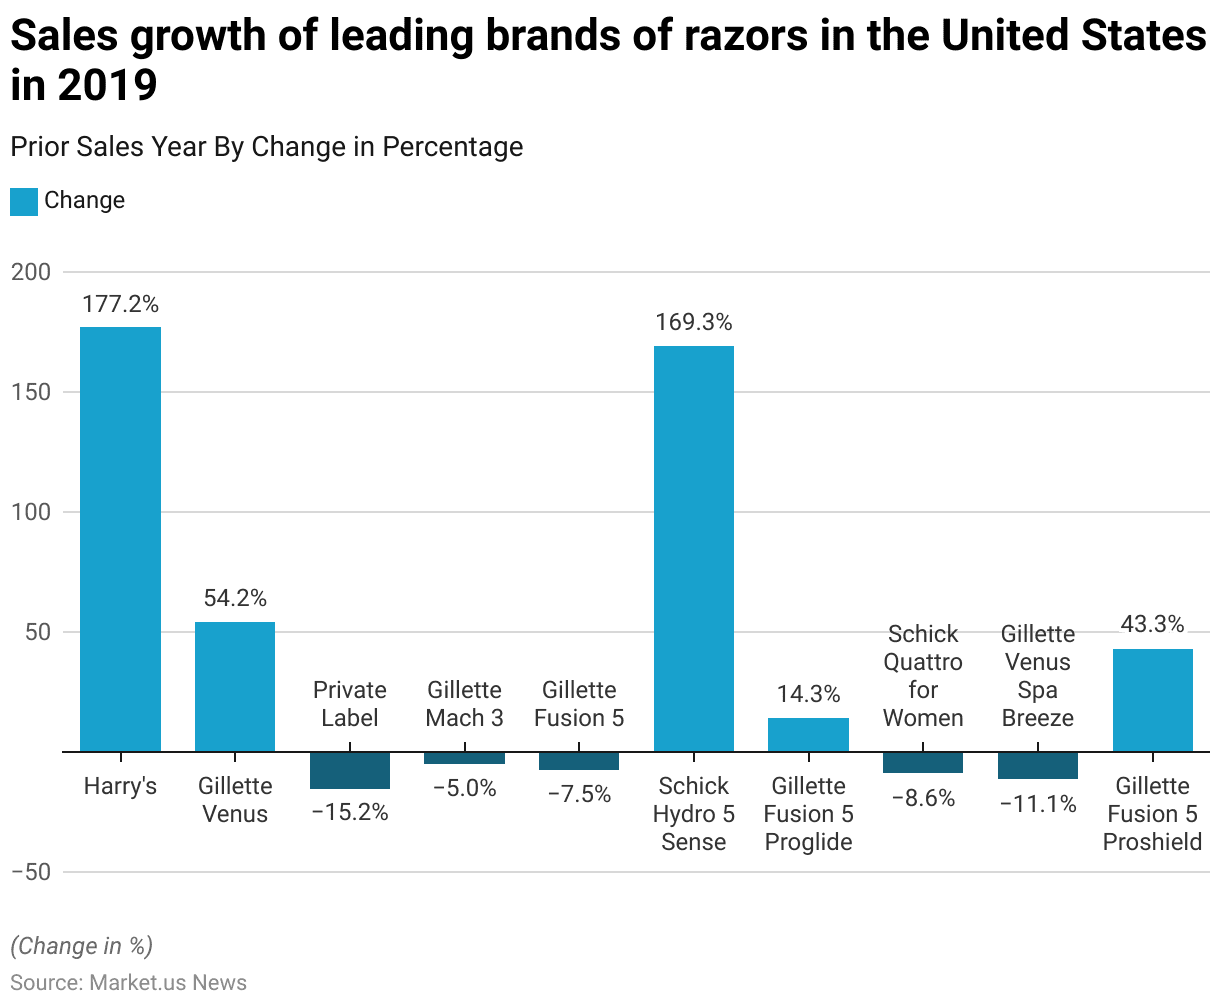
- In 2019, the U.S. razor market witnessed significant sales growth disparities among leading brands, with Harry’s and Schick Hydro 5 Sense experiencing remarkable gains.
- Harry’s recorded an impressive 177.2% increase in sales compared to the previous year, while Schick Hydro 5 Sense also saw substantial growth at 169.3%.
- Gillette Venus followed with a notable 54.2% increase in sales, indicating a strong market presence among female consumers.
- Gillette’s other products showed mixed results; the Fusion 5 Proshield saw a growth of 43.3%, and the Fusion 5 Proglide recorded a 14.3% increase.
- Conversely, several brands experienced declines, with Private Label razors dropping by 15.2%, Gillette Venus Spa Breeze by 11.1%, Schick Quattro for Women by 8.6%, Gillette Fusion 5 by 7.5%, and Gillette Mach 3 by 5%.
- These variations underscore the competitive dynamics of the razor market, with certain brands benefiting from evolving consumer preferences while others face challenges in retaining or growing their market share.
(Source: Statista)
Unit sales of the Leading Cartridge Razor Blade Brands in the United States
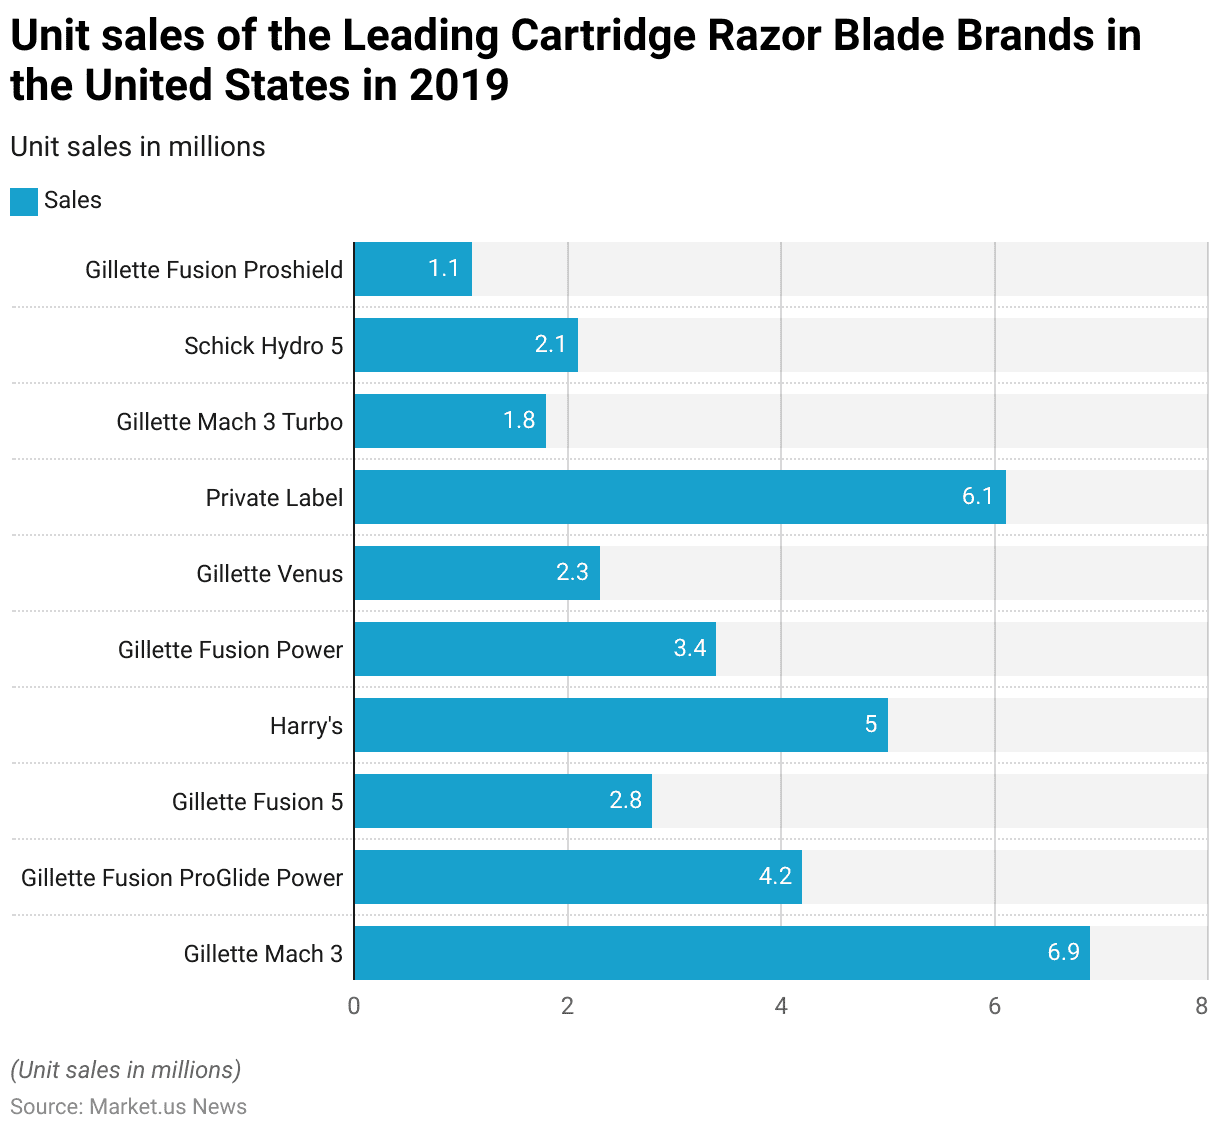
- In 2019, the leading cartridge razor blade brands in the United States displayed diverse unit sales figures, underscoring varied consumer preferences.
- Gillette Mach 3 led the category with 6.9 million units sold, followed closely by Private Label brands, which achieved 6.1 million units in sales.
- Harry’s also demonstrated strong performance, selling 5 million units, reflecting its growing popularity in the market.
- Among other Gillette products, the Fusion ProGlide Power sold 4.2 million units, and the Fusion Power recorded 3.4 million units.
- The Gillette Fusion 5 and Gillette Venus followed, with sales of 2.8 million and 2.3 million units, respectively.
- Additional contributions came from the Schick Hydro 5 with 2.1 million units, the Gillette Mach 3 Turbo with 1.8 million units, and the Gillette Fusion Proshield with 1.1 million units sold.
- These figures reveal a competitive landscape within the U.S. cartridge razor blade market, with both traditional brands like Gillette and newer entrants like Harry’s securing substantial consumer interest across various product offerings.
(Source: Statista)
Market Share of the Leading Cartridge Razor Blade Brands Sales in the United States
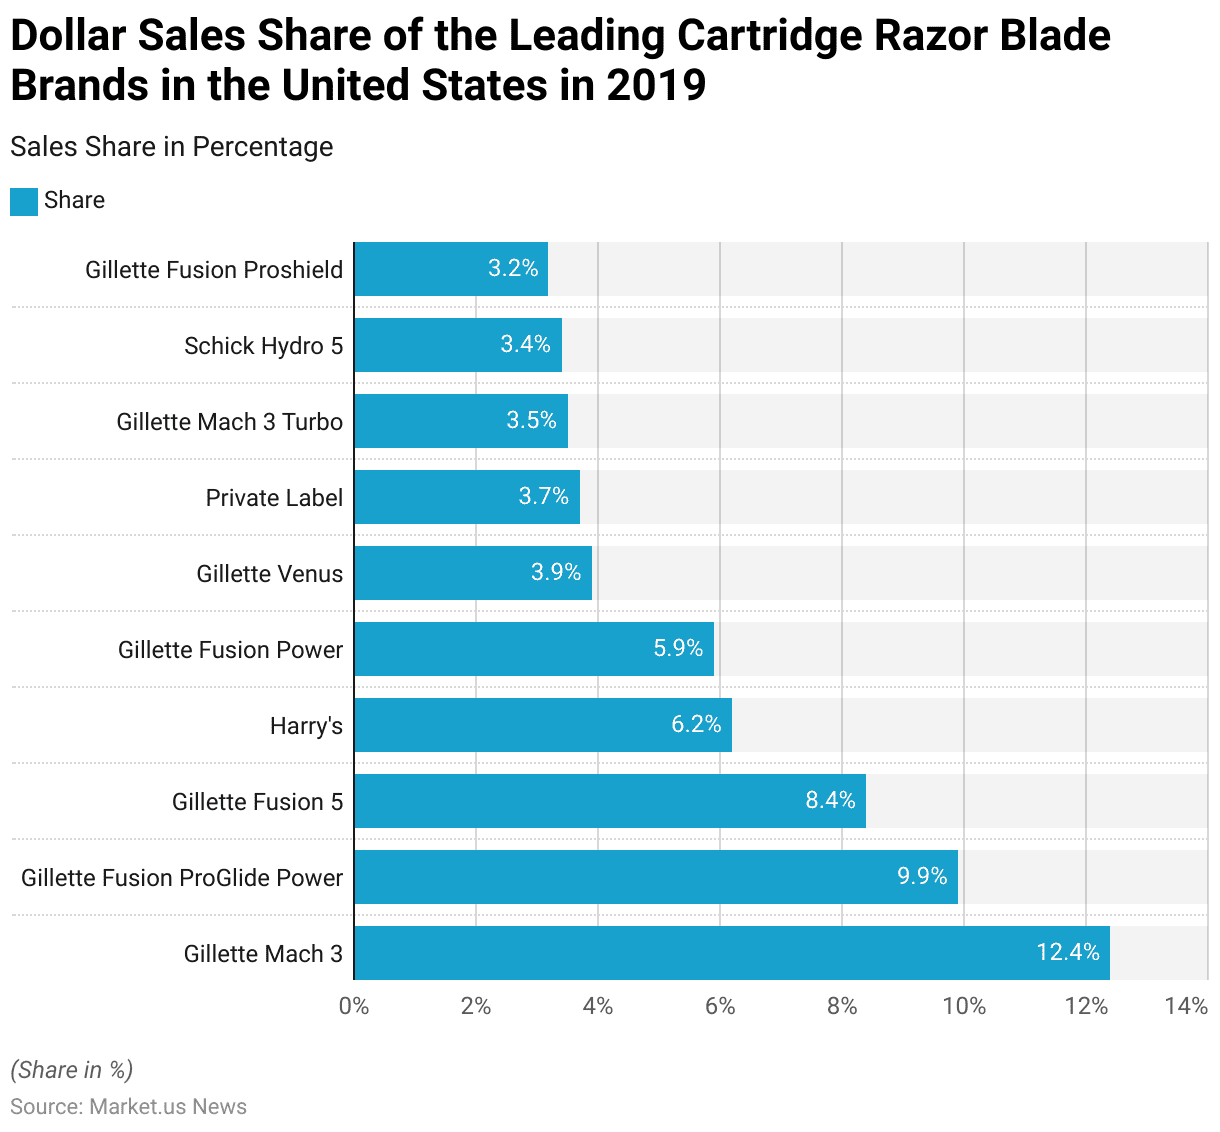
- In 2019, the U.S. cartridge razor blade market was dominated by several key brands, with Gillette Mach 3 leading in dollar sales share at 12.4%.
- Following this, Gillette Fusion ProGlide Power held a significant 9.9% share, while Gillette Fusion 5 accounted for 8.4%.
- Harry’s, an emerging competitor in the market, captured 6.2% of dollar sales, reflecting its growing influence among consumers.
- Other notable contributions came from Gillette Fusion Power, which secured 5.9%, and Gillette Venus, with 3.9%, showcasing a steady presence in the women’s segment.
- Private-label brands held a 3.7% share, indicating a preference for affordable alternatives.
- Additionally, Gillette Mach 3 Turbo recorded a 3.5% share, while Schick Hydro 5 and Gillette Fusion Proshield held 3.4% and 3.2% shares, respectively.
- This distribution highlights the strong market position of Gillette’s various products, complemented by the competitive performance of brands like Harry’s and Private Label offerings in the cartridge razor blade segment.
(Source: Statista)
Shaving Cream Sales Statistics
Unit Sales of the Leading Shaving Cream Brands in the United States Statistics
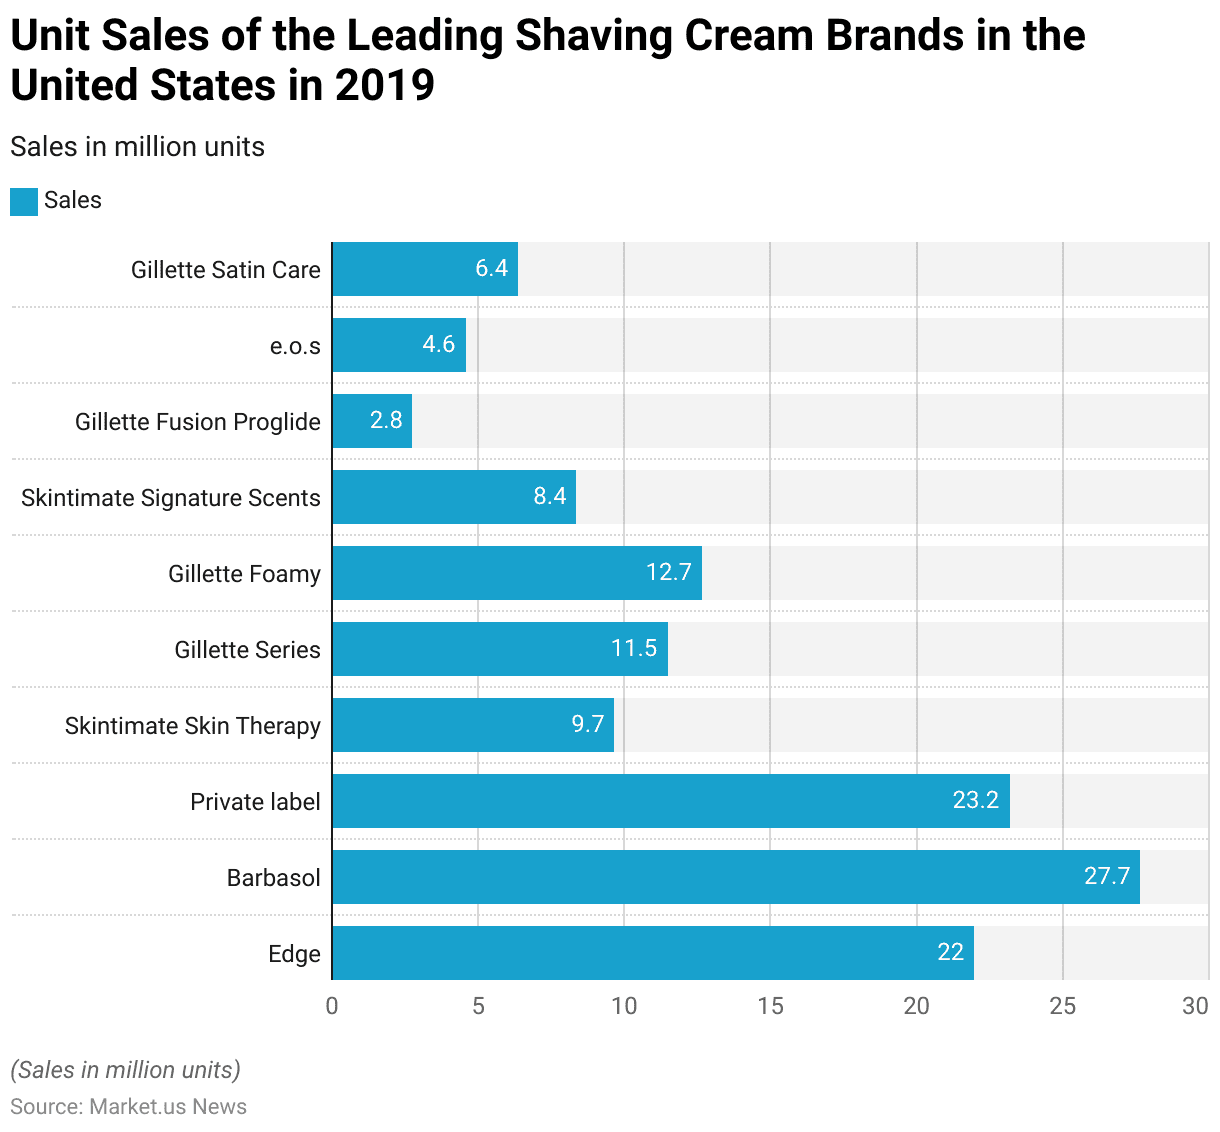
- In 2019, the U.S. shaving cream market was led by Barbasol, which achieved the highest unit sales at 27.7 million.
- Private label brands followed closely with 23.2 million units, reflecting consumer interest in affordable options.
- Edge also demonstrated a strong presence, with 22 million units sold.
- Among other notable brands, Gillette Foamy recorded 12.7 million units in sales, while the Gillette Series contributed 11.5 million units.
- Skintimate’s products were also popular, with Skintimate Skin Therapy selling 9.7 million units and Skintimate Signature Scents reaching 8.4 million units.
- Gillette Satin Care sold 6.4 million units, and e.o.s followed with 4.6 million units.
- Additionally, Gillette Fusion Proglide shaving cream had sales of 2.8 million units.
- This diverse sales distribution underscores the competitive nature of the shaving cream market in the United States, with both established brands and private-label products capturing significant consumer demand.
(Source: Statista)
Sales Growth of Leading Shaving Cream Brands in the United States Statistics
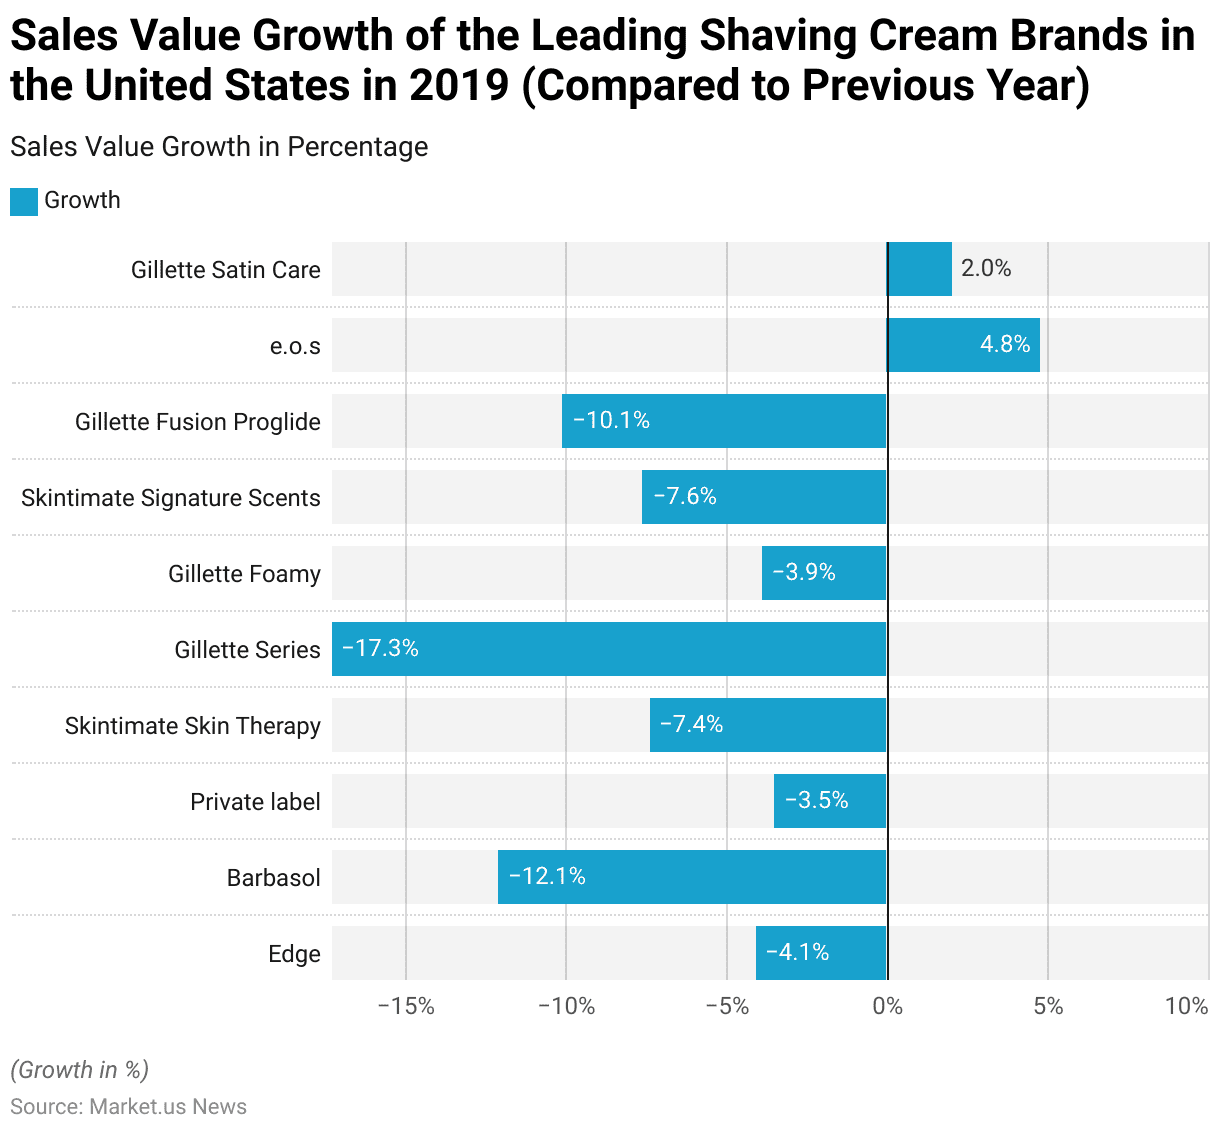
- In 2019, the U.S. shaving cream market saw mixed sales growth among leading brands, with most experiencing declines compared to the previous year.
- Edge reported a decrease of 4.1% in sales value, while Barbasol faced a significant drop of 12.1%.
- Private-label shaving creams also experienced a slight decline of 3.5%, and Skintimate Skin Therapy’s sales fell by 7.4%.
- The Gillette Series saw the most substantial decline, with a decrease of 17.3%, and Gillette Foamy’s sales dropped by 3.9%.
- Skintimate Signature Scents and Gillette Fusion Proglide recorded declines of 7.6% and 10.1%, respectively.
- However, not all brands showed negative growth; e.o.s experienced a positive sales growth of 4.8%, and Gillette Satin Care recorded a modest increase of 2%.
- These figures highlight a challenging year for several well-established brands in the shaving cream market, with only a few brands like e.o.s and Gillette Satin Care showing resilience in an otherwise competitive environment.
(Source: Statista)
Sales Share of the Leading Shaving Cream Brands in the United States Statistics
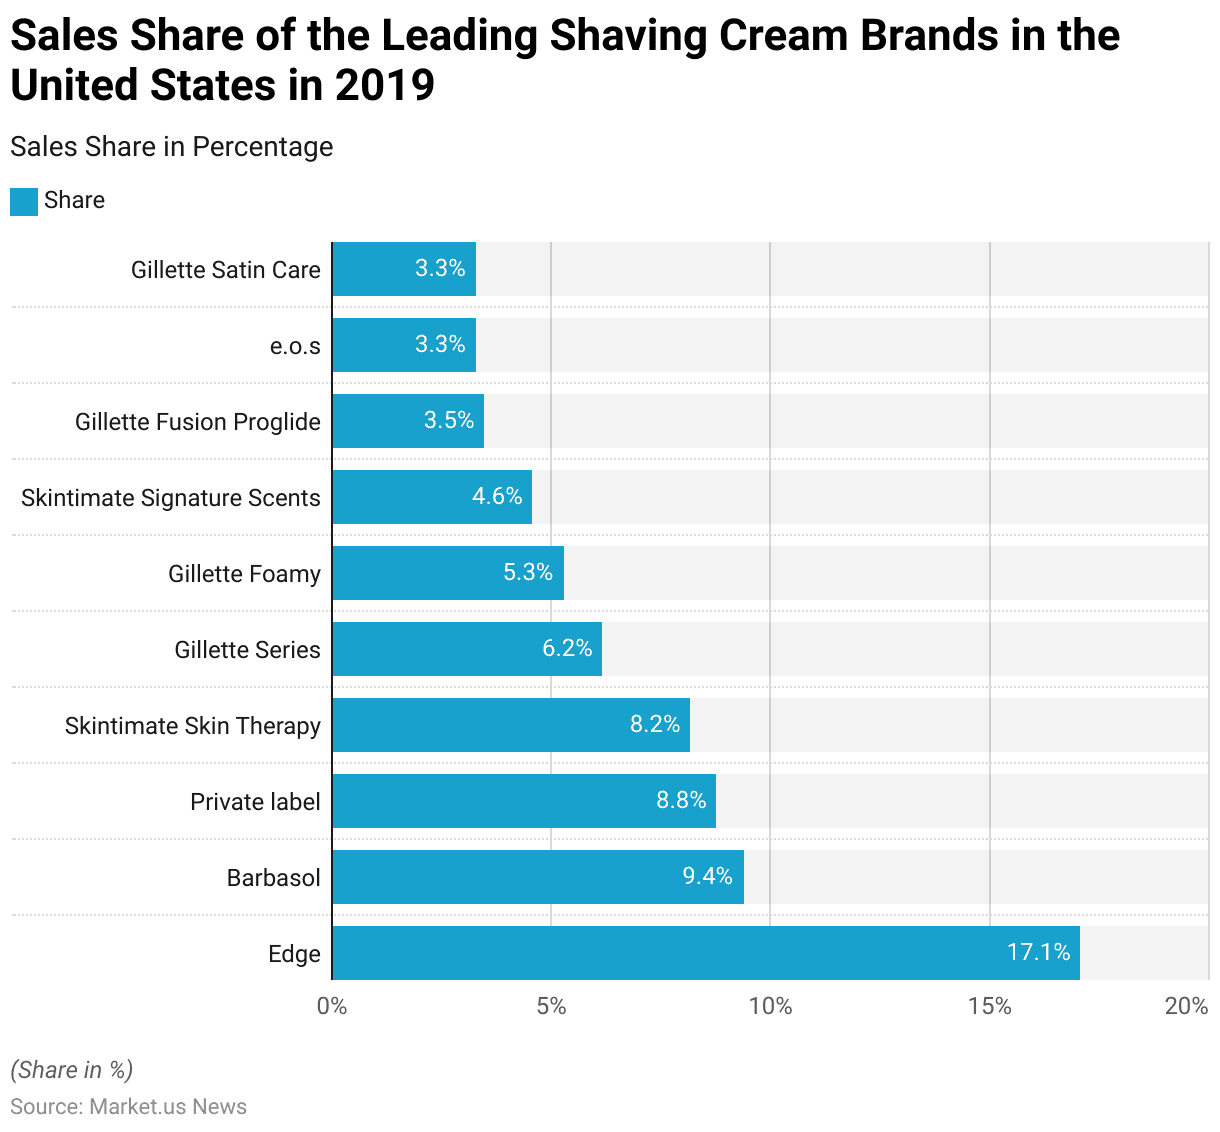
- In 2019, Edge led the U.S. shaving cream market with a dominant 17.1% share of total sales, followed by Barbasol with a 9.4% share, showcasing its strong consumer base.
- Private label products held an 8.8% market share, appealing to cost-conscious consumers, while Skintimate Skin Therapy captured 8.2%, reflecting its popularity among female consumers.
- Gillette Series contributed 6.2% of total sales, and Gillette Foamy held a 5.3% share, further establishing Gillette’s presence in the market.
- Skintimate Signature Scents accounted for 4.6% of sales, while Gillette Fusion Proglide held a 3.5% share.
- Both e.o.s and Gillette Satin Care achieved a 3.3% share each.
- This distribution highlights a competitive market landscape, with both established brands and private label options securing substantial portions of consumer preference in the U.S. shaving cream market.
(Source: Statista)
Shaving Products Usage Frequency
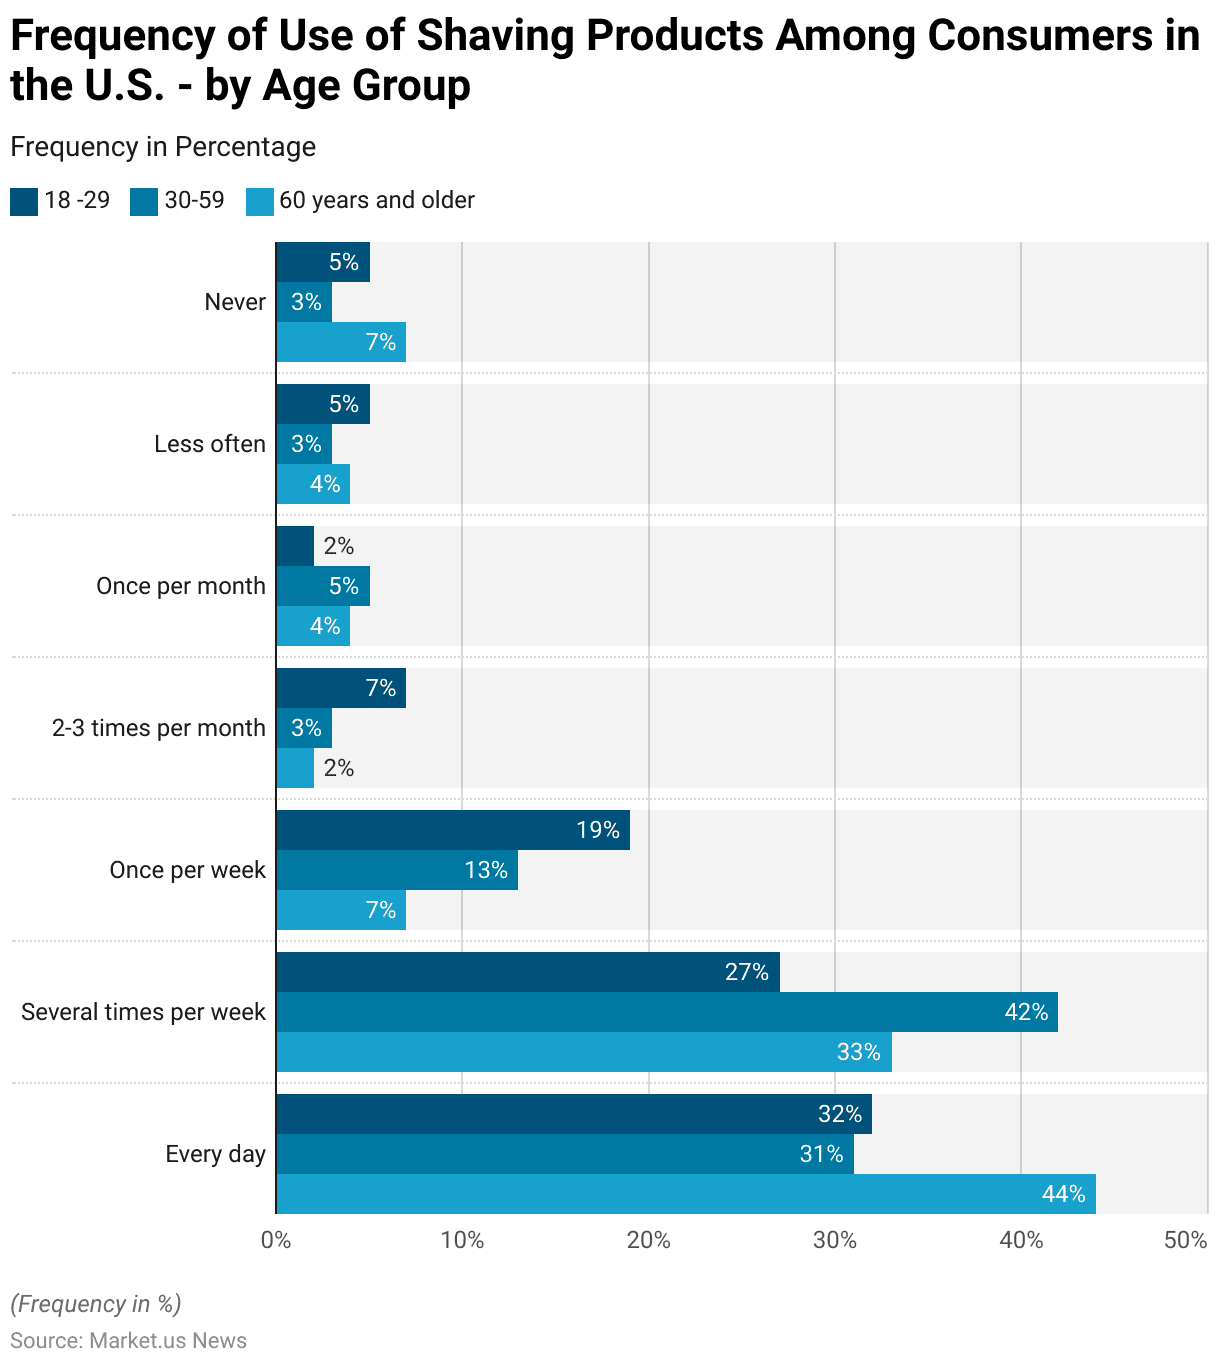
Frequency of Use of Shaving Products Among Consumers – by Age Group Statistics
- As of May 2017, the frequency of shaving product use among U.S. consumers varied notably across age groups.
- In the 60-year-old and older demographic, 44% of respondents reported shaving daily, which is the highest daily usage rate among all age groups. In comparison, 32% of individuals aged 18-29 and 31% of those aged 30-59 shaved every day.
- For shaving several times per week, the 30-59 age group had the highest rate at 42%, followed by 33% of those 60 and older and 27% of the 18-29 group.
- Weekly shaving was most common among younger adults aged 18-29, with 19% reporting once-per-week use, compared to 13% of the 30-59 age group and 7% of those 60 and older.
- Shaving two to three times per month was less common, with 7% in the 18-29 group, 3% in the 30-59 range, and 2% of those 60 and older.
- Monthly use showed minimal variation, with 5% of the 30-59 group and around 4% of those 60 and older reporting such a frequency, while only 2% of the youngest group did so.
- Infrequent shaving (less than once per month) was reported by 5% of those aged 18-29, 3% of the 30-59 group, and 4% of the 60-plus demographic.
- Lastly, 7% of consumers 60 and older reported never using shaving products, compared to 5% of those 18-29 and 3% of those aged 30-59, highlighting a trend towards reduced shaving frequency with age. This data reflects diverse grooming habits across different age demographics in the U.S.
(Source: Statista)
Shaving Frequency Among Men Statistics
- In 2018, shaving frequency among French men varied significantly.
- A substantial portion, 32%, reported shaving every day, while 30% shaved every few days, indicating a high frequency of grooming within the population.
- Additionally, 22% of French men shaved at least once a week, while a smaller group, 7%, shaved at least once a month.
- Notably, 7% of respondents indicated that they never shaved, reflecting a segment embracing a non-shaving lifestyle.
- Lastly, 2% of participants provided no answer regarding their shaving frequency.
- This distribution highlights diverse grooming habits among French men, with daily and frequent shaving remaining predominant.
(Source: Statista)
Frequency of Shaving Foam and Shaving Gel Use Among Male Consumers – By Age Group Statistics
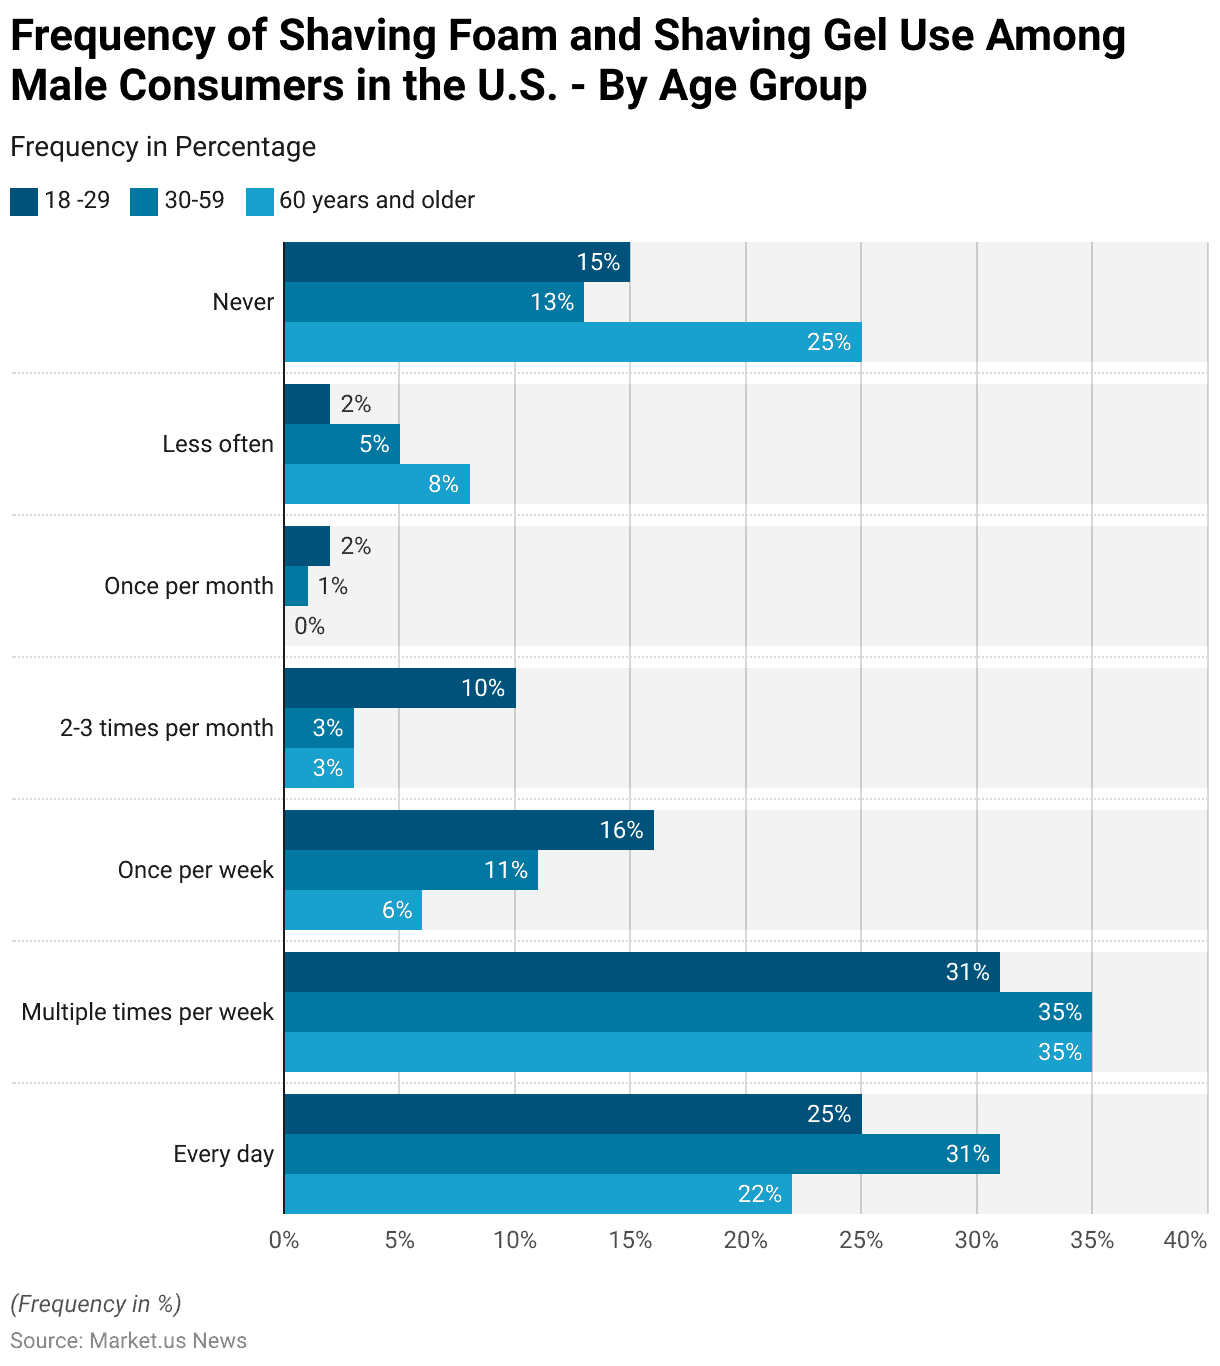
- As of June 2017, the frequency of shaving foam and gel usage among male consumers in the United States exhibited variation across age groups.
- Among males aged 30-59, 31% reported using these products daily, the highest daily usage rate compared to 25% in the 18-29 age group and 22% among those 60 and older.
- A substantial proportion in the 30-59 and 60-plus age groups reported using shaving products multiple times per week, both at 35%, slightly higher than the 31% usage rate in the 18-29 group.
- Weekly usage was most prevalent among younger males, with 16% of those aged 18-29 using shaving foam or gel once per week, compared to 11% in the 30-59 group and just 6% among men aged 60 and above.
- Usage rates two to three times per month were highest among younger men (10%), while only 3% in both the 30-59 and 60-plus groups reported this frequency.
- Infrequent usage patterns showed slight differences; only 2% of 18-29-year-olds used these products once per month, while 5% of the 30-59 group and 8% of the 60-plus group used them less often than once per month.
- Notably, a significant portion of the older male demographic (25%) reported never using shaving foam or gel, compared to 15% of the 18-29 age group and 13% of those aged 30-59.
- This data highlights a decline in shaving product usage frequency with age, particularly among the 60-plus demographic.
(Source: Statista)
Men’s Shaving Product Usage – By Frequency Statistics
2014-2017
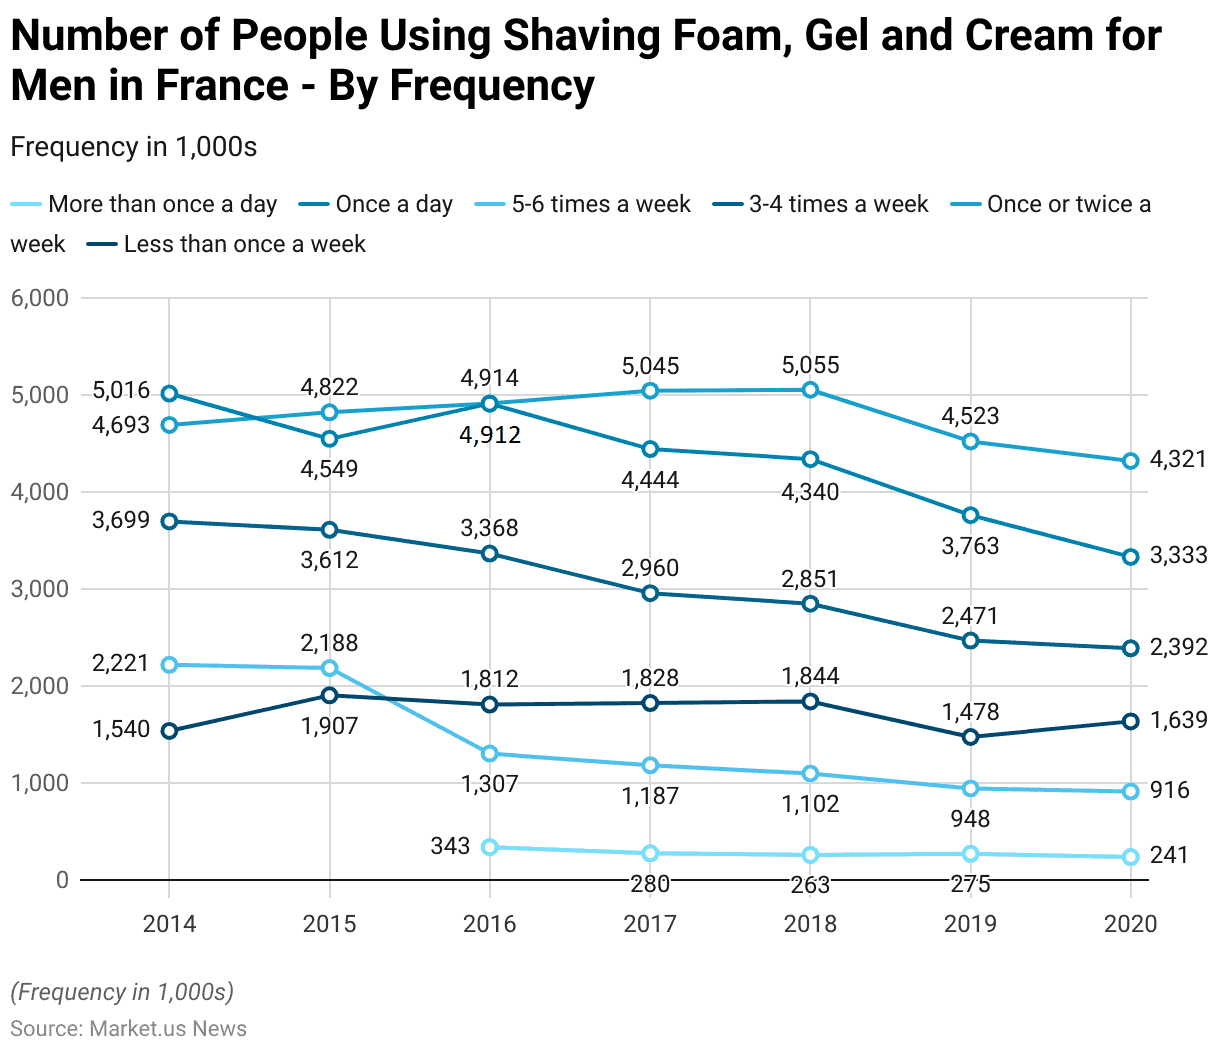
- From 2014 to 2017, the frequency of shaving foam, gel, and cream usage among men in France exhibited gradual shifts across different usage patterns.
- In 2014, 5,016,000 men used these products daily, with 2,221,000 using them 5-6 times a week, 3,699,000 using them 3-4 times a week, 4,693,000 using them once or twice a week, and 1,540,000 using them less than once a week.
- In 2015, daily usage dropped to 4,549,000, while once or twice-a-week usage increased to 4,822,000, showing slight fluctuations across other frequencies.
- By 2016, daily usage further declined to 4,912,000, with a notable drop in the number of men using these products 5-6 times a week (1,307,000). However, once or twice weekly usage continued to rise, reaching 4,914,000.
- In 2017, the daily user count decreased to 4,444,000, and the once or twice-weekly frequency climbed to 5,045,000, while other categories showed minor declines.
2018-2020
- The downward trend continued in 2018, with daily users at 4,340,000 and 5,055,000 individuals using these products once or twice weekly, which became the most frequent usage category.
- By 2019, daily usage saw a substantial decrease to 3,763,000, with once or twice-weekly usage also dropping to 4,523,000.
- Finally, in 2020, the number of daily users declined further to 3,333,000, while 4,321,000 men reported using shaving products once or twice weekly.
- Across the years, the less frequent usage categories showed some fluctuation, with a notable decline in men using these products more than once daily, from 343,000 in 2016 to 241,000 in 2020.
- These trends indicate a gradual shift towards reduced frequency in shaving product use among French men over the years, with once or twice-weekly use becoming the most consistent category across the period.
(Source: Statista)
Women’s Shaving Frequency Statistics
- In 2016, women’s shaving frequency in the Netherlands displayed varied practices.
- A majority of 57% of female respondents reported that they “always” shaved, indicating a consistent grooming routine.
- Another 22% of respondents stated that they shaved specifically when visiting the swimming pool or sauna, reflecting a situational approach to shaving.
- Additionally, 7% of women indicated they shaved when in a relationship, while a small portion, 2%, reported that they never shaved.
- This data suggests that while many Dutch women maintained regular shaving habits, a notable proportion engaged in shaving based on specific circumstances or personal preferences.
(Source: Statista)
Frequency of Shaving Cream and Gel Use Among Women – By Age Statistics
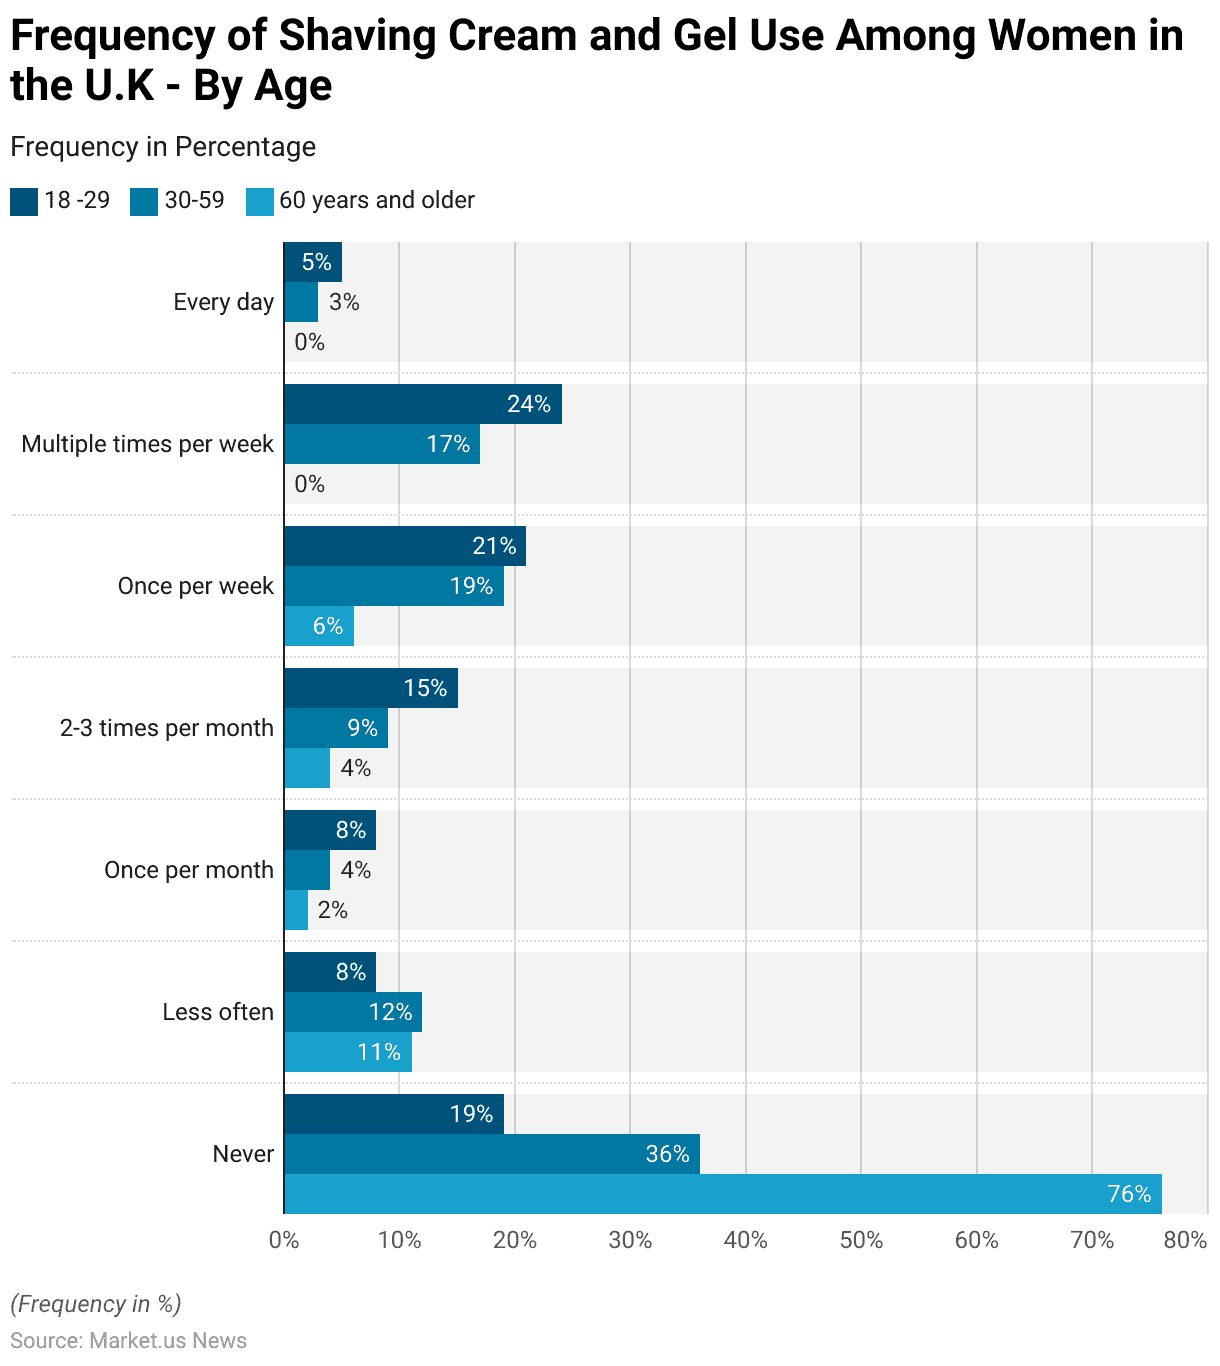
- In 2017, the frequency of shaving cream and gel use among women in the UK varied significantly across age groups.
- Among women aged 18-29, 5% reported using these products every day, with 24% using them multiple times per week, indicating higher grooming frequency in this younger demographic.
- Additionally, 21% of women in this age group used shaving products once per week, and 15% reported use two to three times per month.
- For the 30-59 age group, 3% of women used shaving cream or gel daily, while 17% reported using them multiple times per week.
- Weekly usage was noted by 19% of this demographic, and 9% used these products two to three times per month. Usage further declined in the 60-year-old and older group, with no daily or multiple-times-weekly use reported.
- Only 6% of women in this age group used these products once per week, and 4% reported using them two to three times per month.
- Infrequent use patterns also varied, with 8% of women aged 18-29 and 12% of those aged 30-59 using shaving products less often than once per month. Among women aged 60 and older, 11% fell into this category.
- Notably, a significant portion of older women reported never using shaving cream or gel, with 76% in the 60-plus group, compared to 36% in the 30-59 age range and 19% in the 18-29 age group. This data reflects a trend of decreasing shaving frequency with age among UK women.
(Source: Statista)
Frequency of Hair Removal Product Usage by Women
2016-2018
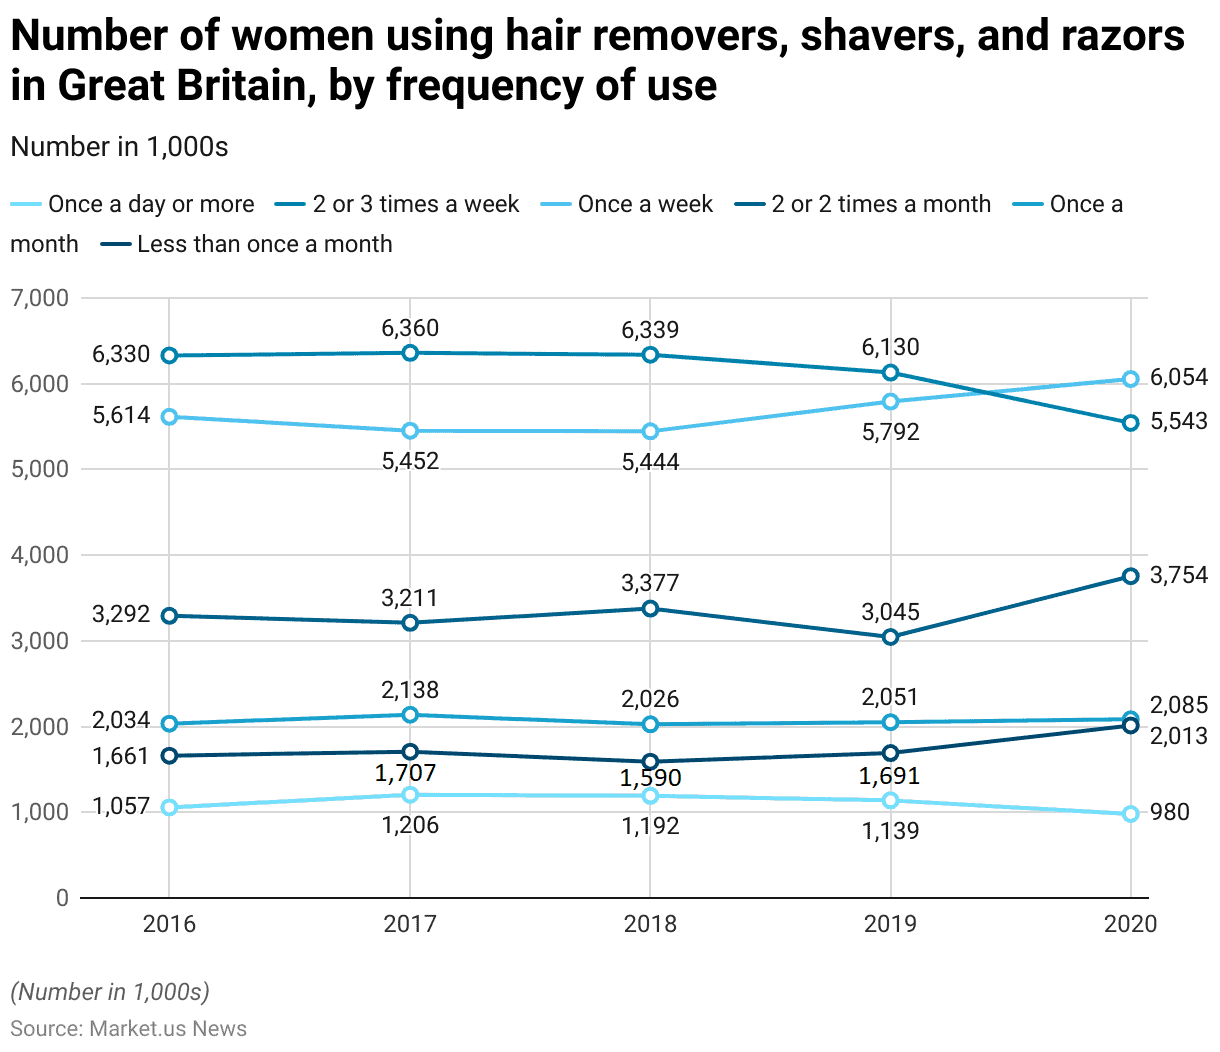
- From 2016 to 2018, the frequency of hair remover, shaver, and razor usage among women in Great Britain showed noticeable trends and fluctuations.
- In 2016, approximately 1,057,000 women used these products once a day or more, while 6,330,000 used them two to three times per week, making it the most common frequency.
- Additionally, 5,614,000 women reported using these products once a week, 3,292,000 used them two or three times per month, 2,034,000 used them once a month, and 1,661,000 less than once a month.
- In 2017, daily or more frequent use increased to 1,206,000, while two to three times per week saw a slight rise to 6,360,000.
- However, weekly usage dropped to 5,452,000, and two to three times monthly usage decreased to 3,211,000.
- Women who used these products once a month increased slightly to 2,138,000, and infrequent use (less than once a month) rose to 1,707,000.
2018-2020
- The trend continued in 2018, with slight reductions in daily use to 1,192,000 and two to three times weekly to 6,339,000.
- Weekly use dropped further to 5,444,000, while two to three times monthly use rose to 3,377,000. Monthly use saw a slight decline to 2,026,000, and infrequent use dropped to 1,590,000.
- By 2019, daily users decreased to 1,139,000, and two to three times weekly usage fell to 6,130,000.
- However, weekly use increased to 5,792,000, while two to three times monthly use dropped to 3,045,000. Monthly use rose slightly to 2,051,000, with infrequent use at 1,691,000.
- In 2020, there was a further decrease in daily use to 980,000 and two to three times weekly to 5,543,000.
- Weekly usage increased to 6,054,000, marking it the most common frequency for that year. Two to three times, monthly use rose to 3,754,000, while monthly use reached 2,085,000. Infrequent usage also saw a significant increase to 2,013,000.
- These trends indicate a gradual shift towards less frequent usage among British women over these five years, with increasing numbers opting for weekly, monthly, or less frequent grooming routines.
(Source: Statista)
Razor Price Statistics
Average Price of the Leading Razor Brands in the United States
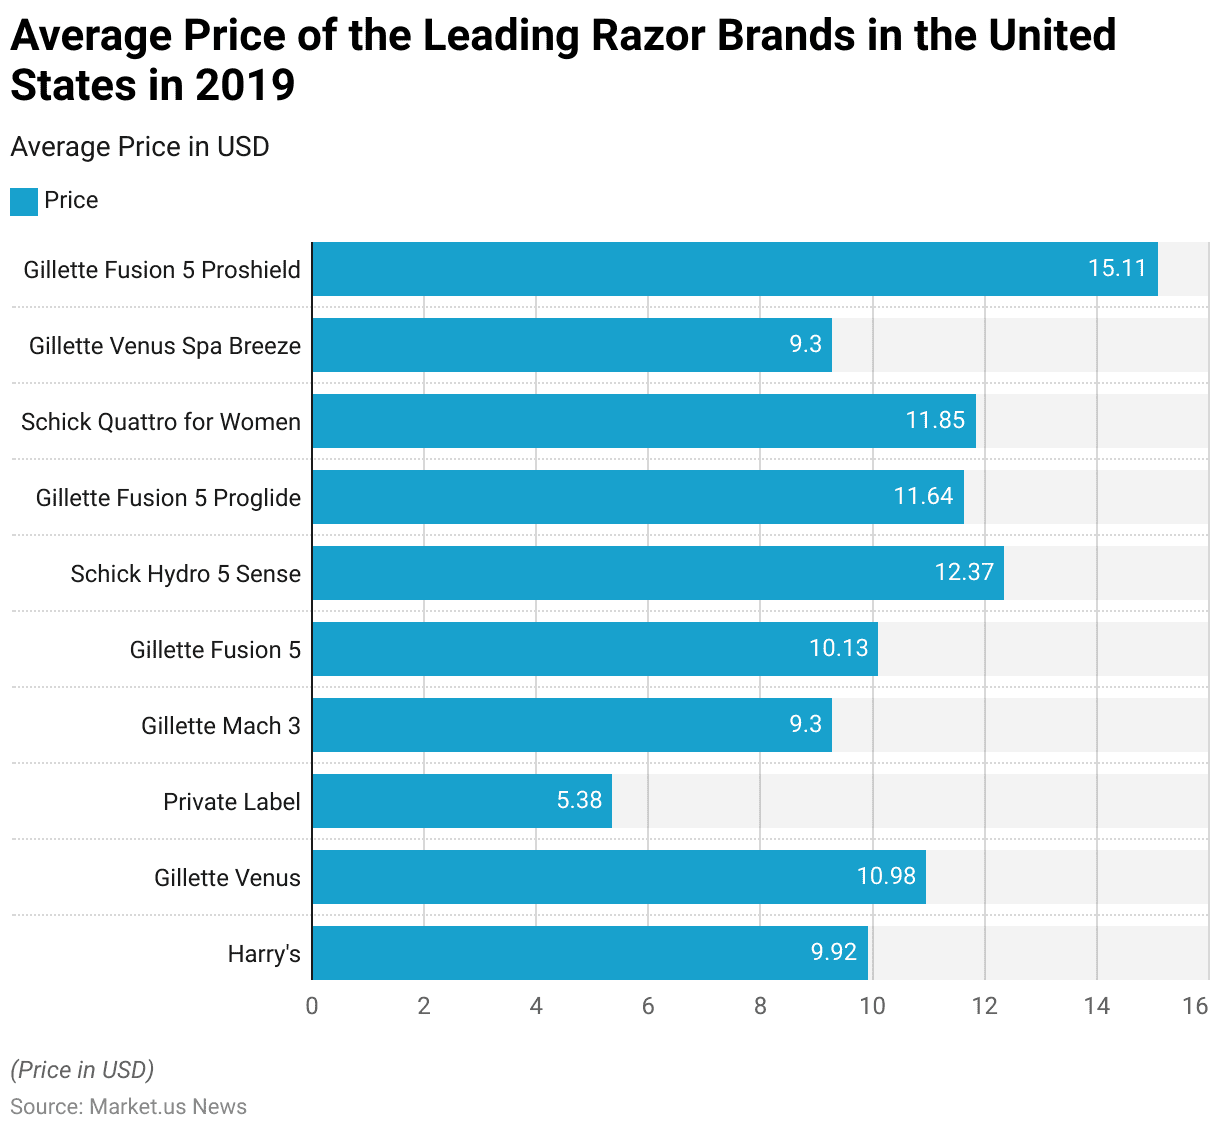
- In 2019, the average prices of leading razor brands in the United States showed considerable variation.
- Among the more affordable options, Private Label razors had an average price of USD 5.38, while Harry’s razors were priced at USD 9.92.
- Gillette’s Mach 3 and Venus Spa Breeze both averaged USD 9.3, positioning them as mid-range options.
- The Gillette Venus razor was priced at USD 10.98, slightly above the Fusion 5 model at USD 10.13.
- Schick Hydro 5 Sense, another popular brand, had a higher price point at USD 12.37, with the Schick Quattro for Women priced similarly at USD 11.85.
- Gillette Fusion 5 Proglide was available at an average price of USD 11.64.
- At the premium end, the Gillette Fusion 5 Proshield had the highest average price, retailing at USD 15.11.
- This price distribution reflects a range of options for U.S. consumers, from budget-friendly to premium razors.
(Source: Statista)
Average Price of the Leading Cartridge Razor Blade Brands in the United States
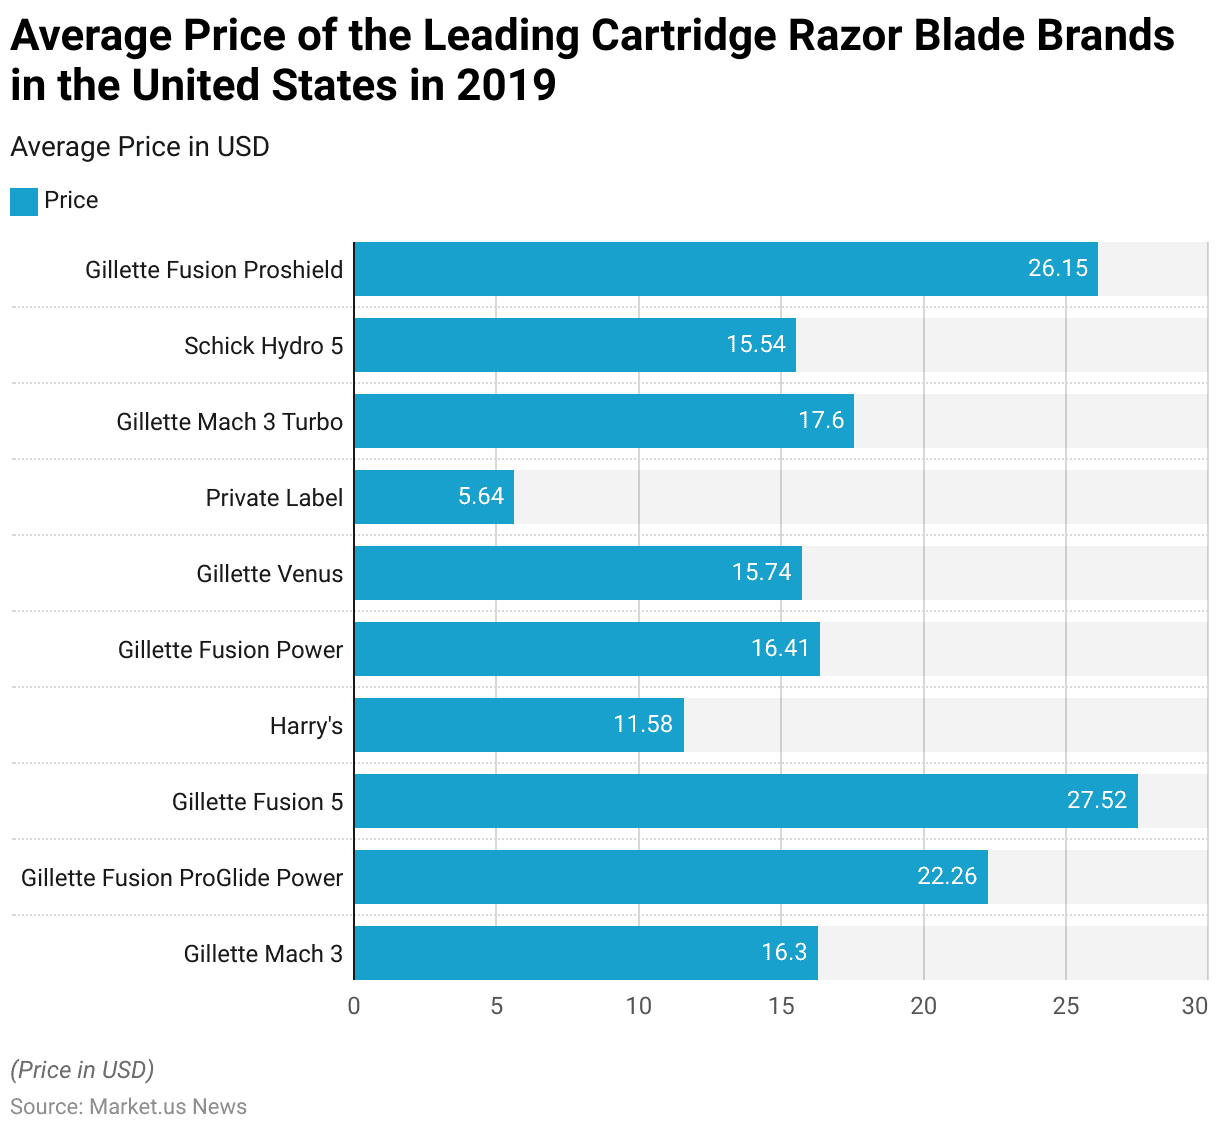
- In 2019, the average prices of leading cartridge razor blade brands in the United States reflected a broad spectrum of cost options.
- Private Label brands were the most economical, priced at USD 5.64, while Harry’s offered a relatively affordable option at USD 11.58.
- Among Gillette’s offerings, the Mach 3 was priced at USD 16.3, with the Mach 3 Turbo slightly higher at USD 17.6.
- The Gillette Venus and Schick Hydro 5 were similarly priced at USD 15.74 and USD 15.54, respectively, positioning them in the mid-range category.
- For more premium choices, Gillette Fusion Power blades were priced at USD 16.41, and the Fusion ProGlide Power at USD 22.26.
- The Gillette Fusion 5 was among the higher-end options, with an average price of USD 27.52.
- The Gillette Fusion Proshield was priced close to this at USD 26.15.
- This range of prices indicates the availability of both affordable and premium cartridge razor blade options in the U.S. market, catering to diverse consumer preferences and budgets.
(Source: Statista)
Shaving Cream Price Statistics
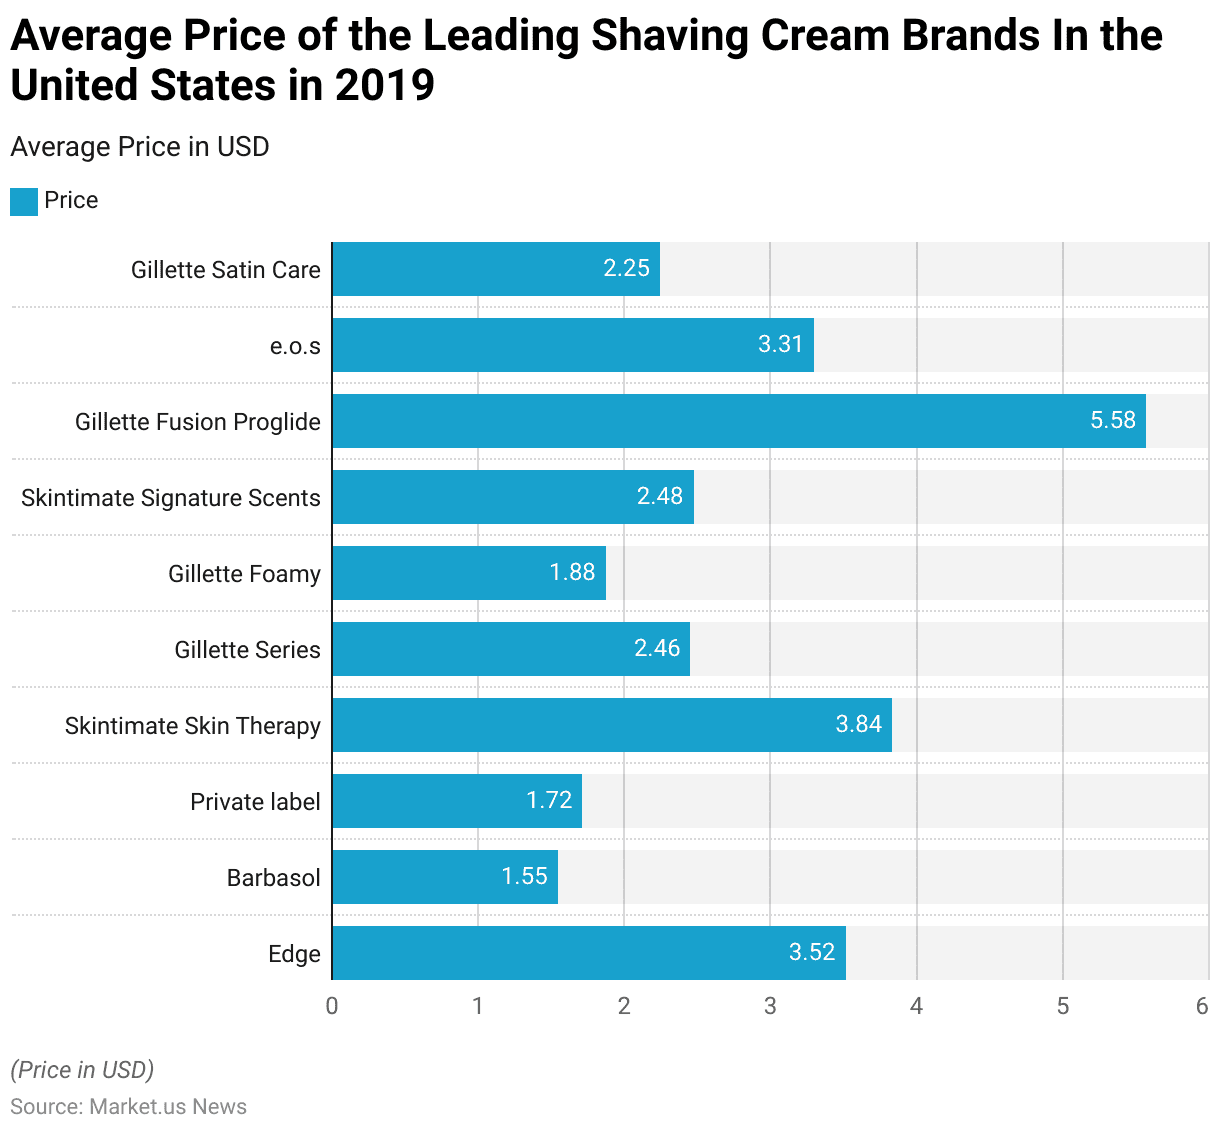
- In 2019, the average prices of leading shaving cream brands in the United States highlighted a range of affordable and premium options.
- Barbasol offered the lowest price among popular brands at USD 1.55, followed closely by Private Label brands at USD 1.72 and Gillette Foamy at USD 1.88, catering to budget-conscious consumers.
- Gillette Satin Care and the Gillette Series were priced slightly higher at USD 2.25 and USD 2.46, respectively, while Skintimate Signature Scents averaged USD 2.48.
- Among mid-range options, Edge shaving cream was priced at USD 3.52, and Skintimate Skin Therapy had a slightly higher price of USD 3.84. E.O.S products averaged USD 3.31, falling within a similar range.
- At the premium end, Gillette Fusion Proglide shaving cream was the most expensive, priced at USD 5.58.
- This variety in pricing reflects a competitive market that accommodates various consumer preferences and budgets within the shaving cream category in the U.S.
(Source: Statista)
Gillette Shaving Foam for Men & its Users
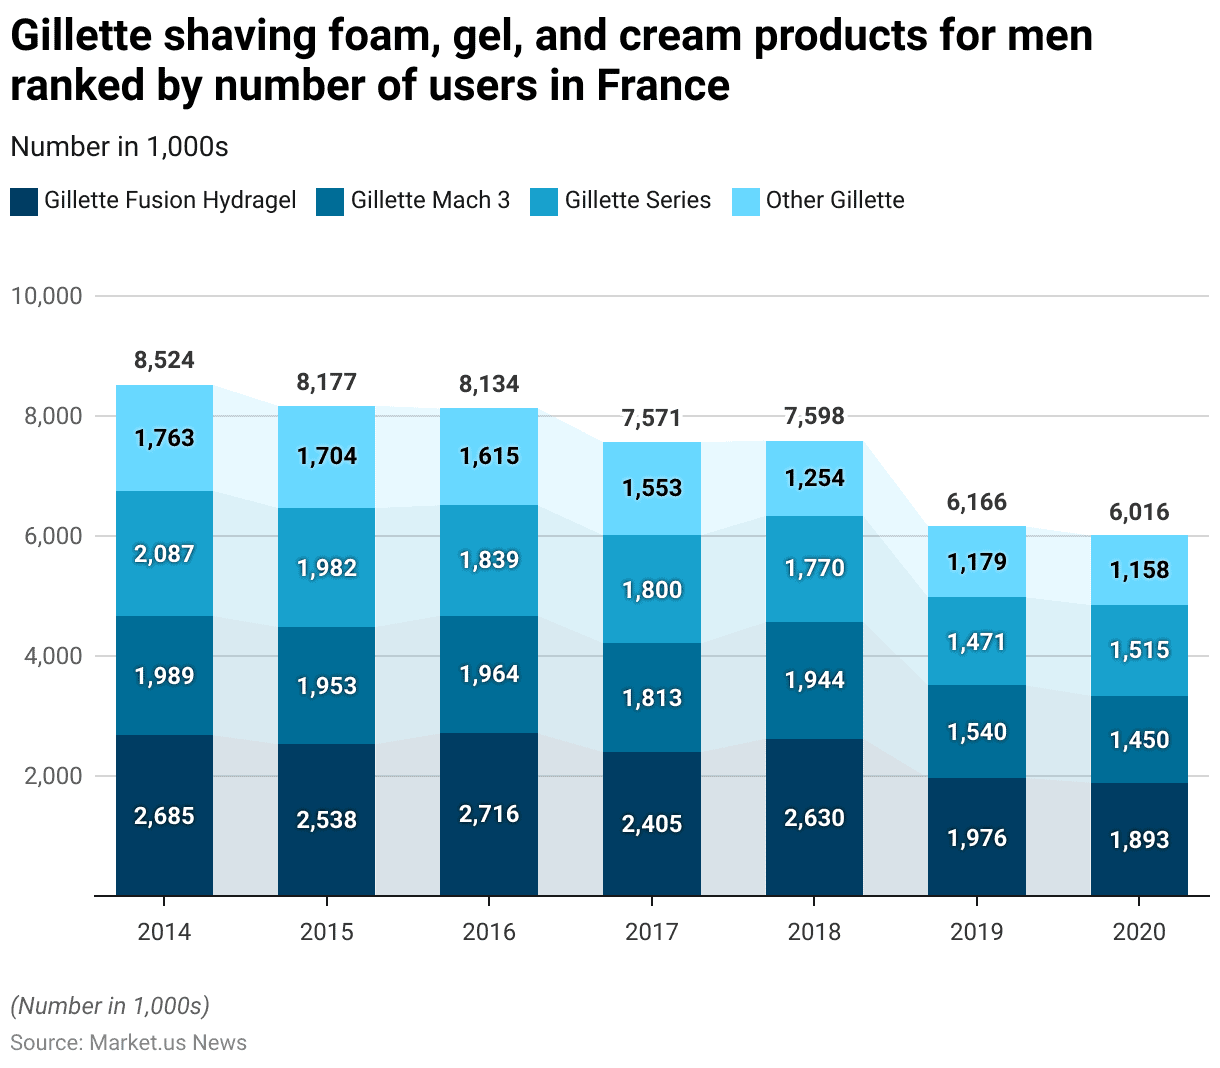
- Between 2014 and 2020, the number of men in France who use Gillette shaving foam, gel, and cream products showed fluctuations across different product lines.
- In 2014, Gillette Fusion Hydragel led with 2,685,000 users, followed by Gillette Series with 2,087,000 users, Gillette Mach 3 with 1,989,000 users, and other Gillette products at 1,763,000.
- In 2015, user numbers slightly declined across the board, with Gillette Fusion Hydragel users decreasing to 2,538,000, and other products saw similar reductions.
- By 2016, Fusion Hydragel rebounded to 2,716,000 users, while Gillette Mach 3 held steady at 1,964,000, though Gillette Series and other Gillette products continued to see declines, with 1,839,000 and 1,615,000 users, respectively.
- In 2017, user numbers fell again across all products, with Fusion Hydragel at 2,405,000 and Mach 3 at 1,813,000. This downward trend continued, with a notable decrease in 2018 for other Gillette products, reaching 1,254,000 users.
- Significant declines were observed in 2019, with Fusion Hydragel dropping to 1,976,000 users and Mach 3 to 1,540,000, while Gillette Series and other Gillette products fell to 1,471,000 and 1,179,000, respectively.
- In 2020, Fusion Hydragel usage slightly reduced further to 1,893,000, Mach 3 decreased to 1,450,000, and other Gillette products had 1,158,000 users, though Gillette Series saw a slight increase to 1,515,000.
- This trend reflects an overall decline in Gillette product users in France from 2014 to 2020, with Fusion Hydragel remaining the most popular choice despite a gradual decrease in user numbers across the years.
(Source: Statista)
Consumer Preferences
Preferred Types of Shaving Cream Statistics
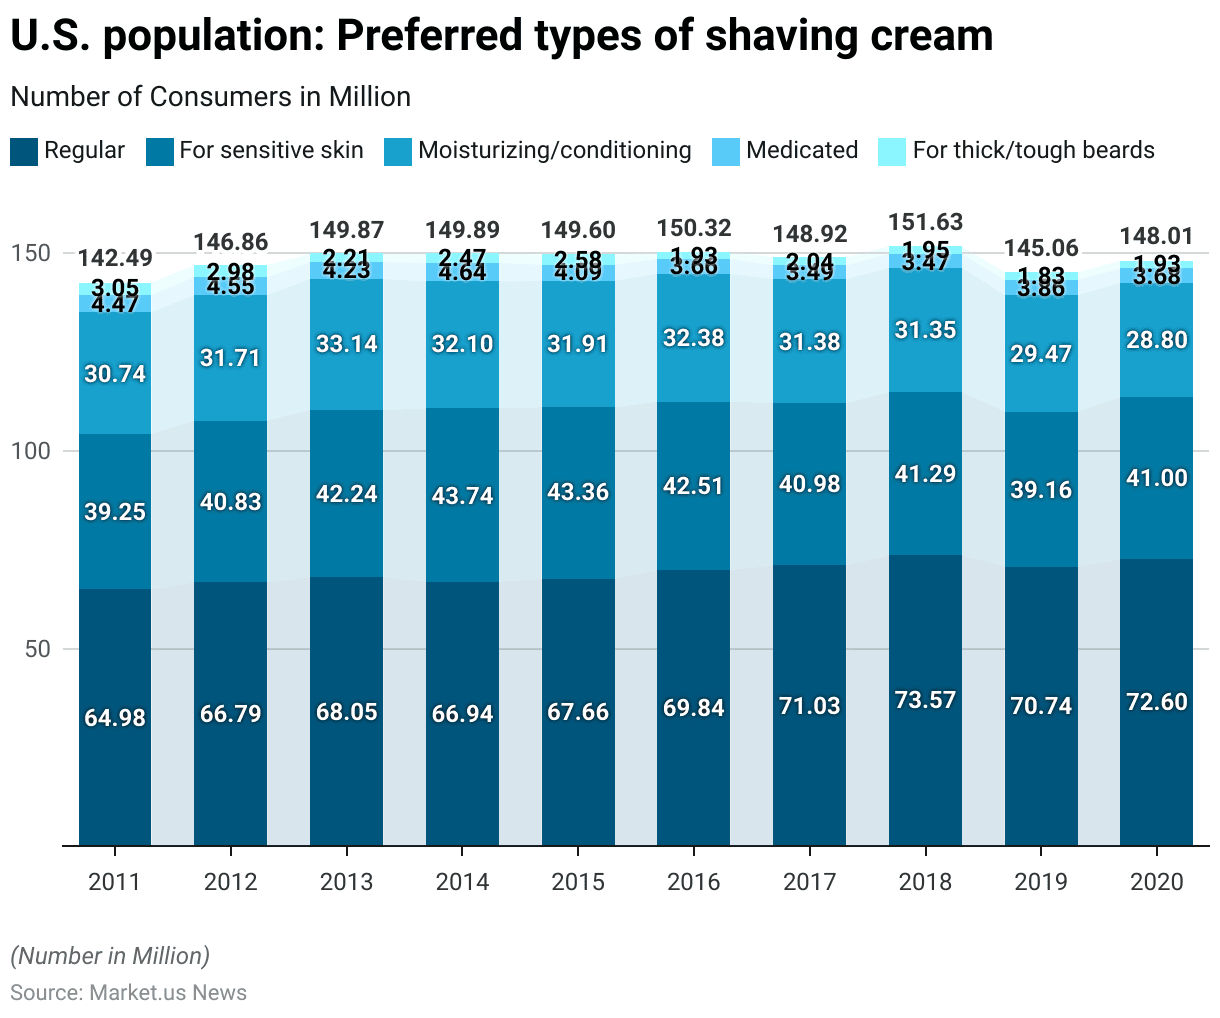
- From 2011 to 2020, the U.S. population exhibited diverse preferences for shaving cream types, with regular shaving cream consistently favored by the majority.
- In 2011, approximately 64.98 million consumers preferred regular shaving cream, a figure that gradually rose to 72.6 million by 2020.
- Shaving cream designed for sensitive skin was also popular, increasing from 39.25 million users in 2011 to a peak of 43.74 million in 2014 before declining slightly to 41 million in 2020.
- Moisturizing or conditioning shaving creams maintained a steady user base, with 30.74 million consumers in 2011, peaking at 33.14 million in 2013 and slightly declining to 28.8 million by 2020.
- Medicated shaving creams were less popular but showed notable fluctuations, beginning with 4.47 million users in 2011, peaking at 4.64 million in 2014, and declining to 3.68 million by 2020.
- Products designed for thick or tough beards saw the lowest preference but also displayed variability. Starting with 3.05 million users in 2011, this category saw a decrease over the years, reaching 1.93 million in 2020.
- These trends indicate a strong and growing preference for regular and sensitive-skin shaving creams, with a decline in more specialized options such as medicated creams and those for thicker beards, possibly reflecting shifts in consumer grooming habits over the decade.
(Source: Statista)
Types of Razors Most Used by Men
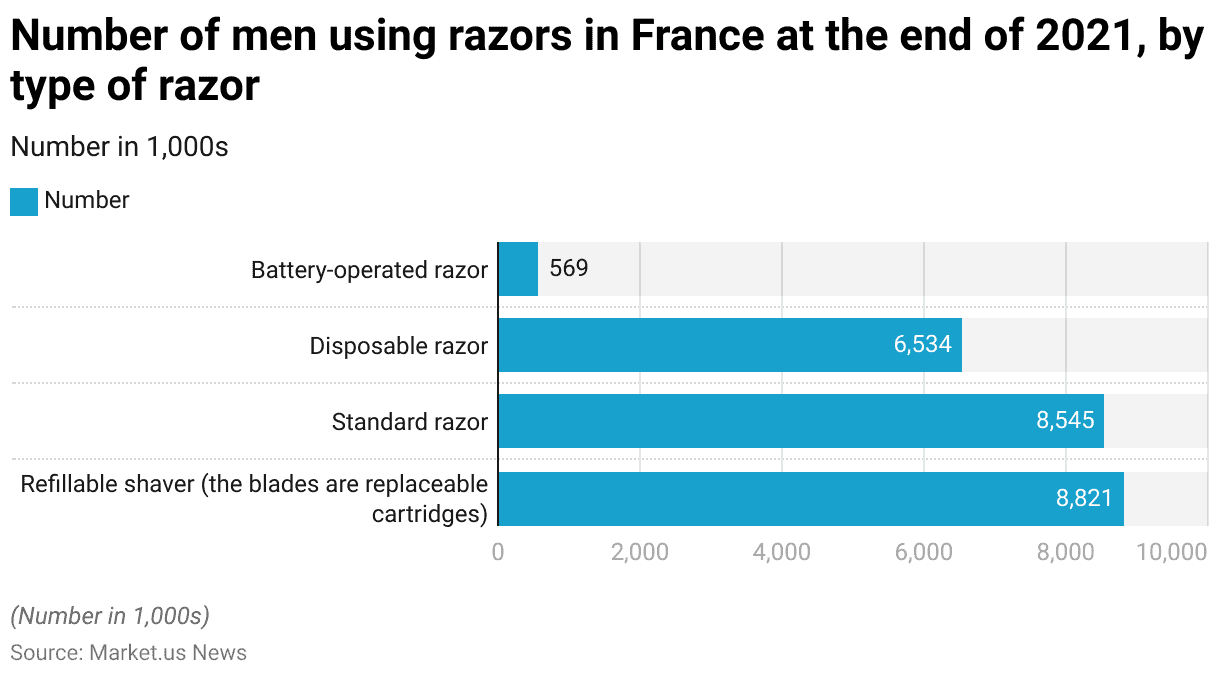
- At the end of 2021, razor preferences among men in France varied across different types.
- Refillable shavers, equipped with replaceable cartridges, were the most popular, with 8.821 million users. Standard razors are followed closely and are used by 8.545 million men.
- Disposable razors were chosen by a significant segment as well, with 6.534 million users.
- Battery-operated razors, however, had the lowest usage, with only 569,000 men opting for this type.
- These figures indicate a strong preference for refillable and standard razors among French men, with disposable options also widely used, while battery-operated razors remain a niche choice.
(Source: Statista)
Razors, Blades and Shavers Usage – By Type
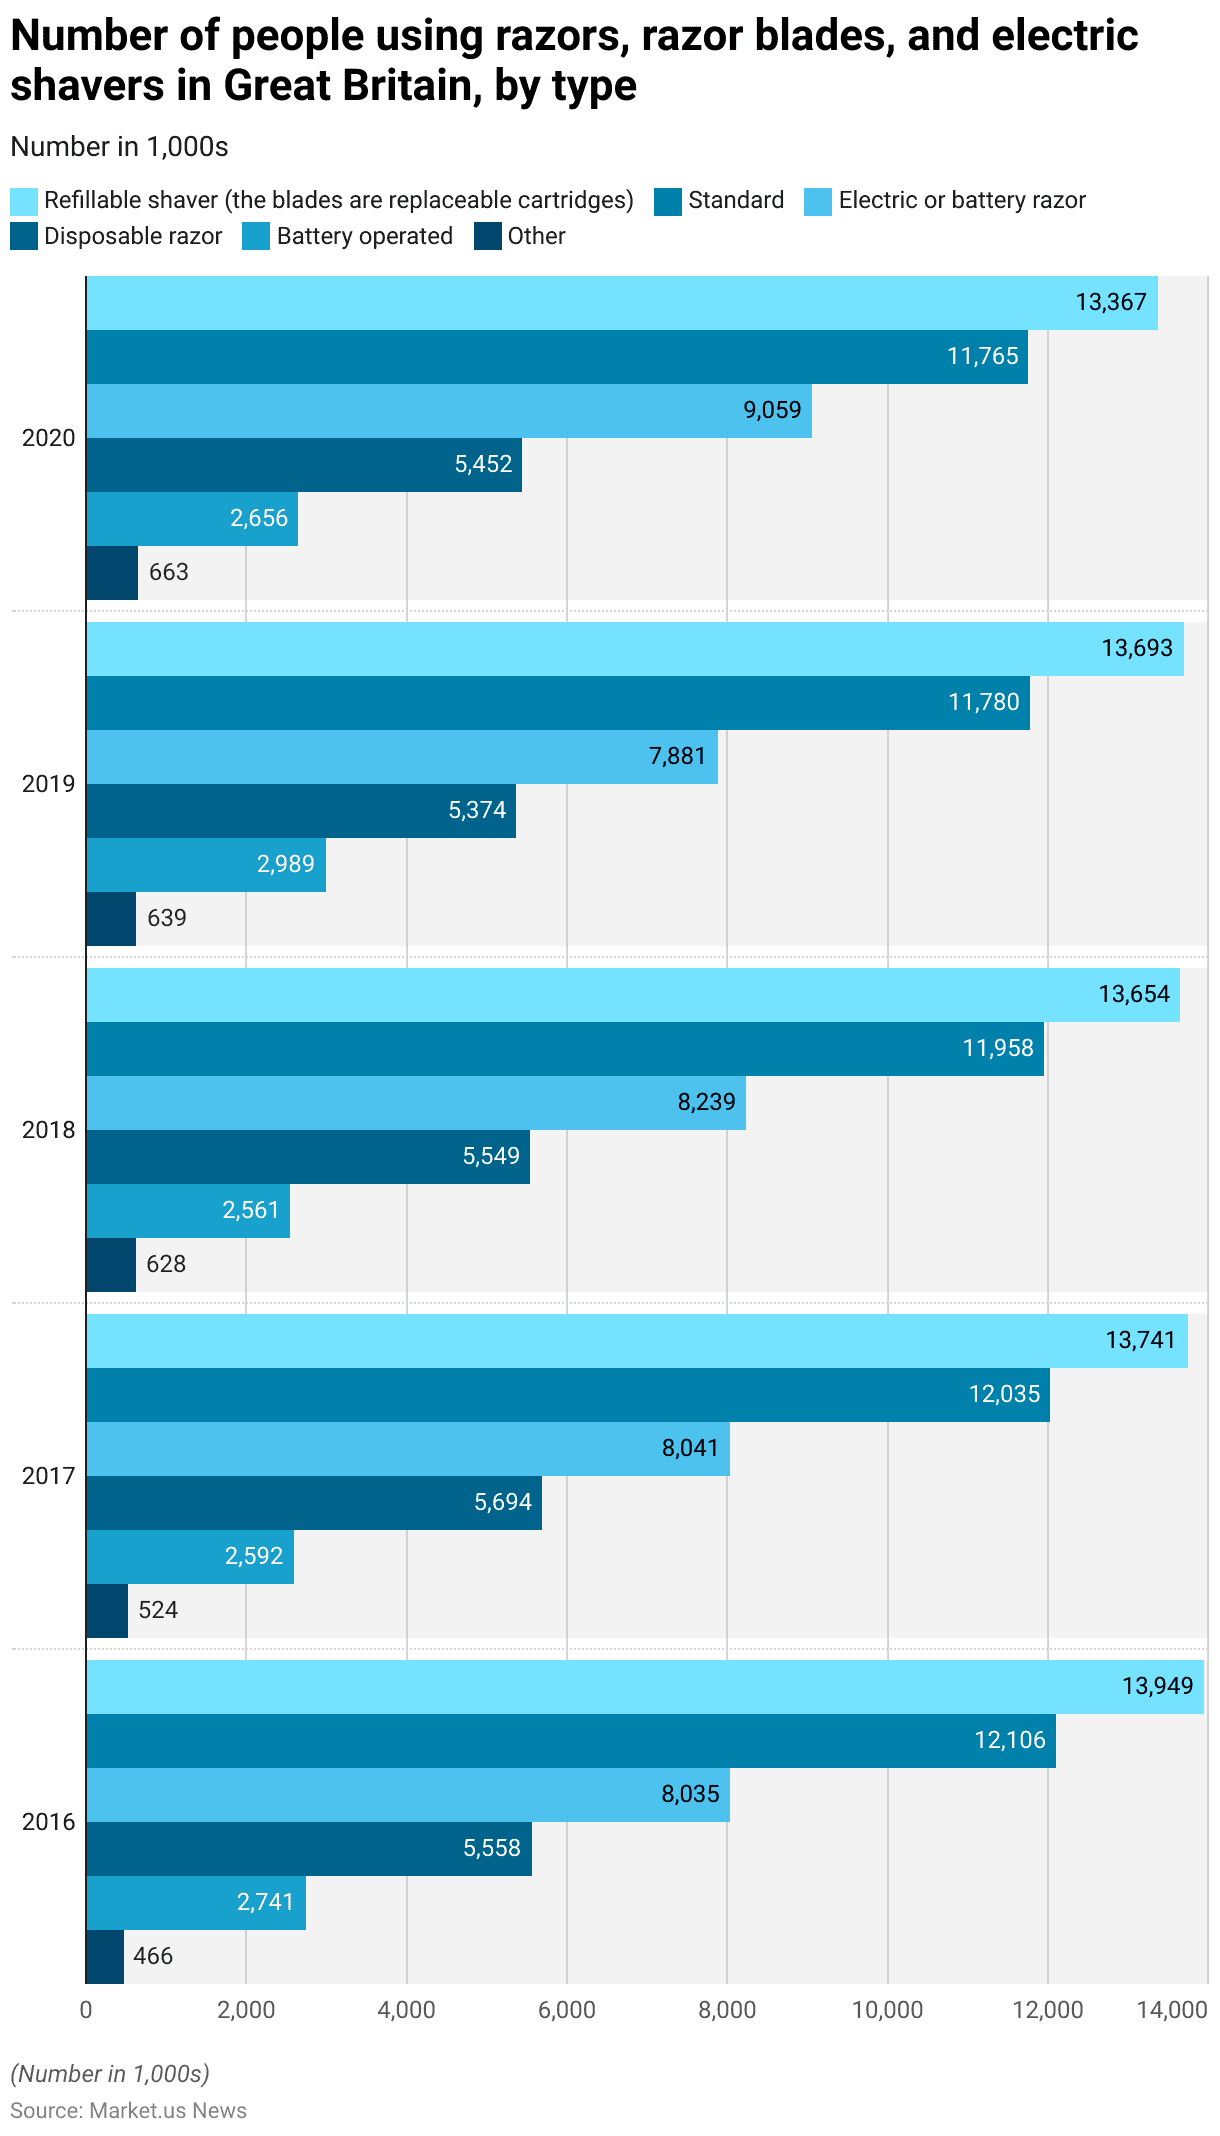
- Between 2016 and 2020, the number of people in Great Britain using various types of razors, razor blades, and electric shavers exhibited gradual changes.
- Refillable shavers with replaceable cartridges consistently had the largest user base, with 13.949 million users in 2016, slightly declining to 13.367 million by 2020.
- Standard razors followed a similar trend, with usage decreasing from 12.106 million in 2016 to 11.765 million in 2020.
- The use of electric or battery-operated razors showed fluctuations, starting with 8.035 million users in 2016 and peaking at 9.059 million in 2020.
- Disposable razors maintained a steady user base, with 5.558 million users in 2016, experiencing slight changes before reaching 5.452 million in 2020.
- Battery-operated shavers saw a minor rise, with 2.741 million users in 2016, fluctuating over the years and ending at 2.656 million in 2020.
- The “Other” category for shaving products had the fewest users, though it saw an increase from 466,000 in 2016 to 663,000 by 2020.
- This data reflects stable demand for refillable and standard razors in Great Britain, alongside a growing preference for electric or battery-operated razors, particularly in 2020.
(Source: Statista)
Usage of Disposable Razor Blades / Shavers
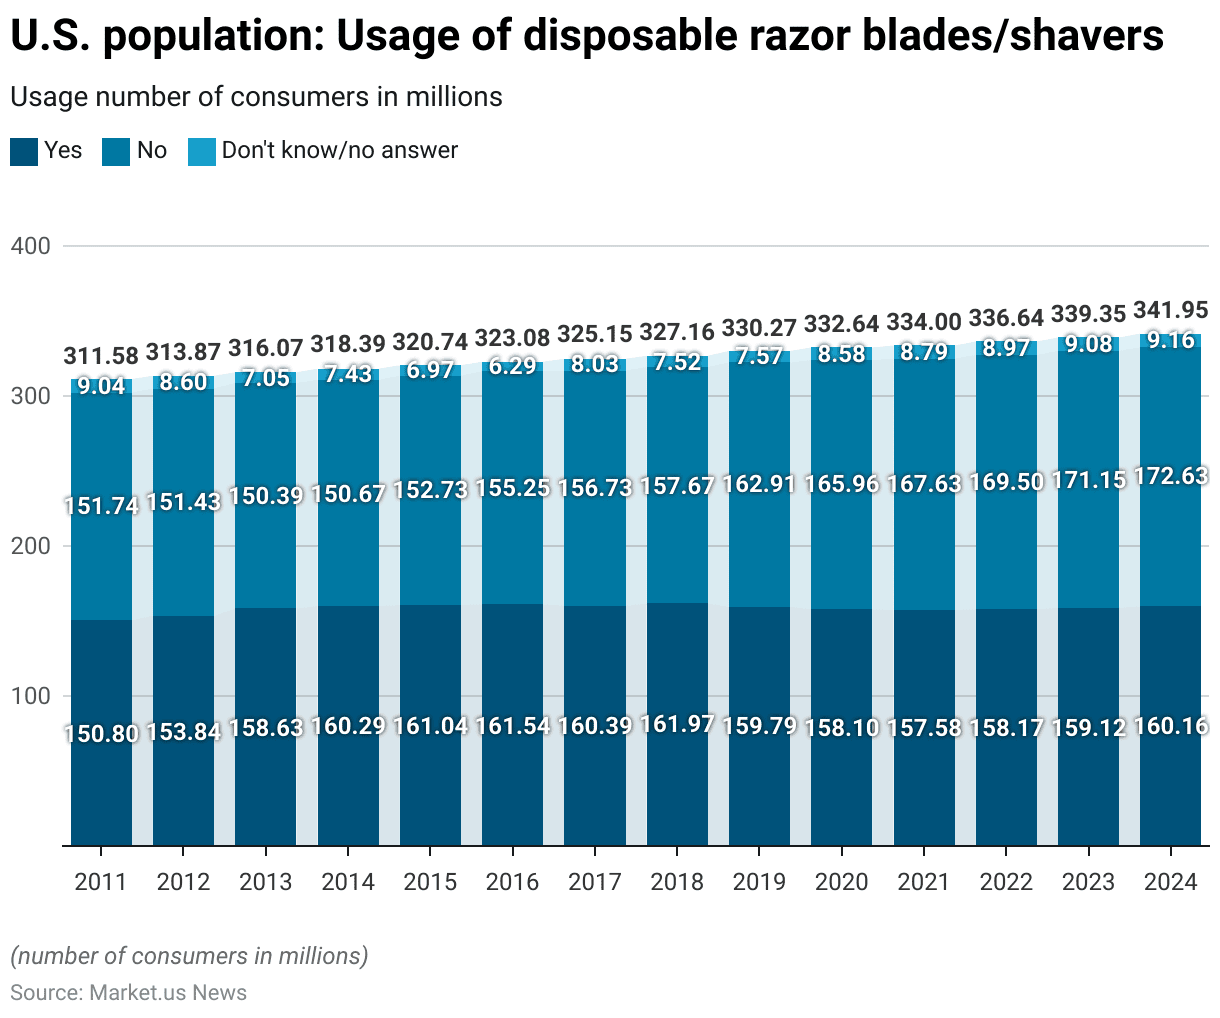
- Between 2011 and 2024, the usage of disposable razor blades and shavers in the United States showed slight fluctuations.
- In 2011, approximately 150.8 million people reported using disposable razors, while 151.74 million did not, with 9.04 million uncertain or providing no answer.
- The number of users rose gradually, reaching a peak in 2018 with 161.97 million users.
- Over the same period, those not using disposable razors increased from 151.74 million in 2011 to 157.67 million in 2018, with a “don’t know/no answer” segment fluctuating between 6.29 million and 9.16 million.
- From 2019 onward, there was a gradual decline in users, falling to 158.1 million by 2020 and further to 157.58 million in 2021.
- This trend of declining users continued through 2024 when the number stabilized at 160.16 million.
- In contrast, the number of those not using disposable razors increased from 162.91 million in 2019 to 172.63 million by 2024.
- The “don’t know/no answer” group remained relatively stable, with minor increases from 8.58 million in 2020 to 9.16 million in 2024.
- These trends suggest a slight shift in consumer preferences away from disposable razors over this period, with a growing segment of the population either choosing alternative shaving methods or uncertain about their usage.
(Source: Statista)
Loyalty to Shavers & Razors Among Men – By Brand
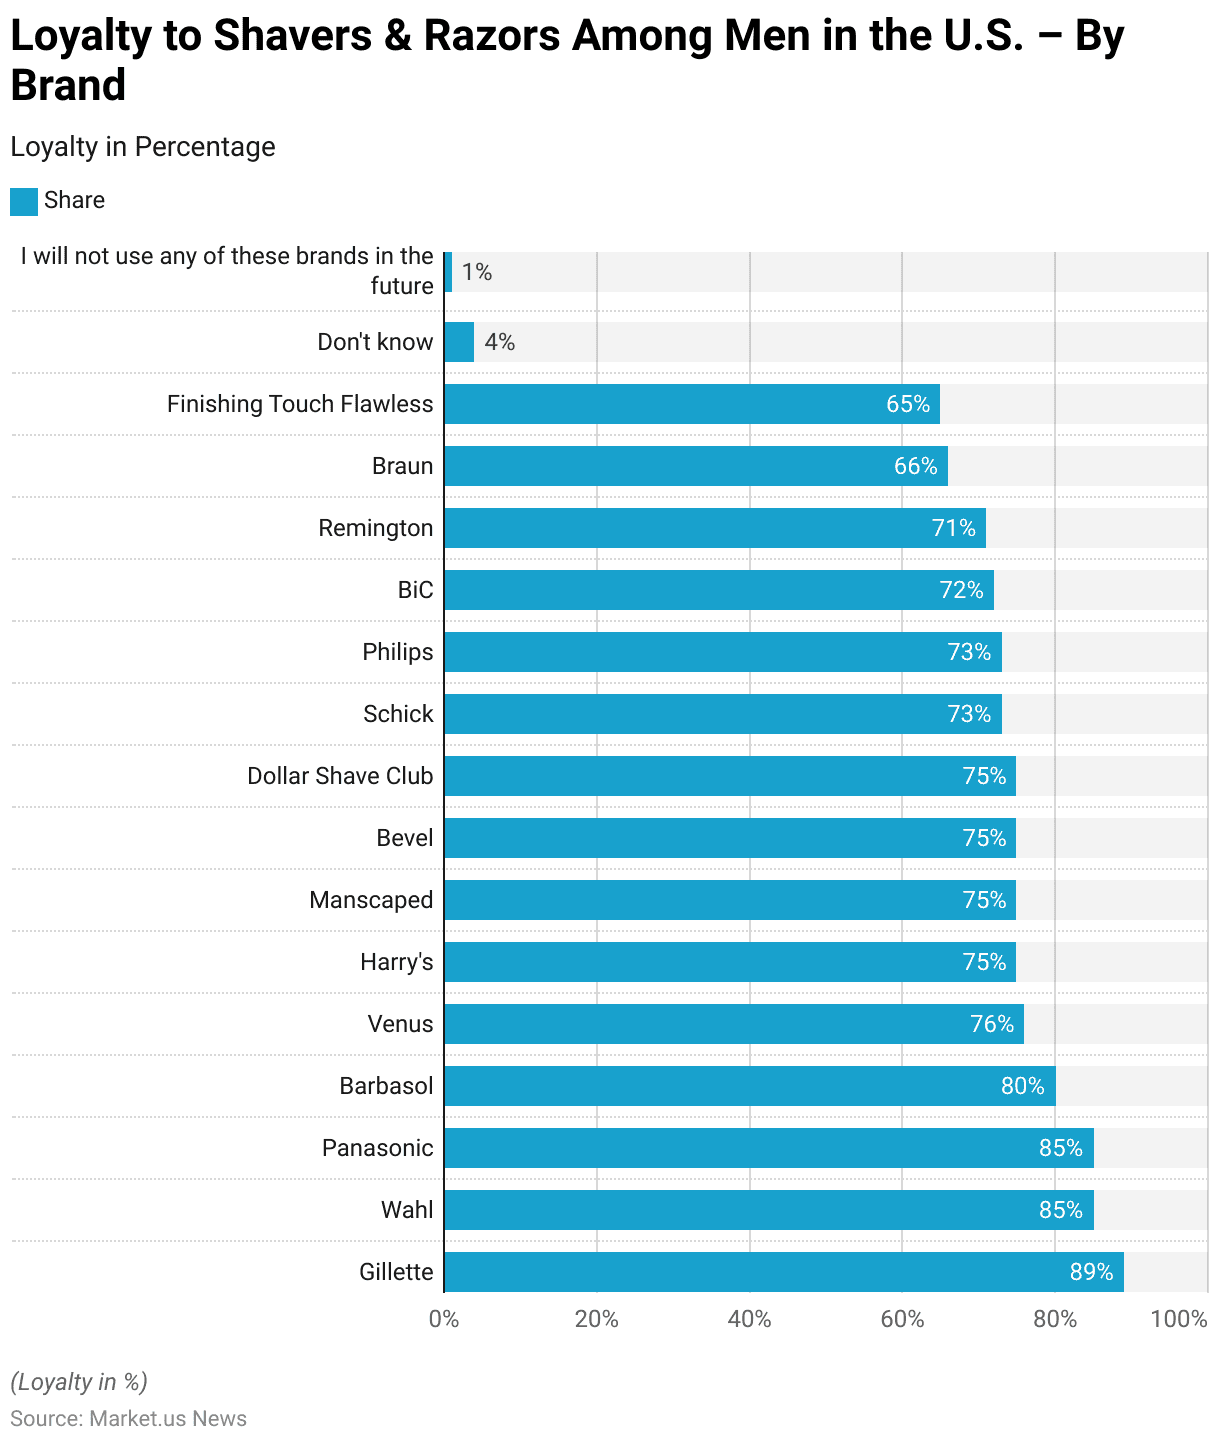
- In 2023, brand loyalty among men in the United States for shavers and razors varied across leading brands.
- Gillette led with the highest loyalty, as 89% of respondents expressed a preference for it. Wahl and Panasonic followed closely, each with 85% loyalty.
- Barbasol had the loyalty of 80% of respondents, while Venus held a loyalty share of 76%.
- Several brands, including Harry’s, Manscaped, Bevel, and Dollar Shave Club, each garnered loyalty from 75% of respondents.
- Schick and Philips both held a 73% loyalty share, with BiC closely behind at 72% and Remington at 71%.
- Braun and Finishing Touch Flawless had lower, but still significant, loyalty rates of 66% and 65%, respectively.
- Notably, 4% of respondents were unsure about their loyalty to any specific brand, while only 1% indicated they would not use any of these brands in the future.
- This distribution highlights Gillette’s dominance in brand loyalty within the U.S. shaving market, with several other brands also maintaining strong customer retention rates.
(Source: Statista)
Consumers Who Prefer to Buy Natural/Organic Shaving Products Statistics
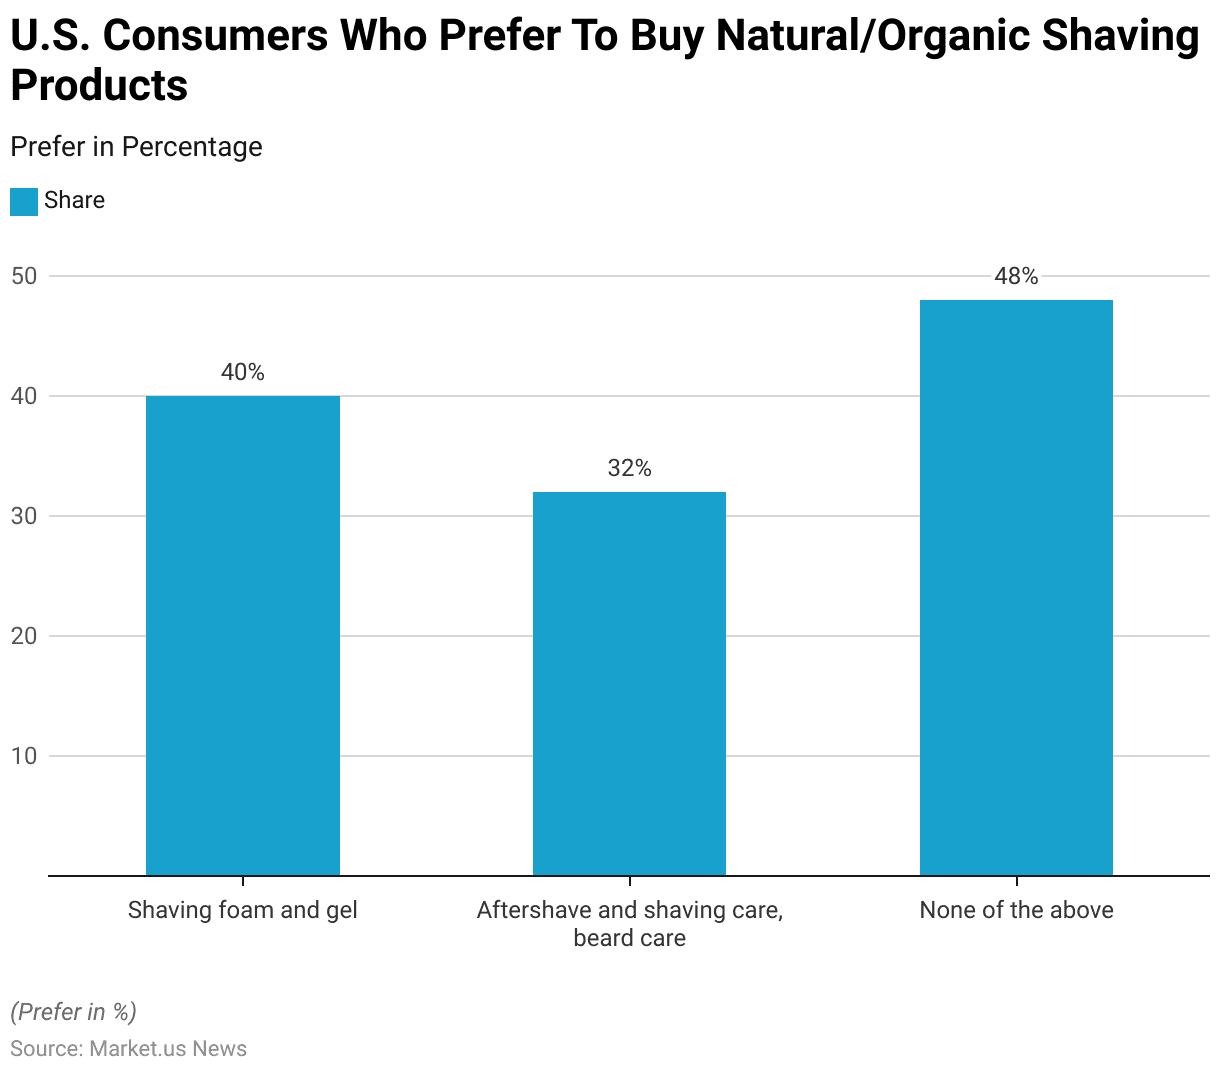
- As of May 2017, consumer preferences for natural or organic shaving products in the U.S. showed varied interest levels.
- Around 40% of respondents expressed a preference for purchasing natural or organic shaving foams and gels, while 32% favored natural or organic aftershave, shaving care, and beard care products.
- However, a significant 48% of respondents indicated that they did not prefer natural or organic options for any shaving products.
- This distribution reflects a moderate interest in natural or organic shaving products, with nearly half of consumers opting for conventional options.
(Source: Statista)
Expenditure on Shaving Needs Statistics
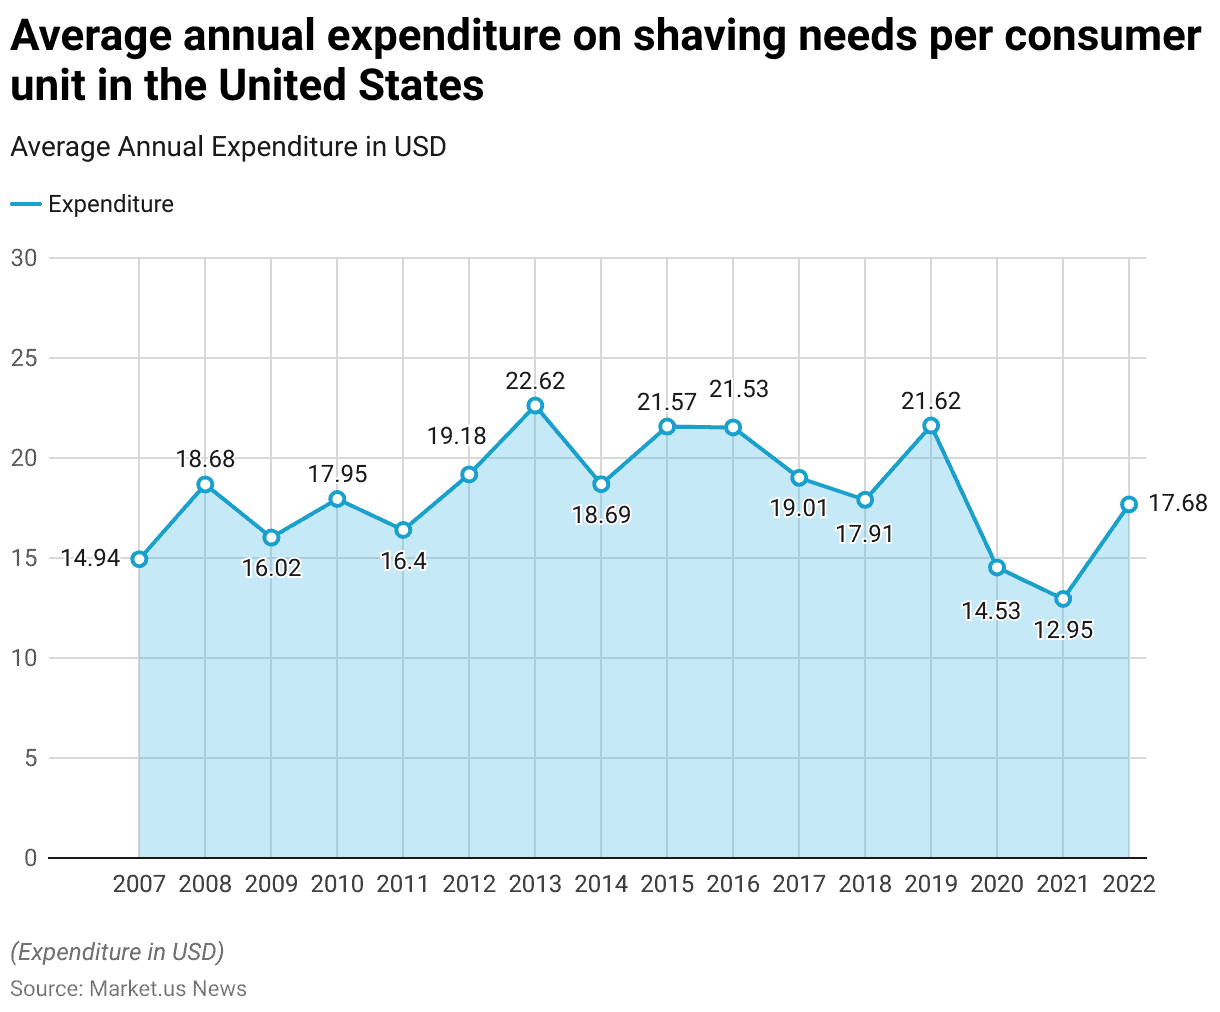
- From 2007 to 2022, the average annual expenditure on shaving needs per consumer unit in the United States exhibited fluctuations.
- In 2007, consumers spent an average of USD 14.94, which increased to USD 18.68 in 2008.
- Expenditures dropped slightly in 2009 to USD 16.02, followed by an increase to USD 17.95 in 2010 and a minor rise to USD 16.4 in 2011.
- In 2012, spending rose to USD 19.18 and continued to increase, reaching a peak of USD 22.62 in 2013.
- After a slight decline to USD 18.69 in 2014, expenditures rose again in 2015 to USD 21.57 and remained stable in 2016 at USD 21.53.
- However, from 2017 onwards, spending started to fluctuate, with a decrease to USD 19.01 in 2017 and USD 17.91 in 2018.
- In 2019, expenditures rose again to USD 21.62 before dropping sharply to USD 14.53 in 2020, likely influenced by changes in consumer behavior during the pandemic.
- The decline continued in 2021 with a low of USD 12.95, but expenditures rebounded to USD 17.68 in 2022. This data reflects variability in spending on shaving needs over the years, with notable declines during and after the pandemic period.
(Source: Statista)
Attitudes Towards Shavers & Razors Among Men
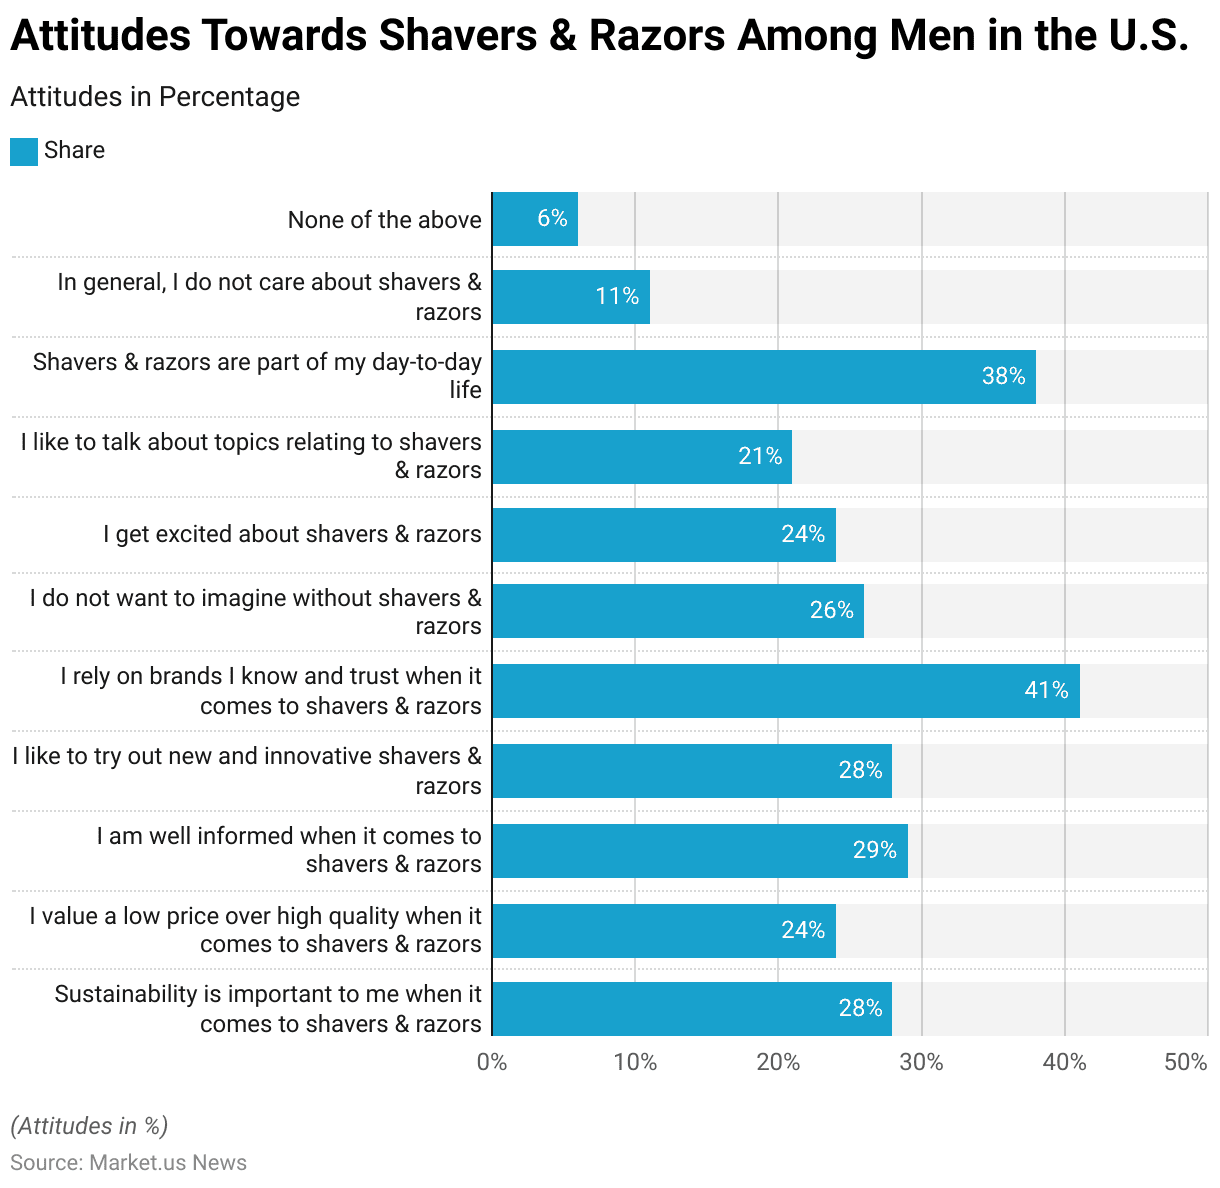
- In 2023, attitudes towards shavers and razors among men in the United States reflected a range of perspectives.
- The majority, 41%, expressed reliance on brands they know and trust for their shaving needs.
- A significant portion, 38%, indicated that shavers and razors are an integral part of their daily routine.
- Sustainability also emerged as an important factor, with 28% considering it a priority in their shaving products.
- Similarly, 28% of men expressed interest in trying new and innovative shavers, while 29% reported being well-informed about these products.
- Price sensitivity was also notable, with 24% prioritizing low prices over high quality. Additionally, 26% said they could not imagine life without shavers and razors, and 24% reported feeling excitement about these products.
- A smaller segment, 21%, enjoyed discussing topics related to shavers and razors, whereas 11% expressed general indifference towards these products.
- Finally, 6% of respondents did not identify with any of these statements, indicating diverse attitudes toward shaving products among U.S. men.
(Source: Statista)
Recent Developments
Acquisitions and Mergers:
- Edgewell Personal Care acquires Billie Inc.: In 2023, Edgewell Personal Care, known for its Schick and Wilkinson razor brands, acquired Billie Inc., a female-focused razor subscription service, for $310 million. This acquisition expands Edgewell’s footprint in the direct-to-consumer market and enhances its offerings in women’s shaving products.
New Product Launches:
- Gillette launches Heated Razor: In 2023, Gillette launched the GilletteLabs Heated Razor, which delivers a hot towel shaving experience. Designed to enhance comfort and closeness, this premium product has seen strong market uptake with initial sales exceeding expectations by 20%.
- Philips introduces the Series 9000 Prestige: Philips launched its most advanced electric shaver, the Series 9000 Prestige, in early 2024. This shaver features SkinIQ technology, which adapts to hair density and skin contours for a closer shave, targeting a 15% increase in customer satisfaction ratings for comfort and efficiency.
Funding:
- Supply raises $15 million for expansion: Supply, a startup specializing in single-edge razors and shaving accessories, raised $15 million in Series B funding in late 2023. The funding will be used to expand their product line and scale up marketing efforts.
- Bevel secures $10 million Series C: Bevel, a brand that focuses on shaving products for men of color, secured $10 million in Series C funding in 2023 to expand its product range and improve distribution channels, particularly in underserved markets.
Technological Advancements:
- AI and personalized shaving experiences: Leading companies like Braun and Panasonic are integrating AI technologies to personalize shaving experiences, with new models launched in 2023 that adjust power and blade movement based on beard thickness and skin type. By 2025, over 30% of new shavers are expected to include such AI enhancements.
Conclusion
Shaving Statistics – The global shaving market continues to evolve, driven by consumer preferences for trusted brands, sustainable options, and innovative products.
While traditional razors remain popular, trends show increased interest in natural and organic shaving products.
Changing grooming habits, influenced by lifestyle shifts and the pandemic, have led to reduced shaving frequency and spending, though a gradual recovery is underway.
Moving forward, brands that emphasize quality, sustainability, and personalization are well-positioned to meet the diverse needs of modern consumers, especially as demand grows for both premium and cost-effective shaving solutions.
FAQs
Current trends include the increasing popularity of subscription shaving services, the rise of eco-friendly and sustainable products, and the growing demand for grooming products specifically tailored for women and non-binary individuals.
Growth in the shaving market can be attributed to rising grooming standards, the influence of social media on personal care, and innovations in product formulations and technologies that enhance user experience.
Key players in the shaving market include established brands such as Gillette, Schick, and Wilkinson Sword, as well as newer entrants like Dollar Shave Club and Harry’s. These companies compete on product innovation, pricing, and marketing strategies.
Popular products in the shaving market include disposable razors, cartridge razors, electric shavers, shaving creams, gels, oils, and aftershave products. There is also a growing interest in natural and organic grooming products.
The male shaving segment tends to focus on traditional razors and shaving creams. In contrast, the female segment has seen a rise in multi-functional products, such as razors designed for body shaving, along with specific skin care formulations.


