Table of Contents
- Introduction
- Editor’s Choice
- Sports Industry Statistics
- Sportswear Market Statistics
- Sports Apparel Market Size
- Global Activewear Market Size
- Women’s Sportswear Market Statistics
- Sportswear Companies Sales Statistics
- Age-related Dynamics of Sportswear Consumers Statistics
- Generation-related Dynamics of Sportswear Consumers Statistics
- Gender-related Dynamics of Sportswear Consumers Statistics
- Sportswear Price Statistics
- Sportswear Spending Trends Statistics
- Sportswear Brand Trends Statistics
- Key Consumer Preferences and Trends
- Regulations for Sportswear Products Statistics
- Recent Developments
- Conclusion
- FAQs
Introduction
Sportswear Statistics: Sportswear, or activewear, includes a variety of clothing designed for physical activities such as exercise and sports.
Key components encompass tops like moisture-wicking T-shirts and tank tops, bottoms including shorts and leggings, and outerwear such as jackets.
Materials used in sportswear are selected for their moisture-wicking, breathable, and durable properties, ensuring comfort and performance.
Current market trends highlight a growing demand for sustainable products. The rise of athleisure, technological innovations in fabric, and increased customization options.
Consumer preferences prioritize comfort, style, functionality, and brand reputation, making adaptability essential for brands in this dynamic market.
Editor’s Choice
- The global sportswear market revenue is projected to reach USD 855.3 billion by 2033.
- The global sports apparel market revenue is expected to reach USD 293.73 billion by 2030.
- The global activewear market revenue is projected to reach USD 451.1 billion by 2028.
- As of 2024, Nike, Inc. leads the global sportswear market in terms of market capitalization, valued at USD 150.24 billion. Underscoring its dominant position in the athletic apparel, accessories, and footwear industry.
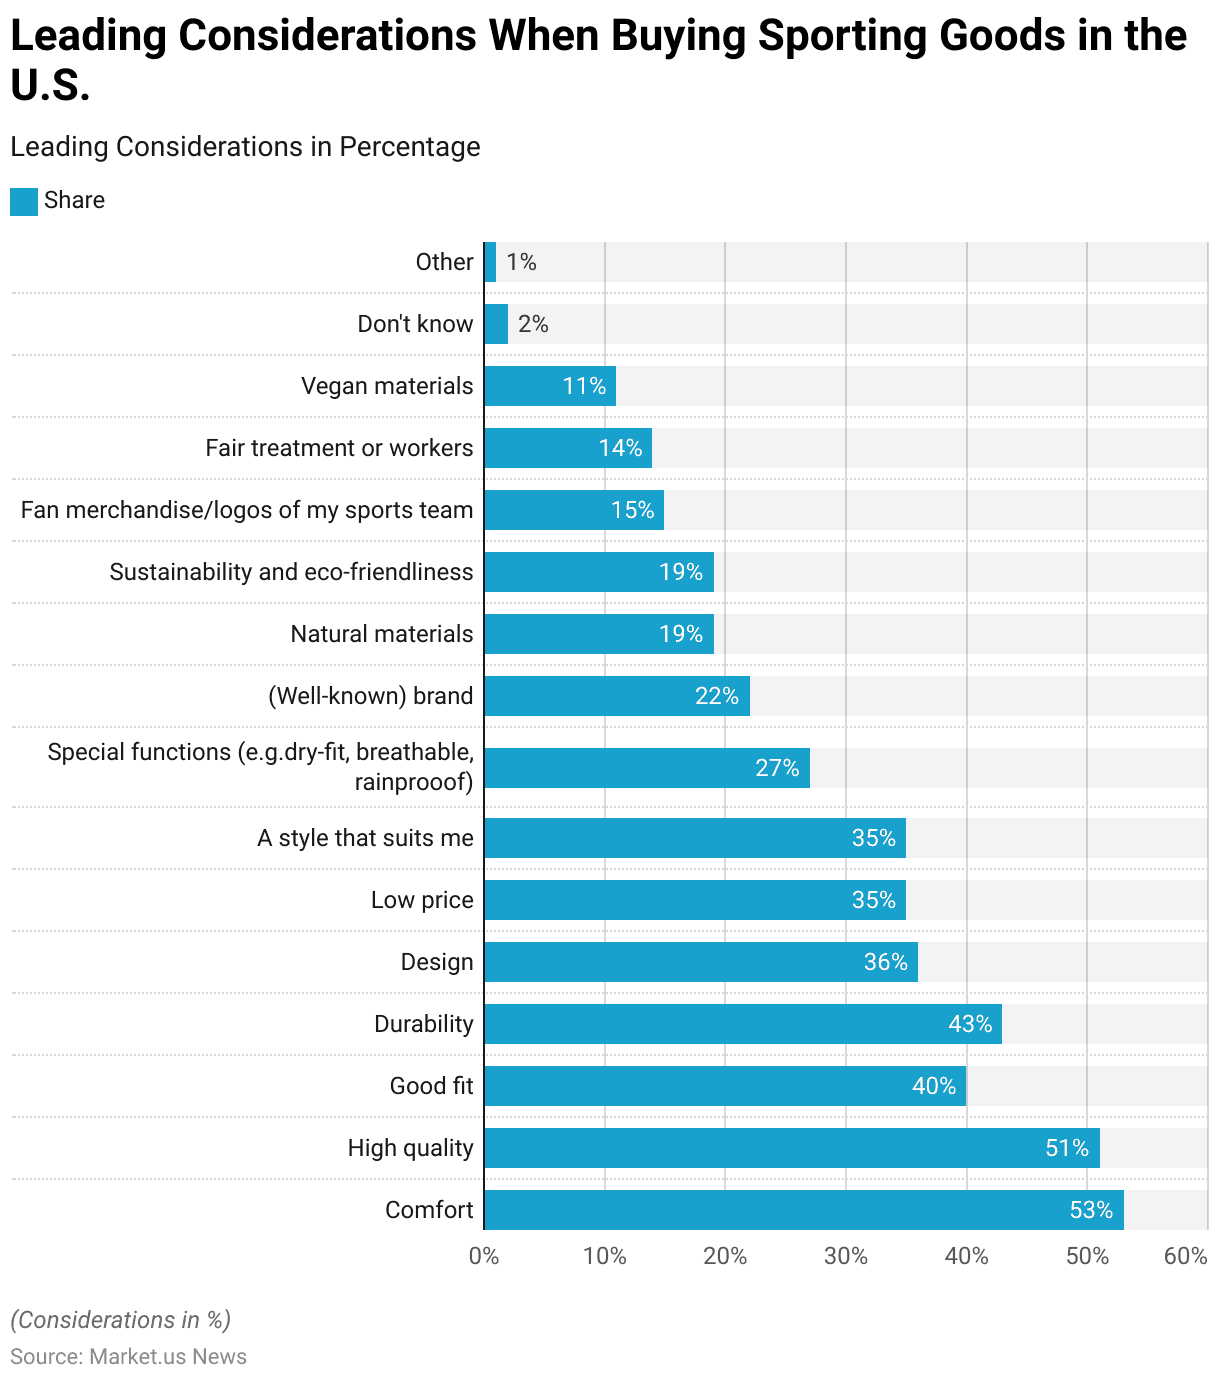
- In 2021, consumers in the United States considered several factors when purchasing sporting goods, such as sportswear, shoes, and equipment. Comfort emerged as the most important factor, valued by 53% of respondents.
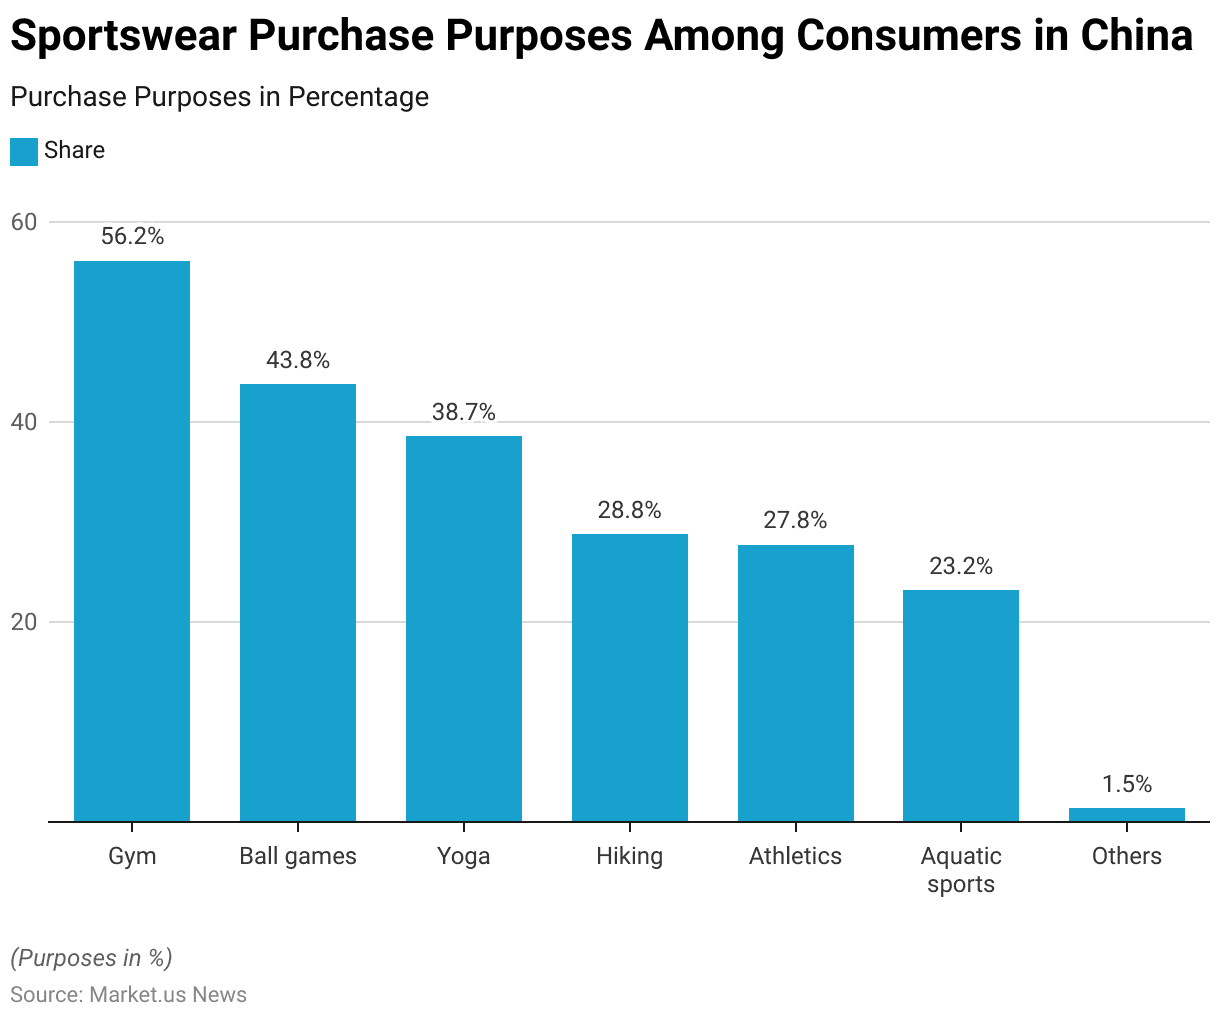
- As of January 2024, sportswear purchases among consumers in China were primarily driven by activities such as gym workouts, with 56.18% of respondents purchasing sportswear for this purpose.
- France has instituted comprehensive regulations under its Anti-waste and Circular Economy Law, which mandates more informative labeling on sportswear products concerning recyclability. The content of recycled materials, and the presence of harmful substances.
Sports Industry Statistics
Global Sports Industry Revenue
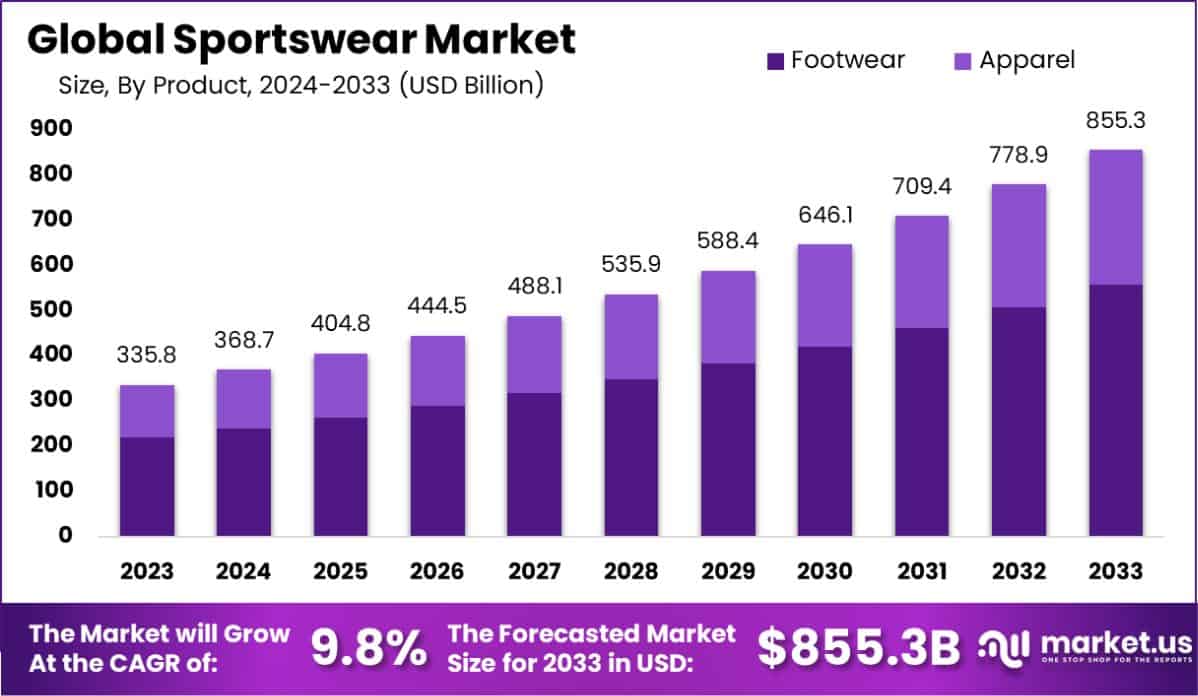
- The global sports industry generated a substantial revenue of USD 403.08 billion in 2022, with projections indicating a significant increase in the coming years.
- By 2028, the industry is expected to reach USD 680.74 billion. Reflecting robust growth driven by rising consumer interest in sports, increased investment in sports infrastructure, and expanding engagement in both traditional and emerging sports markets worldwide.
- This forecasted growth underscores the enduring appeal and expanding influence of the sports industry on a global scale.
(Source: Statista)
Global Sports Market Size – By Product Category
- The global market for selected sports product categories has shown substantial growth from 2018 to 2023.
- In the apparel segment, the market value increased from USD 155.2 billion in 2018 to USD 213.3 billion in 2023. Indicating a strong demand for sportswear and athleisure products.
- The footwear market also expanded significantly, rising from USD 130.5 billion in 2018 to USD 183.2 billion in 2023. Driven by increased consumer interest in athletic and lifestyle footwear.
- The sports equipment segment grew from USD 127.2 billion to USD 158.4 billion over this period. Highlighting a rising investment in sporting goods and accessories.
- Additionally, the market for bicycles and accessories experienced notable growth, increasing from USD 58.4 billion in 2018 to USD 72.7 billion in 2023. Reflecting a heightened interest in cycling for both recreational and fitness purposes.
- This overall growth across various product categories underscores the expanding global sports market and the broadening consumer base engaging with sports-related products.
(Source: Statista)

Sportswear Market Statistics
Global Sportswear Market Size Statistics
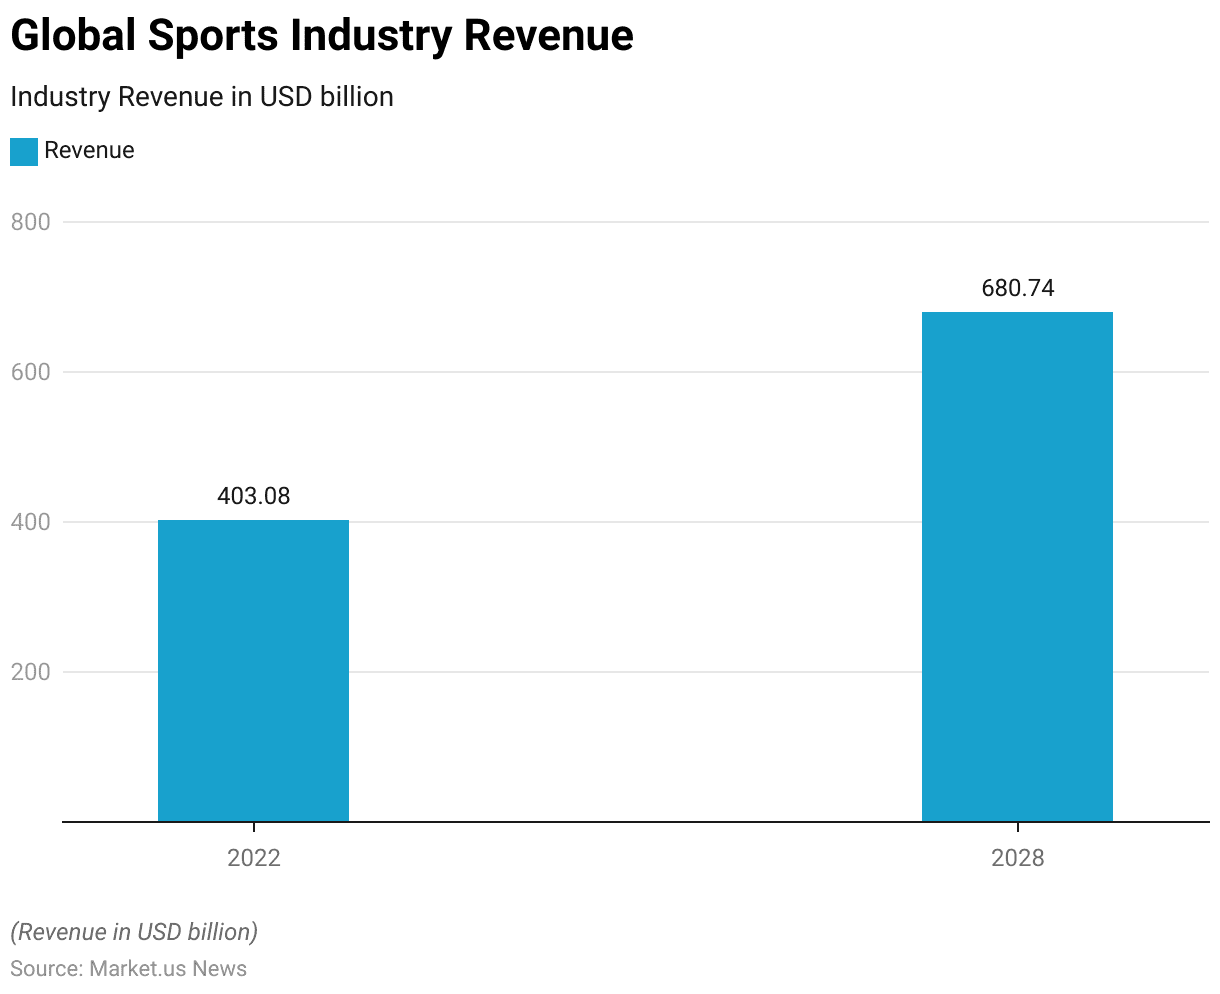
- The global sportswear market is projected to experience a steady growth trajectory over the next decade at a CAGR of 9.8%.
- In 2023, the market size is estimated at USD 335.8 billion, with an anticipated increase to USD 368.7 billion in 2024.
- This upward trend continues, reaching USD 404.8 billion in 2025 and USD 444.5 billion by 2026.
- By 2027, the market is expected to expand further to USD 488.1 billion, with substantial growth projected through the end of the decade.
- The market size is forecasted to reach USD 535.9 billion in 2028, USD 588.4 billion in 2029, and USD 646.1 billion by 2030.
- Growth accelerates in the early 2030s, with the market size expected to hit USD 709.4 billion in 2031, USD 778.9 billion in 2032, and culminating at USD 855.3 billion by 2033.
- This projected growth underscores a significant demand trajectory, positioning the sportswear industry for robust expansion throughout the forecast period.
(Source: market.us)
Global Sportswear Market Size – By Product Statistics
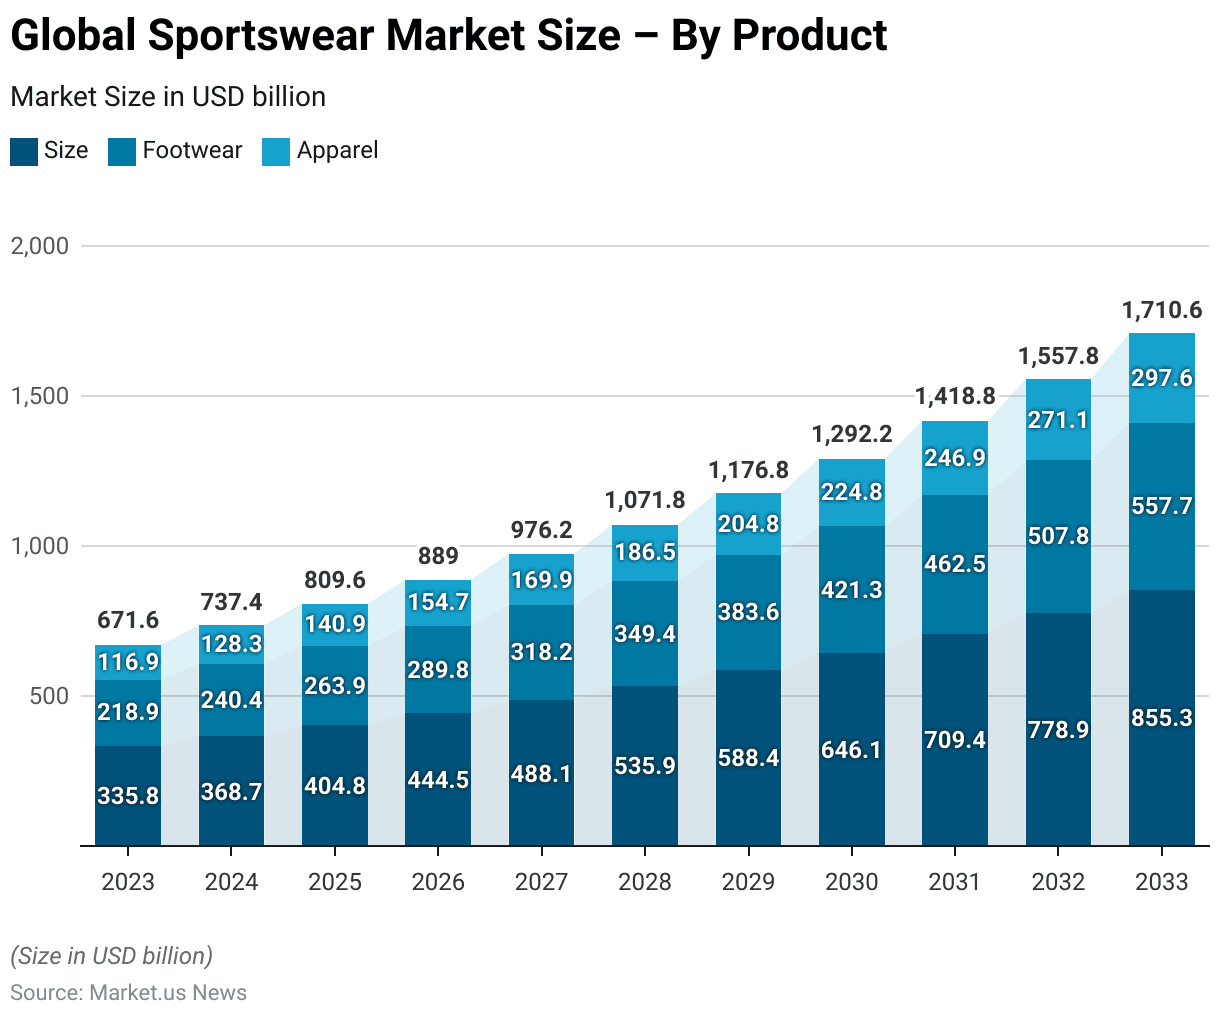
2023-2027
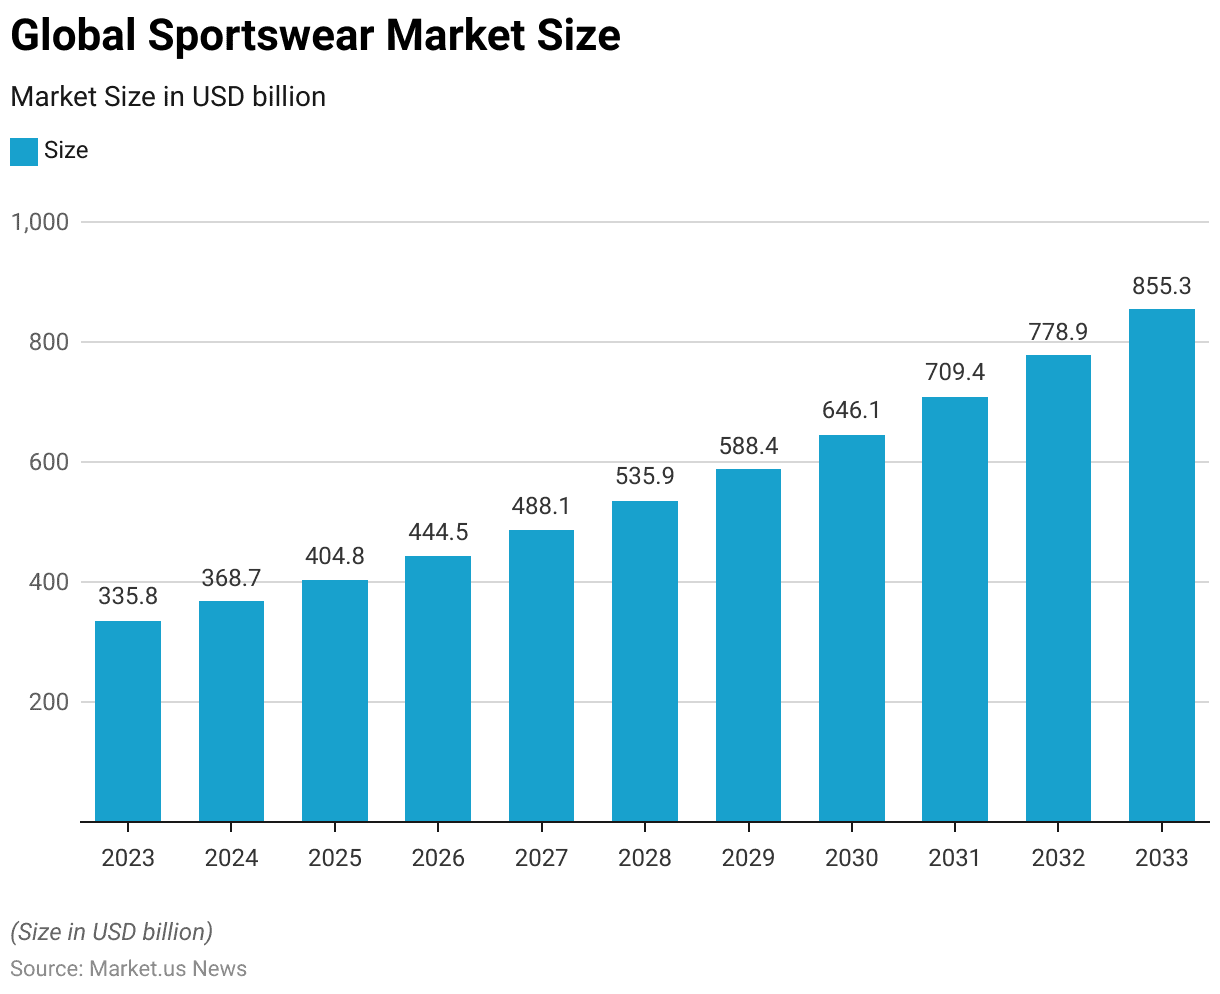
- The global sportswear market is poised for significant growth across both footwear and apparel segments over the next decade.
- In 2023, the overall market size stands at USD 335.8 billion, with footwear accounting for USD 218.9 billion and apparel contributing USD 116.9 billion.
- The market is projected to expand to USD 368.7 billion in 2024, with footwear and apparel segments reaching USD 240.4 billion and USD 128.3 billion, respectively.
- By 2025, the market size is expected to grow to USD 404.8 billion, with footwear at USD 263.9 billion and apparel at USD 140.9 billion.
- This upward trajectory continues, with the market anticipated to reach USD 444.5 billion in 2026, with footwear at USD 289.8 billion and apparel at USD 154.7 billion.
- In 2027, the total market is projected at USD 488.1 billion, with footwear comprising USD 318.2 billion and apparel USD 169.9 billion.
2028-2033
- Growth is set to accelerate further through 2028, reaching USD 535.9 billion, with footwear at USD 349.4 billion and apparel at USD 186.5 billion.
- By 2029, the market is expected to expand to USD 588.4 billion, with footwear at USD 383.6 billion and apparel at USD 204.8 billion.
- The upward trend continues into 2030, with the total market size reaching USD 646.1 billion, driven by footwear at USD 421.3 billion and apparel at USD 224.8 billion.
- In the early 2030s, the market size is projected to hit USD 709.4 billion in 2031, with footwear and apparel reaching USD 462.5 billion and USD 246.9 billion, respectively.
- By 2032, the market is forecasted to reach USD 778.9 billion, with footwear at USD 507.8 billion and apparel at USD 271.1 billion.
- The market is anticipated to culminate at USD 855.3 billion by 2033, with footwear contributing USD 557.7 billion and apparel USD 297.6 billion.
- This steady growth highlights the robust demand and expansion potential within the global sportswear industry across both primary product segments.
(Source: market.us)
Competitive Landscape of the Global Sportswear Market Statistics
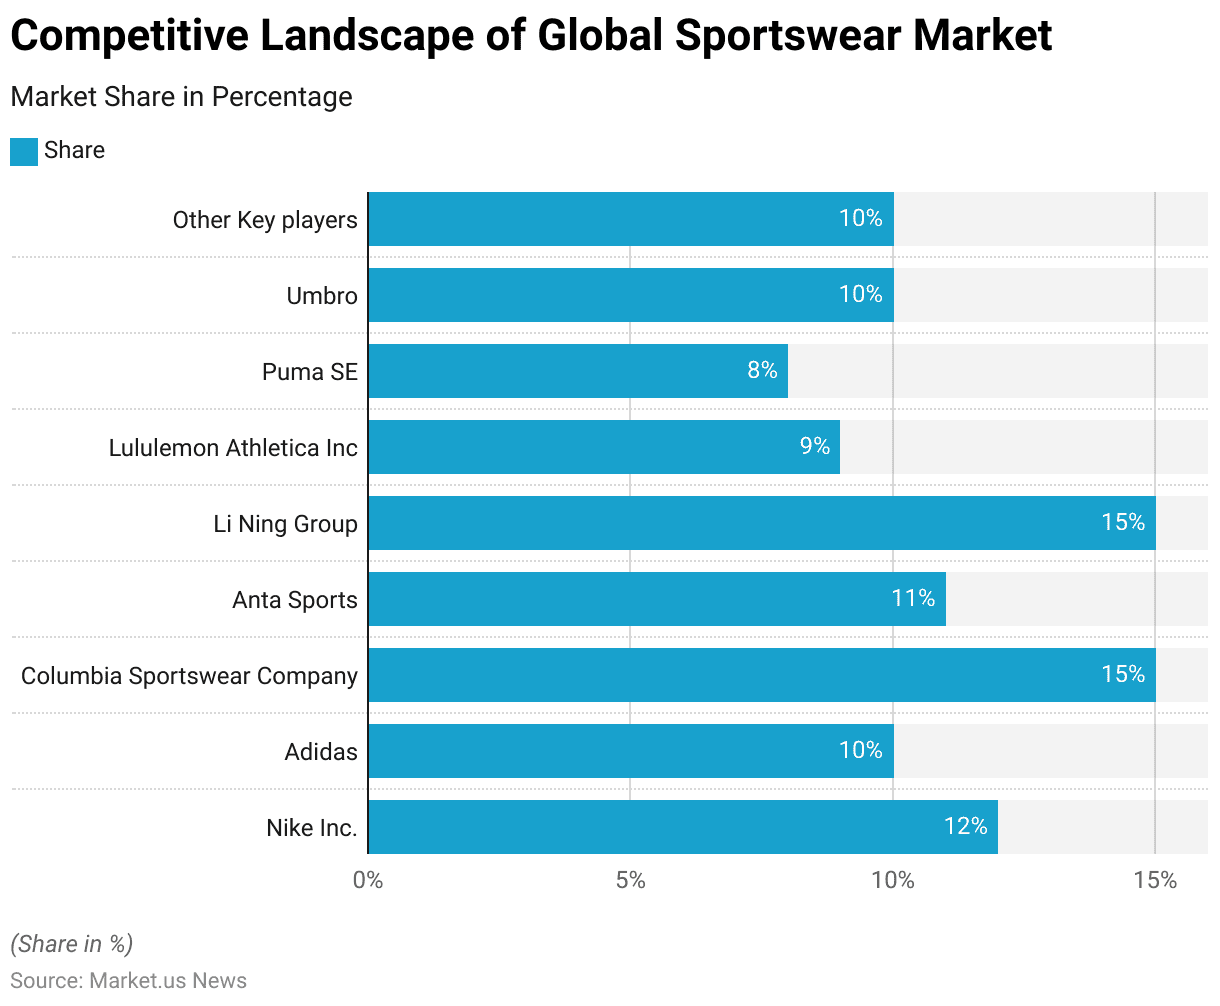
- The competitive landscape of the global sportswear market in 2022 reflects a diverse array of key players, each holding a significant share.
- Columbia Sportswear Company and Li Ning Group lead with the largest market shares at 15% each. Indicating a strong foothold in the global market.
- Nike Inc. follows with a substantial 12% share, reinforcing its position as a prominent player in the industry.
- Adidas and Umbro each hold a 10% share, illustrating their solid presence.
- Anta Sports captures 11% of the market, while Lululemon Athletica Inc. holds 9%. This signifies its growing influence, particularly in the athleisure segment.
- Puma SE, with an 8% share, rounds out the list of major players.
- Additionally, other key players collectively account for 10% of the market share.
- This distribution highlights a competitive market landscape with a mix of established international brands and emerging regional players. Each contributes to the overall growth and dynamism of the sportswear industry.
(Source: market.us)
Leading Sportswear Companies – By Market Capitalization Statistics
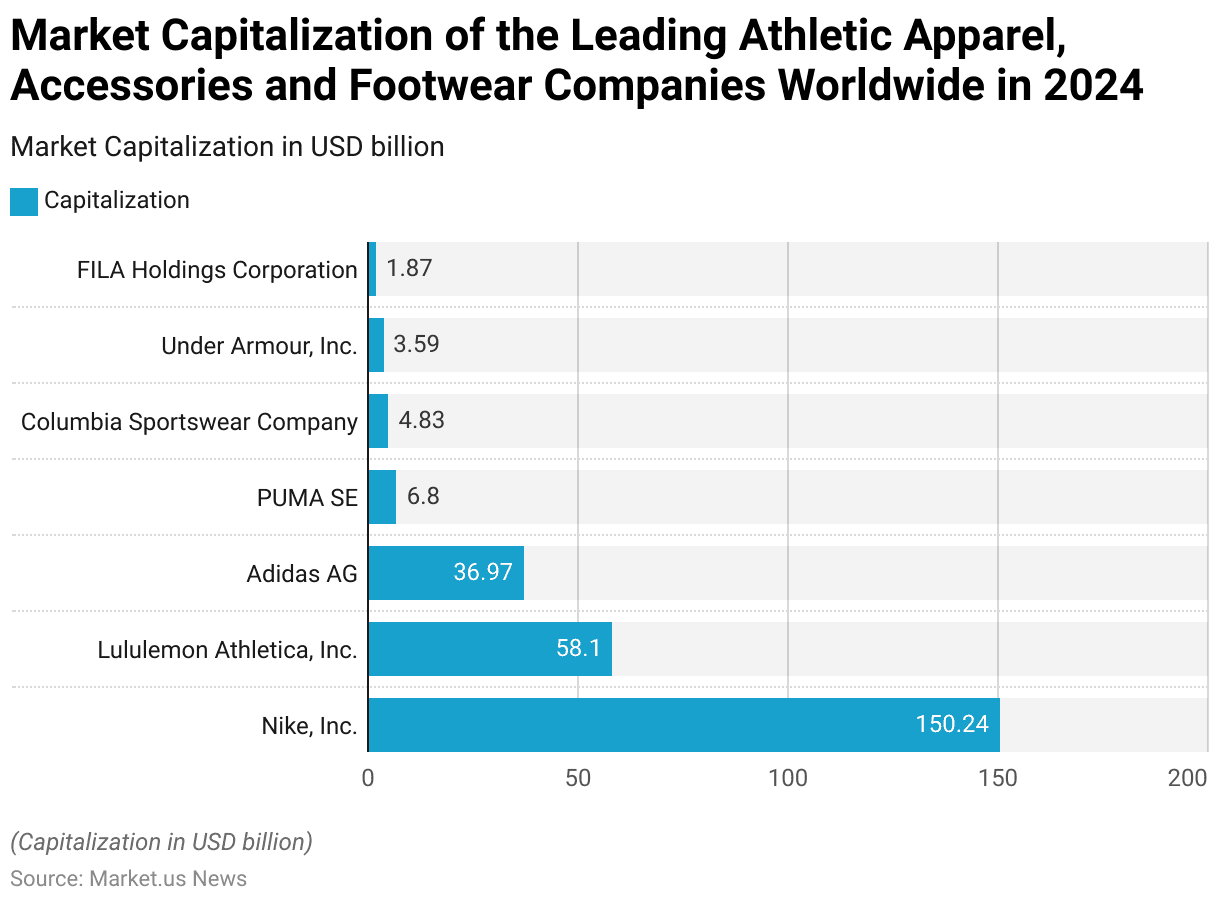
- As of 2024, Nike, Inc. leads the global sportswear market in terms of market capitalization, valued at USD 150.24 billion. Underscoring its dominant position in the athletic apparel, accessories, and footwear industry.
- Lululemon Athletica, Inc. follows with a substantial market capitalization of USD 58.1 billion. Reflecting its strong brand appeal and growth in the athleisure segment.
- Adidas AG ranks third with a market cap of USD 36.97 billion, maintaining its competitive standing in the global market.
- PUMA SE holds a market capitalization of USD 6.8 billion, positioning it as a significant player in the industry.
- Columbia Sportswear Company follows with a market cap of USD 4.83 billion. Indicating its steady presence, particularly in the outdoor and activewear sectors.
- Under Armour, Inc. has a market capitalization of USD 3.59 billion. While FILA Holdings Corporation completes the list with a market cap of USD 1.87 billion.
- This distribution reflects the varying scales and market positions of leading companies within the global sportswear industry, with Nike holding a commanding lead over its competitors.
(Source: Statista)
Global Sportswear Market Share – By Region Statistics
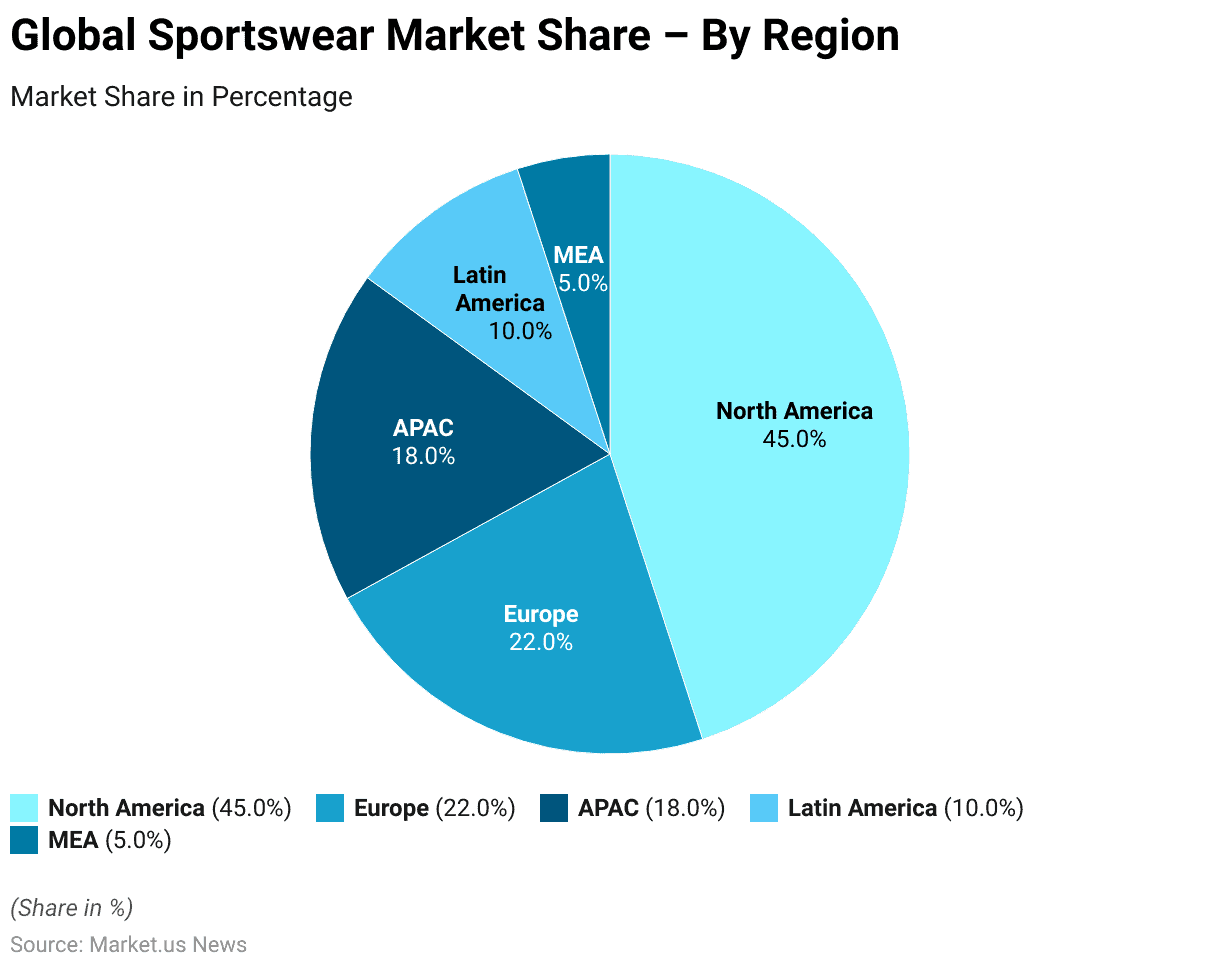
- In 2022, the global sportswear market exhibited a diverse regional distribution of market share, with North America leading significantly at 45.0%.
- This dominance reflects the region’s robust consumer base and strong preference for active lifestyles, as well as the presence of major global brands.
- Europe follows, accounting for 22.0% of the market share. Indicative of the region’s established demand for sportswear and the influence of athleisure trends.
- The Asia-Pacific (APAC) region holds an 18.0% share. Driven by rising health consciousness and growing interest in sports and fitness, particularly in emerging economies.
- Latin America represents 10.0% of the market, showing steady growth as consumer interest in sportswear increases across various segments.
- The Middle East and Africa (MEA) region, with a 5.0% share, completes the distribution. Marking a smaller but gradually expanding market as fitness awareness and participation in sports rise.
- This regional breakdown underscores the varying demand levels and growth opportunities for sportswear across global markets.
(Source: market.us)
Sports Apparel Market Size
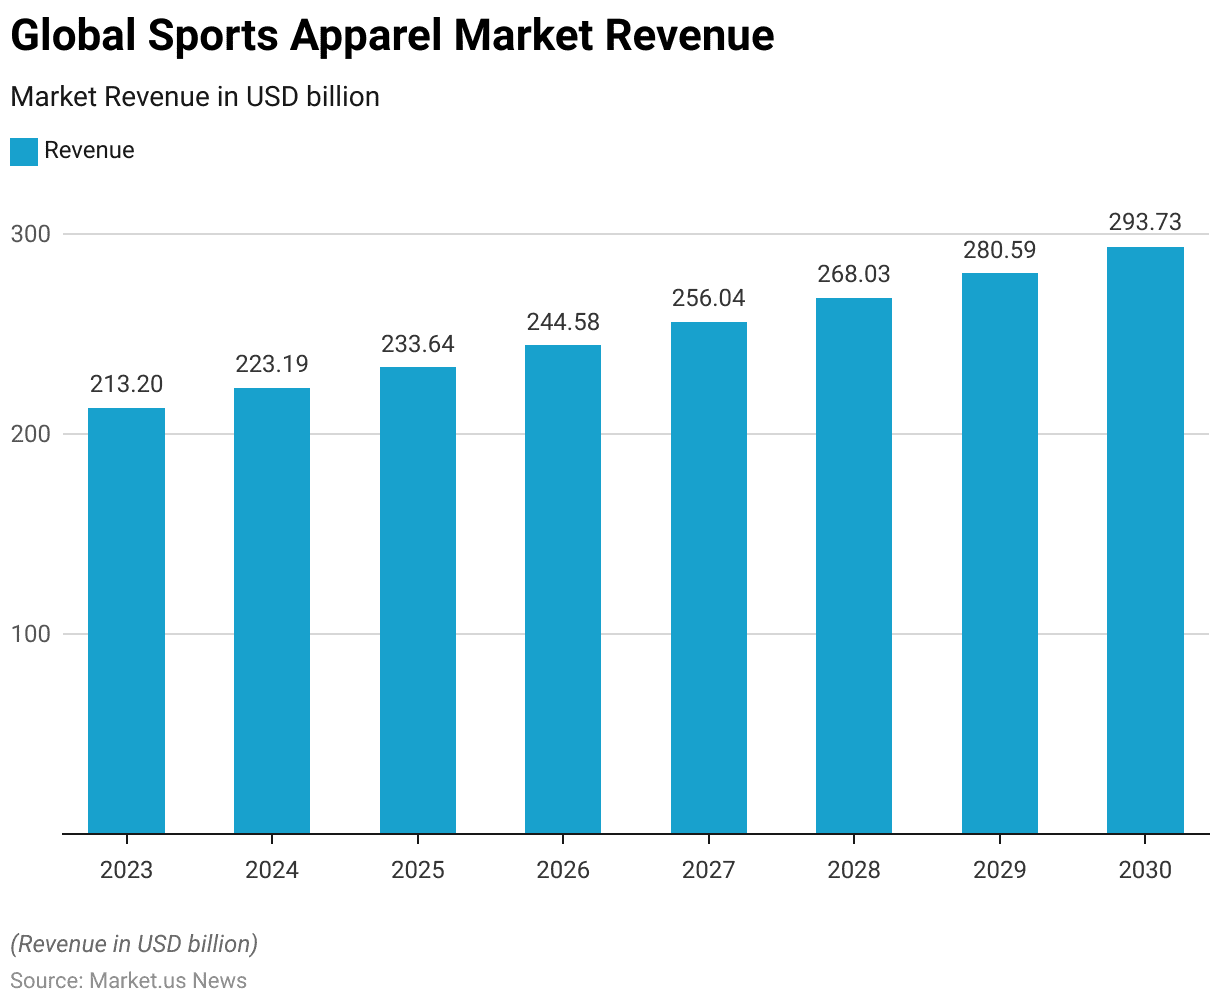
- The global sports apparel market is projected to experience steady revenue growth from 2023 to 2030.
- In 2023, the market revenue is estimated at USD 213.2 billion, with an anticipated increase to USD 223.19 billion in 2024.
- This upward trajectory is expected to continue in subsequent years. Reaching USD 233.64 billion in 2025 and USD 244.58 billion in 2026.
- By 2027, revenue is projected to rise further to USD 256.04 billion. Followed by an increase to USD 268.03 billion in 2028.
- In 2029, the market is forecasted to generate USD 280.59 billion. Culminating in a projected revenue of USD 293.73 billion by 2030.
- This growth reflects the sustained demand for sports apparel worldwide. Driven by factors such as rising health consciousness. Increased participation in sports, and the enduring popularity of athleisure trends across various consumer demographics.
(Source: Statista)
Global Activewear Market Size
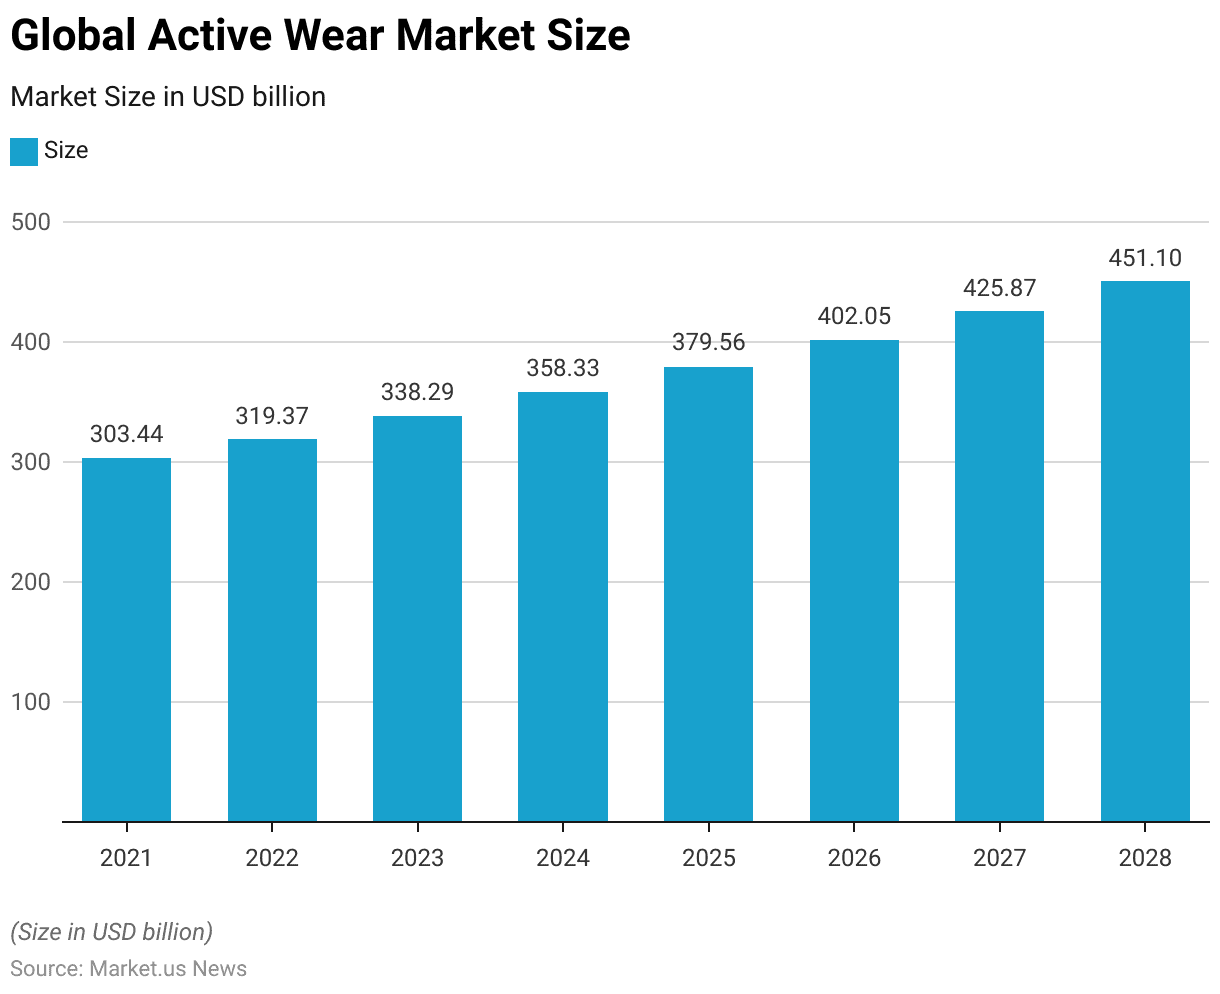
- The global activewear market has been experiencing consistent growth since 2021 and is projected to continue this upward trend through 2028.
- In 2021, the market size was valued at USD 303.44 billion, which increased to USD 319.37 billion in 2022.
- This growth trajectory is anticipated to persist, with the market reaching an estimated USD 338.29 billion in 2023 and USD 358.33 billion in 2024.
- By 2025, the market size is forecasted to expand further to USD 379.56 billion. Followed by USD 402.05 billion in 2026.
- In 2027, the activewear market is expected to reach USD 425.87 billion. Culminating in a projected valuation of USD 451.1 billion by 2028.
- This steady expansion reflects the rising global demand for activewear, driven by factors such as increasing health and fitness awareness. The popularity of athleisure trends, and a growing emphasis on an active lifestyle across various demographics worldwide.
(Source: Statista)
Women’s Sportswear Market Statistics
Global Women’s Sportswear Market Size Statistics
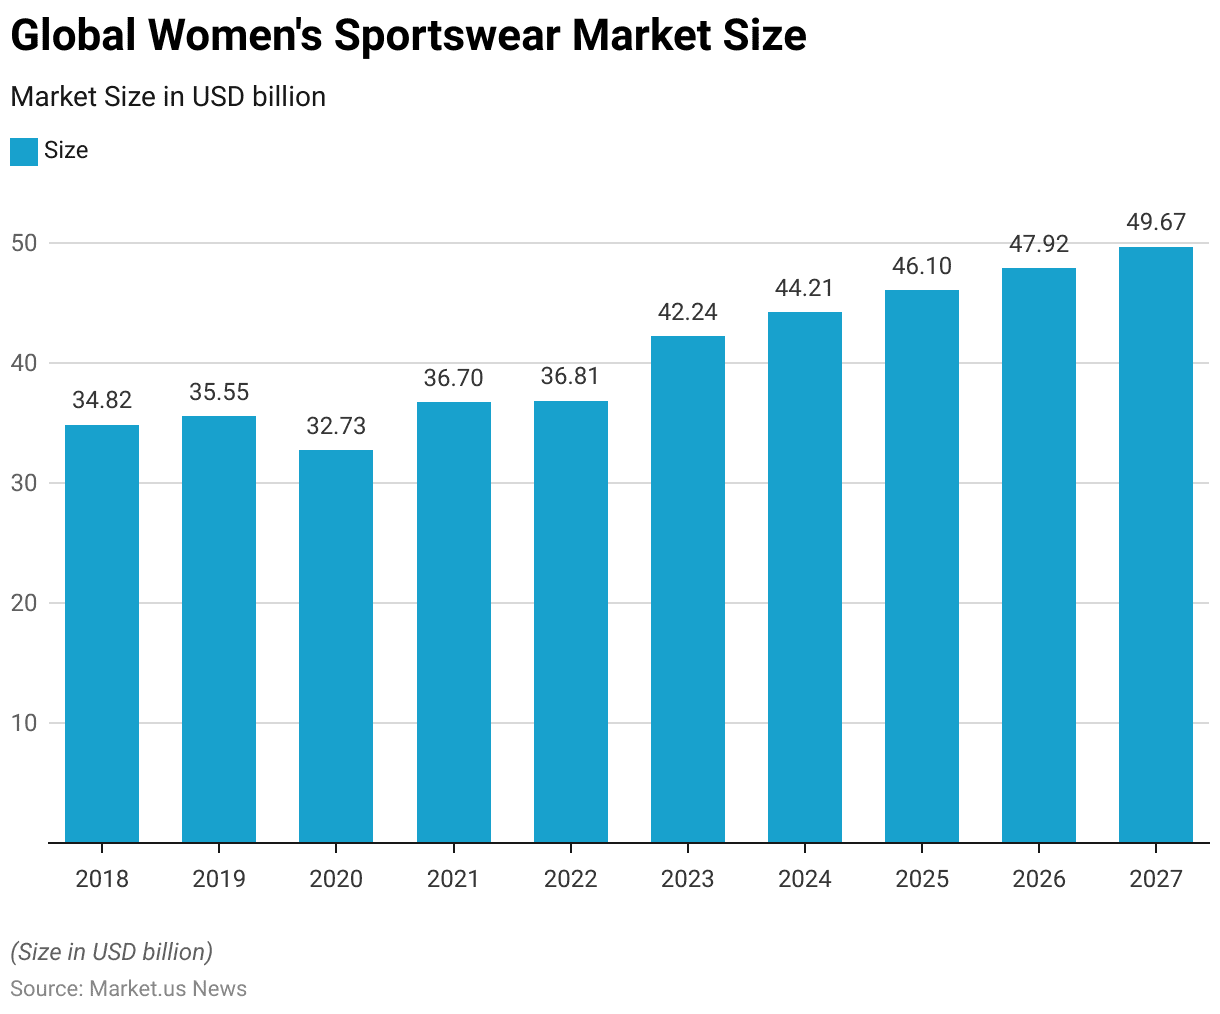
- The global women’s sportswear market has shown a fluctuating yet generally upward trend from 2018 and is expected to continue growing through 2027.
- In 2018, the market was valued at USD 34.82 billion, increasing slightly to USD 35.55 billion in 2019.
- However, in 2020, the market experienced a decline to USD 32.73 billion, likely impacted by global disruptions.
- Recovery began in 2021, with the market size reaching USD 36.7 billion. Followed by a modest increase to USD 36.81 billion in 2022.
- Significant growth is anticipated in the coming years, with the market projected to reach USD 42.24 billion in 2023 and continue expanding to USD 44.21 billion in 2024.
- By 2025, the women’s sportswear market is expected to be valued at USD 46.1 billion. Rising further to USD 47.92 billion in 2026.
- The forecasted market size for 2027 is USD 49.67 billion. Reflecting sustained demand for women’s sports apparel.
- This growth trajectory highlights increasing consumer interest in fitness and active lifestyles. Along with the growing importance of women’s segments in the sportswear industry globally.
(Source: Statista)
Revenue of the Women’s Sportswear and Swimwear Segment of the Worldwide Apparel Market Statistics
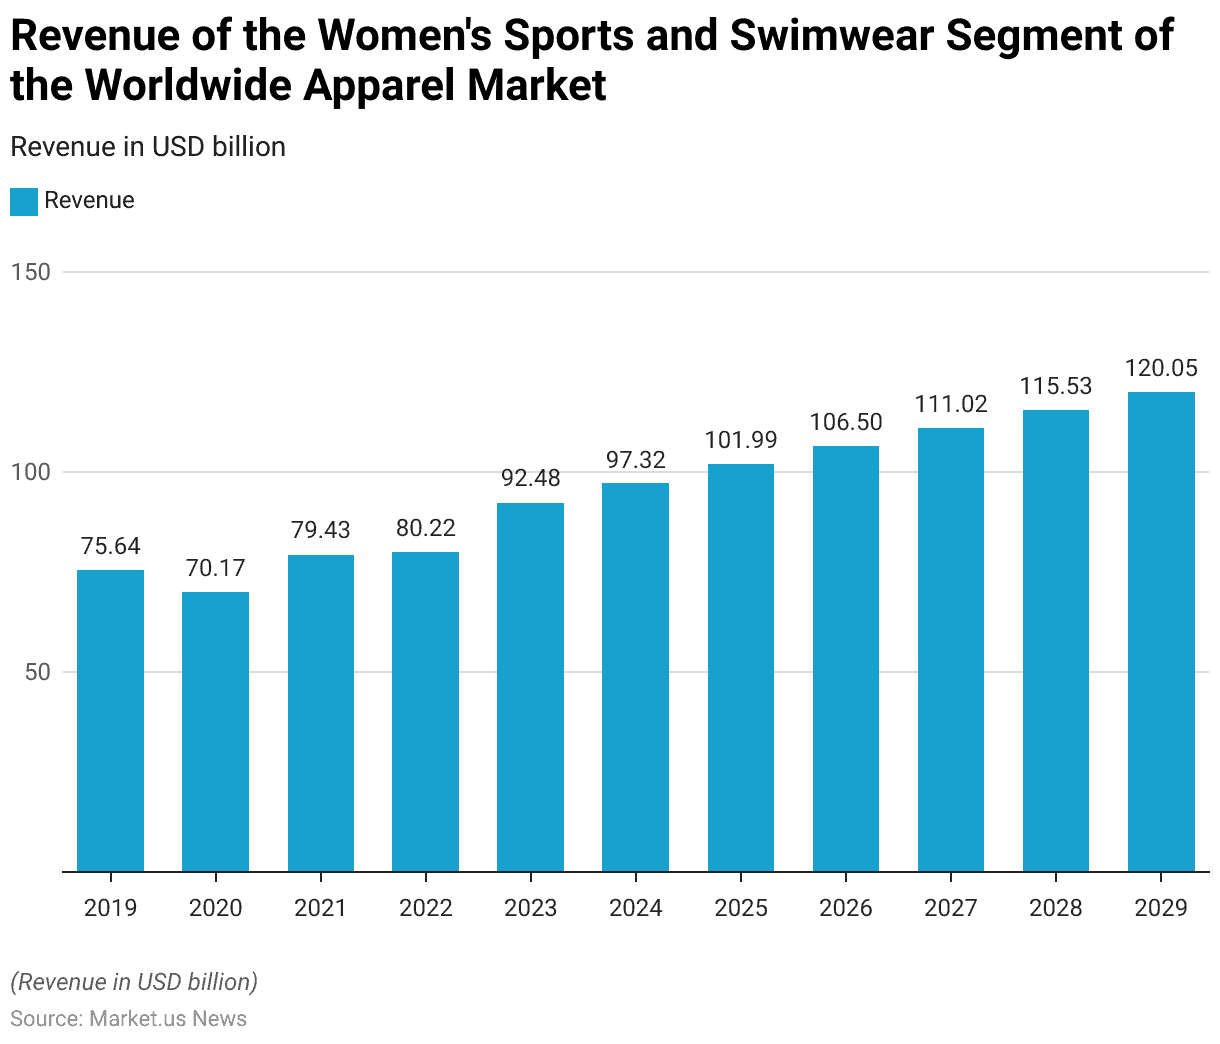
- The revenue of the women’s sports and swimwear segment within the global apparel market has shown notable growth from 2019 and is projected to continue this trend through 2029.
- In 2019, the segment generated USD 75.64 billion in revenue. Followed by a decline in 2020 to USD 70.17 billion, likely due to global disruptions affecting retail and consumer spending.
- Recovery was evident in 2021, with revenue increasing to USD 79.43 billion, and further growth was recorded in 2022, reaching USD 80.22 billion.
- In 2023, a significant rise in revenue to USD 92.48 billion marked an accelerated growth phase, with continued expansion projected in the following years.
- By 2024, the revenue is expected to reach USD 97.32 billion. Increasing to USD 101.99 billion in 2025 and USD 106.5 billion in 2026.
- The upward trajectory is forecasted to persist, with the segment projected to generate USD 111.02 billion in 2027, USD 115.53 billion in 2028, and culminating at USD 120.05 billion by 2029.
- This consistent growth underscores a rising demand for women’s sports and swimwear. Driven by factors such as an increasing focus on fitness, wellness, and an active lifestyle among women worldwide.
(Source: Statista)
Sportswear Companies Sales Statistics
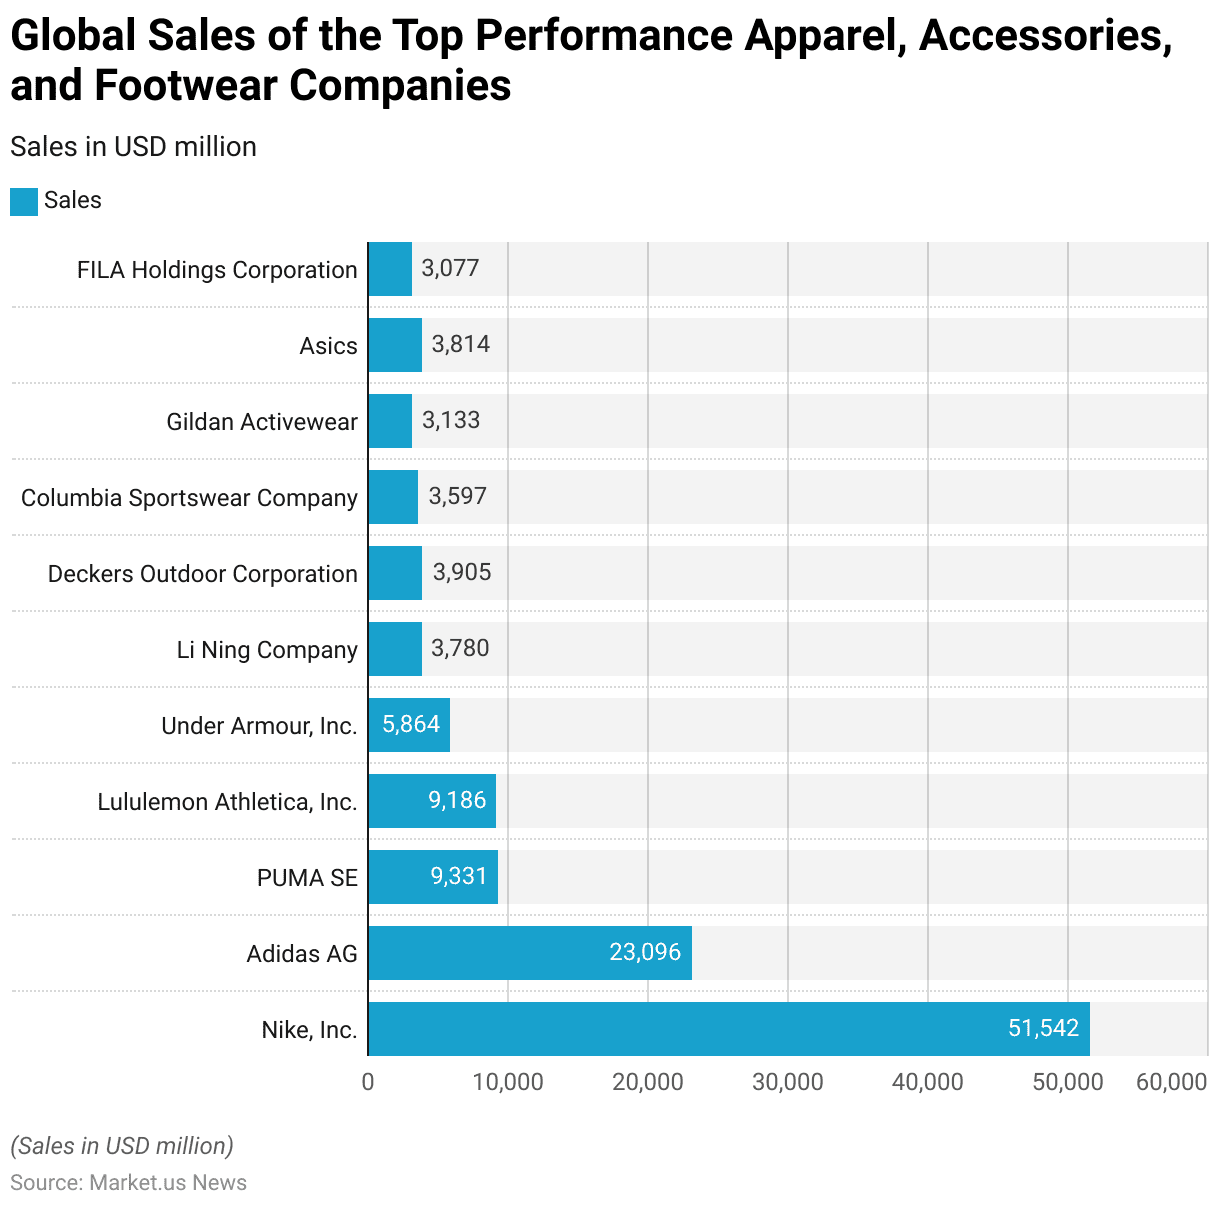
Global Sales of the Top Performance Apparel, Accessories, and Footwear Companies
- In 2023, Nike, Inc. led the global athletic apparel, accessories, and footwear market with sales totaling USD 51,542 million. Highlighting its position as the industry’s dominant player.
- Adidas AG followed as the second-largest company with sales of USD 23,096 million, showcasing its substantial market presence.
- PUMA SE and Lululemon Athletica, Inc. reported similar sales figures, at USD 9,331 million and USD 9,186 million, respectively. Underscoring their strong performance within the industry.
- Under Armour, Inc. achieved sales of USD 5,864 million, positioning it as a key competitor in the market.
- Li Ning Company and Deckers Outdoor Corporation reported sales of USD 3,780 million and USD 3,905 million, respectively. Reflecting their growing influence in the global market.
- Columbia Sportswear Company followed with sales of USD 3,597 million. While Asics recorded sales of USD 3,814 million, highlighting its steady demand among consumers.
- Gildan Activewear and FILA Holdings Corporation reported sales of USD 3,133 million and USD 3,077 million, respectively.
- This data reflects the competitive landscape in the sportswear sector, with Nike maintaining a substantial lead over other global companies in terms of sales.
(Source: Statista)
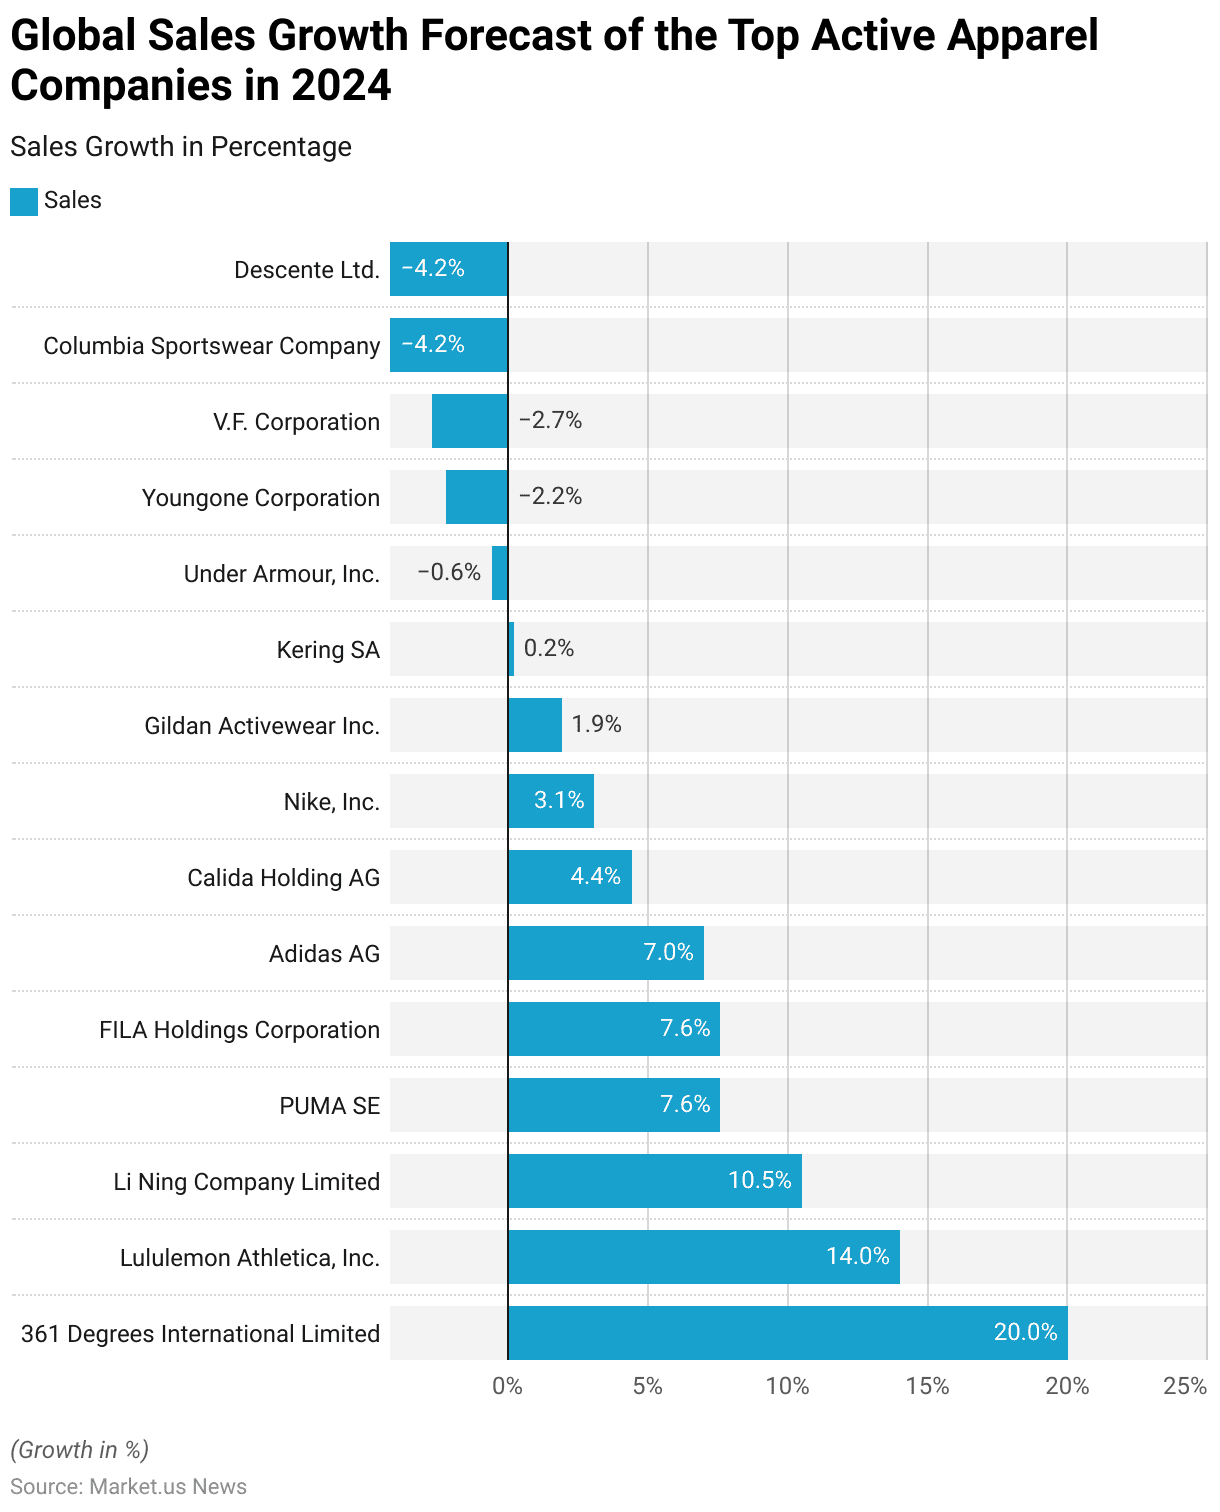
Global Sales Growth Forecast of the Top Active Apparel Companies
- In 2024, the sales growth forecast for leading active apparel companies worldwide reveals a varied performance outlook.
- 361 Degrees International Limited is projected to lead with a robust sales growth of 20%. Reflecting strong momentum in the market.
- Lululemon Athletica, Inc. is also expected to perform well, with a projected growth of 14%. Followed by Li Ning Company Limited, with a forecasted growth of 10.5%.
- PUMA SE and FILA Holdings Corporation each anticipate a growth rate of 7.6%. While Adidas AG is expected to see a 7% increase in sales.
- Calida Holding AG is projected to achieve moderate growth at 4.4%, and Nike, Inc. is expected to grow by 3.1%.
- Gildan Activewear Inc. has a modest forecast of 1.9% growth, with Kering SA expected to see minimal growth at 0.2%.
- However, some companies are projected to experience a decline in sales in 2024, with Under Armour, Inc. forecasted to decrease by 0.6%, Youngone Corporation by 2.2%, and V.F. Corporation by 2.7%.
- Columbia Sportswear Company and Descente Ltd. are both expected to see a sales contraction of 4.2%.
- These varied forecasts highlight the competitive nature of the active apparel market, with some brands poised for significant growth while others face potential challenges in the upcoming year.
(Source: Statista)
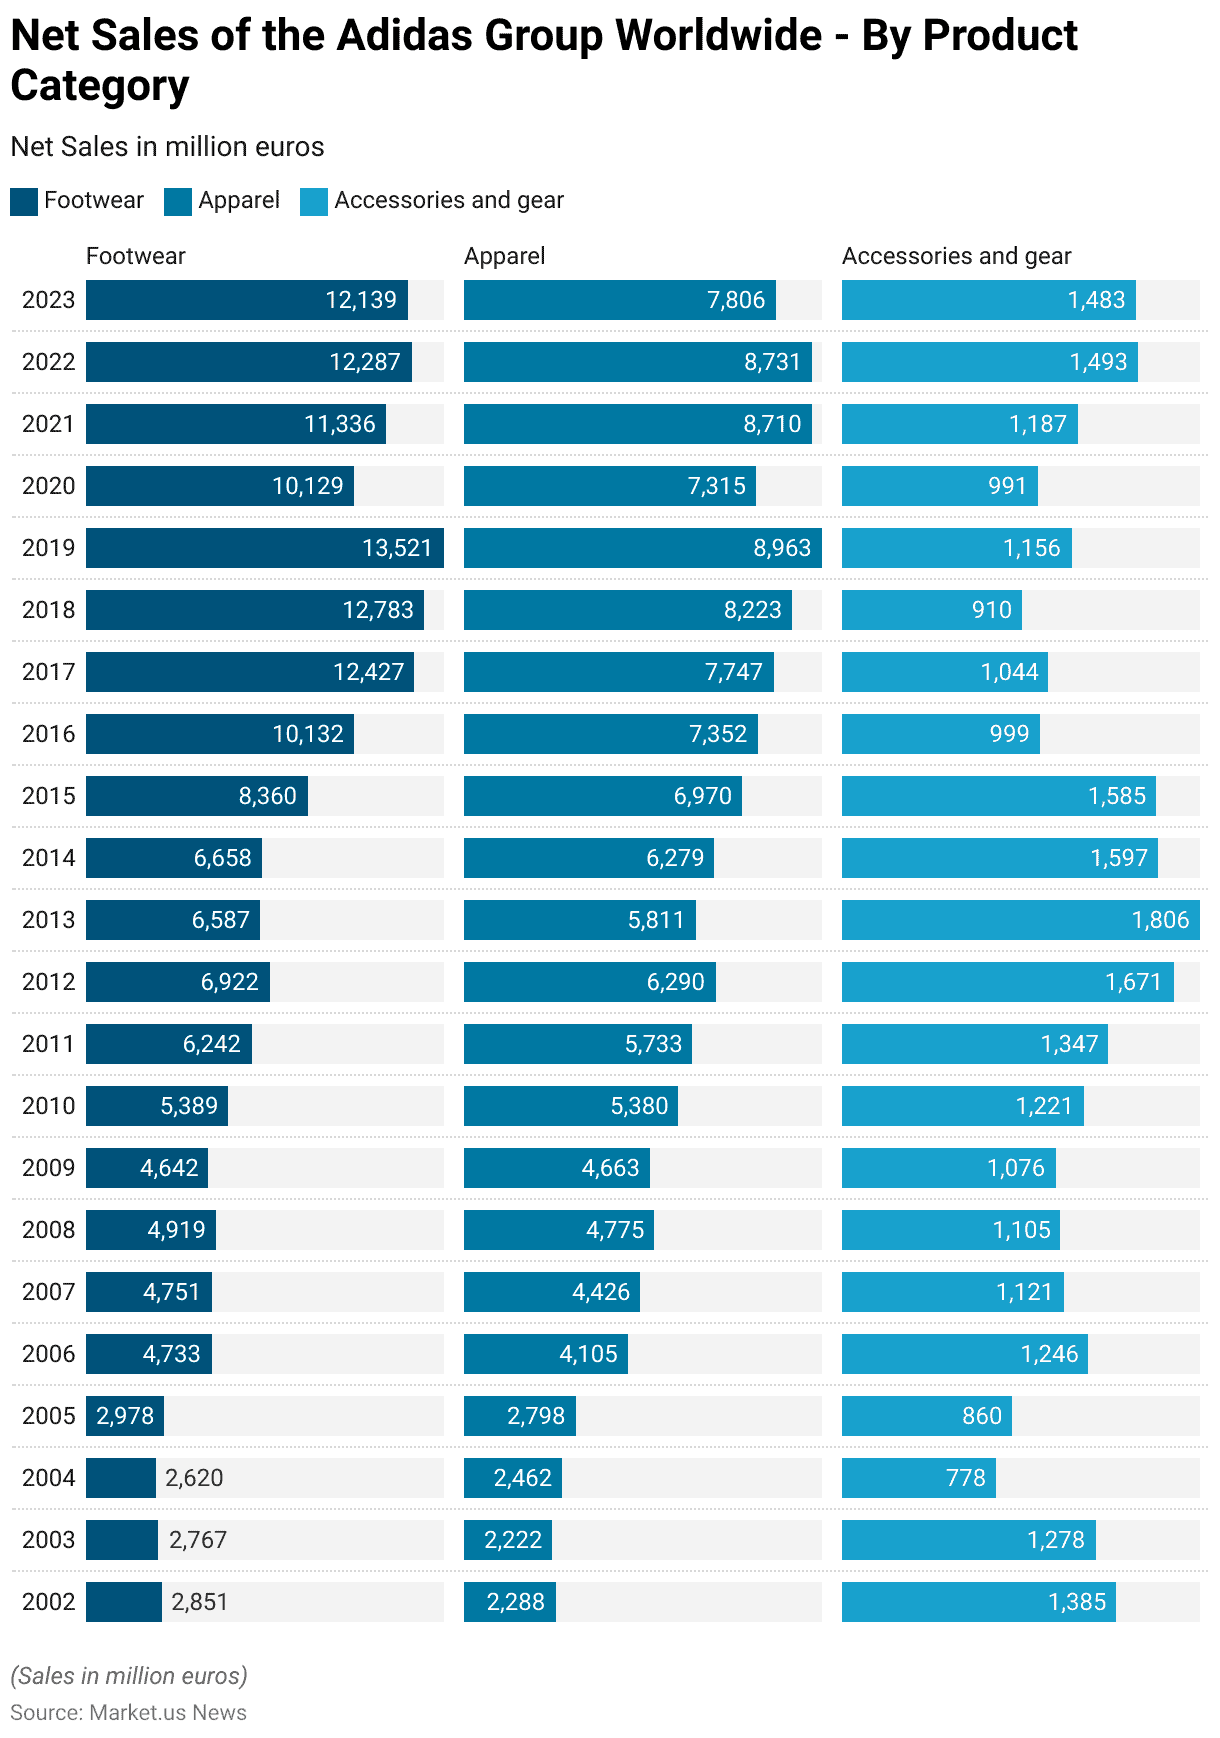
Net Sales of the Adidas Group Worldwide – By Product Category
2002-2017
- From 2002 to 2017, the Adidas Group experienced significant shifts in its net sales across footwear, apparel, and accessories categories.
- In 2002, footwear sales were at EUR 2,851 million. Apparel at EUR 2,288 million, and accessories and gear at EUR 1,385 million.
- The following years saw fluctuations, with a notable increase in 2006 when footwear sales surged to EUR 4,733 million. Apparel to EUR 4,105 million, and accessories to EUR 1,246 million.
- This growth continued, and by 2011, footwear sales reached EUR 6,242 million. While apparel sales were EUR 5,733 million, and accessories rose to EUR 1,347 million.
- The upward trend persisted, peaking in 2017 with footwear sales at EUR 12,427 million. Apparel at EUR 7,747 million, and accessories at EUR 1,044 million.
2018-2023
- In 2018 and 2019, Adidas continued to see growth, with footwear reaching EUR 13,521 million and apparel EUR 8,963 million by 2019.
- However, in 2020, the impact of global disruptions led to a decline, with footwear sales dropping to EUR 10,129 million and apparel to EUR 7,315 million. While accessories fell slightly to EUR 991 million.
- Recovery was evident in 2021, with footwear sales increasing to EUR 11,336 million and apparel to EUR 8,710 million.
- This growth continued in 2022, with footwear reaching EUR 12,287 million, apparel EUR 8,731 million, and accessories and gear EUR 1,493 million.
- However, in 2023, footwear sales slightly decreased to EUR 12,139 million, and apparel sales also saw a decline to EUR 7,806 million. While accessories remained relatively stable at EUR 1,483 million.
- This trajectory illustrates Adidas Group’s expansion over two decades, with footwear consistently driving the highest revenue. Followed by apparel and accessories, and highlights the company’s resilience amid economic fluctuations.
(Source: Statista)
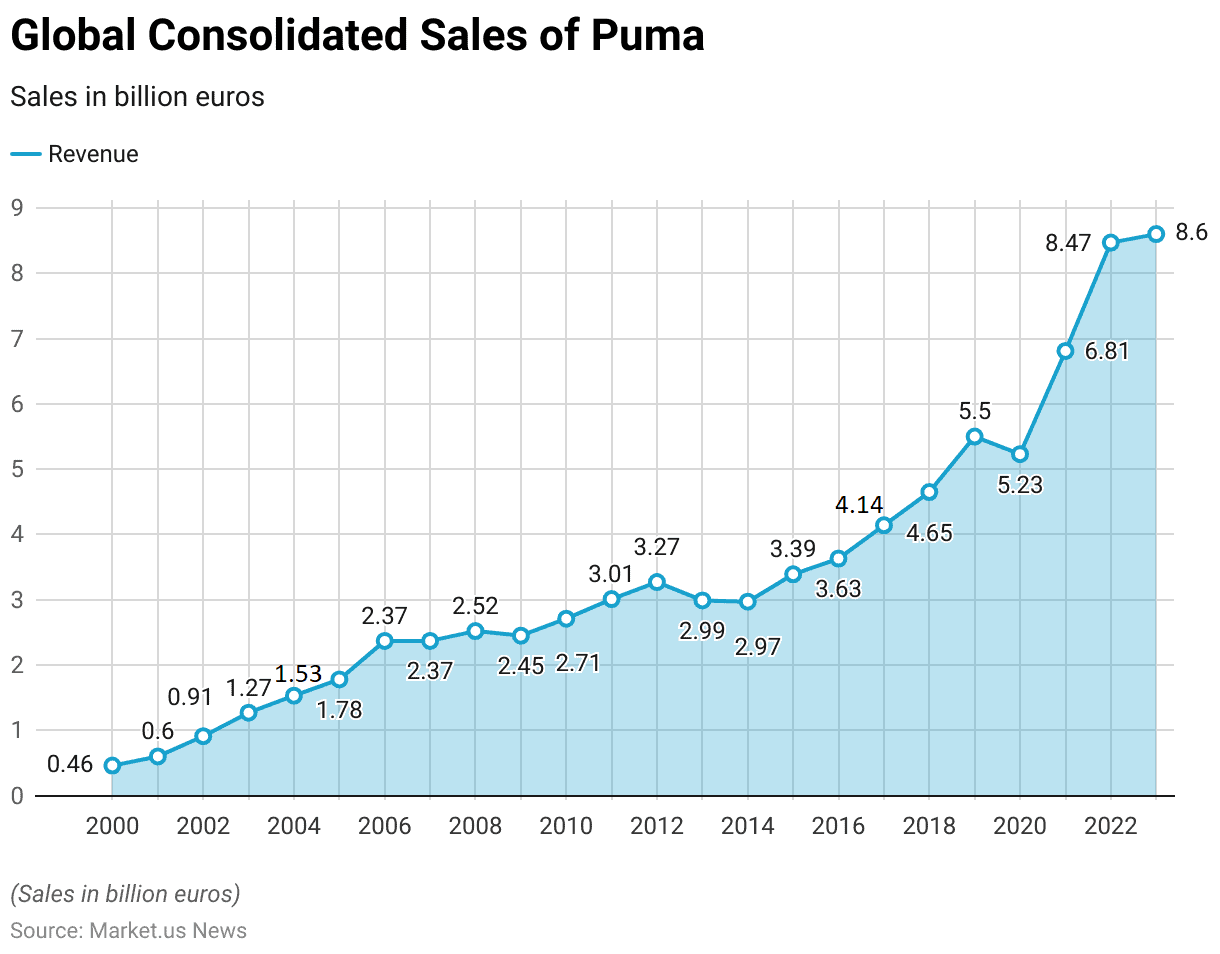
Global Consolidated Sales of Puma
2000-2014
- From 2000 to 2014, Puma’s global consolidated sales exhibited a steady and substantial growth trajectory.
- In 2000, Puma’s revenue was EUR 0.46 billion, which increased to EUR 0.6 billion in 2001 and further to EUR 0.91 billion by 2002.
- The company crossed the EUR 1 billion mark in 2003, achieving EUR 1.27 billion, and continued this upward momentum, reaching EUR 1.53 billion in 2004 and EUR 1.78 billion in 2005.
- By 2006, Puma’s revenue grew to EUR 2.37 billion. Maintaining the same figure in 2007 before a slight increase to EUR 2.52 billion in 2008.
- During the global economic downturn, Puma experienced a minor dip to EUR 2.45 billion in 2009, but growth resumed in 2010 with EUR 2.71 billion in revenue.
- This positive trend continued, with sales reaching EUR 3.01 billion in 2011 and EUR 3.27 billion in 2012.
- However, 2013 and 2014 saw slight declines to EUR 2.99 billion and EUR 2.97 billion, respectively.
2015-2023
- Recovery followed in 2015, with revenue rising to EUR 3.39 billion, and by 2016, Puma achieved EUR 3.63 billion.
- Significant growth was observed from 2017 onwards, as Puma’s sales reached EUR 4.14 billion in 2017 and continued to climb to EUR 4.65 billion in 2018 and EUR 5.5 billion in 2019.
- Despite a minor decline in 2020 to EUR 5.23 billion due to global disruptions, Puma’s revenue rebounded strongly in 2021, reaching EUR 6.81 billion.
- This growth trend continued with EUR 8.47 billion in 2022, culminating in a peak of EUR 8.6 billion in 2023.
- This consistent growth over the years underscores Puma’s expanding presence and resilience in the global sportswear market. Achieving substantial sales growth even amid economic challenges.
(Source: Statista)
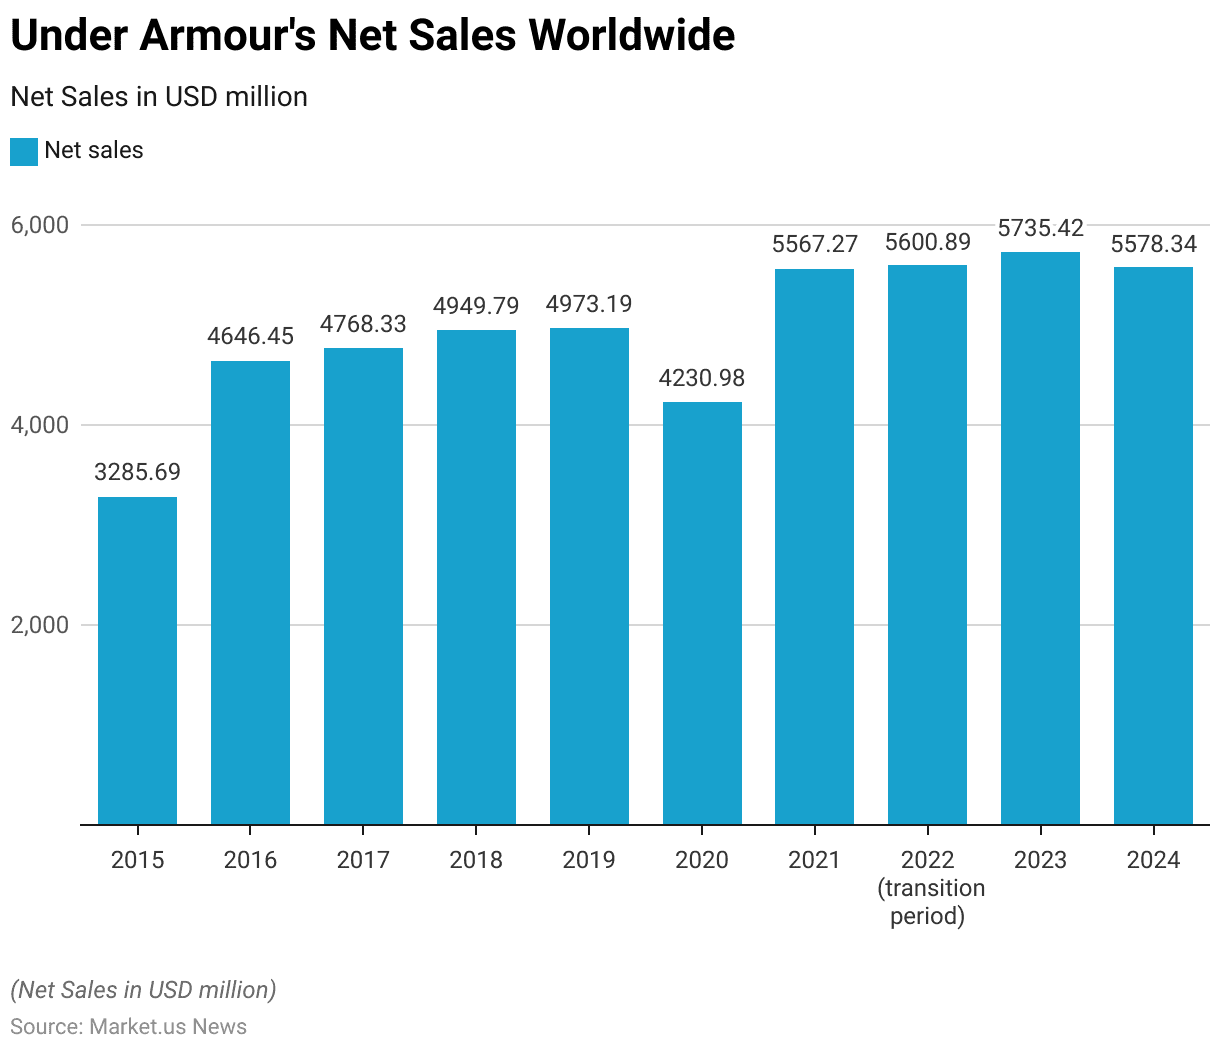
Under Armour’s Net Sales Worldwide
- Under Armour’s net sales worldwide showed significant fluctuations from 2015 through the projected figures for 2024.
- In 2015, Under Armour reported net sales of USD 3,285.69 million. Which saw a strong increase to USD 4,646.45 million in 2016 and continued to grow in 2017, reaching USD 4,768.33 million.
- This growth trajectory persisted into 2018 and 2019, with net sales of USD 4,949.79 million and USD 4,973.19 million, respectively.
- In 2020, however, net sales declined to USD 4,230.98 million, likely impacted by global economic disruptions.
- A strong recovery followed in 2021, with sales surging to USD 5,567.27 million, and further growth was recorded in 2022 during a transition period, with net sales reaching USD 5,600.89 million.
- In 2023, Under Armour’s net sales increased to USD 5,735.42 million.
- However, projections for 2024 suggest a slight decrease to USD 5,578.34 million.
- This trend reflects Under Armour’s resilience and capacity for recovery. Despite occasional downturns, it continues to navigate a competitive global market.
(Source: Statista)
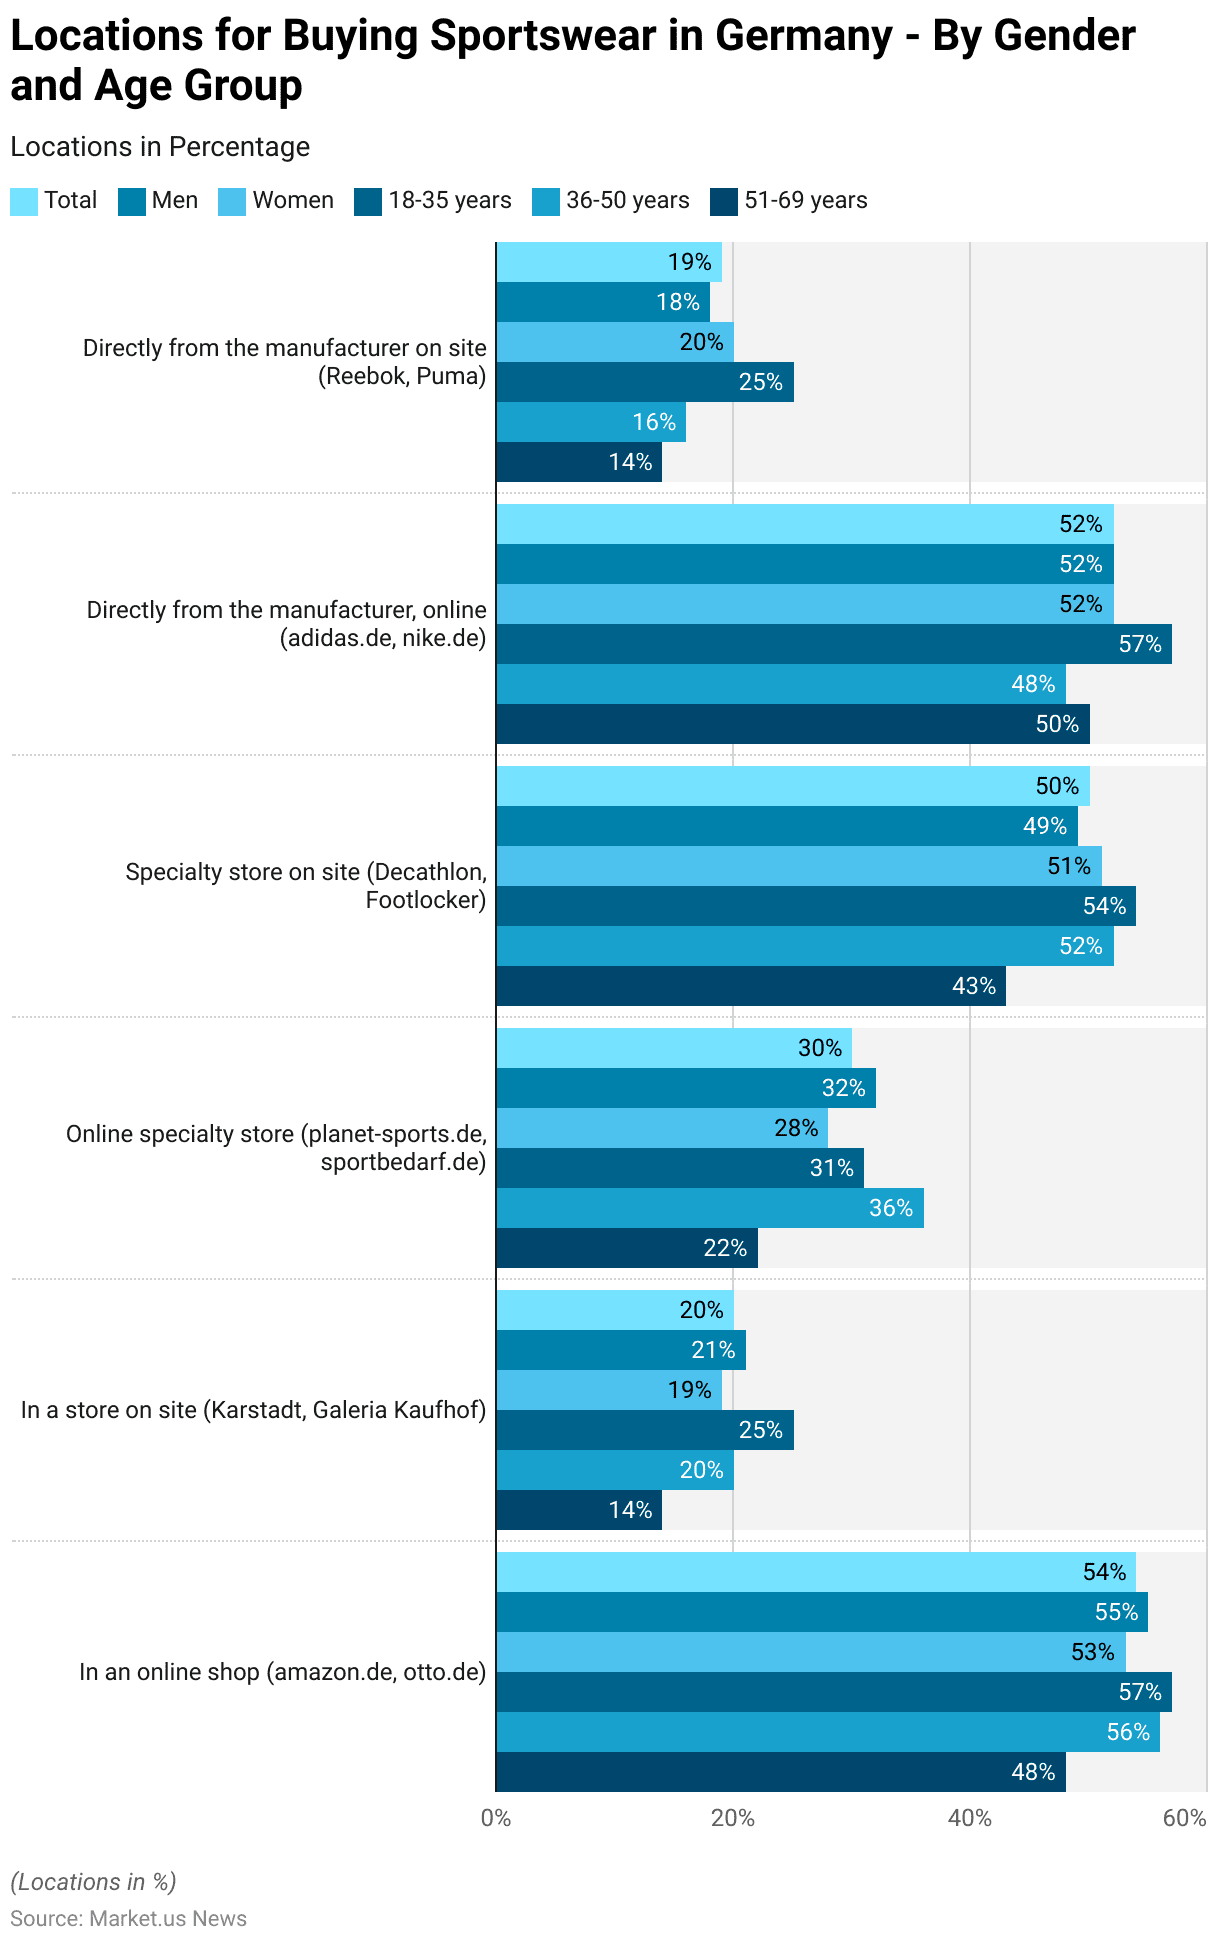
Locations for Buying Sportswear in Germany – By Gender and Age Group Statistics
High Preference
- In 2016, the preferred locations for purchasing sportswear in Germany varied by gender and age group.
- Overall, 54% of consumers bought sportswear from online shops such as Amazon and Otto, with a slightly higher proportion of men (55%) than women (53%) choosing this option.
- Online shopping was particularly popular among younger age groups, with 57% of those aged 18-35 and 56% of those aged 36-50 shopping online, compared to 48% in the 51-69 age group.
- Purchasing sportswear in physical stores like Karstadt and Galeria Kaufhof was less common. Chosen by 20% of respondents overall, with slight preferences among men (21%) compared to women (19%) and higher popularity among the 18-35 age group (25%) compared to older consumers (14% in the 51-69 age group).
- Online specialty stores, such as planet-sports.de and sportbedarf.de, were used by 30% of respondents, with a slight gender difference (32% men, 28% women) and a stronger preference among the 36-50 age group (36%) compared to the 51-69 age group (22%).
Mid-level Preference
- Specialty stores on site, including Decathlon and Footlocker, were chosen by half of the respondents, with similar preferences across genders (49% men, 51% women) and higher popularity among younger shoppers (54% for 18-35 years) compared to older consumers (43% for 51-69 years).
- Direct purchases from manufacturers’ websites, like adidas.de and nike.de, were preferred by 52% of consumers, with equal appeal to both men and women and especially high interest among the 18-35 age group (57%).
- Purchasing directly from manufacturers at physical locations. Such as Reebok or Puma stores, were less common overall, with 19% of respondents choosing this option.
- It was slightly more popular among women (20%) than men (18%) and showed higher preference among the youngest age group (25%) compared to older shoppers, with only 14% of those aged 51–69 choosing this option.
- This data reflects diverse purchasing preferences based on gender and age in Germany’s sportswear market.
(Source: Statista)
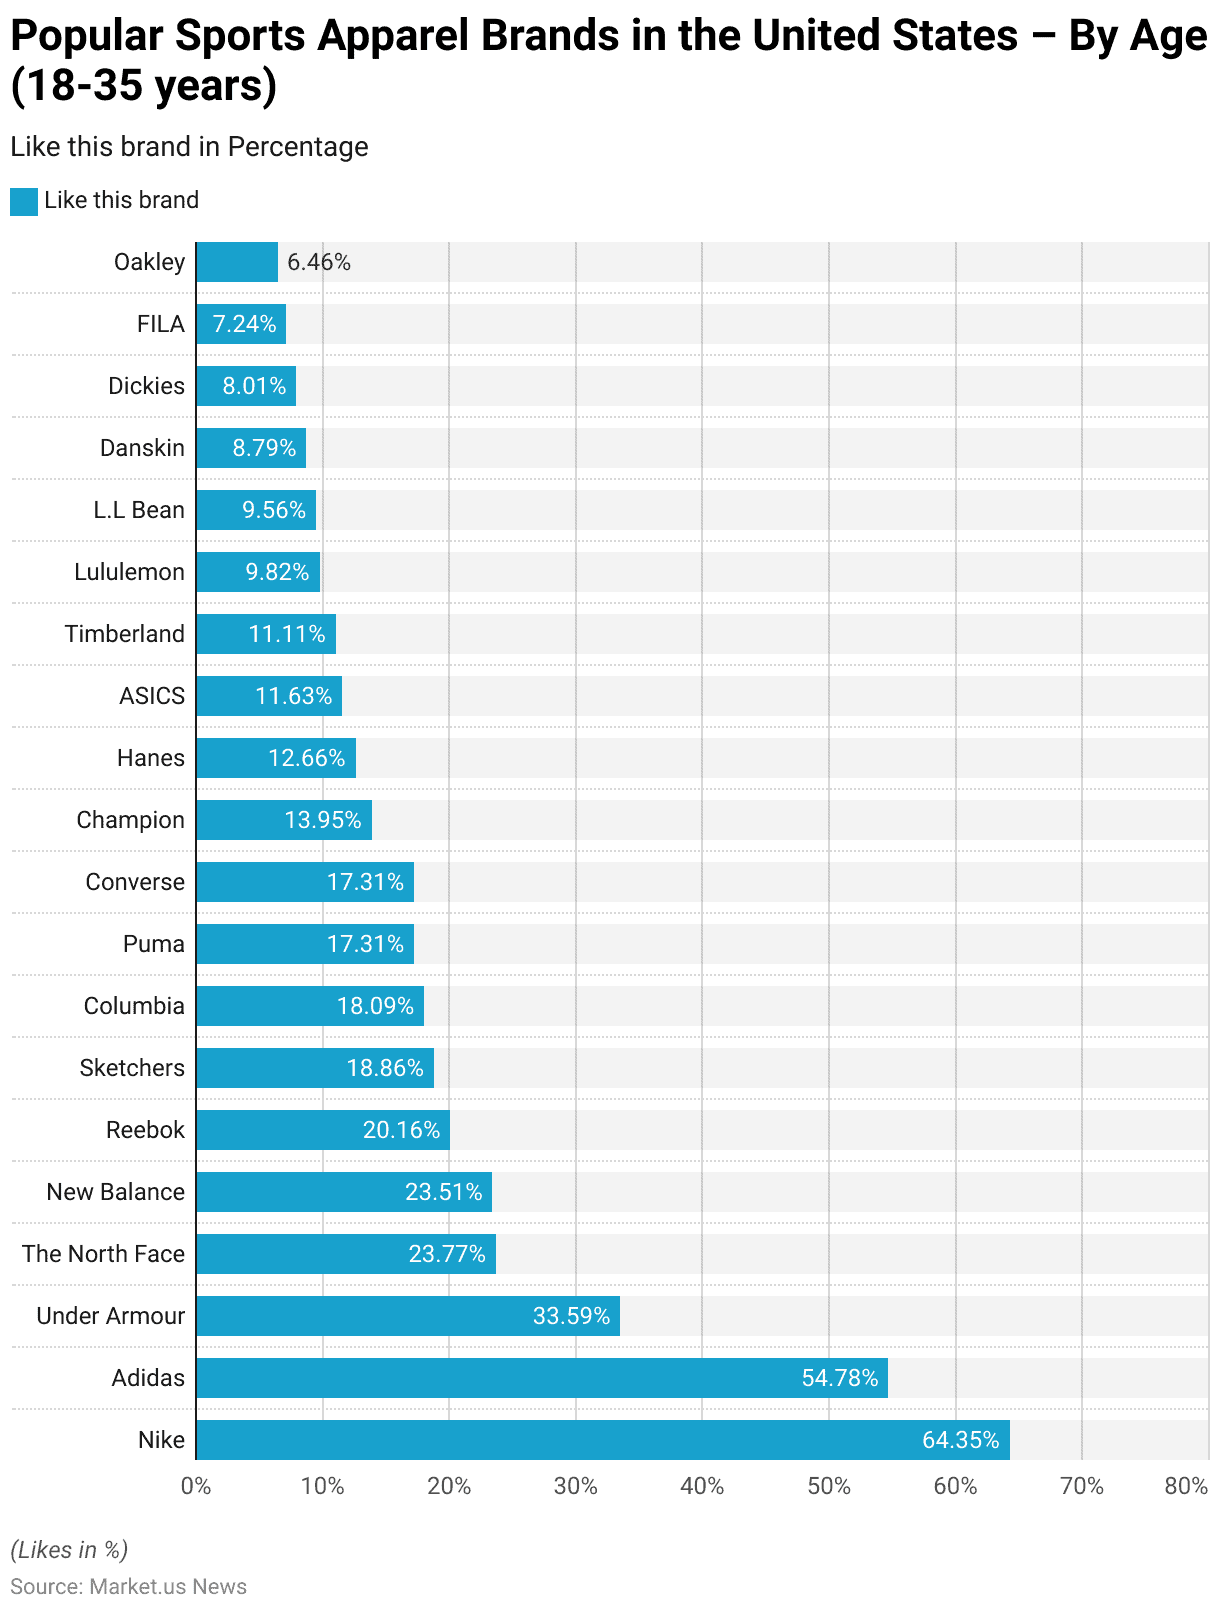
Popular Sports Apparel Brands in the United States – By Age (18-35 years)
- In 2016, Nike was the most-liked sports apparel brand among 18 to 35-year-olds in the United States, with 64.35% of respondents favoring it.
- Adidas followed as the second-most preferred brand, with 54.78% expressing a liking.
- Under Armour was popular with 33.59% of this age group. While The North Face and New Balance were liked by 23.77% and 23.51% of respondents, respectively.
- Reebok garnered 20.16% support, and Sketchers was liked by 18.86%.
- Columbia and Puma followed closely, with 18.09% and 17.31% of young adults indicating a preference for these brands, with Converse also matching Puma’s popularity at 17.31%.
- Champion was favored by 13.95% of respondents, while Hanes had a following of 12.66%.
- ASICS and Timberland received approval of 11.63% and 11.11% respectively.
- Lululemon attracted 9.82% of respondents, with L.L. Bean slightly behind at 9.56%.
- Danskin, Dickies, FILA, and Oakley were liked by smaller percentages, with 8.79%, 8.01%, 7.24%, and 6.46%, respectively.
- This data highlights the strong brand loyalty for Nike and Adidas among young adults. A range of other sports and lifestyle brands also hold appeal within this demographic in the United States.
(Source: Statista)
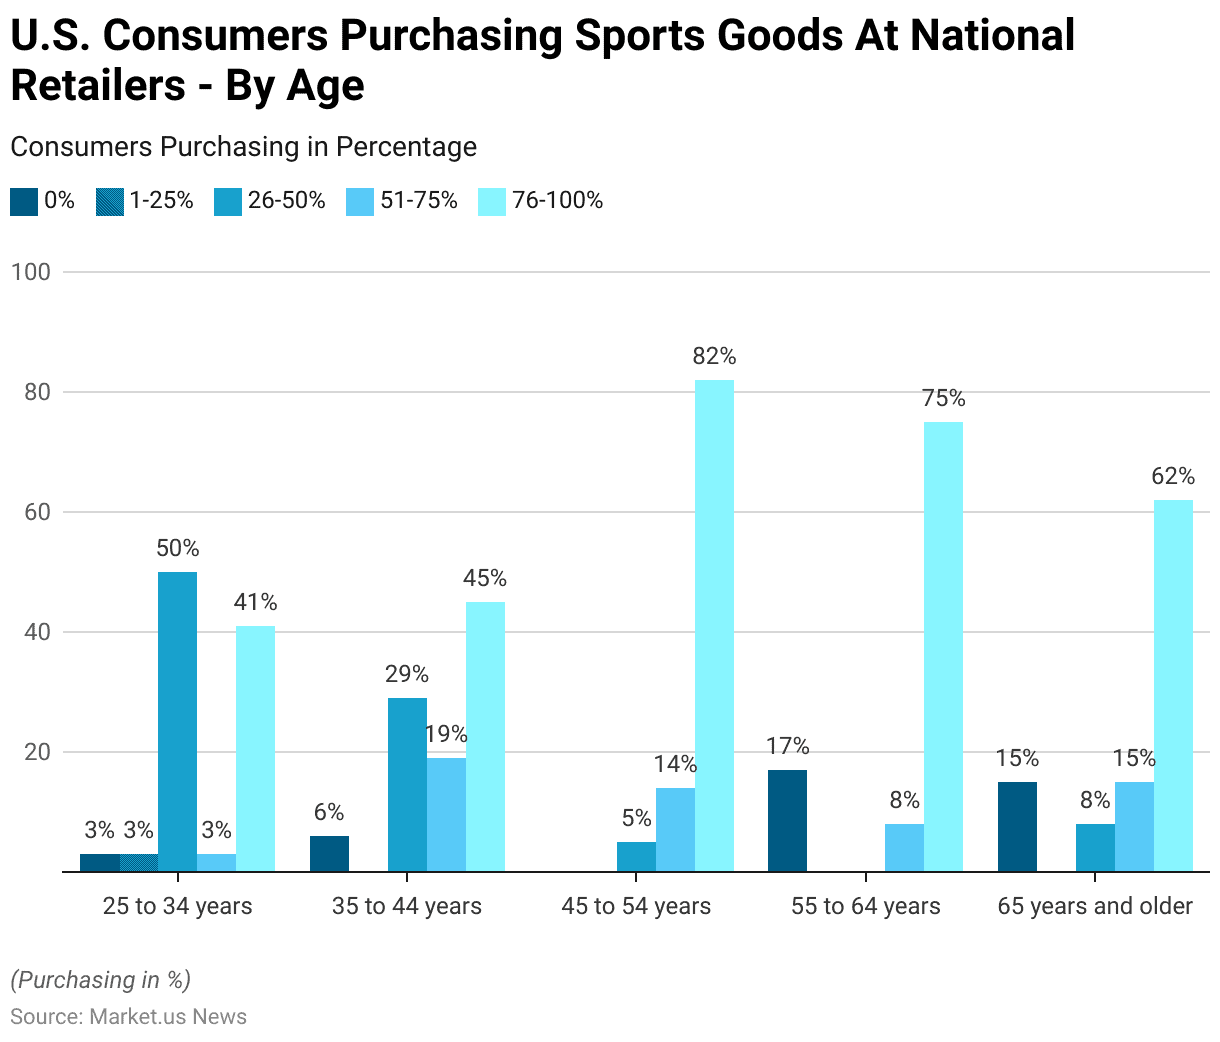
U.S. Consumers Purchasing Sports Goods at National Retailers – By Age
- In May 2017, consumer purchasing behaviors at national and regional retailers for sporting goods in the United States varied significantly across age groups.
- Among consumers aged 25 to 34, 41% reported that 76-100% of their recent sporting goods purchases were made at such retailers. While 50% made 26-50% of their purchases there. Only 3% of this age group had not made any purchases from these retailers in the past three months.
- For the 35 to 44 age group, 45% made 76-100% of their purchases at national/regional retailers, with 29% in the 26-50% range and 6% reporting no purchases at these outlets.
- In the 45 to 54 age bracket, a high 82% indicated that 76-100% of their sporting goods purchases were at national/regional retailers. While 14% made 51-75% of their purchases there, and a minimal 5% made 26-50% of their purchases at these stores.
- For consumers aged 55 to 64, 75% reported making 76-100% of their purchases at these retailers. While 8% were in the 51-75% range, and 17% did not shop at these stores in the past three months.
- Among the oldest age group, those 65 years and older, 62% indicated that 76-100% of their sporting goods purchases were made at national/regional retailers. While 15% made 51-75% of their purchases there, and 8% made 26-50% of their purchases at these stores. A notable 15% of this age group did not purchase sporting goods from national or regional retailers in the past three months.
- This data highlights a strong preference for national and regional retailers among middle-aged consumers, with older and younger adults also showing significant but varied engagement levels with these outlets.
(Source: Statista)
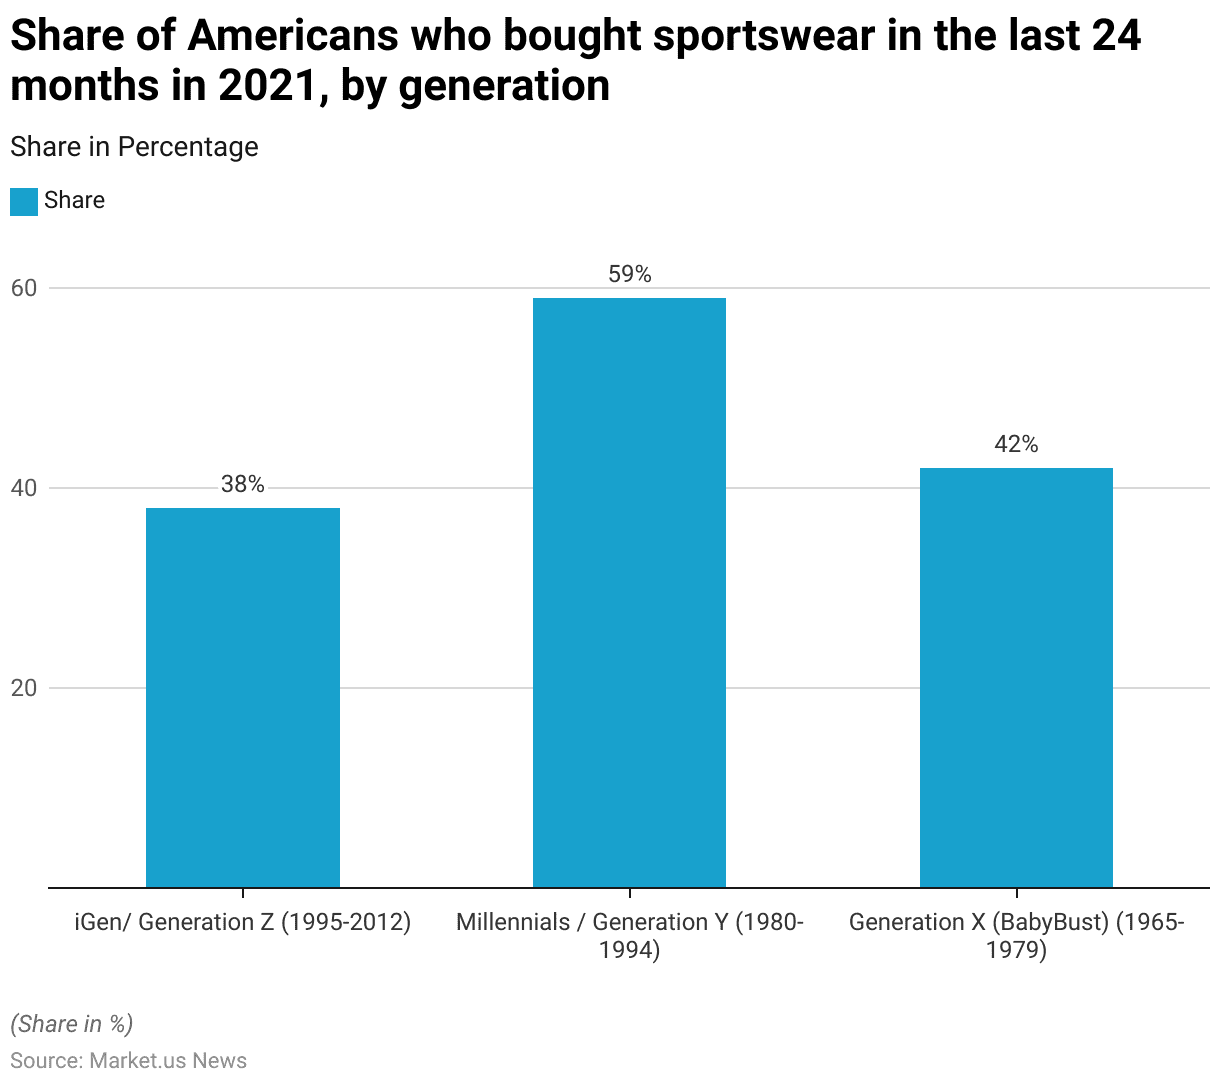
Purchase of Sportswear in the U.S. – By Generation Statistics
- In 2021, the share of Americans who reported purchasing sportswear in the previous 24 months varied across generations.
- Millennials (Generation Y), born between 1980 and 1994, had the highest engagement, with 59% indicating they had bought sportswear during this period.
- Generation X (Baby Bust), covers individuals born from 1965 to 1979. Showed a 42% purchase rate in the same timeframe.
- In comparison, iGen, or Generation Z, was born between 1995 and 2012. It had a slightly lower participation rate, with 38% of respondents purchasing sportswear in the last two years.
- This data highlights a strong inclination towards sportswear purchases among Millennials, with notable but lesser engagement among Generation X and iGen/Generation Z.
(Source: Statista)
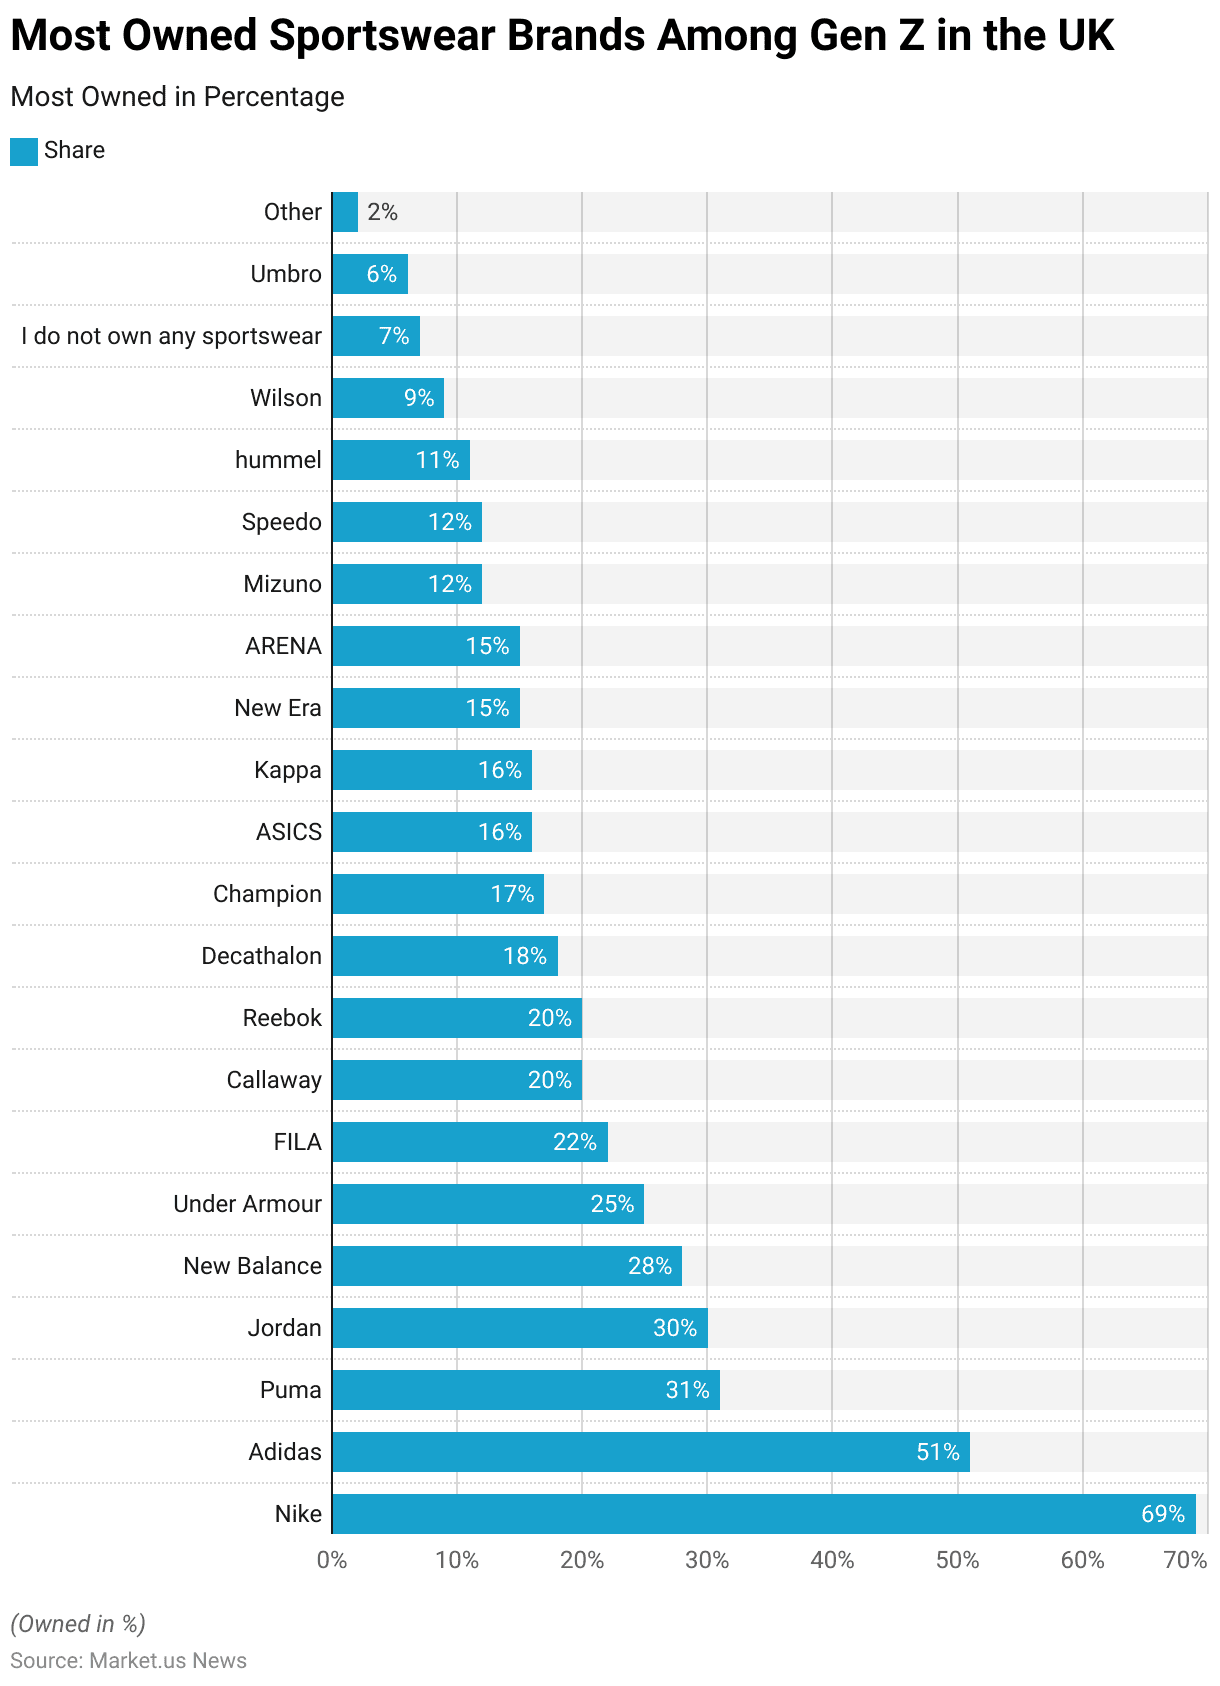
Most Owned Sportswear Brands Among Gen Z in the UK Statistics
- In 2024, Nike emerged as the most popular sportswear brand among Generation Z in the United Kingdom, with 69% of respondents indicating they owned Nike products.
- Adidas followed as the second-most owned brand at 51%, with Puma (31%) and Jordan (30%) also showing strong ownership rates.
- New Balance was owned by 28% of respondents. While Under Armour had a 25% ownership rate among this demographic.
- Other notable brands included FILA, owned by 22% of Generation Z respondents, and both Callaway and Reebok, each at 20%.
- Decathlon was owned by 18%, followed by Champion at 17%, and ASICS and Kappa, both at 16%.
- New Era and ARENA each had a 15% ownership rate. While Mizuno and Speedo were owned by 12% of respondents. Hummel was slightly less popular, with 11% ownership, and Wilson products were owned by 9% of respondents.
- A small portion of Generation Z indicated they did not own any sportswear (7%). While Umbro had a 6% ownership rate, other brands collectively accounted for 2%.
- This data underscores Nike’s dominance in the sportswear market among Generation Z in the UK, with Adidas also holding a significant share. Followed by a mix of well-known global and special sports brands.
(Source: Statista)
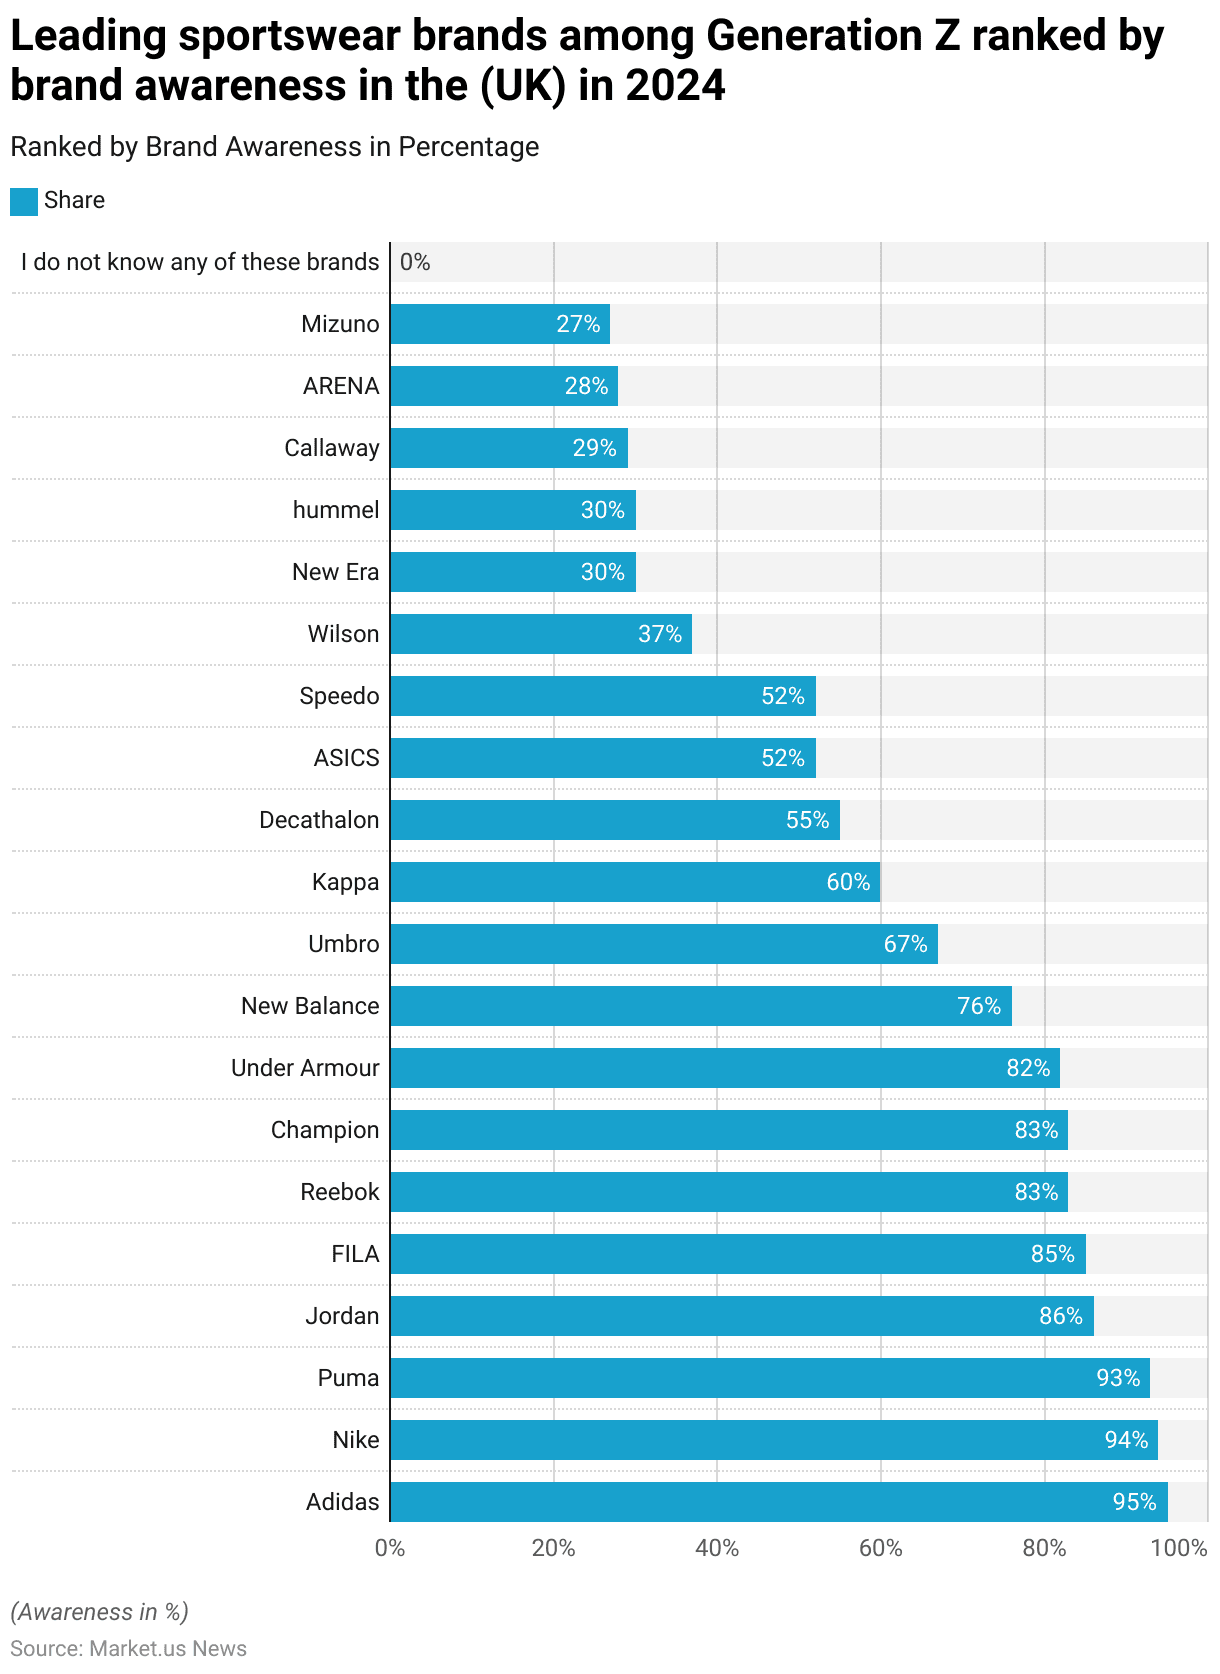
Most Well-known Sportswear Brands Among Gen Z in the UK Statistics
- In 2024, brand awareness among Generation Z in the United Kingdom revealed Adidas as the most recognized sportswear brand, known to 95% of respondents.
- Nike followed closely with a 94% awareness rate. While Puma was known by 93% of Generation Z. Jordan had an 86% awareness, and FILA was familiar to 85% of respondents.
- Reebok and Champion each held an 83% awareness rate, and Under Armour was known by 82%.
- New Balance was recognized by 76% of Generation Z respondents, followed by Umbro with 67% awareness and Kappa with 60%.
- Decathlon, ASICS, and Speedo were known by 55%, 52%, and 52% of respondents, respectively. Wilson had a lower recognition at 37%. While New Era and Hummel were each familiar to 30% of respondents.
- Callaway, ARENA, and Mizuno rounded out the list, with awareness levels of 29%, 28%, and 27%, respectively.
- Notably, all respondents were aware of at least one of these brands, as 0% indicated unfamiliarity with all brands listed.
- This data highlights Adidas and Nike’s dominant brand recognition among Generation Z in the UK, with other global and specialized sportswear brands also achieving substantial awareness within this demographic.
(Source: Statista)
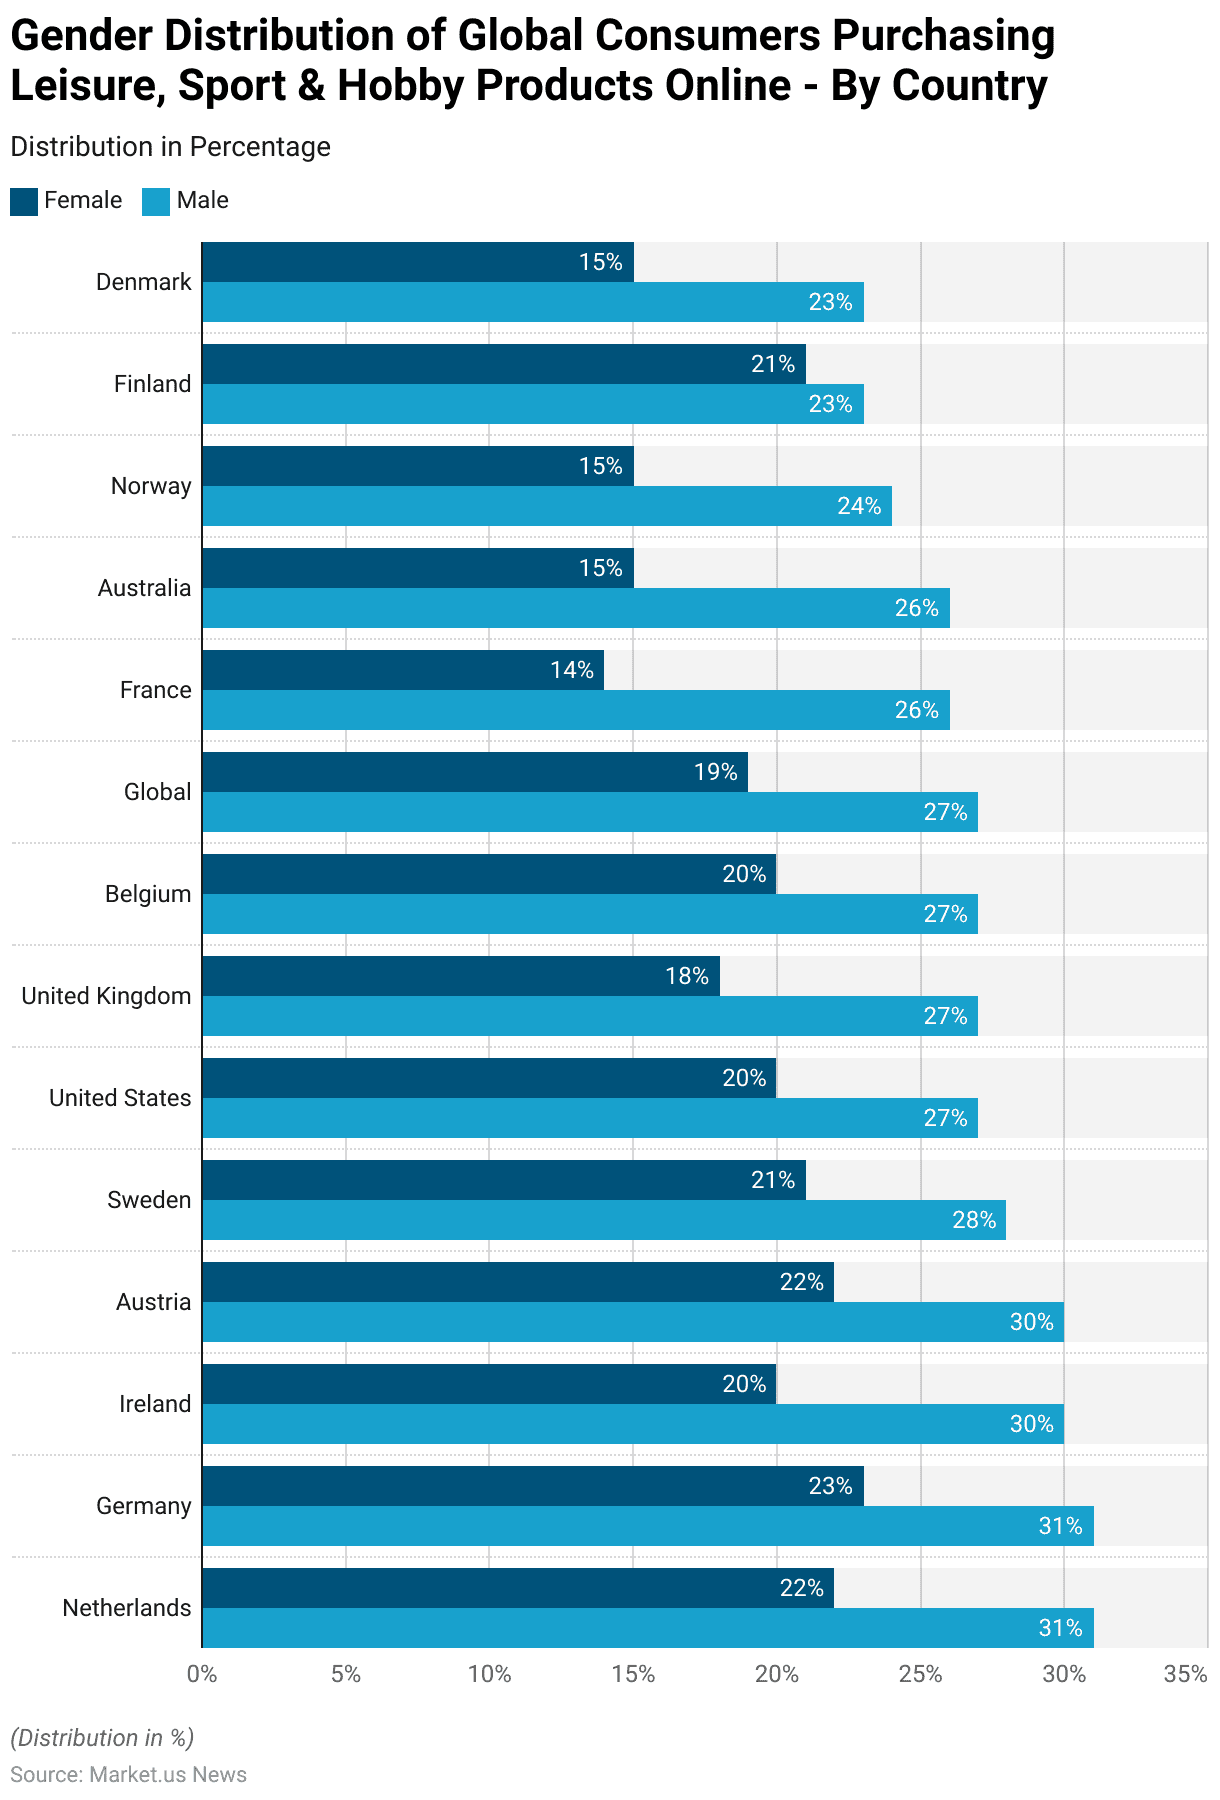
Gender Distribution of Global Consumers Purchasing Leisure, Sport & Hobby Products Online – By Country
- In the third quarter of 2022, the gender distribution of consumers purchasing leisure, sport, and hobby products online revealed variations across different countries.
- In the Netherlands and Germany, a higher share of males (31%) than females (22% and 23%, respectively) made online purchases in this category.
- Similarly, in Ireland and Austria, 30% of male consumers bought these products online compared to 20% of females in Ireland and 22% in Austria.
- In Sweden, 28% of males and 21% of females shopped for these products online.
- In the United States, 27% of males and 20% of females were engaged in online purchases in this category, similar to the United Kingdom and Belgium, where 27% of males and 18-20% of females made such purchases.
- Globally, the data showed that 27% of males and 19% of females bought leisure, sports, and hobby products online during this period.
- France, Australia, and Norway had lower percentages, with 26% of males and 14-15% of females purchasing online.
- Finland and Denmark showed more balanced engagement, with 23% of males and 21% of females in Finland and 23% of males and 15% of females in Denmark making online purchases.
- This data indicates that globally and in many countries. Male consumers were more likely to purchase leisure, sport, and hobby products online compared to female consumers during this period.
(Source: Statista)
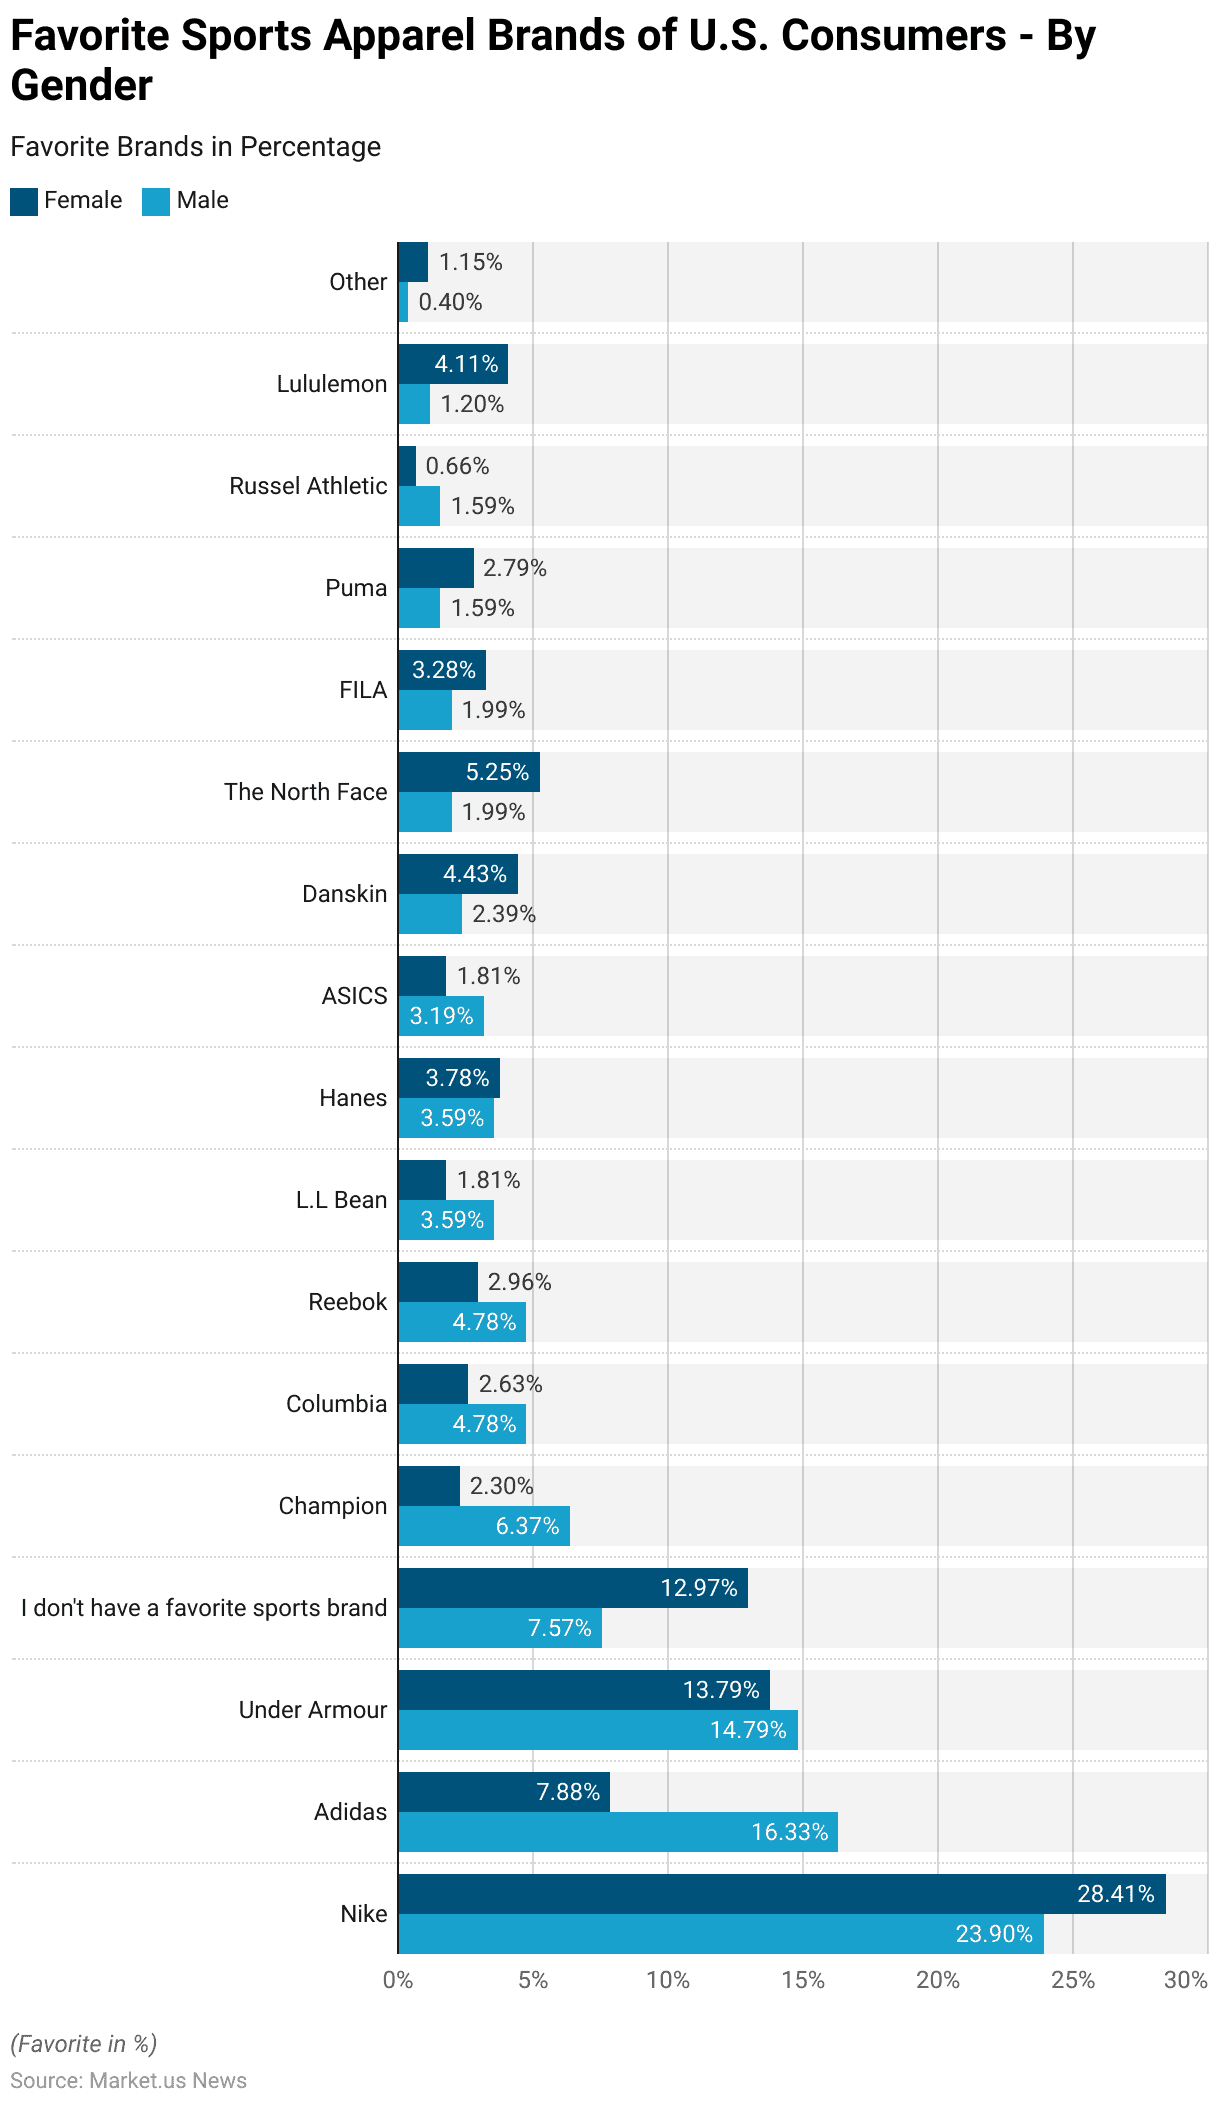
Favorite Sports Apparel Brands of U.S. Consumers – By Gender
- In 2018, the favorite sports apparel brands among U.S. consumers showed notable differences by gender.
- Nike was the most popular brand, favored by 28.41% of female respondents and 23.90% of male respondents.
- Adidas was preferred more by men, with 16.33% indicating it as their favorite compared to 7.88% of women. Under Armour was similarly popular among both genders, with 13.79% of women and 14.79% of men expressing a preference for the brand.
- Interestingly, 12.97% of women and 7.57% of men reported not having a favorite sports brand. Champion, on the other hand, had a higher preference among men (6.37%) compared to women (2.30%).
- Columbia and Reebok each attracted 4.78% of male respondents. While female preference was slightly lower at 2.63% and 2.96%, respectively.
More Insights
- L.L. Bean and Hanes were slightly more favored by men (3.59%) than women, with Hanes having a 3.78% preference among women and L.L.
- Bean at 1.81%. ASICS, with a 3.19% male preference, was more popular among men than the 1.81% female preference. Danskin was notably more popular among women (4.43%) than men (2.39%), while
- The North Face attracted 5.25% of women and only 1.99% of men. FILA and Puma also had higher popularity among women (3.28% and 2.79%) than men (1.99% and 1.59%).
- Russell Athletic and Lululemon saw limited male interest, with 1.59% and 1.20%, respectively. Compared to 0.66% and 4.11% among female respondents.
- A small percentage of both genders preferred other brands, with 1.15% of women and 0.40% of men choosing brands outside of the main list. This data reflects a gendered preference for sports apparel brands, with Nike leading overall and distinct secondary preferences between men and women.
(Source: Statista)
Sportswear Price Statistics
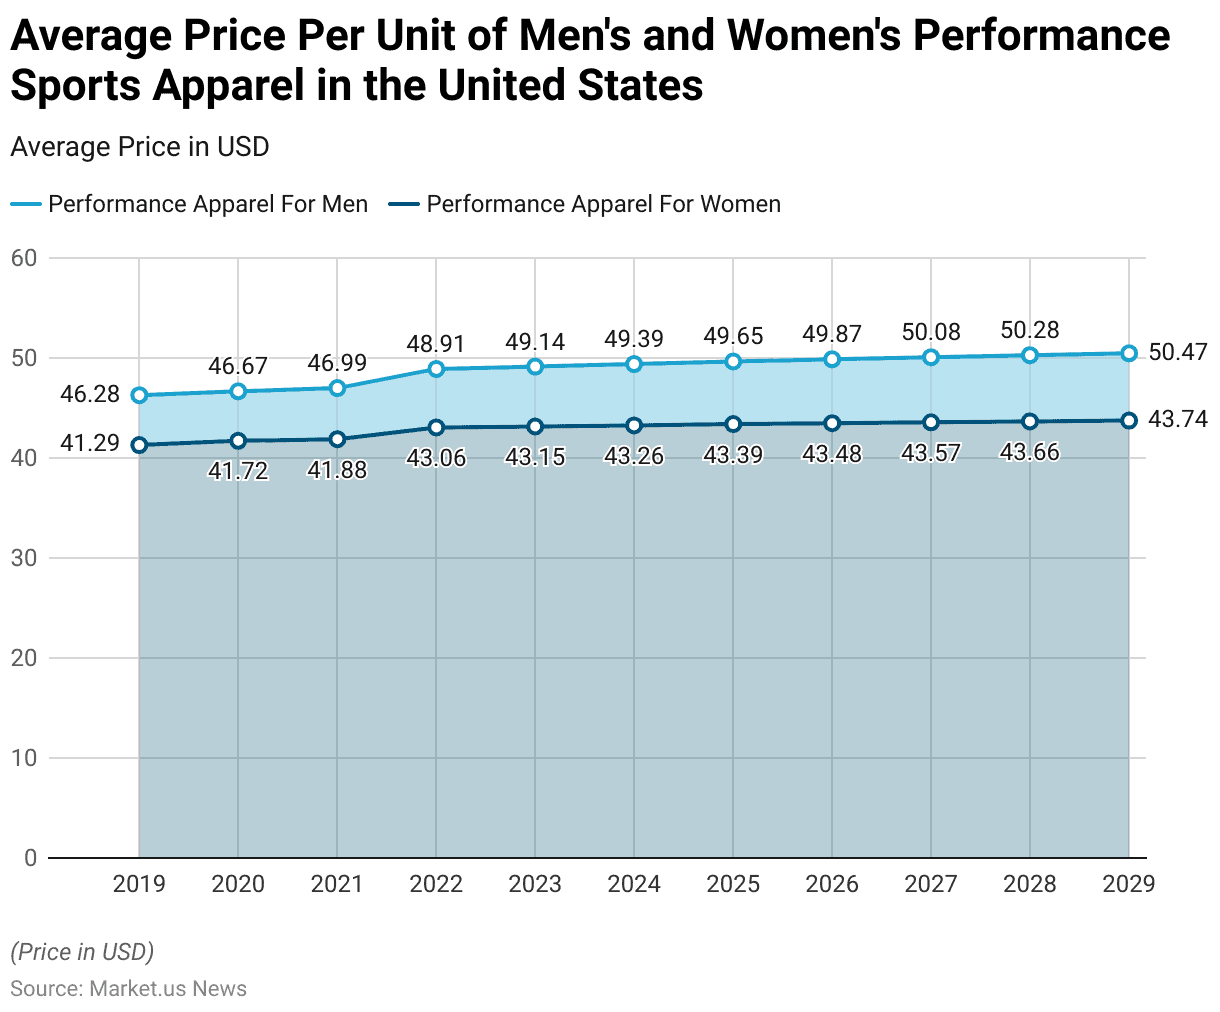
Average Price Per Unit of Men’s and Women’s Performance Sports Apparel in the United States
- From 2019 to 2029, the average price per unit for men’s and women’s performance sports apparel in the United States is projected to increase gradually.
- In 2019, the average price for men’s performance apparel stood at USD 46.28, while for women, it was USD 41.29.
- The prices saw slight annual increases, with men’s performance apparel rising to USD 46.67 in 2020 and USD 46.99 in 2021. While women’s apparel increased to USD 41.72 and USD 41.88 in the same years.
- In 2022, the average price for men’s performance apparel jumped to USD 48.91 and continued to climb to USD 49.14 in 2023. Women’s apparel followed a similar trend, reaching USD 43.06 in 2022 and USD 43.15 in 2023.
- This upward movement is expected to continue, with men’s performance apparel projected to reach USD 49.39 in 2024 and USD 49.87 by 2026. While women’s apparel is anticipated to rise to USD 43.26 in 2024 and USD 43.48 in 2026.
- By the end of the forecast period, in 2029, the average price for men’s performance apparel is expected to reach USD 50.47. While women’s performance apparel is projected to rise to USD 43.74.
- This steady increase reflects growing demand and possibly increased value perception in the performance sportswear segment in the United States.
(Source: Statista)
Brand vs Price Awareness for Sportswear in Germany Statistics
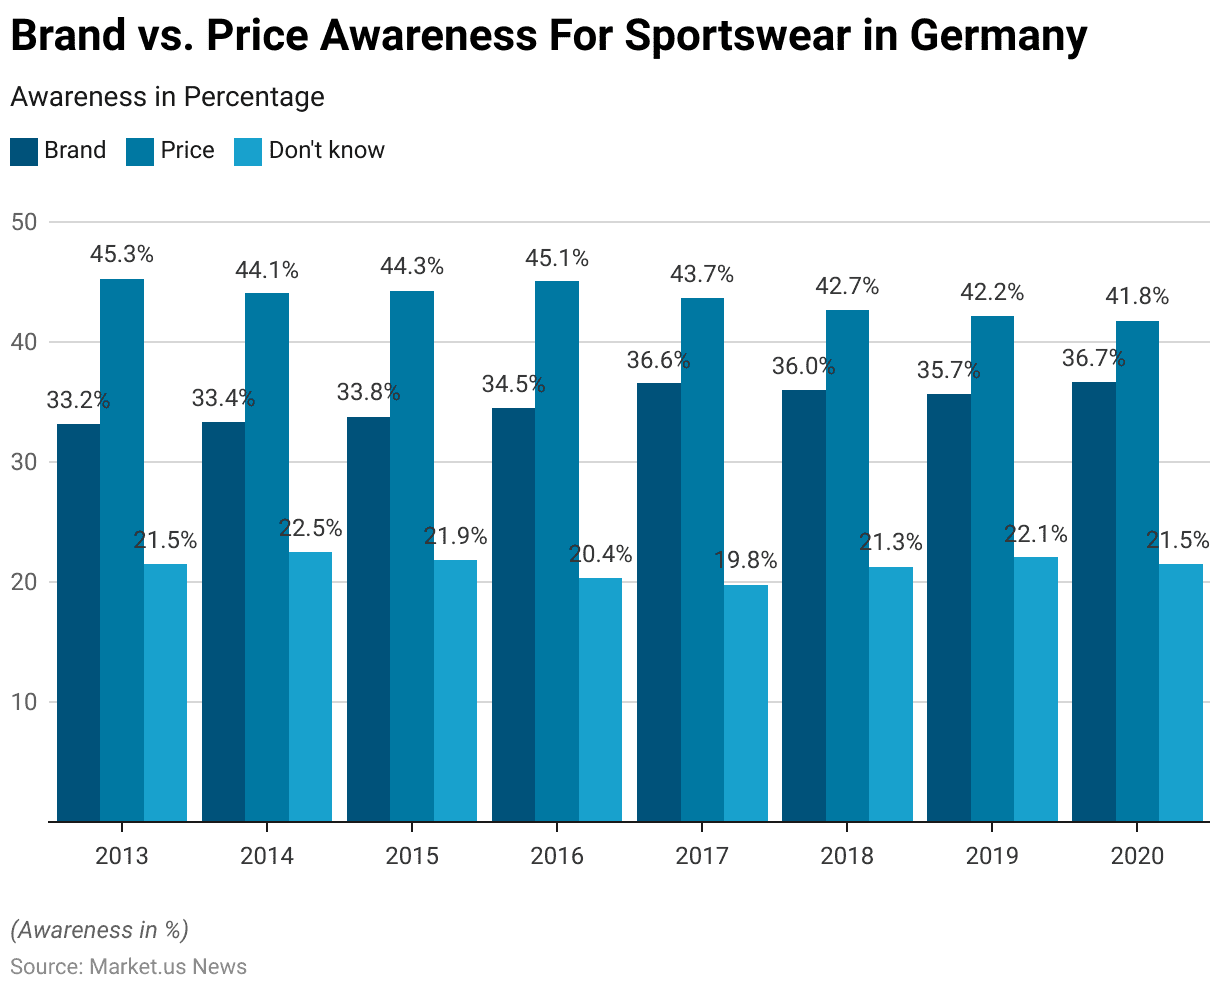
- Between 2013 and 2020, a survey in Germany explored the importance of brand versus price in consumers’ decision-making when purchasing sportswear. Throughout this period, price consistently emerged as a more critical factor than brand. Although both factors demonstrated slight fluctuations in their levels of importance.
- In 2013, 45.3% of respondents prioritized price over brand, with 33.2% considering brand as the more important factor, while 21.5% were undecided.
- Over the years, the emphasis on price gradually decreased. Dropping from 45.3% in 2013 to 41.8% in 2020.
- Conversely, the importance of the brand increased steadily, from 33.2% in 2013 to a peak of 36.7% in 2020.
- Notably, 2017 saw a significant jump in brand preference, with 36.6% of respondents prioritizing it, while price importance declined to 43.7%.
- The percentage of respondents who were undecided fluctuated slightly but remained around 20-22% throughout the survey period.
- By 2020, the gap between price and brand preference had narrowed, with 41.8% of respondents favoring price and 36.7% prioritizing brand.
- This trend suggests a growing brand consciousness among German sportswear consumers, although price remained the leading factor overall.
(Source: Statista)
Sportswear Spending Trends Statistics
Average Amount Spent on Sports Products Worldwide – By Region
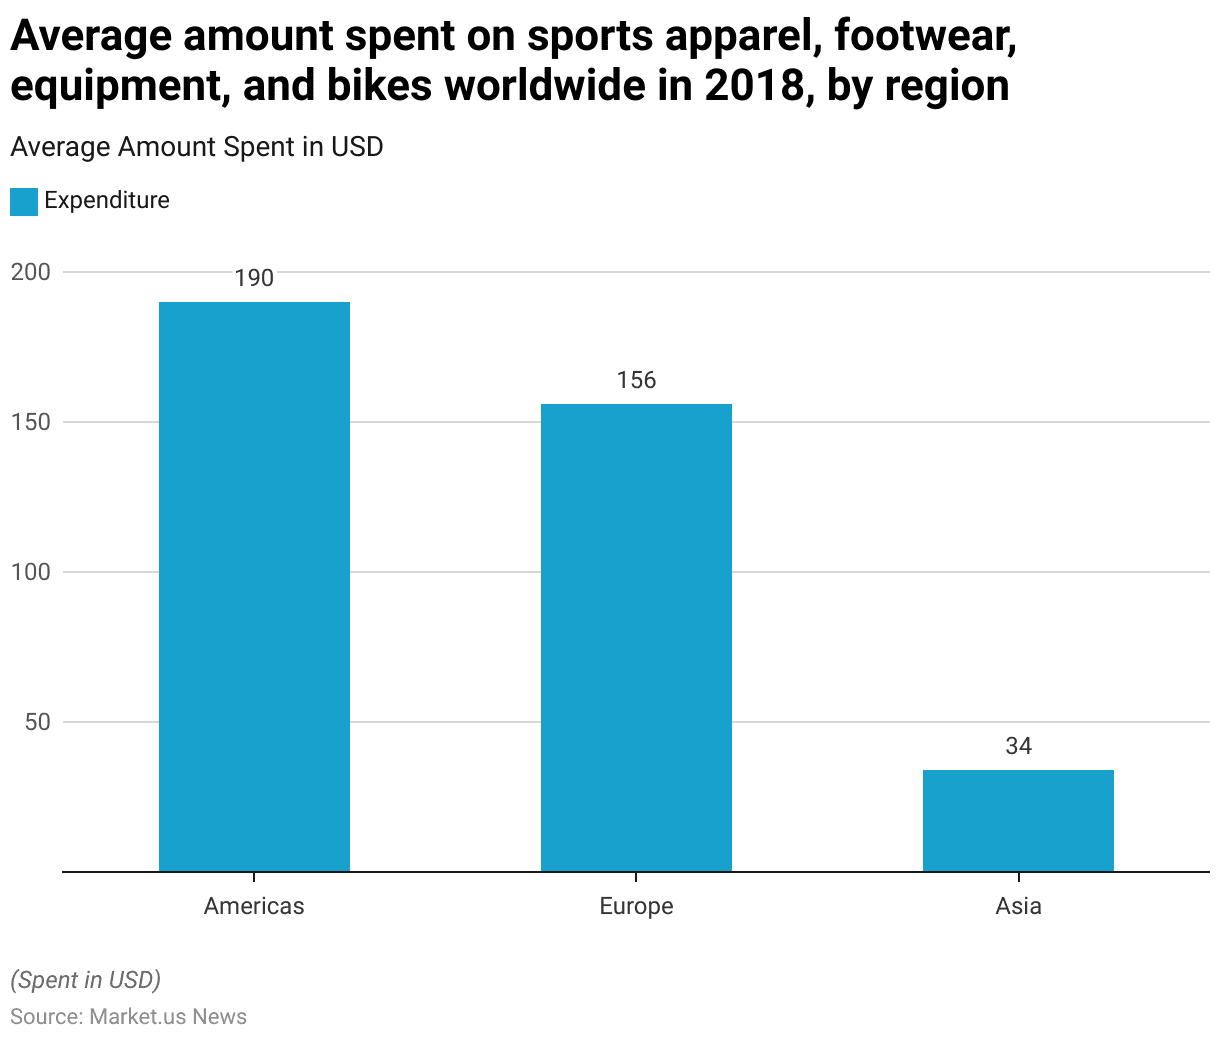
- In 2018, the average expenditure on sports apparel, footwear, equipment, and bikes varied significantly across regions worldwide.
- Consumers in the Americas led with the highest average spending, amounting to USD 190 per person.
- Europe followed with an average expenditure of USD 156.
- In contrast, Asia reported considerably lower average spending on these categories, at only USD 34.
- This data reflects regional differences in consumer investment in sports-related products, with the Americas and Europe showing much higher engagement compared to Asia.
(Source: Statista)
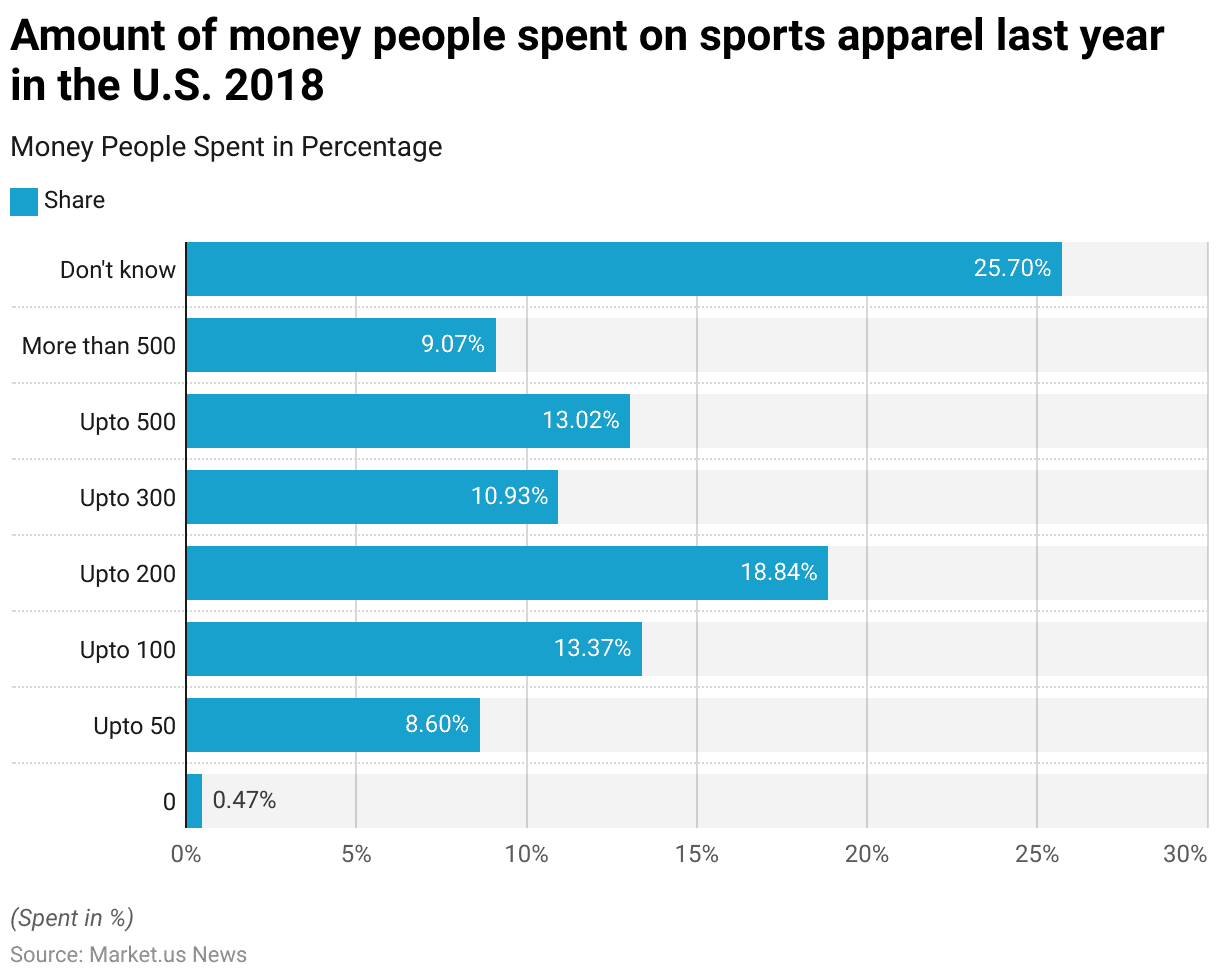
Average Spending on Sports Apparel in the U.S.
- In 2018, a survey in the United States revealed diverse spending patterns on sports apparel among consumers.
- A small portion, 0.47%, reported spending nothing on sports apparel over the past year. While 8.6% spent up to USD 50.
- The share of respondents increased with higher spending brackets, with 13.37% spending up to USD 100 and 18.84% spending up to USD 200. Which was the most popular spending range.
- Approximately 10.93% of respondents reported spending up to USD 300, while 13.02% spent up to USD 500 on sports apparel.
- A further 9.07% of participants indicated that they spent more than USD 500.
- Notably, 25.7% of respondents were unsure about their spending. Indicating that a significant portion of consumers lacked a clear estimate of their sports apparel expenditures for the year.
- This data illustrates varying levels of investment in sports apparel, with most respondents spending below USD 300 and a considerable number uncertain about their spending.
(Source: Statista)
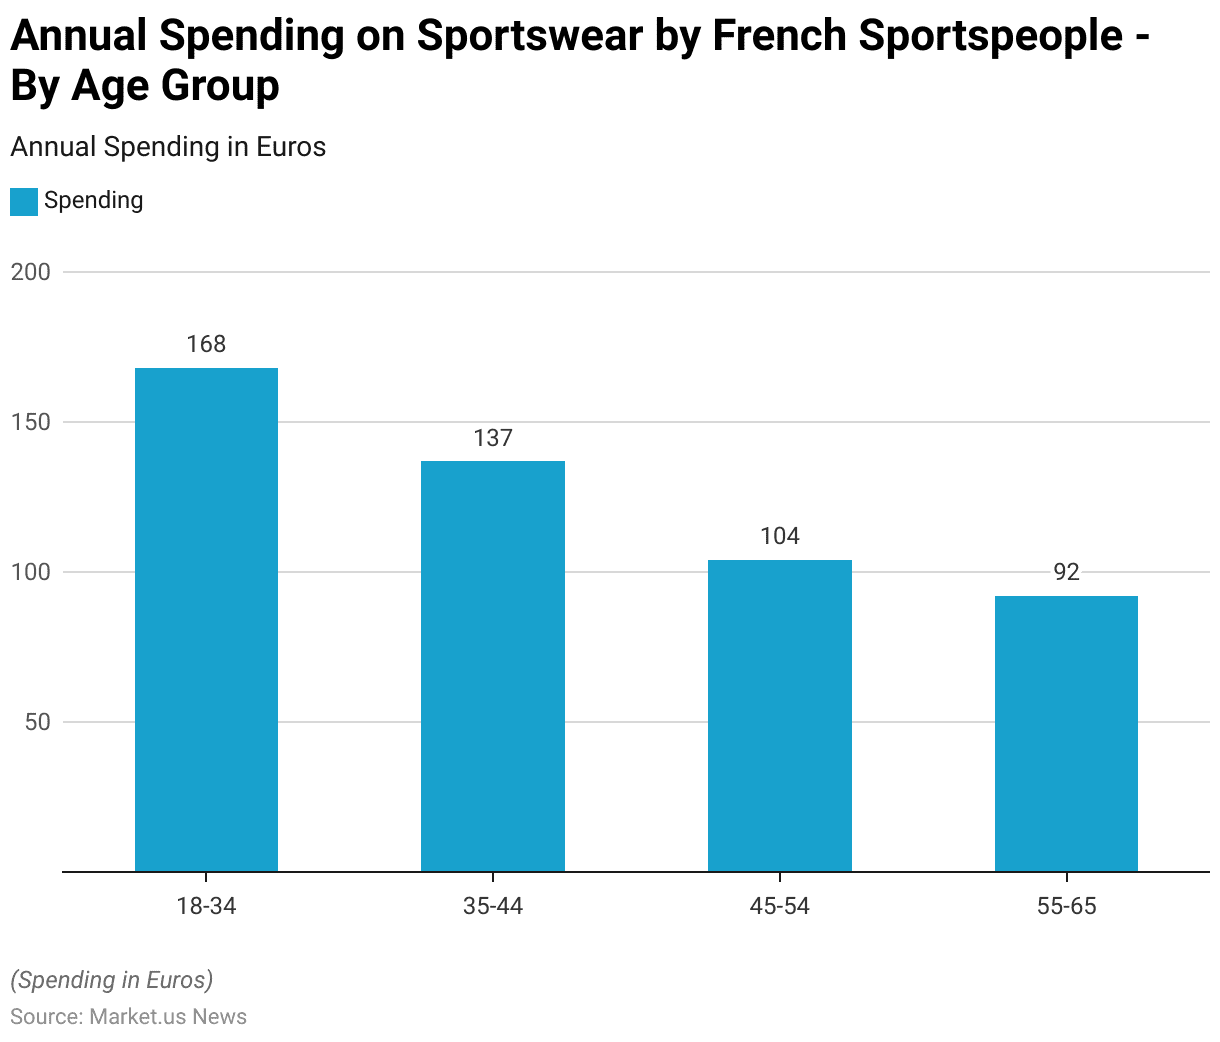
Annual Spending on Sportswear by French Sportspeople – By Age Group Statistics
- In 2019, the annual expenditure on sports apparel among people who regularly practiced sports in France varied across age groups.
- Individuals aged 18-34 spent the most on sports apparel, with an average annual expenditure of EUR 168.
- This amount decreased with age, as those in the 35-44 age group spent EUR 137 annually on average.
- The 45-54 age group reported an average expenditure of EUR 104, while individuals aged 55-65 spent the least, with an average annual expenditure of EUR 92.
- This trend suggests that younger sports enthusiasts in France invested more in sports apparel compared to older age groups.
(Source: Statista)
Sportswear Brand Trends Statistics
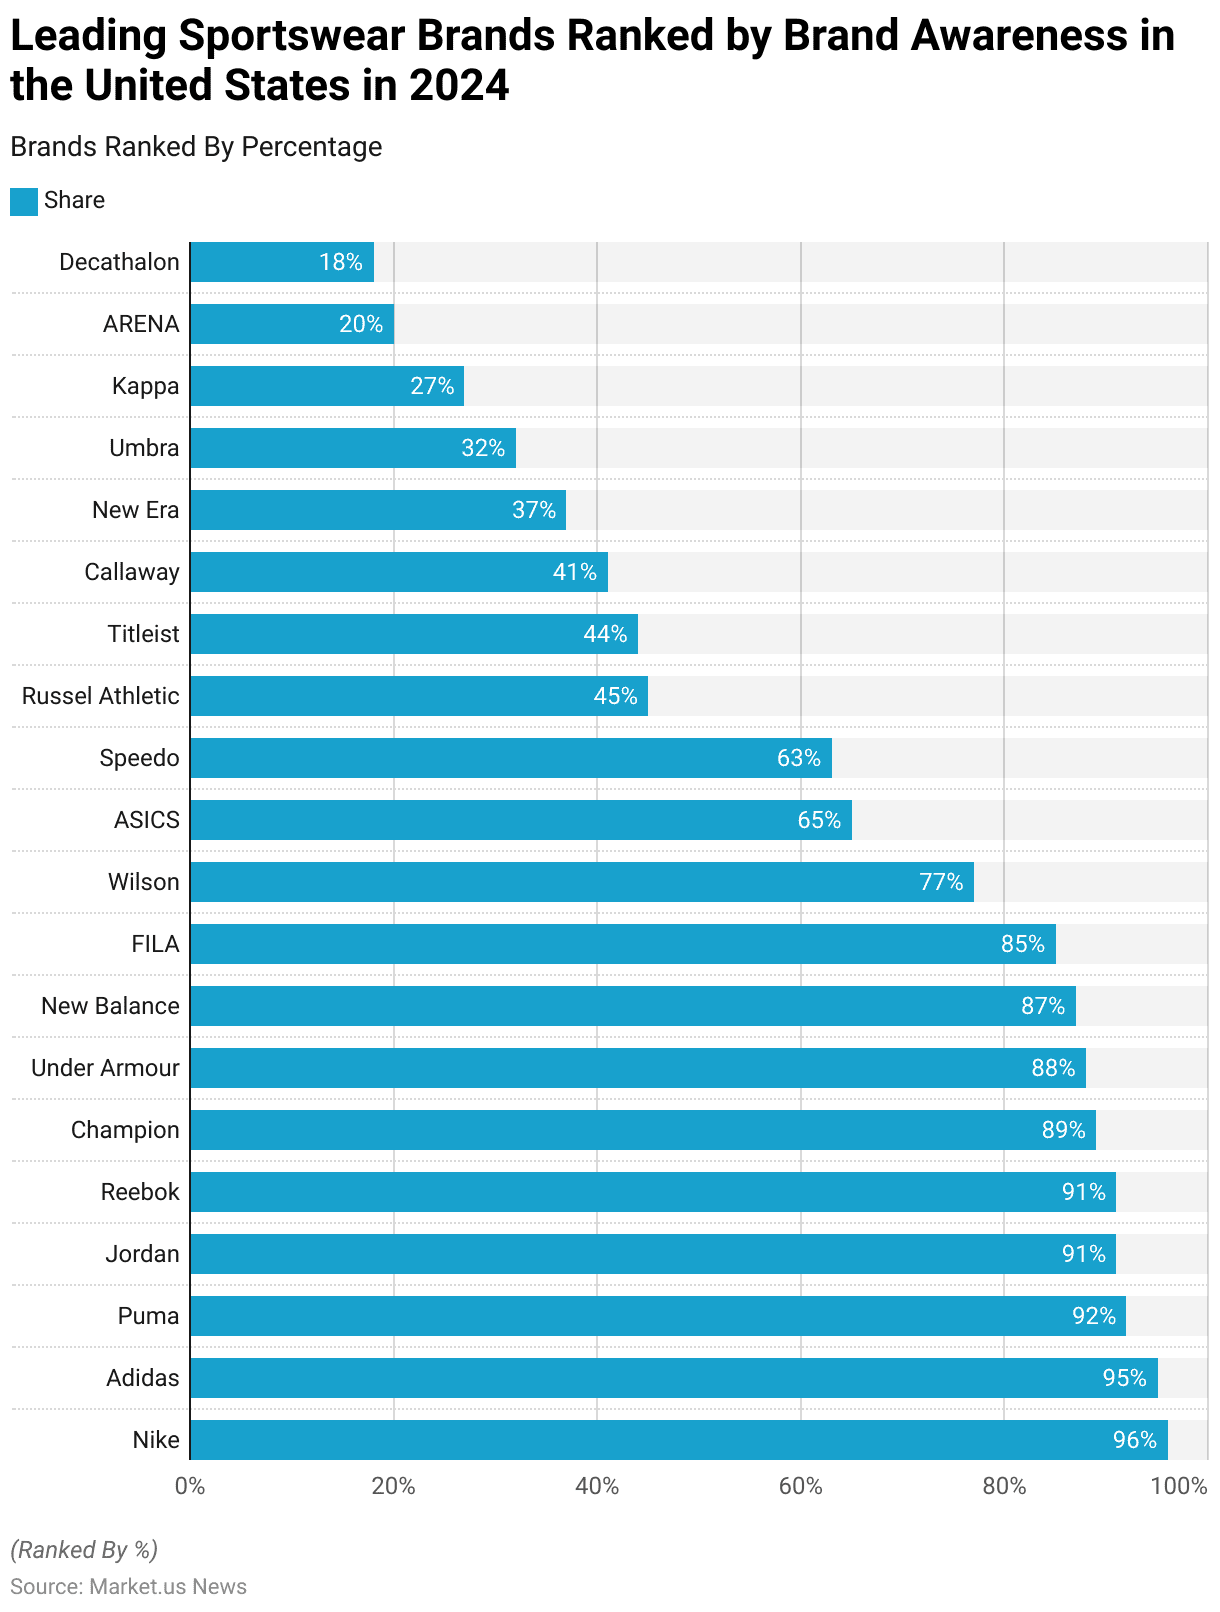
Leading Sportswear Brands Ranked by Brand Awareness in the United States Statistics
- In 2024, brand awareness for leading sportswear brands in the United States was dominated by Nike. Which was recognized by 96% of respondents, closely followed by Adidas at 95%.
- Puma held a strong position with 92% awareness. While Jordan and Reebok were each recognized by 91% of respondents.
- Champion and Under Armour also showed high levels of awareness, at 89% and 88%, respectively.
- New Balance was known to 87% of respondents, and FILA had an awareness rate of 85%.
- Wilson achieved a notable 77% recognition, while ASICS and Speedo were known to 65% and 63% of respondents, respectively.
- Lower levels of awareness were reported for Russell Athletic (45%) and Titleist (44%). Followed by Callaway with 41% awareness.
- New Era was familiar to 37% of respondents, and Umbra to 32%.
- Kappa, ARENA, and Decathlon had the lowest awareness levels among the top brands, with 27%, 20%, and 18% recognition, respectively.
- This data highlights the strong brand presence of Nike and Adidas in the U.S. market. With high levels of awareness for other prominent sportswear brands as well.
(Source: Statista)
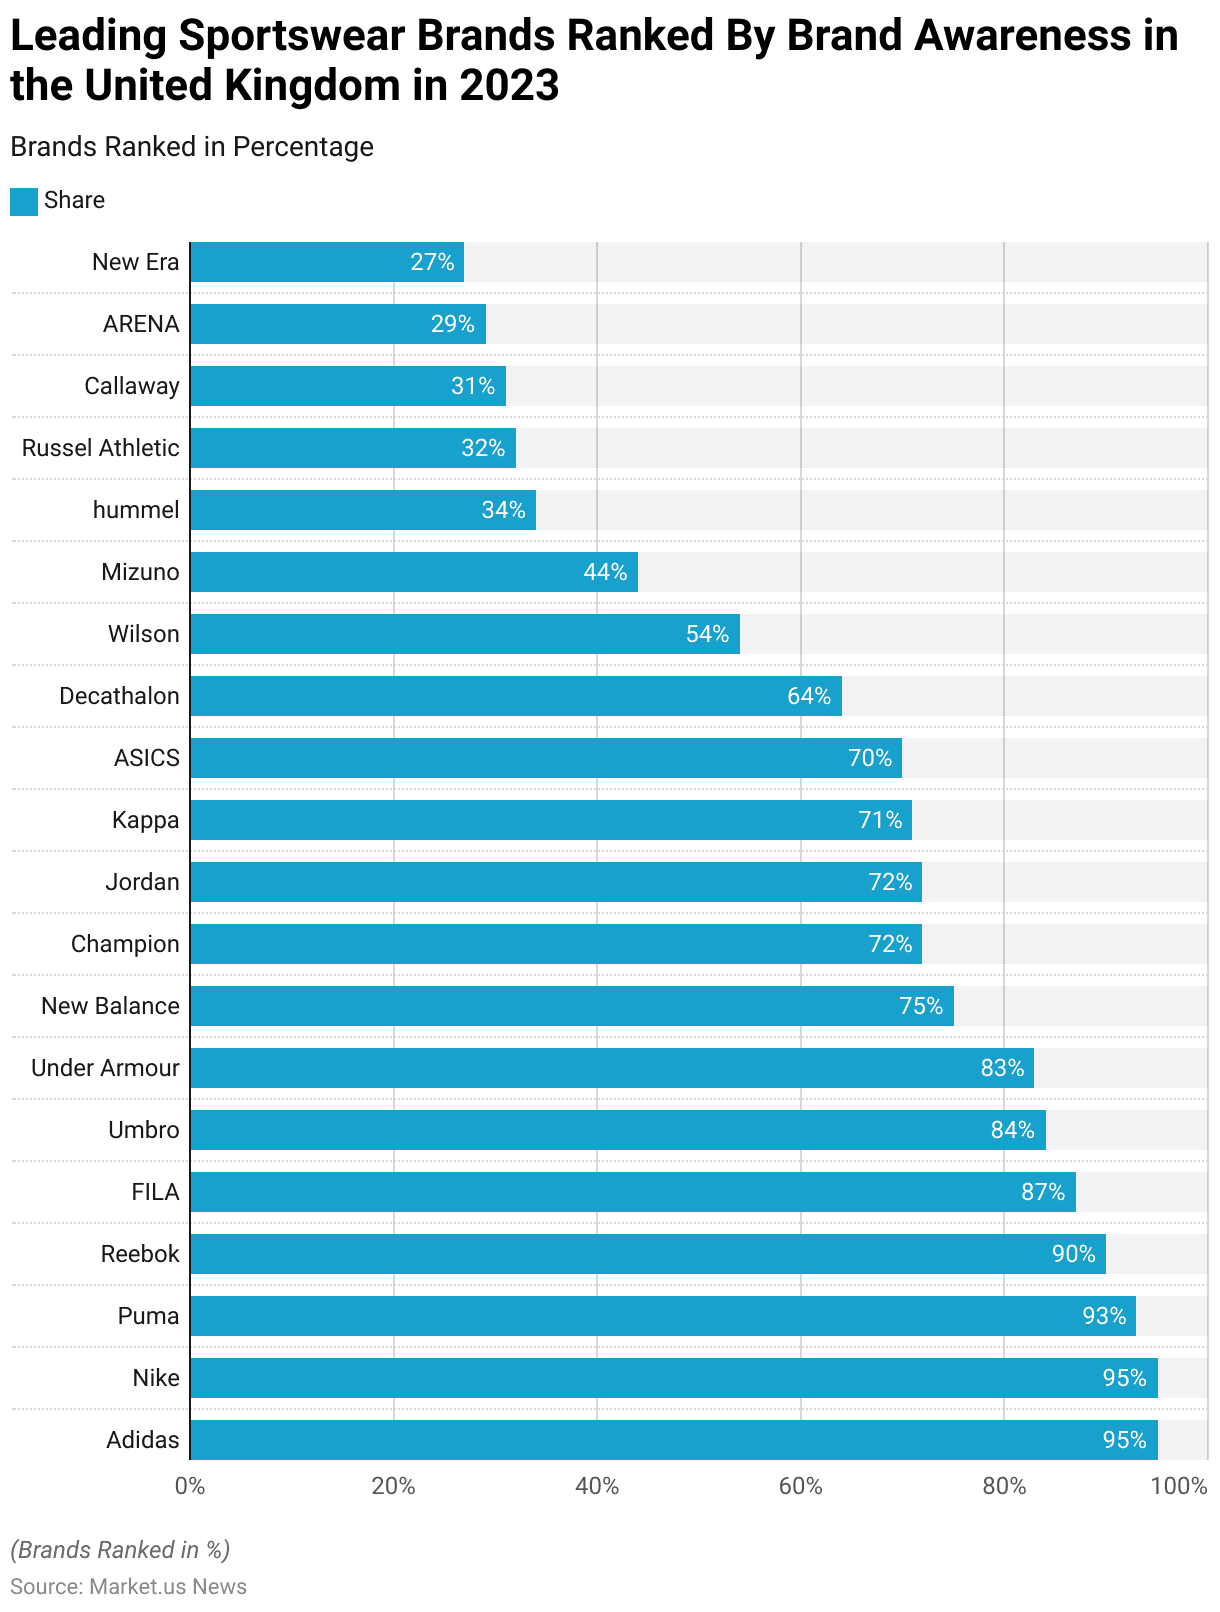
Leading Sportswear Brands Ranked by Brand Awareness in the United Kingdom Statistics
- In 2023, brand awareness for leading sportswear brands among consumers in the United Kingdom was led by Adidas and Nike, each recognized by 95% of respondents.
- Puma followed closely with a 93% awareness rate, and Reebok was familiar to 90% of the surveyed population.
- FILA also demonstrated strong brand recognition at 87%. While Umbro and Under Armour were recognized by 84% and 83% of respondents, respectively.
- New Balance had a 75% awareness rate, with Champion and Jordan each known to 72% of respondents.
- Kappa and ASICS followed with awareness rates of 71% and 70%, respectively. Decathlon was familiar to 64% of consumers, while Wilson had a 54% recognition rate.
- Lower awareness levels were noted for Mizuno (44%), hummel (34%), and Russell Athletic (32%).
- Callaway and ARENA had similar awareness levels at 31% and 29%, respectively, and New Era rounded out the list with 27% recognition.
- This data highlights the strong market presence of Adidas and Nike in the UK. With a broad spectrum of recognition for other international and regional sportswear brands.
(Source: Statista)
Key Consumer Preferences and Trends
Leading Considerations When Buying Sporting Goods
- In 2021, consumers in the United States considered several factors when purchasing sporting goods, such as sportswear, shoes, and equipment.
- Comfort emerged as the most important factor, valued by 53% of respondents. Followed closely by high quality at 51%.
- Durability and a good fit were also significant, with 43% and 40% of respondents, respectively, highlighting their importance.
- Design and low price each influenced 36% and 35% of consumers. Style alignment was also relevant for 35%.
- Special functions, such as dry-fit, breathable, and waterproof features. Were important to 27% of respondents, while 22% prioritized well-known brands.
- Sustainability and eco-friendliness, along with the use of natural materials. Were each valued by 19% of consumers.
- Fan merchandise, including sports team logos, influenced 15%, and fair treatment of workers was important to 14%.
- Vegan materials were a consideration for 11% of respondents, while 2% were unsure of their priorities, and 1% cited other factors.
- This data underscores the emphasis on comfort, quality, and durability while also reflecting emerging interests. In sustainability and ethical considerations in purchasing decisions for sporting goods.
(Source: Statista)
Sportswear Preference Among Consumers Statistics
- As of January 2024, sportswear purchases among consumers in China were primarily driven by activities such as gym workouts. With 56.18% of respondents purchasing sportswear for this purpose.
- Ball games were also a significant motivator, influencing 43.82% of consumers.
- Yoga followed, with 38.65% of respondents buying sportswear specifically for yoga practice.
- Hiking and athletics also played important roles, with 28.82% and 27.76% of respondents, respectively. Indicating these as reasons for their purchases.
- Aquatic sports motivated 23.24% of consumers to buy sportswear, while a small fraction (1.46%) cited other sports and activities.
- This data highlights the diverse range of physical activities that drive sportswear purchases in China. With gym workouts and ball games being the most popular.
(Source: Statista)
Influence of Previous Sports Brand Experience On Future Purchases
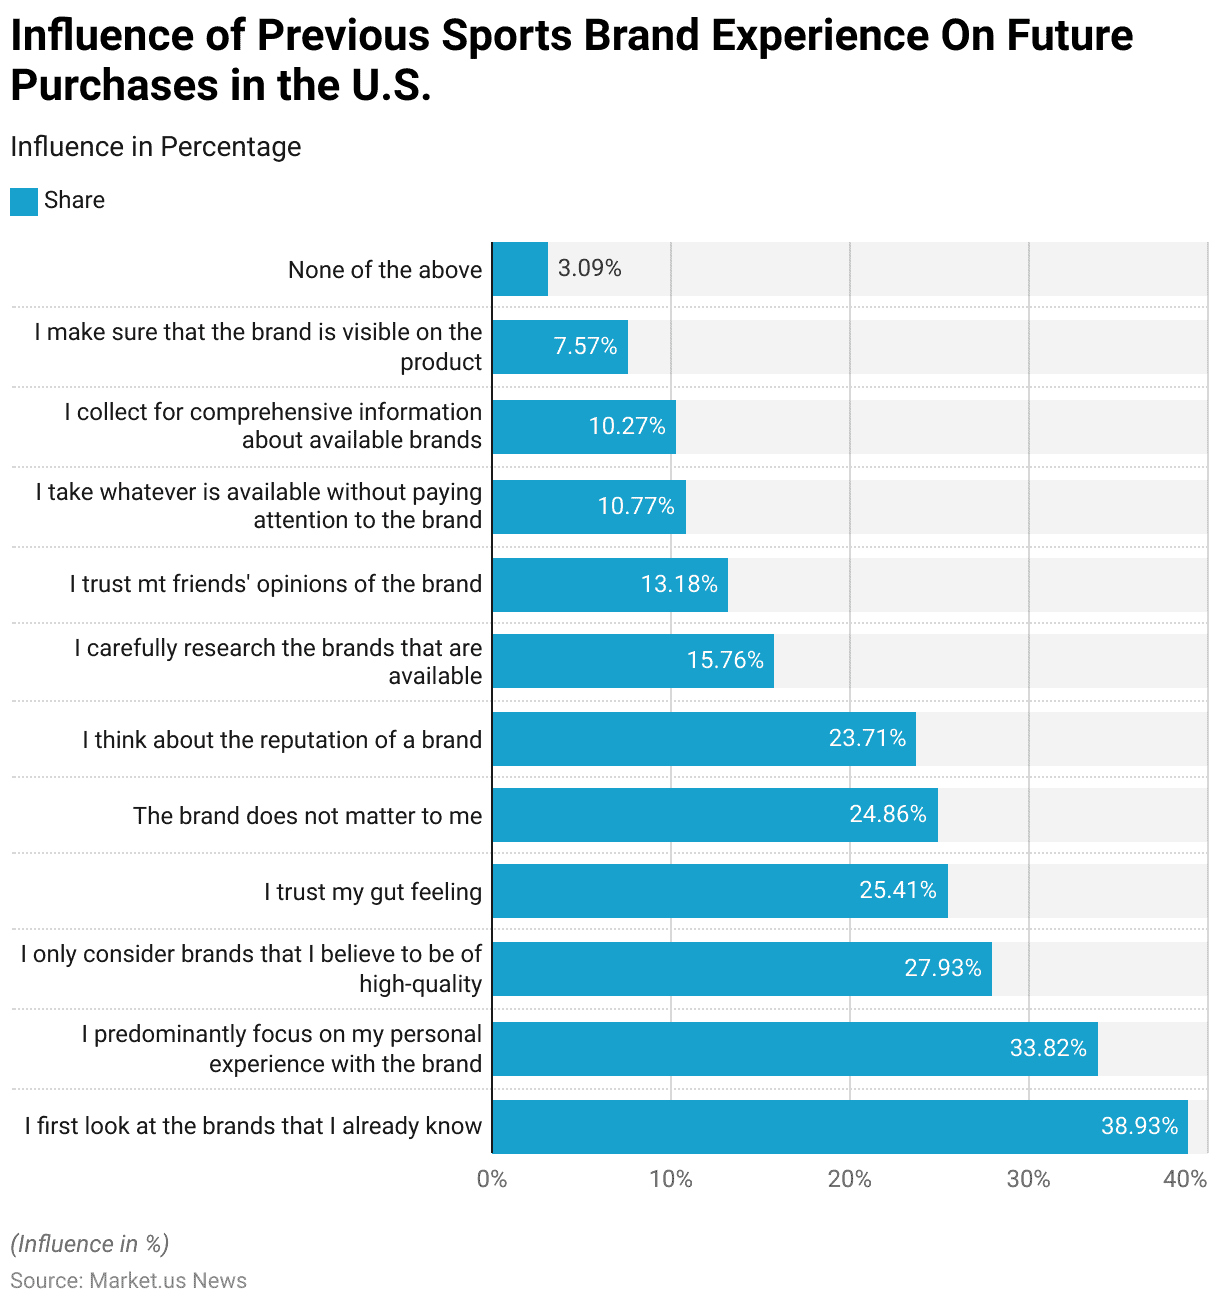
- In 2016, previous experience with a brand played a significant role in influencing future purchases of sports apparel, shoes, and equipment among U.S. consumers.
- The majority of respondents, 38.93%, reported that they first looked at brands they already knew. While 33.82% predominantly focused on their personal experience with the brand.
- Additionally, 27.93% of consumers considered only brands they believed to be of high quality, and 25.41% trusted their gut feeling when selecting a brand.
- For 24.86% of respondents, brand importance was minimal, as they indicated that the brand did not matter.
- Meanwhile, 23.71% of consumers thought about the brand’s reputation, and 15.76% carefully researched available brands before making a purchase.
- Opinions of friends influenced 13.18% of respondents, while 10.77% took whatever was available without focusing on the brand.
- Another 10.27% collected comprehensive information on brands before deciding, and 7.57% prioritized the visibility of the brand logo on the product.
- Only 3.09% indicated that none of these considerations influenced their decisions.
- This data underscores the importance of brand familiarity and personal experience in shaping consumer preferences in the sportswear market.
(Source: Statista)
Most Searched Sportswear Products Online Based On Consumer Interest Statistics
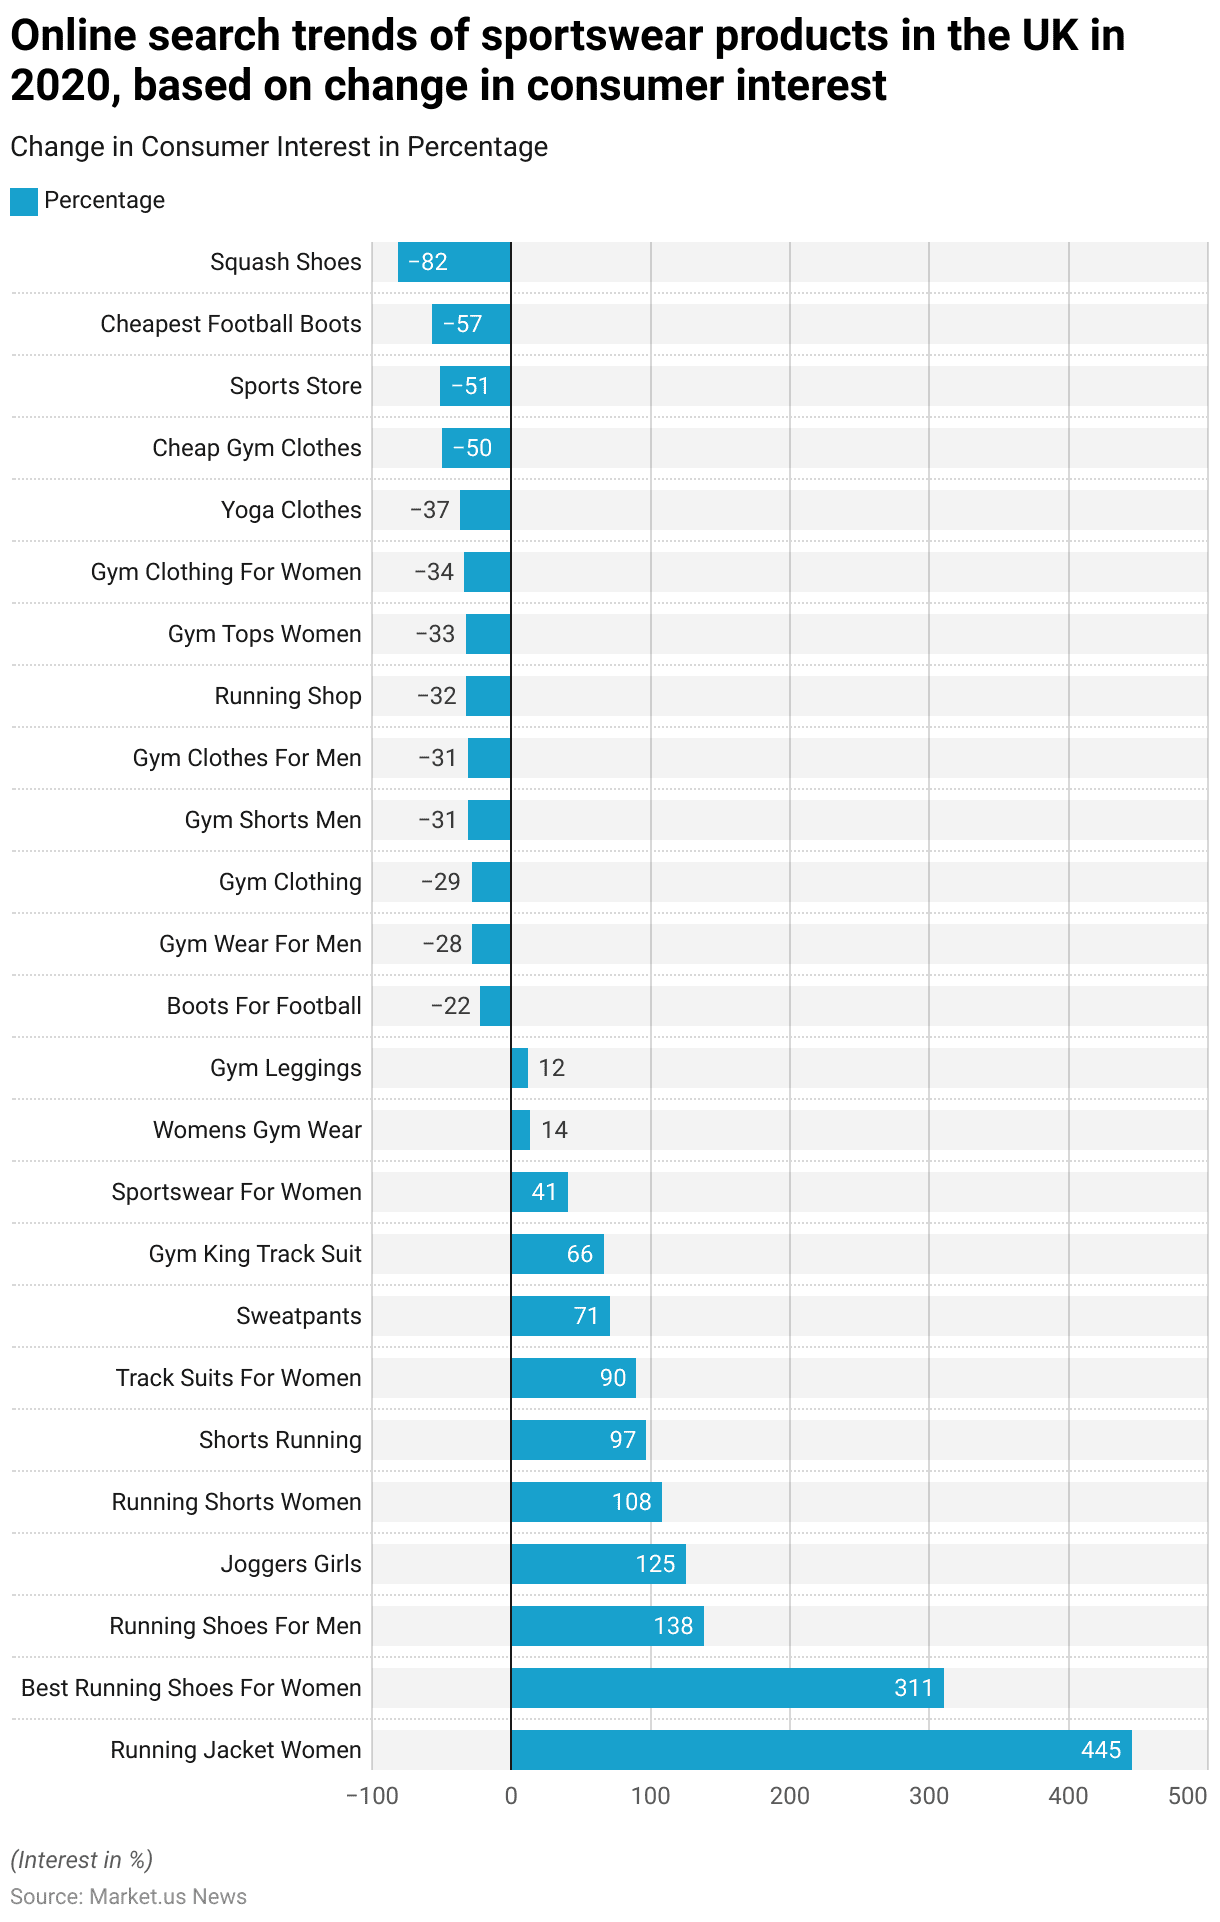
- In 2020, online search trends for sportswear products in the United Kingdom showed significant shifts in consumer interest. With notable increases and decreases across various categories.
- Interest in “running jacket women” saw the highest surge, with a 445% increase, followed by “best running shoes for women” at 311% and “running shoes for men” at 138%.
- Searches for “joggers girls” and “running shorts women” also rose sharply, with 125% and 108% increases, respectively.
- Other products experiencing increased interest included “shorts running” (97%), “tracksuits for women” (90%), “sweatpants” (71%), “gym king tracksuit” (66%), and “sportswear for women” (41%).
- Conversely, several categories saw decreased interest, including “boots for football” (-22%), “gym wear for men” (-28%), “gym clothing” (-29%), and “gym shorts for men” and “gym clothes for men” (both –31%).
- Interest in “running shop” decreased by 32%, while “gym tops women” and “gym clothing for women” fell by 33% and 34%, respectively.
- “Yoga clothes” searches dropped by 37%, “cheap gym clothes” by 50%, and “sports store” by 51%. Searches for “cheapest football boots” declined by 57%, and “squash shoes” experienced the most significant drop at 82%.
- This data highlights a shift in consumer preferences, with a growing interest in specific sportswear items, particularly for running and casual wear. In contrast, interest in certain categories like squash shoes and general gym clothing declined.
(Source: Statista)
Regulations for Sportswear Products Statistics
- In the realm of sportswear regulations, a notable shift towards environmental accountability and consumer protection can be observed globally.
- For instance, France has instituted comprehensive regulations under its Anti-waste and Circular Economy Law. Which mandates more informative labeling on sportswear products concerning recyclability, the content of recycled materials, and the presence of harmful substances.
- Similarly, in the United States, stringent restrictions are placed on the use of perfluoroalkyl and polyfluoroalkyl substances (PFAS) in apparel. Specific laws are enacted in states like Maine and California to curb environmental and health risks associated with these chemicals.
- Additionally, international sporting bodies such as World Athletics have set precise standards for athletic shoes. Including regulations on the permissible modifications and the technical specifications of footwear used in competition.
- These regulatory environments highlight a growing international consensus towards enhancing sustainability, reducing waste, and protecting consumer interests in the sportswear industry.
- This trend is complemented by trade policies and agreements that influence the sourcing and manufacturing practices of sportswear. Integrating economic considerations with environmental stewardship.
- Such regulations not only aim to mitigate the ecological impact of sportswear production but also align with broader consumer expectations and global sustainability goals.
(Source: Paris Mode Responsible, Compliance & Risks, World Athletics, Fashion Law Journal)
Recent Developments
Acquisitions and Mergers:
- Adidas and Kanye West Settlement: In late 2024, Adidas resolved its dispute with Kanye West, resulting in a €100 million boost to its operating profit. The company plans to donate an equivalent amount to charity. This settlement concludes the two-year dispute following the termination of their partnership in 2022.
- JD Sports’ Global Expansion: JD Sports has been expanding its global presence, with significant revenue contributions from North America (35%), Europe (31%), the UK (30%), and Asia Pacific (4%). The company has made major acquisitions, including Hibbett Sports, to strengthen its presence, particularly in the U.S.
New Product Launches:
- Reebok’s Nano Court Pickleball Shoe: In June 2024, Reebok introduced its first-ever pickleball shoe, the Nano Court, catering to the growing popularity of the sport.
- Adidas’ Samba and Gazelle Sneakers: Adidas experienced strong sales growth in Q3 2024, primarily driven by the popularity of its retro styles, including the Samba and Gazelle sneakers. This revival contributed to a 7.3% increase in sales and a 46% boost in operating profit.
Funding:
- Antavo’s Series C Funding: In mid-2023, Antavo, a loyalty management software provider, raised $50 million to expand its platform and improve its AI-powered loyalty solutions. This funding supports the company’s growth in the U.S. and European markets.
- Punchh’s Funding for AI-Driven Loyalty Services: In late 2023, Punchh secured $120 million in funding to expand its AI-driven loyalty offerings and enhance customer personalization for businesses.
Technological Advancements:
- AI Integration in Sportswear Statistics: Artificial Intelligence is transforming the sportswear industry by enabling better customer segmentation and personalization. By 2025, over 50% of loyalty programs are expected to use AI-driven tools to predict customer behavior and offer tailored rewards, improving customer retention and satisfaction.
- Blockchain for Loyalty Programs: Blockchain technology is being integrated into loyalty management systems to improve transparency, security, and flexibility. By 2024, approximately 25% of loyalty platforms will adopt blockchain technology, particularly for managing reward points and customer data more securely.
Conclusion
Sportswear Statistics – The sportswear industry is experiencing robust growth fueled by evolving consumer preferences, with comfort, quality, durability, and brand loyalty as primary purchase drivers.
Consumers, especially younger demographics, increasingly prioritize ethical considerations, including sustainability and fair labor practices.
Regional spending patterns reveal that consumers in the Americas and Europe invest more in sportswear than those in Asia, and younger consumers tend to spend more than older age groups.
Activities like gym workouts, ball games, and yoga are major motivators, with familiarity and trust in brands significantly influencing purchases.
As lifestyle trends shift towards health and fitness, and athleisure continues to rise, brands that align with these trends and emphasize innovation and sustainability are well-positioned to succeed in the competitive sportswear market.
FAQs
Synthetic materials like polyester and nylon are popular for sportswear due to their moisture-wicking and quick-drying properties. Cotton can be comfortable but retains moisture, making it less ideal for intense workouts. Sustainable materials like recycled polyester or organic cotton are also growing in popularity.
Sportswear is designed specifically for physical activities and performance, offering features like moisture-wicking and flexibility. Athleisure, on the other hand, combines style and functionality, allowing clothing to be worn comfortably both for exercise and as casual wear.
High-quality sportswear is made with performance materials that are durable, moisture-wicking, and designed for comfort and flexibility. Research and development, technology, and brand reputation also contribute to higher costs.
Many brands offer eco-friendly sportswear made from recycled materials, organic cotton, or sustainably sourced fabrics. Look for certifications like GOTS (Global Organic Textile Standard) or brands that emphasize ethical production practices.
Nike, Adidas, Puma, Under Armour, and Reebok are some of the most recognized global sportswear brands. Other popular brands include Lululemon, FILA, ASICS, and Champion, with new and sustainable brands also gaining traction.


