Table of Contents
- Introduction
- Editor’s Choice
- Train Market Overview
- Railway Technology Market Overview
- Countries with the Largest Railway Networks in the World
- Global Railway Passenger Traffic Statistics
- Busiest Train Stations Around the World
- Largest Railway Networks in the World
- The World’s Longest Train Journeys
- Train Ticket Price Statistics and Trends
- Demographics of Train/Railway Passengers
- Consumer Preferences & Trends
- Investments in Railway Development by Governments and Private Organizations
- Regulations for Trains/Railways Industry
Introduction
According to Train Statistics, The global train industry, pivotal in freight logistics and passenger transport, exhibits diverse technological advancements and market dynamics.
Freight trains dominate long-distance cargo transport, influenced by economic activities and trade volumes.
Passenger trains, catering to urban rail transit and long-haul journeys. Benefit from increasing urbanization and environmental concerns favoring sustainable transport options.
Technological propulsion, materials, and digital connectivity innovations enhance efficiency and safety across both segments.
Despite challenges like high infrastructure costs and regulatory complexities. The industry is poised for growth, driven by expanding high-speed rail networks and global efforts towards sustainable mobility.
Strategic investments in infrastructure and regulatory alignment will be critical in shaping the industry’s future trajectory. Ensuring continued relevance in modern transportation ecosystems.
Editor’s Choice
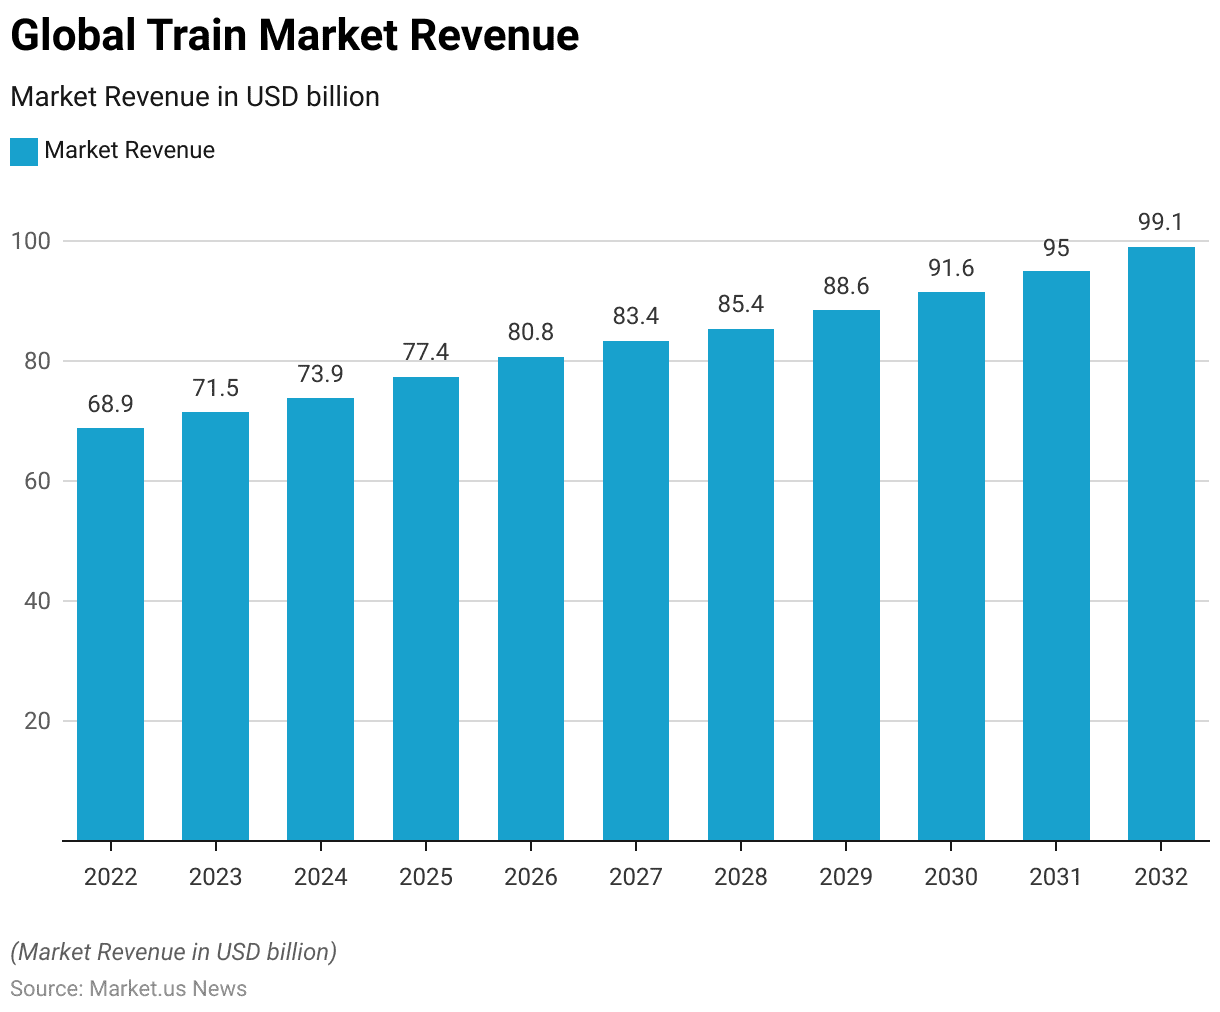
- In 2023, the global train market generated a revenue of USD 71.5 billion.
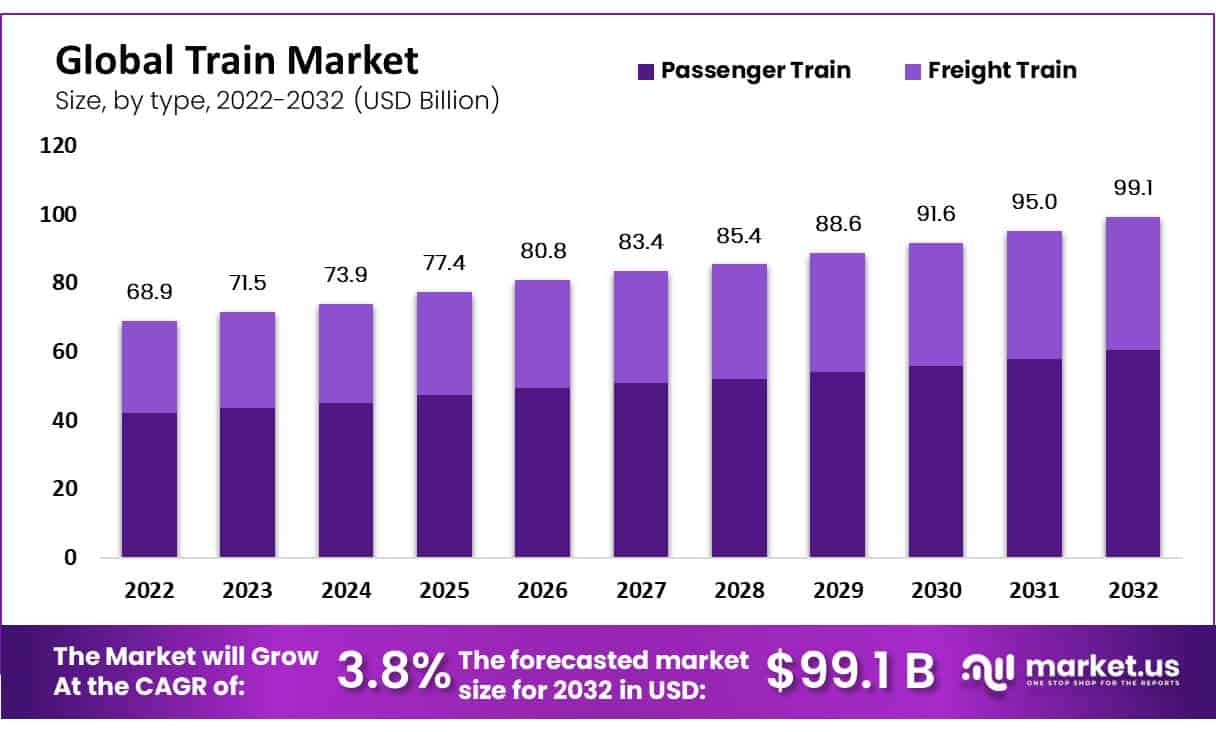
- In 2032, the market is projected to reach USD 99.1 billion. With passenger trains generating USD 60.45 billion and freight trains USD 38.65 billion.
- The global train industry demonstrates a clear preference for offline ticketing, which commands a substantial 69% share of the market.
- The global ranking of countries by railway network length is led by the United States. Which boasts an extensive network of 250,000 kilometers.
- As of 2019, a few key regions dominated global passenger train usage. India held the largest share, accounting for 39% of the global passenger train usage.
- The longest train route is from Moscow to Vladivostok, spanning an impressive 9,259 kilometers (5,753 miles).
- In the United States, BNSF Railway announced a capital investment plan of nearly $4 billion for 2023. Focusing on infrastructure improvements and technological advancements to ensure a reliable and efficient rail network.
- Solar Powered Trains Market size is expected to be worth around USD 4.0 Billion by 2033. From USD 2.2 Billion by 2023, growing at a CAGR of 6.2% during the forecast period from 2024 to 2033.
Train Market Overview
Global Train Market Size
- The global train industry has exhibited consistent growth from 2022 to 2032 at a CAGR of 3.80%. As reflected in the annual revenue figures.
- In 2022, the market generated USD 68.9 billion. Which increased to USD 71.5 billion in 2023 and further to USD 73.9 billion in 2024.
- The market reached USD 95.0 billion in 2031 and is projected to hit USD 99.1 billion by 2032.
Train Market Size – By Type
- The global train industry has experienced consistent growth across both passenger and freight segments from 2022 to 2032.
- In 2022, the total market revenue stood at USD 68.9 billion, with the passenger train industry contributing USD 42.03 billion and freight trains USD 26.87 billion.
- Finally, in 2032, the market is projected to reach USD 99.1 billion. With the passenger train industry generating USD 60.45 billion and freight trains USD 38.65 billion.

Train Market Share – By Ticket Type
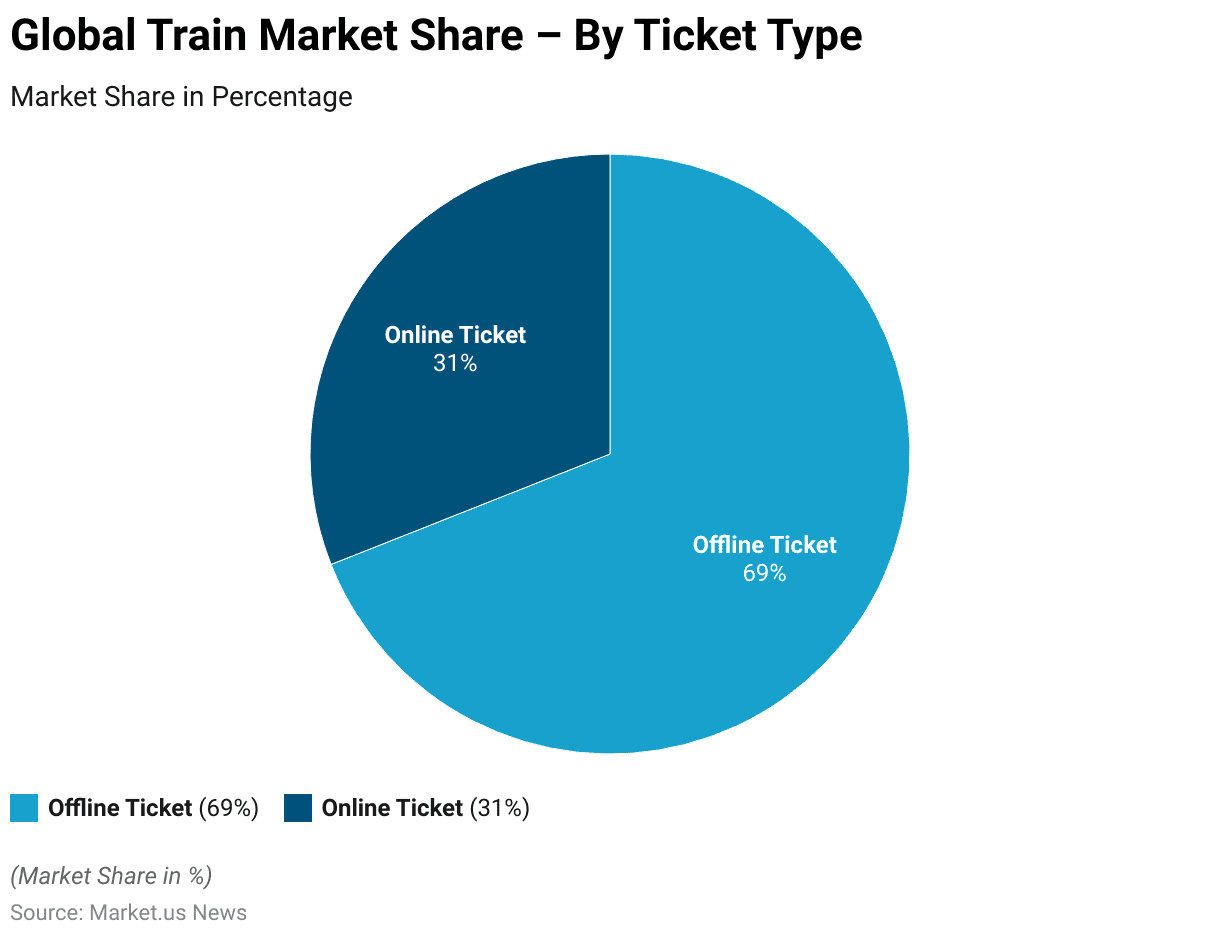
- The global train market demonstrates a clear preference for offline ticketing, which commands a substantial 69% share of the market.
- Meanwhile, online ticketing holds a 31% market share.
Railway Technology Market Overview
Compound Annual Growth Rate of the Global Railway Technology Market – By Region
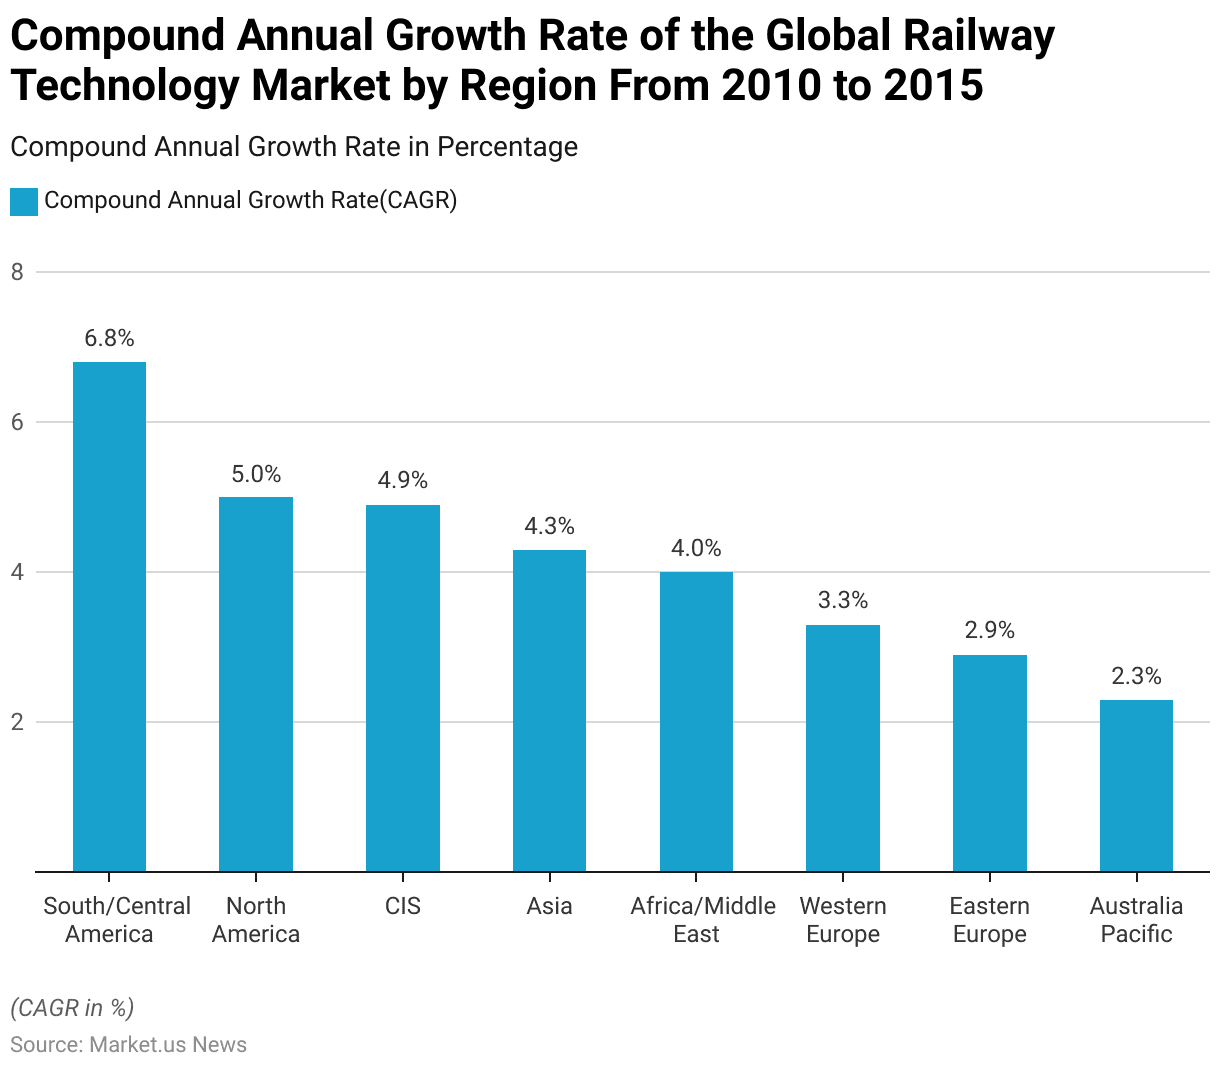
- From 2010 to 2015, the global railway technology market exhibited varied compound annual growth rates (CAGR) across different regions.
- South and Central America led with a notable CAGR of 6.8%, followed by North America with 5%.
- The Commonwealth of Independent States (CIS) experienced a growth rate of 4.9%, while Asia saw a CAGR of 4.3%.
- The Africa/Middle East region grew at 4%, and Western Europe had a growth rate of 3.3%.
- Eastern Europe followed with a CAGR of 2.9%, and Australia/Pacific had the lowest growth rate at 2.3%.
Countries with the Largest Railway Networks in the World
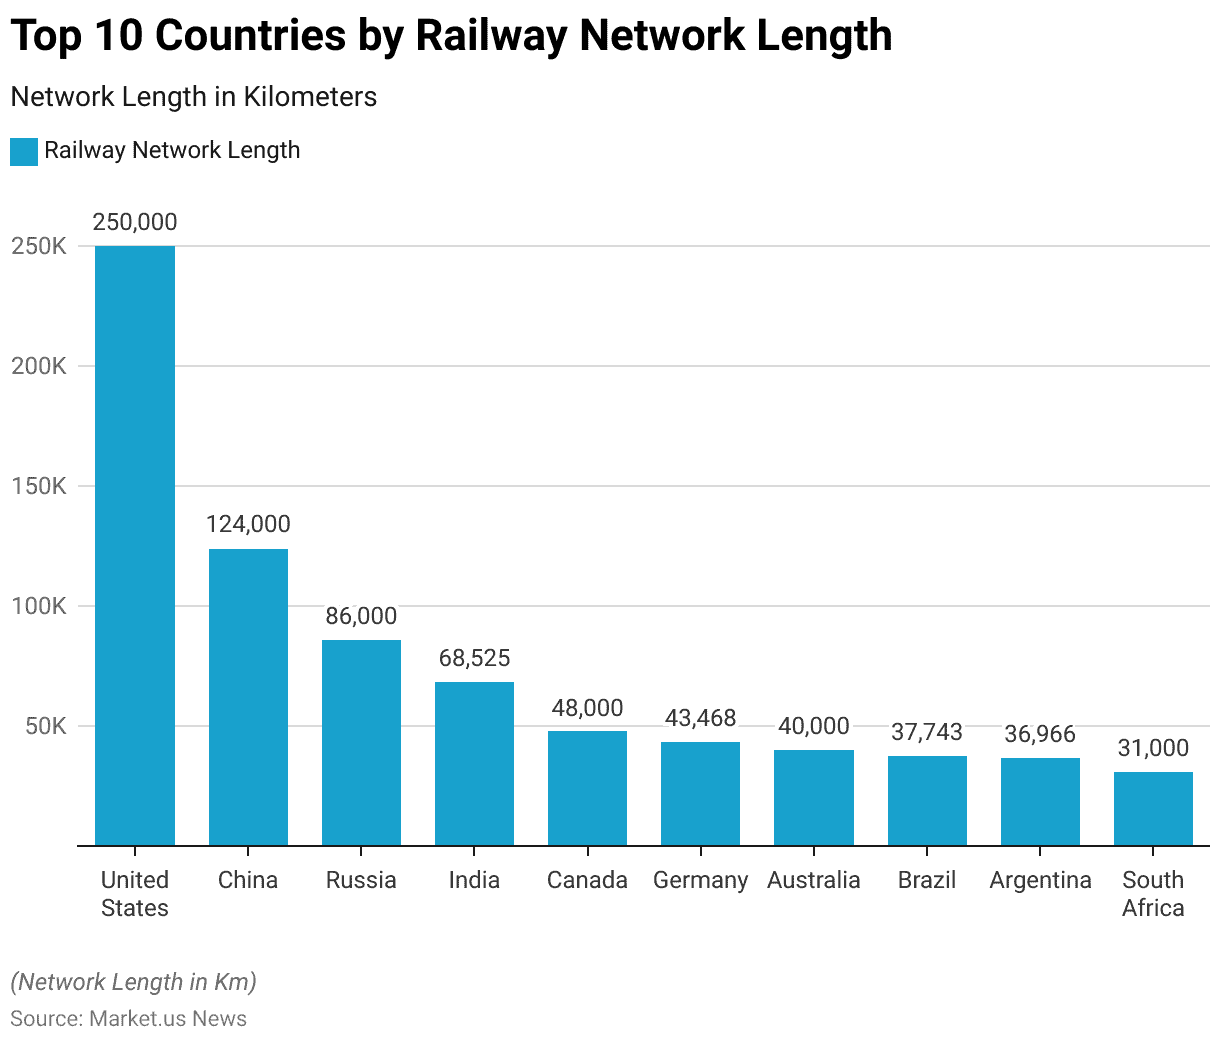
- The global ranking of countries by railway network length is led by the United States. Which boasts an extensive network of 250,000 kilometers.
- Following the United States, China holds the second position with 124,000 kilometers of railway.
- Russia ranks third with an 86,000-kilometer network, while India is fourth with 68,525 kilometers.
- Canada comes fifth, featuring a network length of 48,000 kilometers.
- Germany, with 43,468 kilometers, occupies the sixth position, and Australia is seventh, with a 40,000-kilometer railway network.
- Brazil follows closely in eighth place with 37,743 kilometers, and Argentina ranks ninth with 36,966 kilometers.
- South Africa completes the top ten, with a railway network length of 31,000 kilometers.
Global Railway Passenger Traffic Statistics
Top Countries by Annual Railway Passenger-kilometers
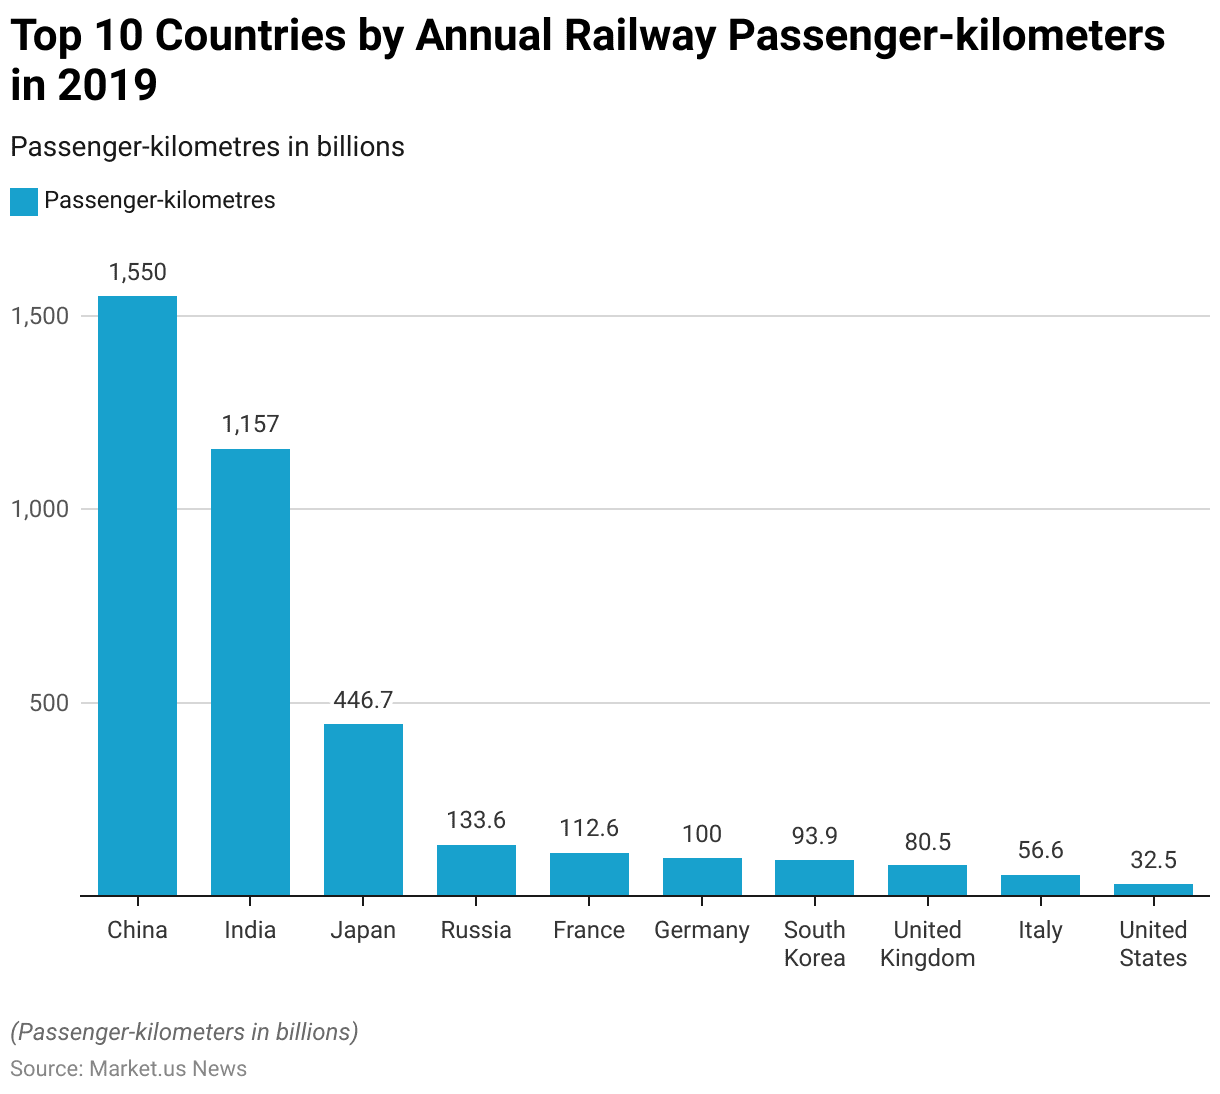
- The top ten countries by annual railway passenger kilometers highlight significant usage of rail transport across various regions.
- China ranks with an impressive 1,550 billion passenger kilometers recorded in 2019, followed by India, which reported 1,157 billion passenger kilometers in the same year.
- Japan stands third with 446.7 billion passenger kilometers, also from 2019.
- Russia follows with 133.6 billion passenger kilometers, while France reported 112.6 billion passenger kilometers, both in 2019.
- Germany ranks sixth with 100 billion passenger-kilometers in 2019, and South Korea is seventh with 93.9 billion passenger kilometers.
- The United Kingdom recorded 80.5 billion passenger-kilometers in 2018, placing it eighth.
- Italy is ninth with 56.6 billion passenger kilometers, and the United States rounds out the top ten with 32.5 billion passenger kilometers, both from 2019.
Share of Global Passenger Train Usage – By Region
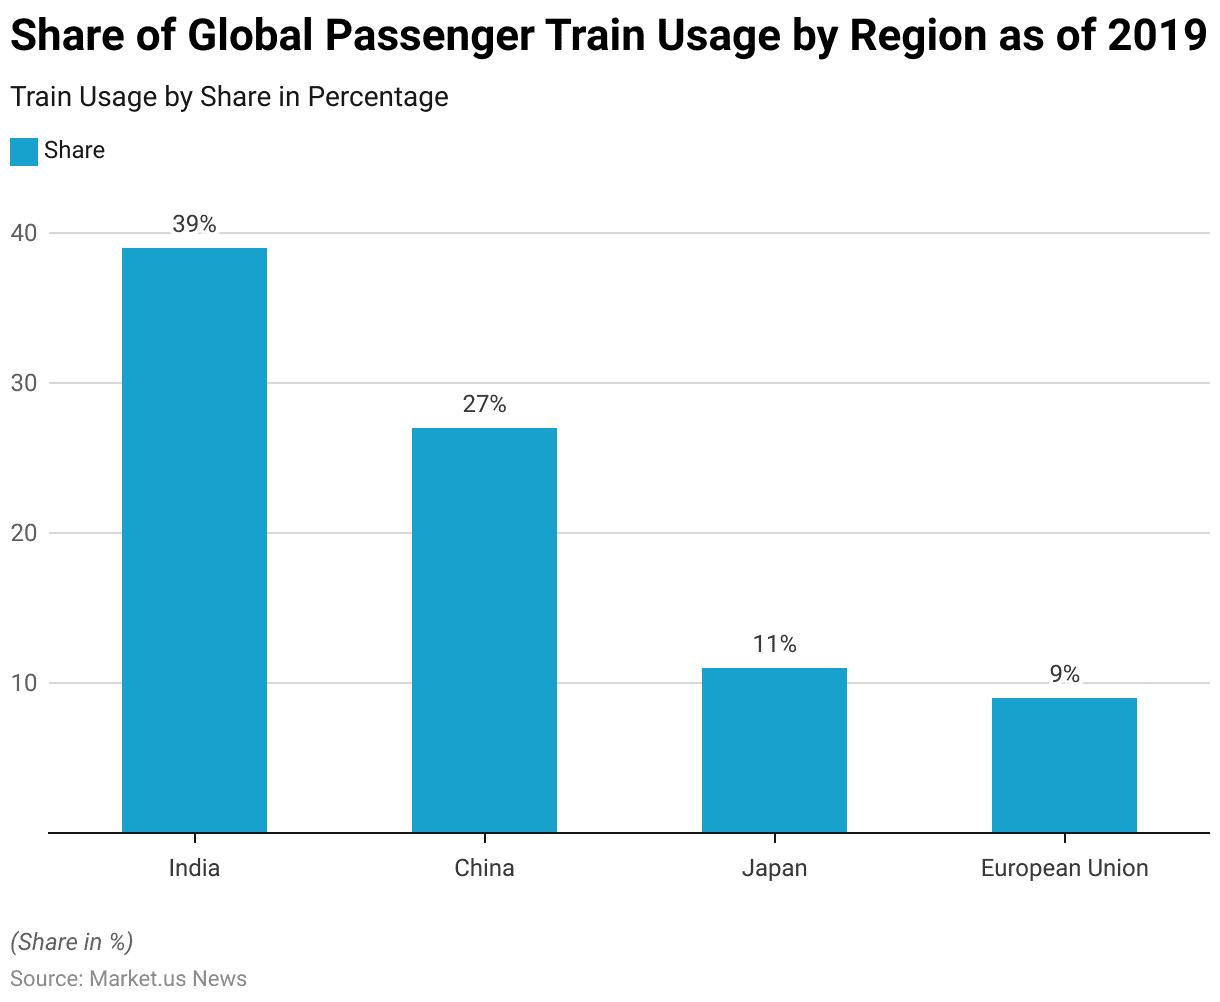
- As of 2019, a few key regions dominated global passenger train usage. India held the largest share, accounting for 39% of the global passenger train usage.
- China followed with a significant 27% share.
- Japan contributed 11% to the global usage, while the European Union collectively accounted for 9%.
Busiest Train Stations Around the World
- Shinjuku Station in Tokyo, Japan, stands as the world’s busiest train industry station, with over 3.6 million passengers passing through daily.
- Established in 1885, it features 36 platforms and over 200 exits, serving as a central hub for Tokyo’s special wards and western suburbs.
- In Australia, Flinders Street Station in Melbourne handles approximately 92,000 passengers daily and holds historical significance as the first railway station in an Australian city, completed in 1909.
- Hamburg Hauptbahnhof in Germany serves around 480,000 passengers daily and ranks as Europe’s third busiest station, pivotal for both local transit and long-distance connections.
- London Waterloo, the largest station in Britain by floor area, accommodates over 210 million passengers annually, including its interconnected tube station.
Largest Railway Networks in the World
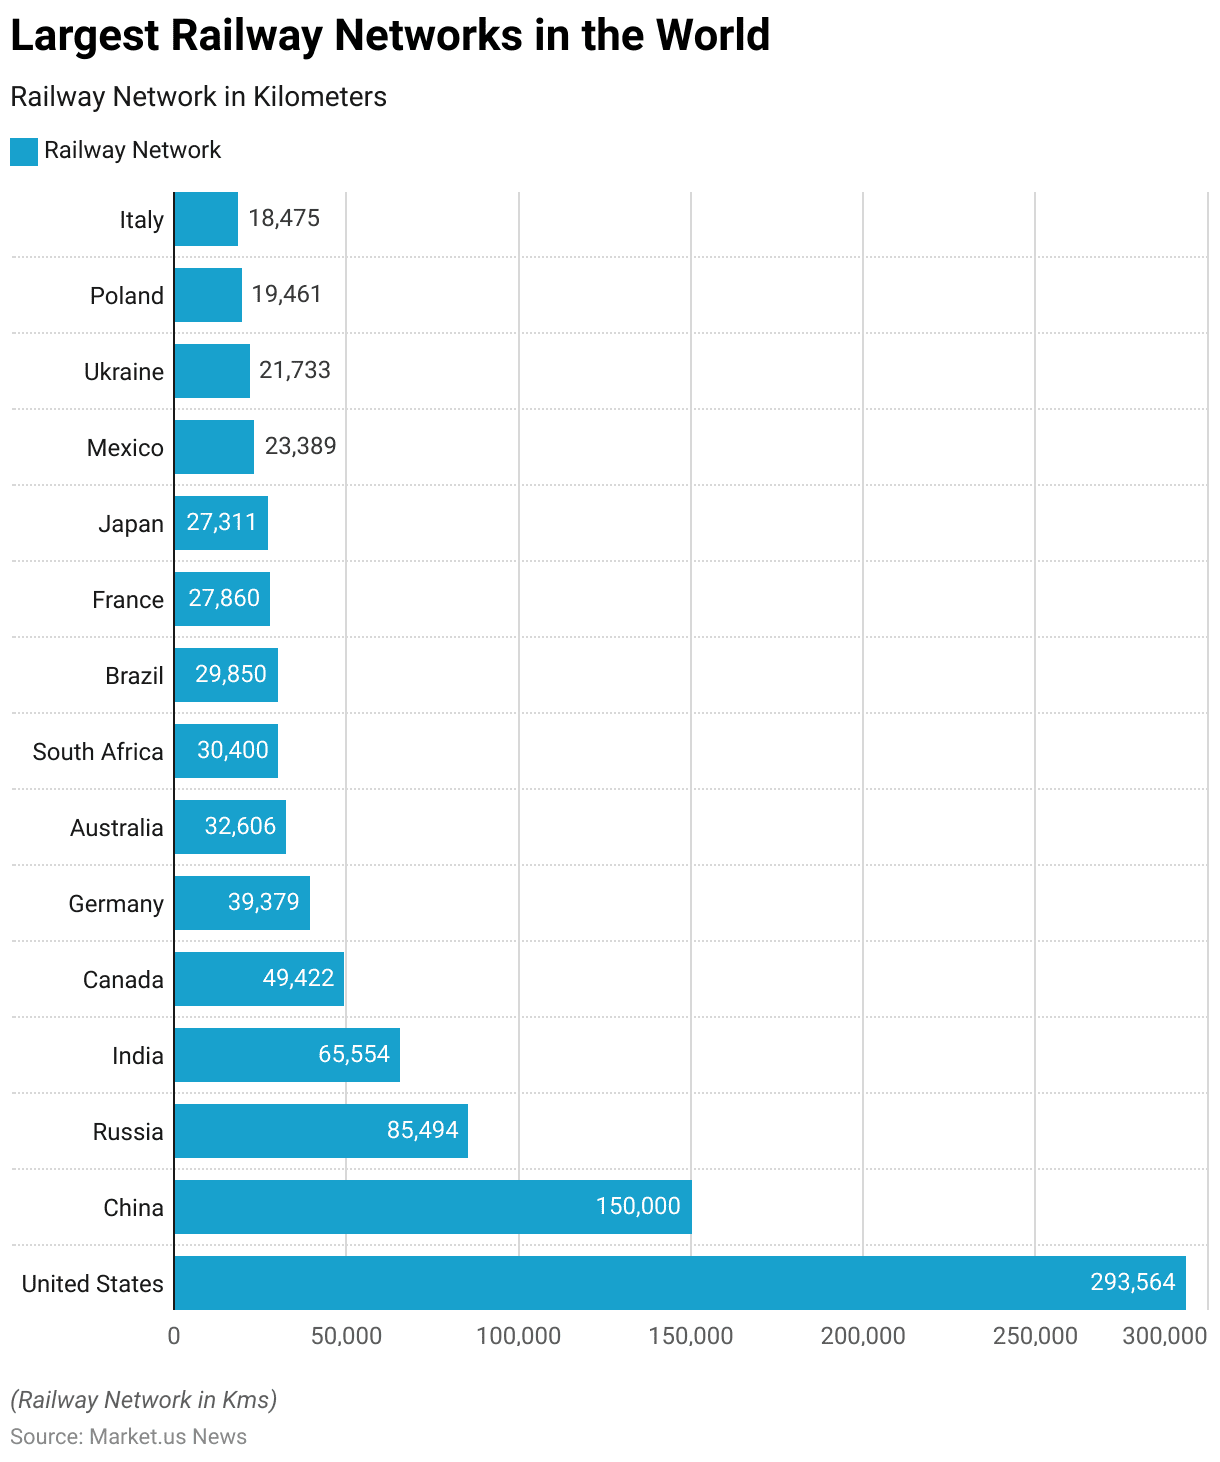
- The largest railway networks in the world, measured in kilometers, span across several countries with extensive rail infrastructures.
- As of 2014, the United States boasts the most extensive network, covering 293,564.2 kilometers.
- China follows with 150,000 kilometers as of 2021, and Russia ranks third with 85,494 kilometers reported in 2019.
- India’s railway network, as of 2014, extends 65,554 kilometers.
- Canada has a network of 49,422 kilometers as of 2021, while Germany’s network reached 39,379 kilometers in 2020.
- Australia, with data from 2022, has 32,606 kilometers, and South Africa reported 30,400 kilometers in 2021.
- Brazil’s railway network, as of 2014, measures 29,849.9 kilometers, followed by France, with 27,860 kilometers in 2020.
- Japan’s network was 27,311 kilometers as of 2015.
The World’s Longest Train Journeys
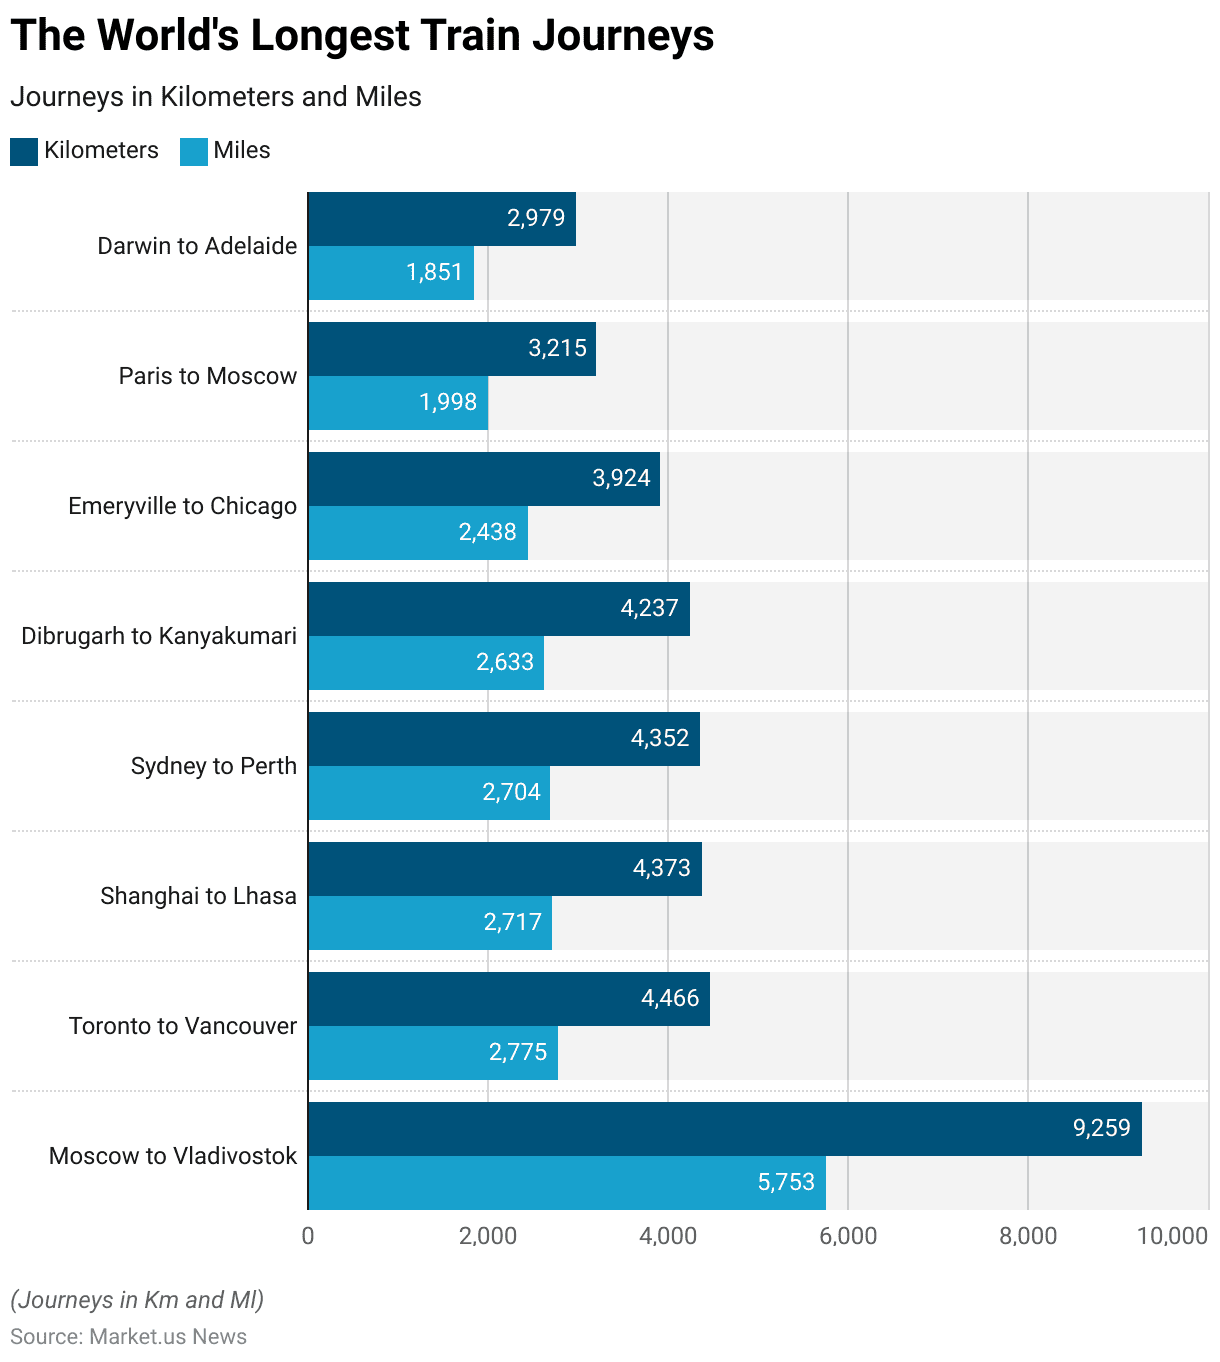
- The world’s longest train journeys offer some of the most extensive and scenic rail experiences across various continents.
- The longest route is from Moscow to Vladivostok, spanning an impressive 9,259 kilometers (5,753 miles).
- Following this, the journey from Toronto to Vancouver covers 4,466 kilometers (2,775 miles), while the Shanghai to Lhasa route extends 4,373 kilometers (2,717 miles).
- The route from Sydney to Perth measures 4,352 kilometers (2,704 miles), and the journey from Dibrugarh to Kanyakumari in India stretches 4,237 kilometers (2,633 miles).
- In North America, the Emeryville to Chicago route covers 3,924 kilometers (2,438 miles).
- In Europe, the Paris to Moscow journey spans 3,215 kilometers (1,998 miles), and in Australia, the Darwin to Adelaide route measures 2,979 kilometers (1,851 miles).
Train Ticket Price Statistics and Trends
Average Passenger Fares in Commuter Rail
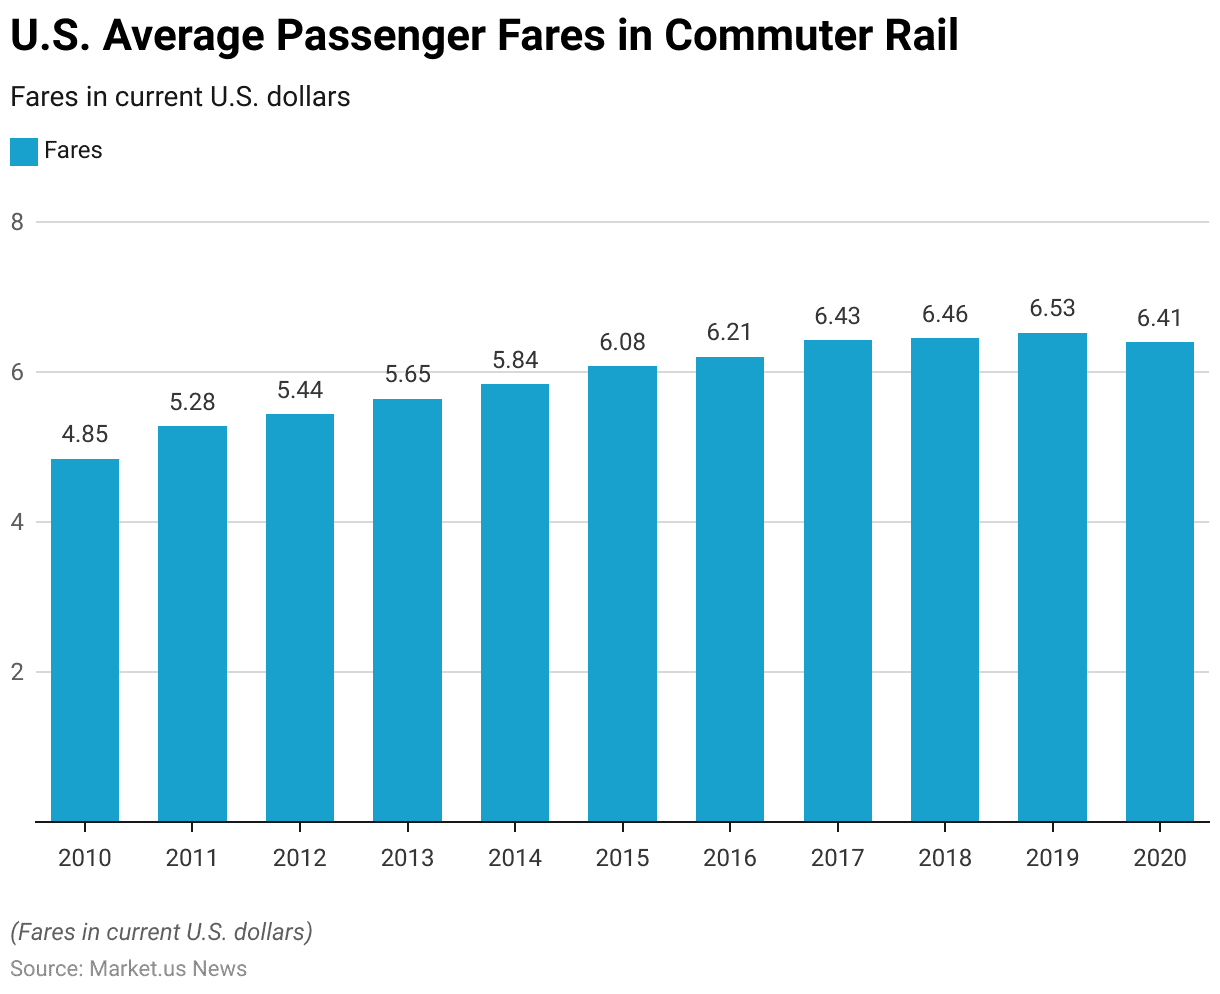
- The average passenger fares for commuter rail in the United States have shown a general upward trend from 2010 to 2020 when measured in current U.S. dollars.
- In 2010, the average fare was $4.85, which increased to $5.28 in 2011 and $5.44 in 2012.
- By 2015, the average fare rose to $6.08, followed by $6.21 in 2016.
- However, in 2020, there was a slight decrease, with the fare averaging $6.41.
Rail Revenue Generated from Ordinary and Season Ticket Passenger Fares
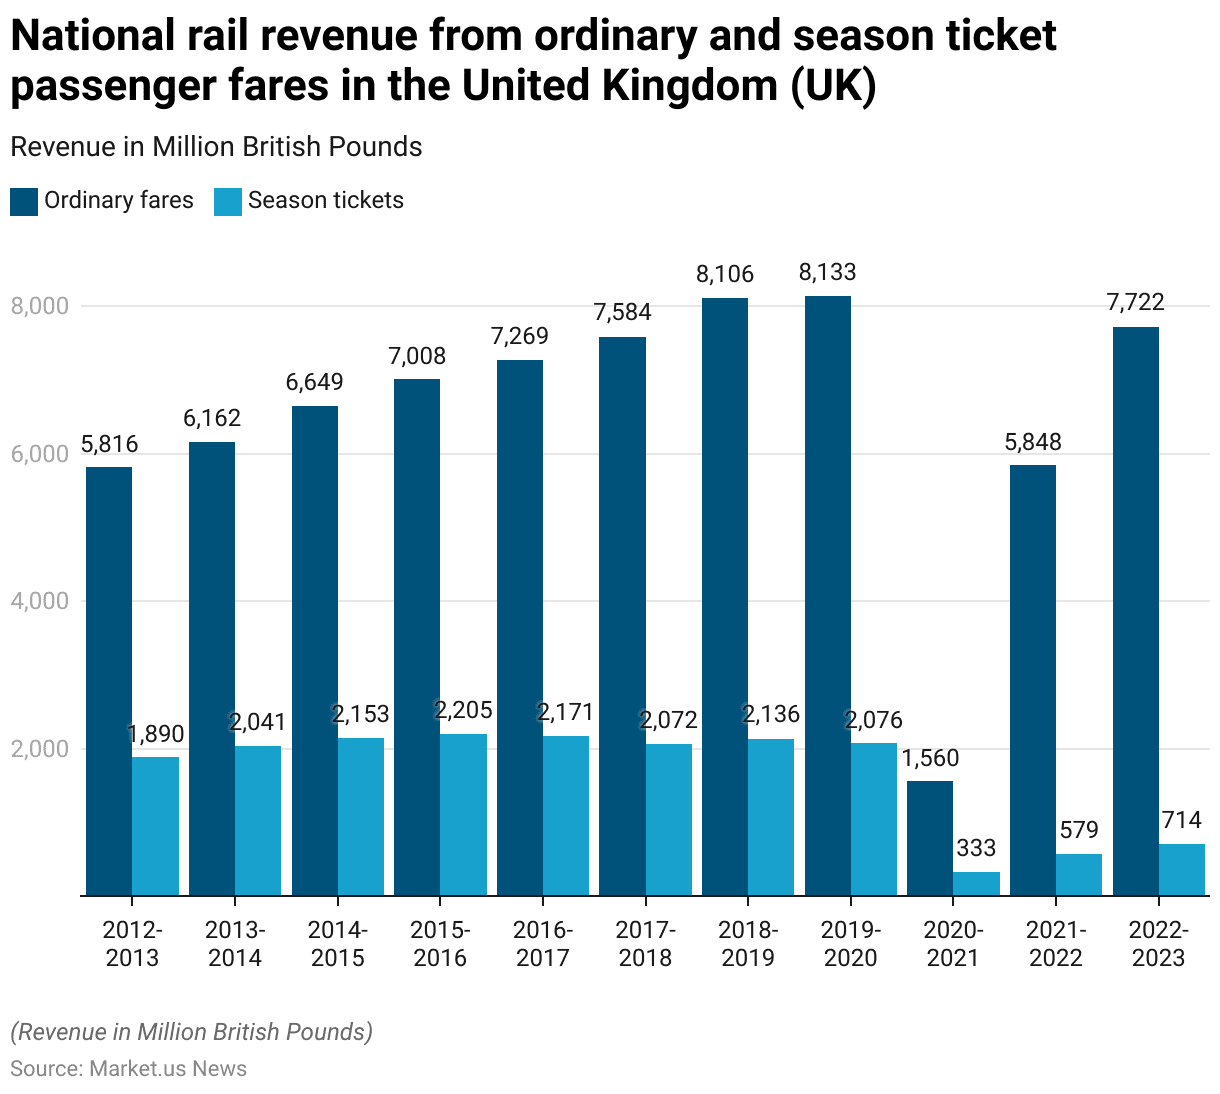
- The national rail revenue from ordinary and season ticket passenger fares in the United Kingdom (UK) has experienced fluctuations over the past decade.
- Between 2012-2013 and 2019-2020, ordinary fare revenue steadily increased from £5,816 million to £8,133 million, while season ticket revenue grew from £1,890 million to £2,076 million.
- The following years saw a recovery, with 2021-2022 recording £5,848 million in ordinary fares and £579 million in season tickets, and 2022-2023 further increasing to £7,722 million and £714 million, respectively.
Rise in Train Ticket Prices
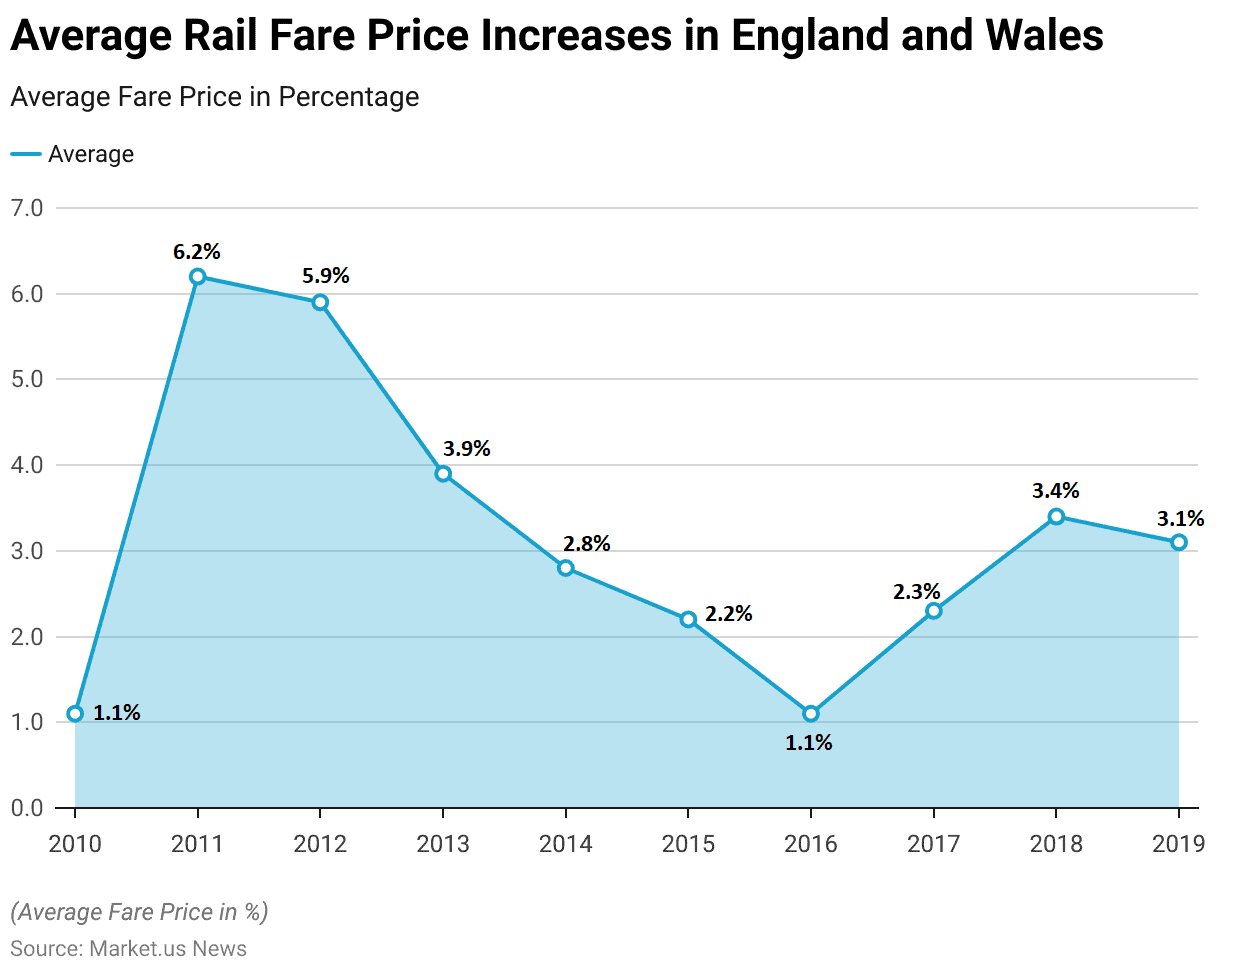
- The average rail fare price increases in England and Wales from 2010 to 2019 show a variable pattern of fare adjustments.
- In 2010, the increase was relatively modest at 1.1%, followed by a significant hike of 6.2% in 2011 and 5.9% in 2012.
- The decade closed with a 3.1% increase in 2019.
Demographics of Train/Railway Passengers
According to Age & Gender
- In England in 2015, the average number of rail trips taken annually was higher among males at 22 trips compared to females who averaged 18 trips.
- Rail usage showed significant variation across age groups, with individuals aged 21-29 making the highest average of 41 trips per year, contrasting sharply with those over 70 years old, who averaged only six trips annually.
- Among females aged 21-29, the average number of rail trips was notably higher at 43 per year, marking the highest average among all age and gender groups.
- Conversely, females aged 70 and older made the fewest rail trips annually, averaging just five trips each.
According to Income & Occupation
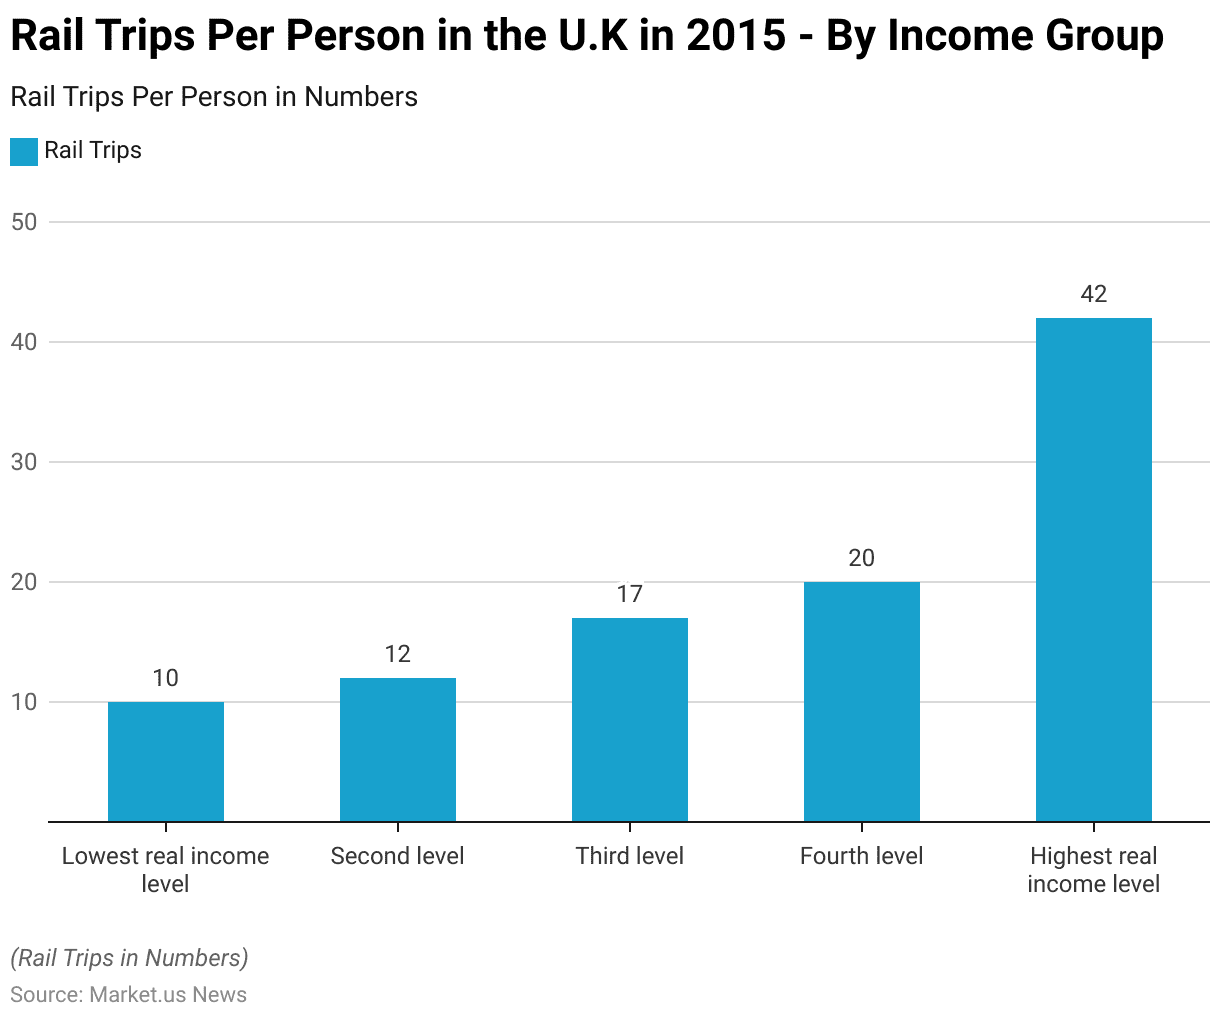
- In 2015, the frequency of rail trips per person in the U.K. varied significantly across different income levels.
- Individuals in the lowest real income level made an average of 10 rail trips per person, while those in the second income level averaged 12 trips.
- The third income level saw an increase to 17 trips per person, and the fourth level further rose to 20 trips.
- Notably, individuals in the highest real income level made significantly more rail trips, averaging 42 per person.
Consumer Preferences & Trends
Key Drivers
Europe
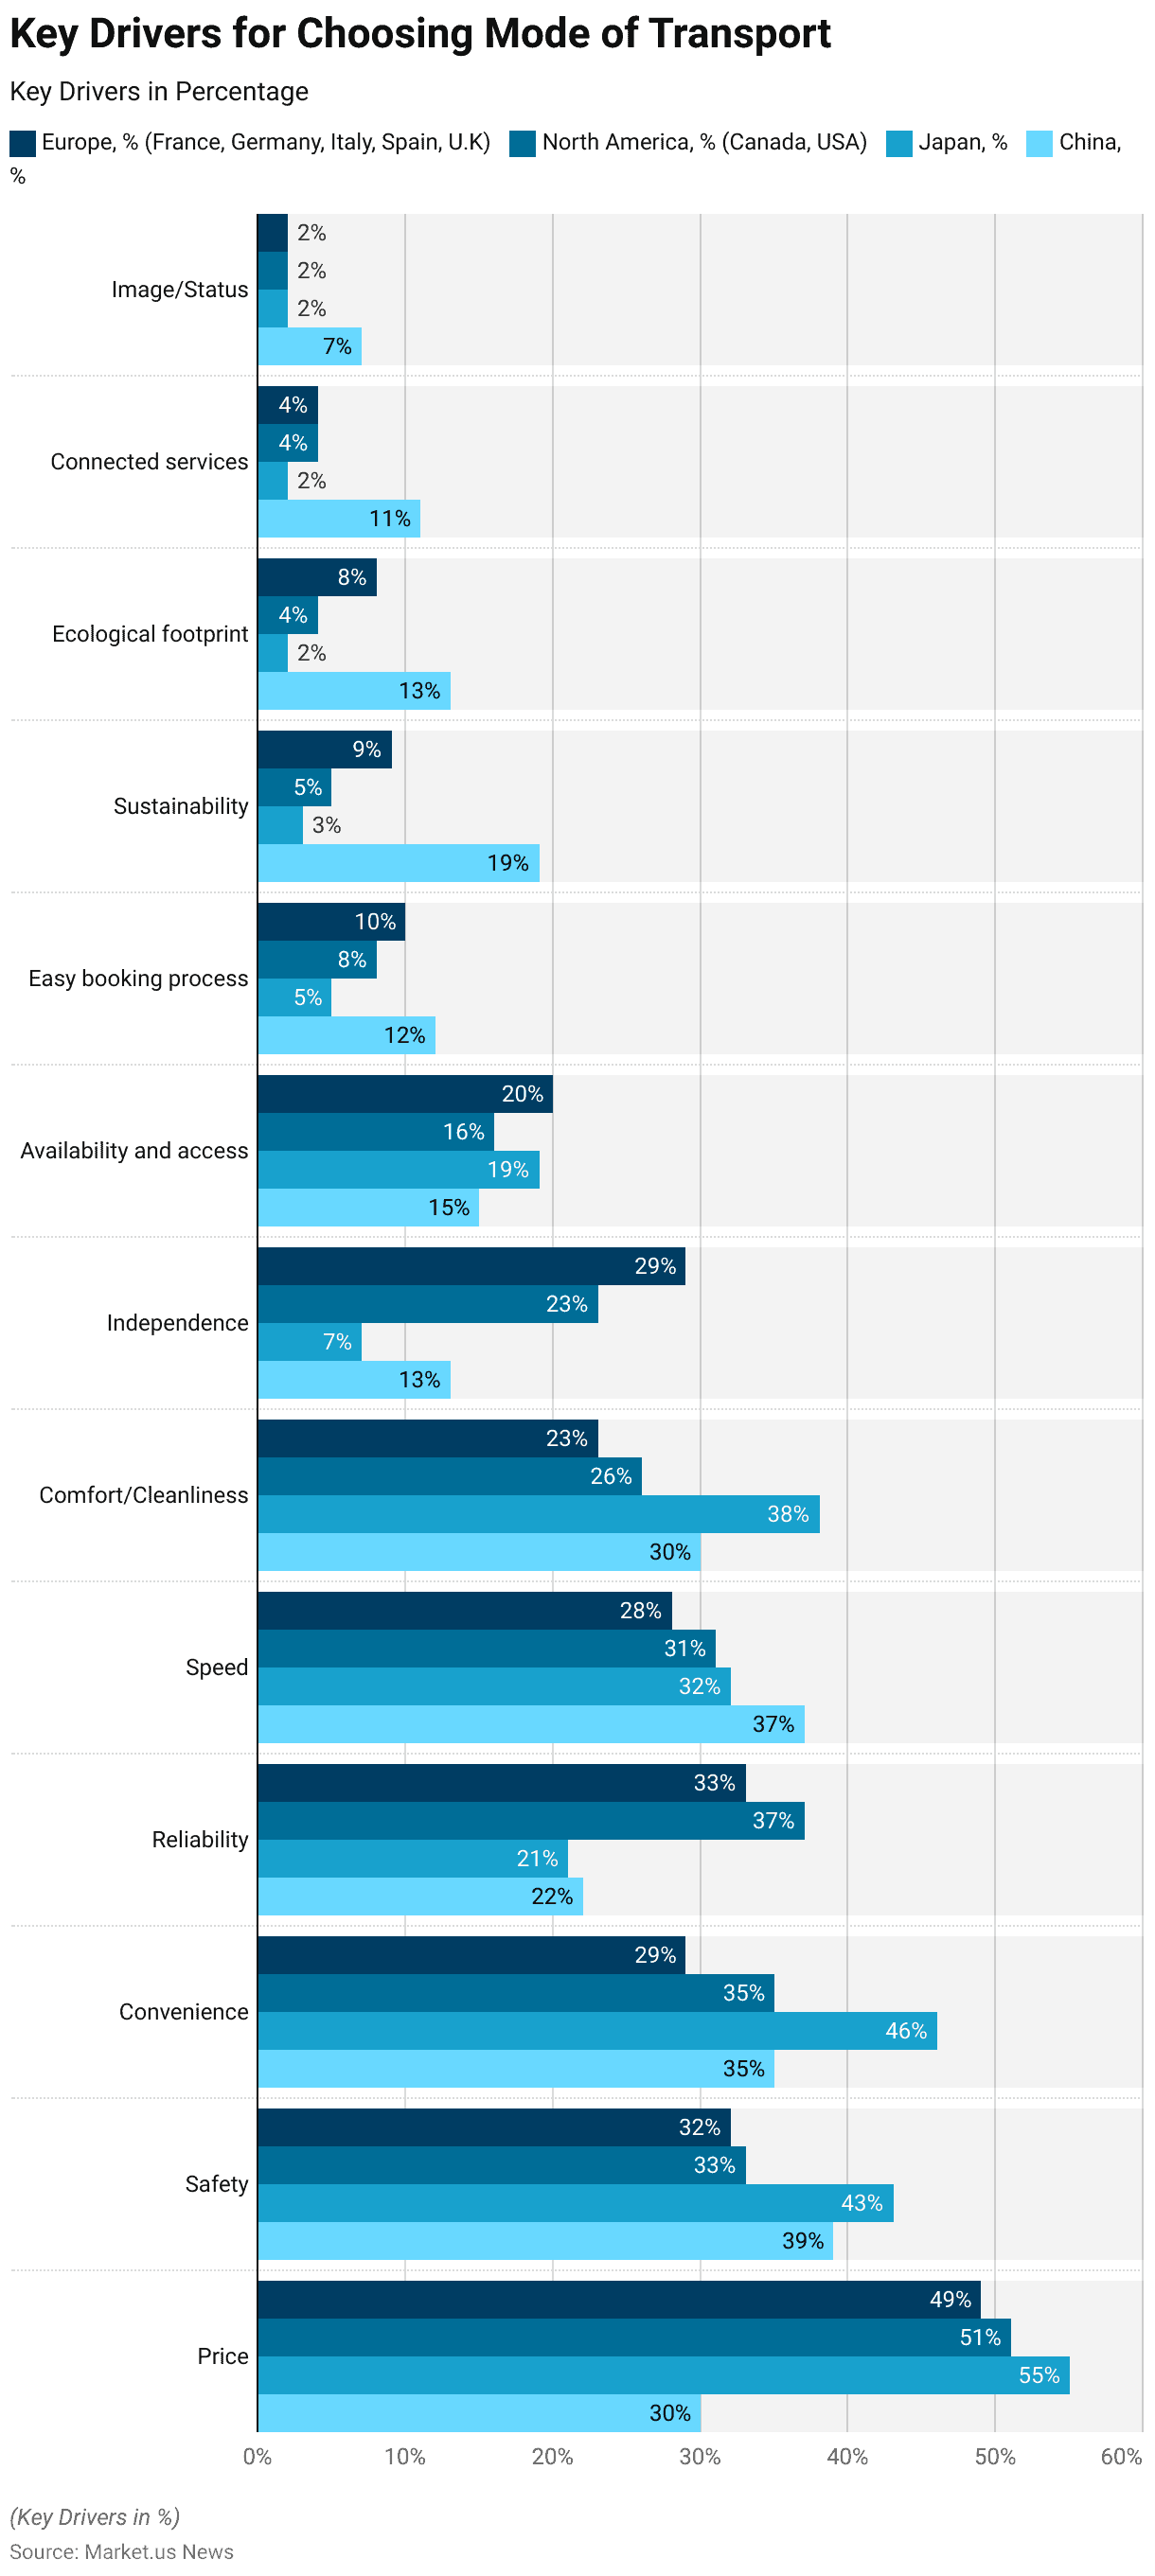
- The decision criteria for choosing a mode of transport vary across different regions, with notable differences in priorities.
- In Europe (France, Germany, Italy, Spain, and the U.K.), the primary driver is price, influencing 49% of decisions, followed by safety (32%), reliability (33%), and convenience (29%).
- Speed and independence are also significant factors, with 28% and 29% respectively, while comfort and cleanliness influence 23% of choices.
- Availability and access, easy booking process, sustainability, ecological footprint, connected services, and image/status play lesser roles, ranging from 20% to 2%.
North America
- In North America (Canada and the USA), price is also the leading factor, affecting 51% of decisions, followed by reliability (37%), safety (33%), and convenience (35%).
- Speed and comfort/cleanliness are important for 31% and 26%, respectively.
- Independence influences 23%, while availability and access affect 16% of decisions.
Japan
- In Japan, price is the most significant factor, with 55% of decisions influenced by it.
- Safety (43%), convenience (46%), and comfort/cleanliness (38%) are also crucial.
- Speed affects 32% of decisions, while reliability influences 21%.
- Availability and access, independence, easy booking process, sustainability, ecological footprint, connected services, and image/status are less significant, ranging from 19% to 2%.
Complaints
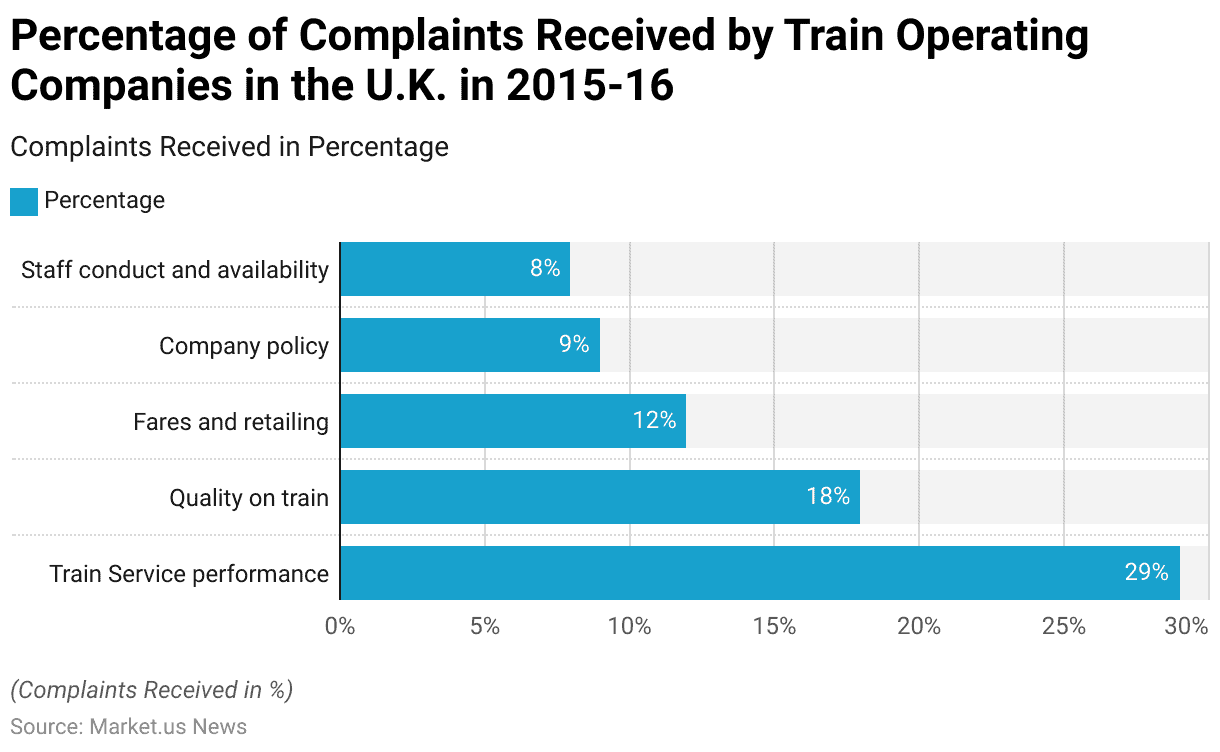
- In the U.K., during the 2015-16 period, train industry operating companies received a variety of complaints categorized into several key areas.
- The most significant category was train industry service performance, which accounted for 29% of all complaints.
- This was followed by complaints regarding the quality of trains, comprising 18% of the total.
- Issues related to fares and retailing made up 12% of the complaints, while company policy was the focus of 9%.
- Complaints about staff conduct and availability represented 8% of the total.
Investments in Railway Development by Governments and Private Organizations
- Governments and private organizations globally have been making substantial investments in railway development, aiming to enhance infrastructure and connectivity.
- In the United States, BNSF Railway announced a capital investment plan of nearly $4 billion for 2023, focusing on infrastructure improvements and technological advancements to ensure a reliable and efficient rail network.
- In China, the Belt and Road Initiative continues to drive significant investments, with China expanding its railway network to 150,000 km, with substantial projects across Asia and Africa.
- The Philippines, under its “Build, Build, Build” program, has allocated $158 billion for infrastructure projects, including the North-South Commuter Railway, to bolster its transport system by 2024.
- Indonesia aims to extend its national railway network to 10,524 km by 2030, supported by a mix of state funding and private sector investments totaling IDR 835 trillion.
- In the Indo-Pacific region, the U.S. International Development Finance Corporation (DFC) and the Government of India are collaborating on a $1 billion investment in the India Green Transition Fund, focusing on sustainable and clean-energy projects.
Regulations for Trains/Railways Industry
- In the United States, the Railway Safety Act of 2023 mandates stricter safety measures for trains carrying hazardous materials, such as advanced tank car standards and improved defect detectors.
- In the UK, the Strikes (Minimum Service Levels: Passenger Railway Services) Regulations 2023 ensure that essential rail services are maintained during strikes. This regulation requires rail companies to provide a minimum level of service to avoid severe disruptions.
- Japan has stringent safety and operational standards, focusing on high-speed rail network efficiency and disaster resilience. New cybersecurity regulations mandate robust protection against cyber threats, reflecting the increasing importance of digital security in rail operations.
Discuss your needs with our analyst
Please share your requirements with more details so our analyst can check if they can solve your problem(s)


