Table of Contents
- Introduction
- Editor’s Choice
- Train Market Overview and Statistics
- Global Railway Technology Market Overview and Statistics
- Countries with the Largest Train Networks in the World Statistics
- Global Train Passenger Traffic Statistics
- Busiest Train Stations Around the World Statistics
- Largest Railway Networks in the World
- The World’s Longest Train Journeys Statistics
- Train Ticket Price Statistics and Trends, Statistics
- Surface and Underground Train Construction Revenue Statistics
- Demographics of Train, Railway Passengers Statistics
- Consumer Preferences & Trends
- Impact of COVID-19
- Investments in Railway Development by Governments and Private Organizations
- Regulations for Trains / Railways Statistics
- Recent Developments
- Conclusion
- FAQs
Introduction
Train Statistics: The global train industry, pivotal in both freight logistics and passenger transport, exhibits diverse technological advancements and market dynamics.
Freight trains dominate long-distance cargo transport, influenced by economic activities and trade volumes.
Passenger trains, catering to urban rail transit and long-haul journeys, benefit from increasing urbanization and environmental concerns favoring sustainable transport options.
Technological innovations in propulsion, materials, and digital connectivity enhance efficiency and safety across both segments.
Despite challenges like high infrastructure costs and regulatory complexities, the industry is poised for growth. Driven by expanding high-speed rail networks and global efforts towards sustainable mobility.
Strategic investments in infrastructure and regulatory alignment will be critical in shaping the industry’s future trajectory. Ensuring continued relevance in modern transportation ecosystems.
Editor’s Choice
- In 2023, the global train market generated a revenue of USD 71.5 billion.
- In 2032, the market is projected to reach USD 99.1 billion. With passenger trains generating USD 60.45 billion and freight trains USD 38.65 billion.
- The global train market demonstrates a clear preference for offline ticketing, which commands a substantial 69% share of the market.
- The global ranking of countries by railway network length is led by the United States. Which boasts an extensive network of 250,000 kilometers.
- As of 2019, global passenger train usage was dominated by a few key regions. India held the largest share, accounting for 39% of the global passenger train usage.
- The longest train route is from Moscow to Vladivostok, spanning an impressive 9,259 kilometers (5,753 miles).
- In the United States, BNSF Railway announced a capital investment plan of nearly $4 billion for 2023. Focusing on infrastructure improvements and technological advancements to ensure a reliable and efficient rail network.
- Solar Powered Trains Market size is expected to be worth around USD 4.0 Billion by 2033, From USD 2.2 Billion by 2023, growing at a CAGR of 6.2% during the forecast period from 2024 to 2033.
Train Market Overview and Statistics
Global Train Market Size Statistics
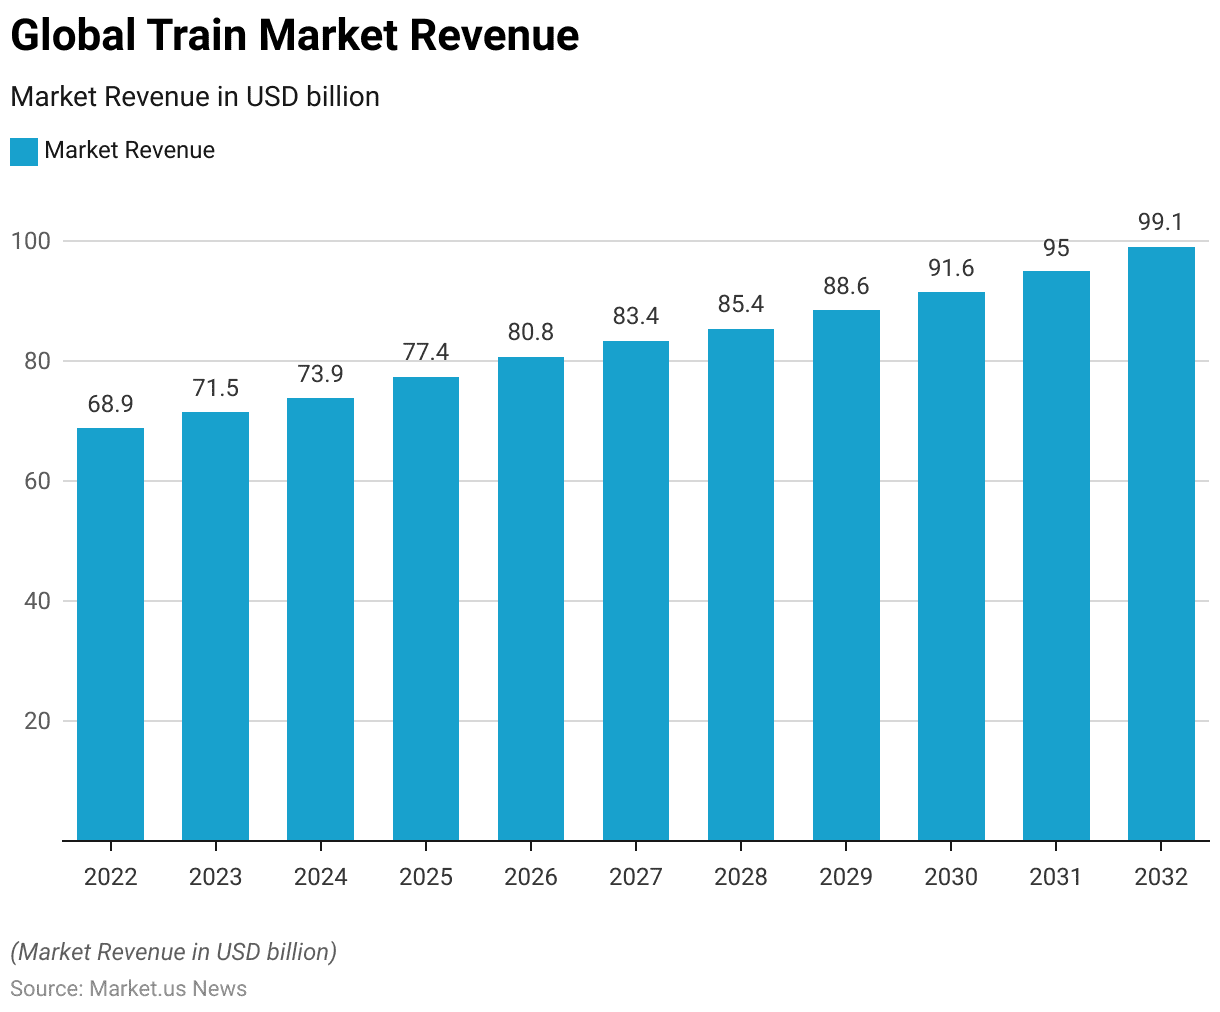
- The global train market has exhibited consistent growth from 2022 to 2032 at a CAGR of 3.80%. As reflected in the annual revenue figures.
- In 2022, the market generated USD 68.9 billion. Which increased to USD 71.5 billion in 2023 and further to USD 73.9 billion in 2024.
- The upward trend continued, with revenues reaching USD 77.4 billion in 2025 and USD 80.8 billion in 2026.
- By 2027, the market revenue was USD 83.4 billion, and it climbed to USD 85.4 billion in 2028.
- The growth trajectory maintained its momentum, with revenues of USD 88.6 billion in 2029 and USD 91.6 billion in 2030.
- The market reached USD 95.0 billion in 2031 and is projected to hit USD 99.1 billion by 2032.
- This steady increase in revenue underscores the robust expansion and positive outlook of the global train market over the decade.
(Source: market.us)
Global Train Market Size – By Type Statistics
2022-2027
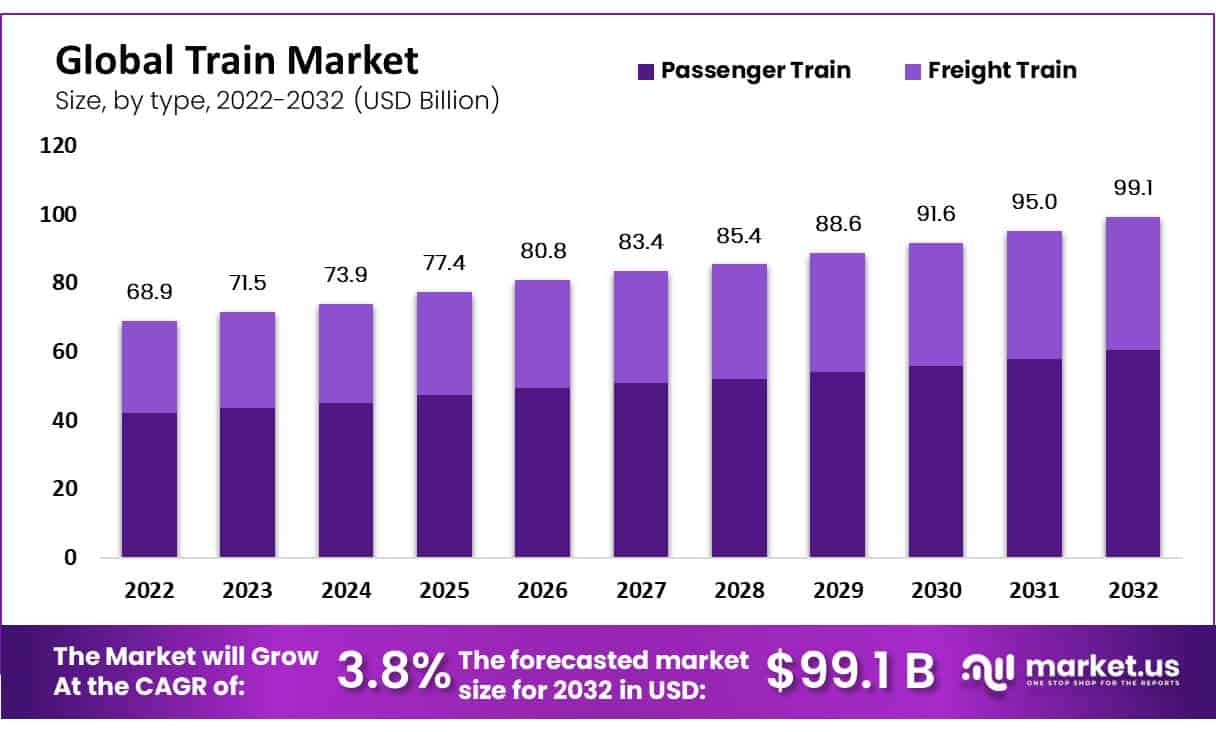
- The global train market has experienced consistent growth across both passenger and freight segments from 2022 to 2032.
- In 2022, the total market revenue stood at USD 68.9 billion. With passenger trains contributing USD 42.03 billion and freight trains USD 26.87 billion.
- By 2023, the overall market revenue increased to USD 71.5 billion. With passenger train revenue at USD 43.62 billion and freight train revenue at USD 27.89 billion.
- This growth trend continued, with the total market reaching USD 73.9 billion in 2024. Driven by USD 45.08 billion from passenger trains and USD 28.82 billion from freight trains.
- In 2025, total revenue climbed to USD 77.4 billion. With passenger trains generating USD 47.21 billion and freight trains USD 30.19 billion.
- The market maintained its upward trajectory in 2026 with a total of USD 80.8 billion. Where passenger train revenue was USD 49.29 billion, and freight train revenue was USD 31.51 billion.
- By 2027, the market reached USD 83.4 billion, supported by USD 50.87 billion from passenger trains and USD 32.53 billion from freight trains.
2028-2032
- The year 2028 saw the total market revenue at USD 85.4 billion. With passenger train revenue of USD 52.09 billion and freight train revenue of USD 33.31 billion.
- In 2029, the market expanded to USD 88.6 billion. With passenger trains contributing USD 54.05 billion and freight trains USD 34.55 billion.
- This growth continued into 2030, with the market totaling USD 91.6 billion. driven by USD 55.88 billion from passenger trains and USD 35.72 billion from freight trains.
- By 2031, total market revenue was USD 95.0 billion. With passenger train revenue at USD 57.95 billion and freight train revenue at USD 37.05 billion.
- Finally, in 2032, the market is projected to reach USD 99.1 billion, with passenger trains generating USD 60.45 billion and freight trains USD 38.65 billion.
- This sustained growth underscores the robust expansion of both passenger and freight train segments in the global train market over the decade.
(Source: market.us)

Global Train Market Share – By Ticket Type Statistics
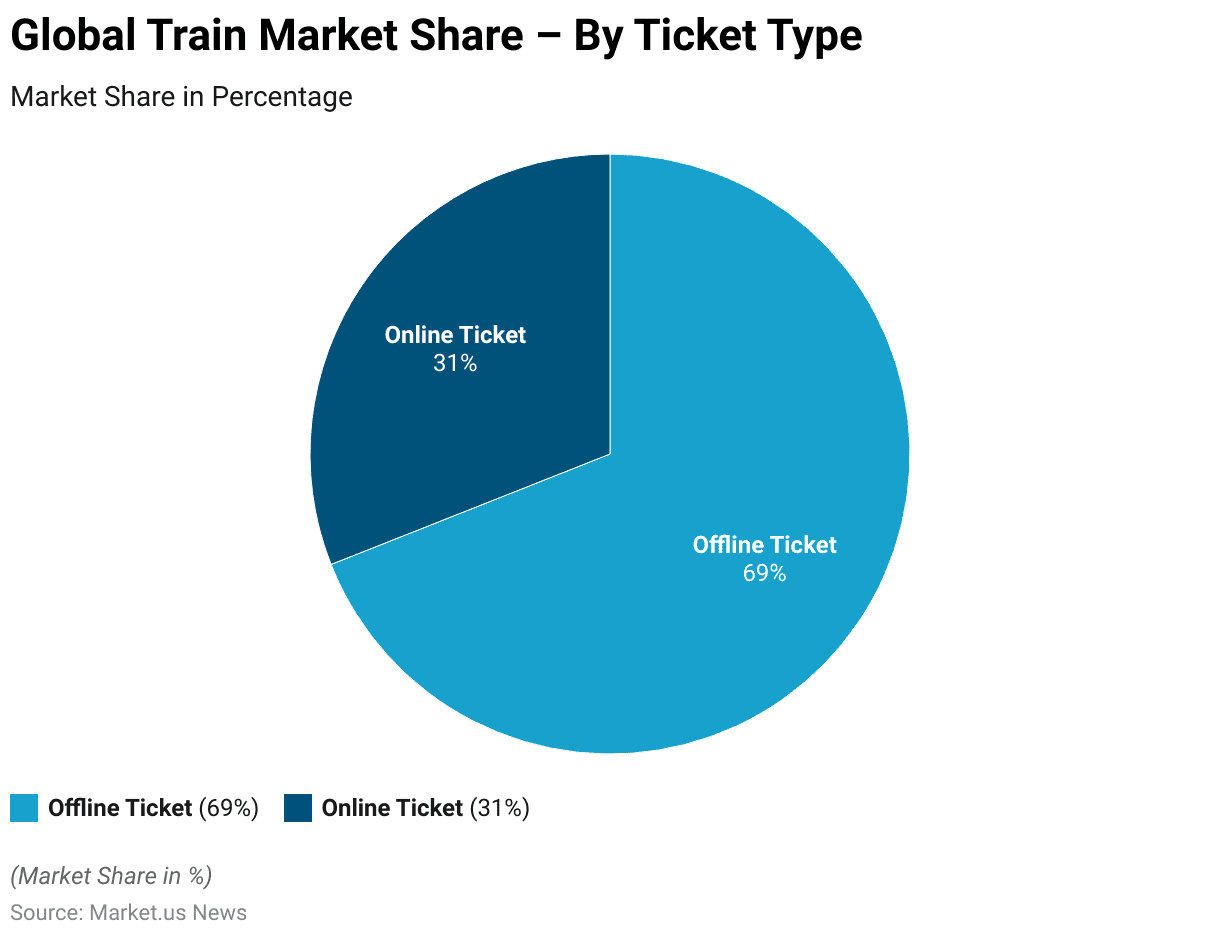
- The global train market demonstrates a clear preference for offline ticketing, which commands a substantial 69% share of the market.
- Meanwhile, online ticketing holds a 31% market share.
- This distribution indicates that despite the increasing digitalization in various sectors, a majority of train travelers still favor purchasing tickets through traditional offline channels.
- However, the significant portion of the market occupied by online ticketing reflects a growing trend toward digital transactions, suggesting opportunities for further expansion in the online segment.
- This trend highlights the potential for digital platforms to capture a larger share of the market as consumer preferences evolve.
(Source: market.us)
Global Railway Technology Market Overview and Statistics
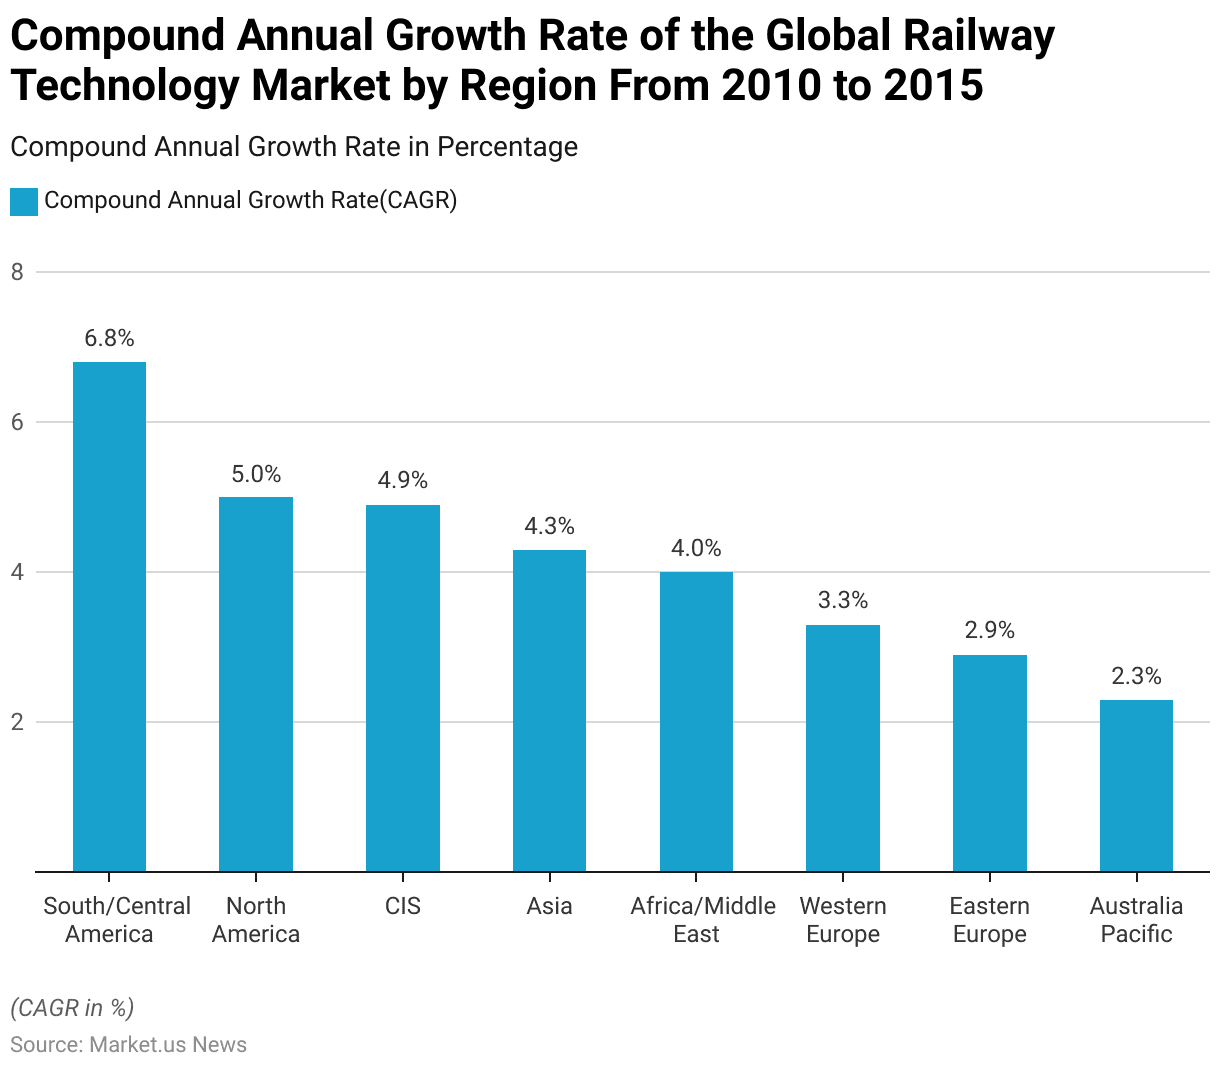
Compound Annual Growth Rate of the Global Railway Technology Market – By Region
- From 2010 to 2015, the global railway technology market exhibited varied compound annual growth rates (CAGR) across different regions.
- South and Central America led with a notable CAGR of 6.8%, followed by North America with 5%.
- The Commonwealth of Independent States (CIS) experienced a growth rate of 4.9%, while Asia saw a CAGR of 4.3%.
- The Africa/Middle East region grew at 4%, and Western Europe had a growth rate of 3.3%.
- Eastern Europe followed with a CAGR of 2.9%, and Australia/Pacific had the lowest growth rate at 2.3%.
- These figures reflect the diverse expansion rates in railway technology adoption and development across the globe.
(Source: Statista)
Countries with the Largest Train Networks in the World Statistics
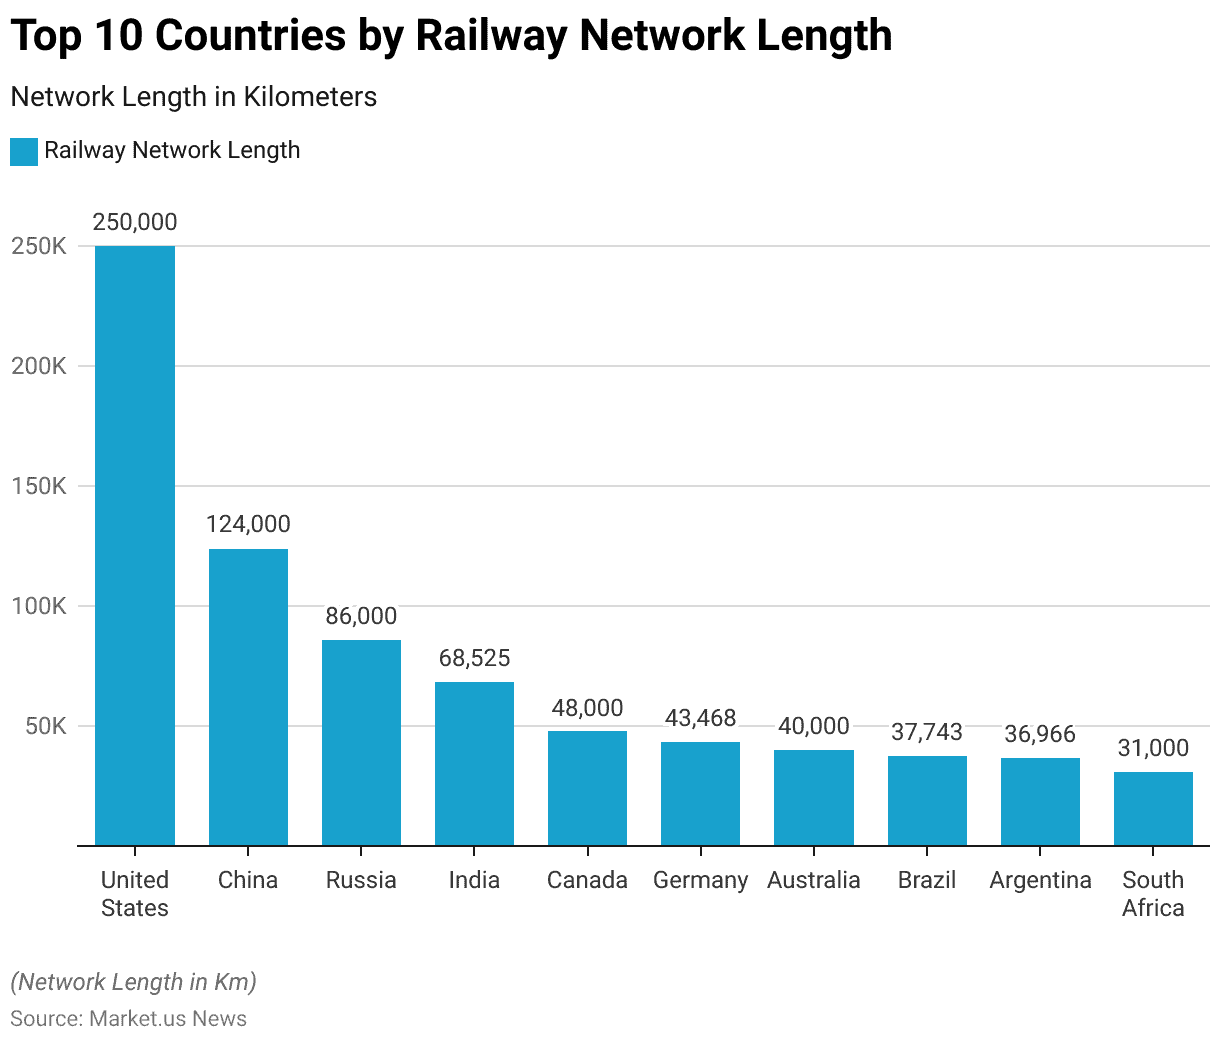
- The global ranking of countries by railway network length is led by the United States, which boasts an extensive network of 250,000 kilometers.
- Following the United States, China holds the second position with 124,000 kilometers of railway.
- Russia ranks third with an 86,000-kilometer network, while India is fourth with 68,525 kilometers.
- Canada comes fifth, featuring a network length of 48,000 kilometers.
- Germany, with 43,468 kilometers, occupies the sixth position, and Australia is seventh, with a 40,000-kilometer railway network.
- Brazil follows closely in eighth place with 37,743 kilometers, and Argentina ranks ninth with 36,966 kilometers.
- South Africa completes the top ten, with a railway network length of 31,000 kilometers.
- This ranking underscores the extensive railway infrastructures of these nations, which are crucial for their transportation and logistics sectors.
(Source: E-rail)
Global Train Passenger Traffic Statistics
Top Countries by Annual Railway Passenger-kilometers
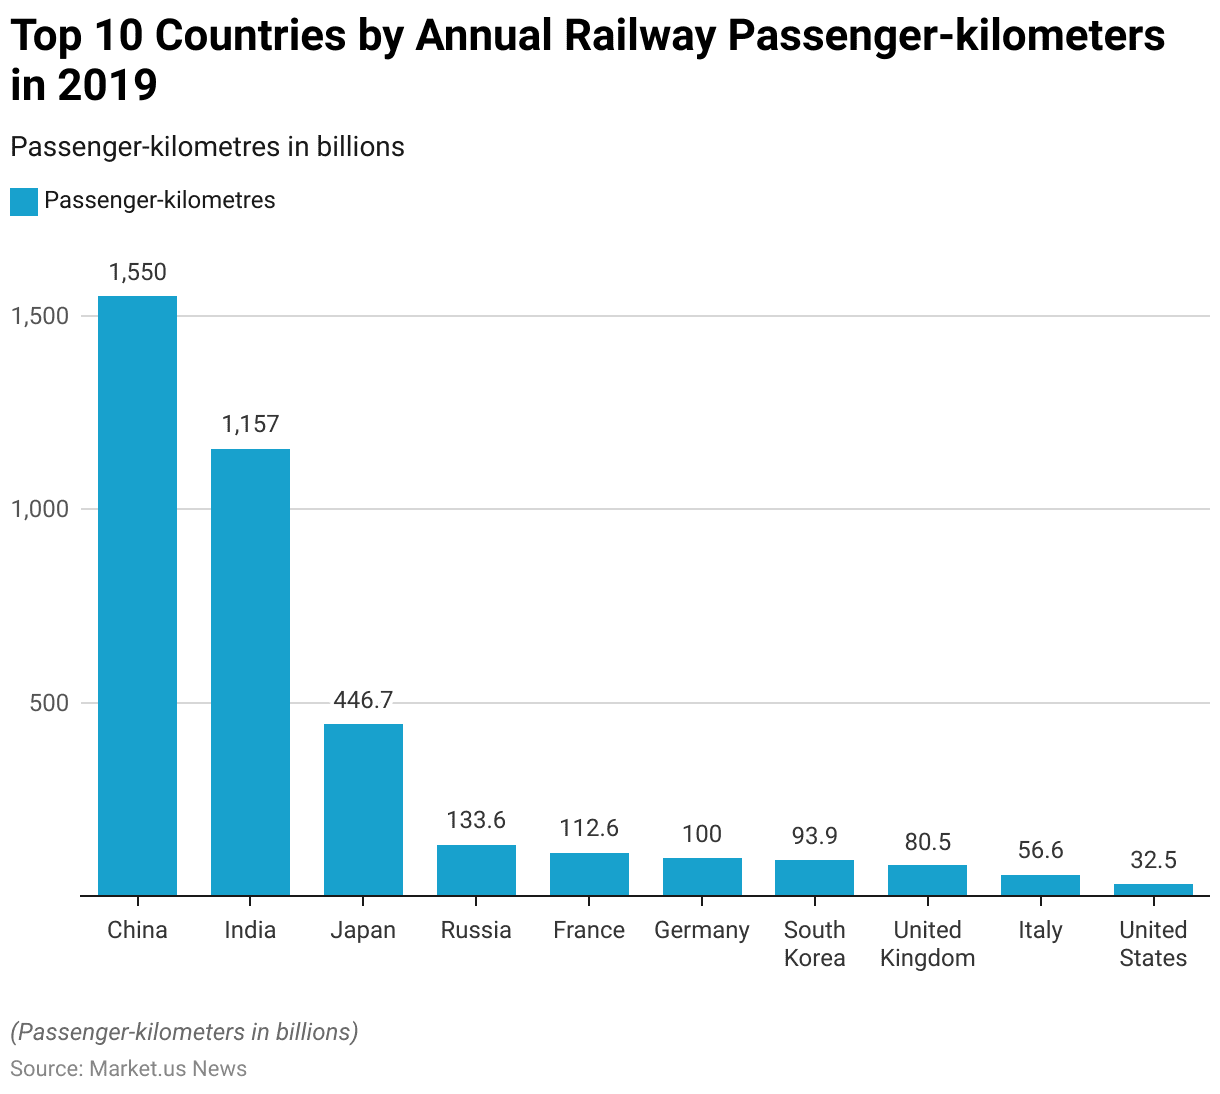
- The top ten countries by annual railway passenger kilometers highlight significant usage of rail transport across various regions.
- China leads the ranking with an impressive 1,550 billion passenger kilometers recorded in 2019, followed by India, which reported 1,157 billion passenger kilometers in the same year.
- Japan stands third with 446.7 billion passenger kilometers, also from 2019.
- Russia follows with 133.6 billion passenger kilometers, while France reported 112.6 billion passenger kilometers, both in 2019.
- Germany ranked sixth with 100 billion passenger-kilometers in 2019, and South Korea is seventh with 93.9 billion passenger kilometers.
- The United Kingdom recorded 80.5 billion passenger-kilometers in 2018, placing it eighth.
- Italy is ninth with 56.6 billion passenger kilometers, and the United States rounds out the top ten with 32.5 billion passenger kilometers, both from 2019.
- These figures underscore the extensive use of rail transport in these countries, reflecting their reliance on railways for passenger mobility.
(Source: International Union of Railways)
Share of Global Passenger Train Usage – By Region Statistics
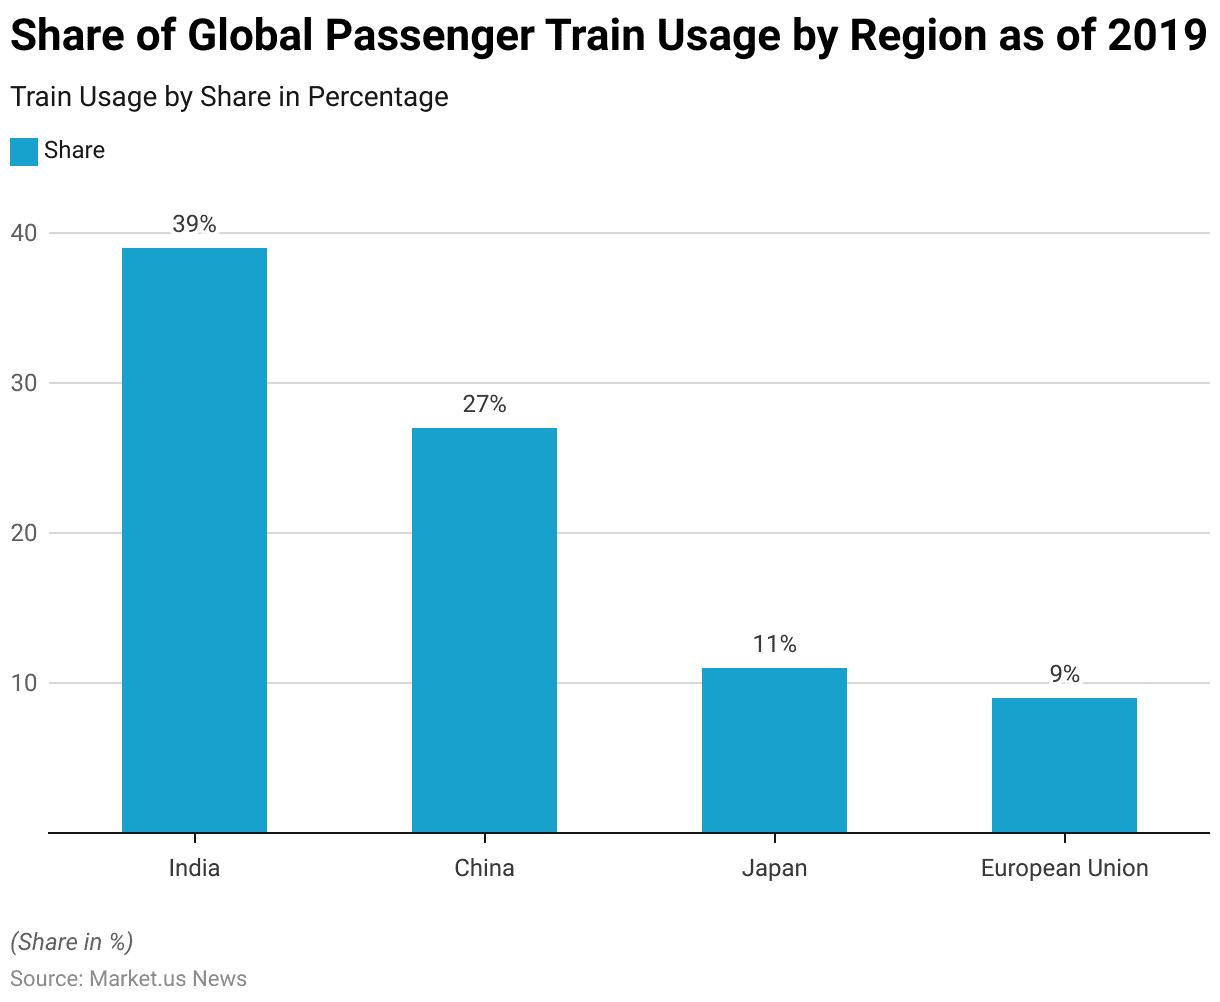
- As of 2019, global passenger train usage was dominated by a few key regions. India held the largest share, accounting for 39% of the global passenger train usage.
- China followed with a significant 27% share.
- Japan contributed 11% to the global usage, while the European Union collectively accounted for 9%.
- This distribution highlights the heavy reliance on passenger trains in these regions, particularly in India and China. Where extensive railway networks and high population densities drive substantial rail travel demand.
(Source: Statista)
Busiest Train Stations Around the World Statistics
- Shinjuku Station in Tokyo, Japan, stands as the world’s busiest train station, with over 3.6 million passengers passing through daily.
- Established in 1885, it features 36 platforms and over 200 exits. Serving as a central hub for Tokyo’s special wards and western suburbs.
- In Australia, Flinders Street Station in Melbourne handles approximately 92,000 passengers daily and holds historical significance as the first railway station in an Australian city, completed in 1909.
- Hamburg Hauptbahnhof in Germany serves around 480,000 passengers daily and ranks as Europe’s third busiest station, pivotal for both local transit and long-distance connections.
- London Waterloo, the largest station in Britain by floor area, accommodates over 210 million passengers annually, including its interconnected tube station.
- Grand Central Terminal in New York City, is known for its iconic architecture. Sees about 750,000 passengers daily and serves Metro-North Railroad and subway connections.
- Howrah Junction in Kolkata, India, the country’s largest railway station, handles about 700,000 passengers daily across its 23 platforms.
- Gare du Nord in Paris, France, tops Europe in annual passenger traffic with approximately 214 million passengers, offering extensive domestic and international rail services.
(Source: World Atlas)
Largest Railway Networks in the World
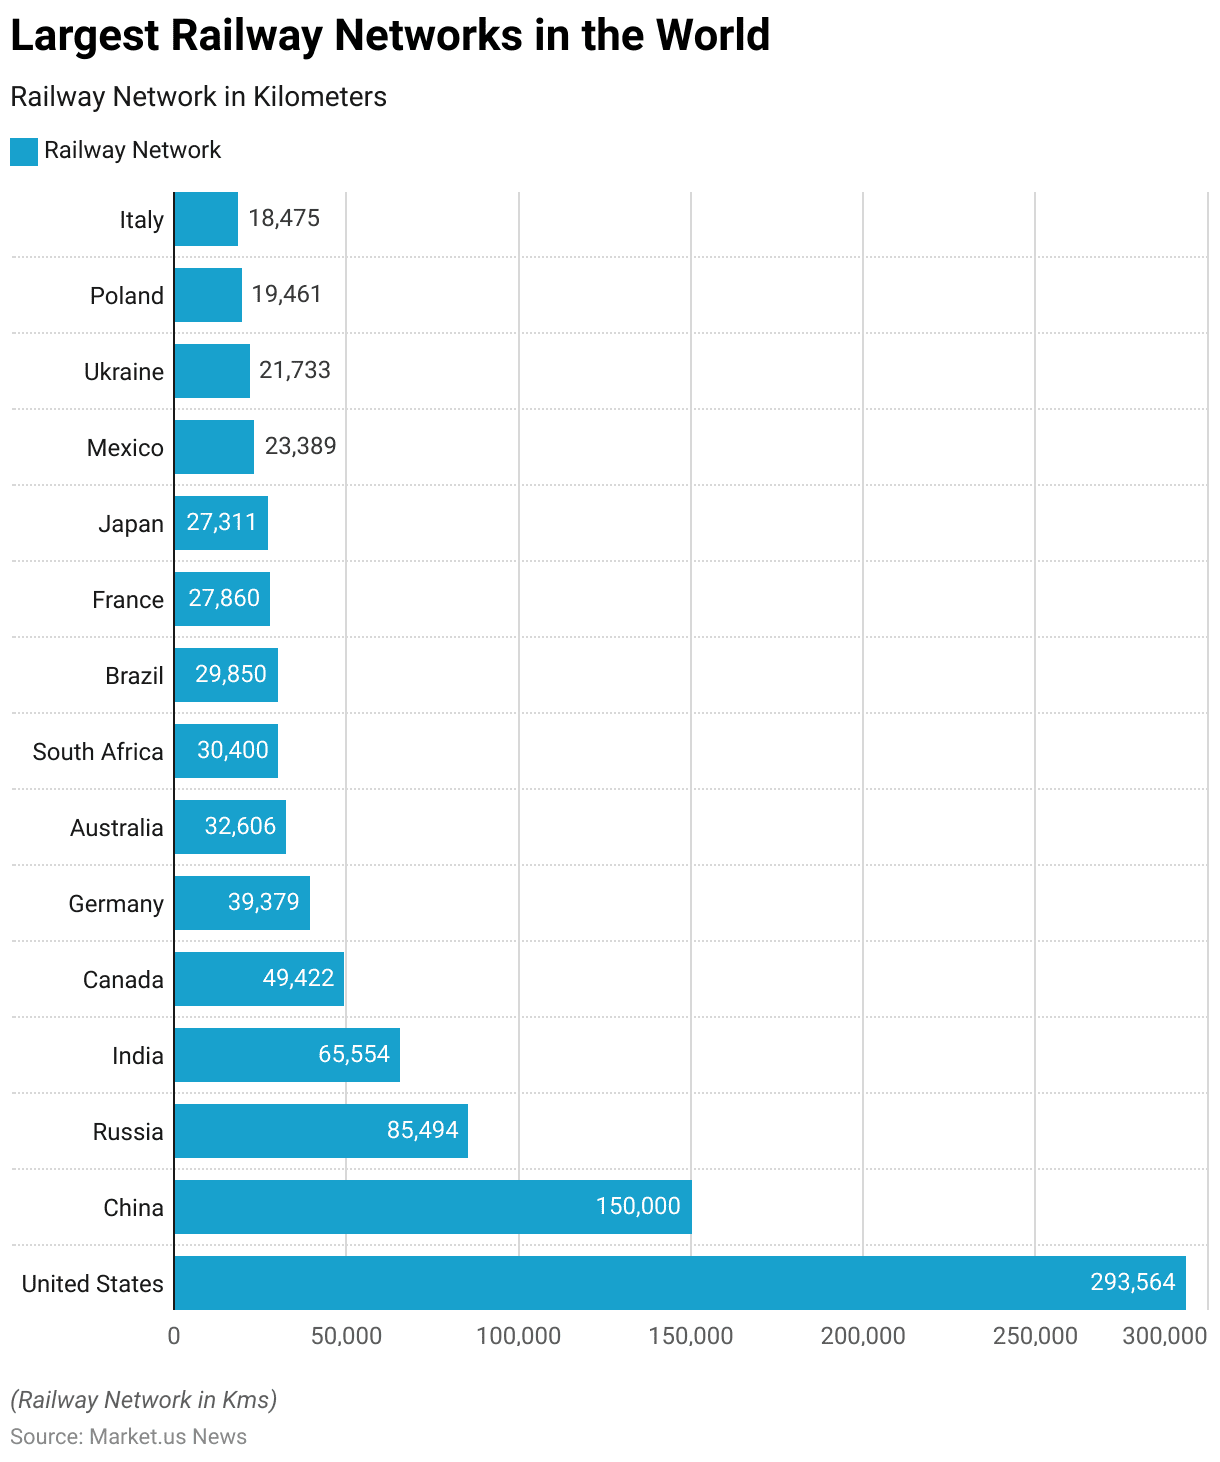
- The largest railway networks in the world, measured in kilometers, span across several countries with extensive rail infrastructures.
- As of 2014, the United States boasts the most extensive network, covering 293,564.2 kilometers.
- China follows with 150,000 kilometers as of 2021, and Russia ranks third with 85,494 kilometers reported in 2019.
- India’s railway network, as of 2014, extends 65,554 kilometers.
- Canada has a network of 49,422 kilometers as of 2021, while Germany’s network reached 39,379 kilometers in 2020.
- Australia, with data from 2022, has 32,606 kilometers, and South Africa reported 30,400 kilometers in 2021.
- Brazil’s railway network, as of 2014, measures 29,849.9 kilometers, followed by France, with 27,860 kilometers in 2020.
- Japan’s network was 27,311 kilometers as of 2015.
- Mexico reported a railway network of 23,389 kilometers in 2017, Ukraine had 21,733 kilometers as of 2014, Poland’s network reached 19,461 kilometers in 2020, and Italy reported 18,475 kilometers in the same year.
- These figures reflect the extensive and vital role of railways in the transportation infrastructure of these countries.
(Source: Central Intelligence Agency (CIA))
Comparison of Train Network Statistics Across Selected Countries/Territories Statistics
- The railway networks of various countries exhibit notable differences in terms of length, electrification, and ownership structure.
- The United States has a vast railway network extending 220,480 kilometers, with only 0.92% electrified and primarily under private ownership. The density is 43.2 km² per route km, and it has a historical peak length of 408,833 kilometers.
- In contrast, China’s network spans 150,000 kilometers, with a significant 66.67% electrified, and is entirely nationalized. Russia’s 105,000-kilometer network is 51.48% electrified, also under nationalized management, and has a peak length of 150,000 kilometers.
- India’s railways measure 92,952 kilometers, with a high electrification rate of 90.52%, and are nationalized. The network density is 35.37 km² per route km, serving a high population density of 15,290 people per route km.
- Canada has a 49,422-kilometer network, largely privately owned, with minimal electrification (0.20%) and a low population density per route km. Germany’s 40,625-kilometer network is 55.38% electrified and nationalized and has a peak of 64,000 kilometers.
- Argentina’s mixed-ownership network spans 36,966 kilometers, with 0.51% electrified and significant past expansion to 47,000 kilometers. Australia’s mixed-ownership network of 33,168 kilometers is 10.23% electrified.
- Brazil’s mixed network is 29,817 kilometers long, with 30.27% electrified and a high area density per route km.
- France’s nationalized railway covers 29,273 kilometers, 53.59% of which is electrified, and it has a peak length of 42,500 kilometers. These figures illustrate the diversity in railway infrastructure and management across different countries.
(Source: Testbook)
The World’s Longest Train Journeys Statistics
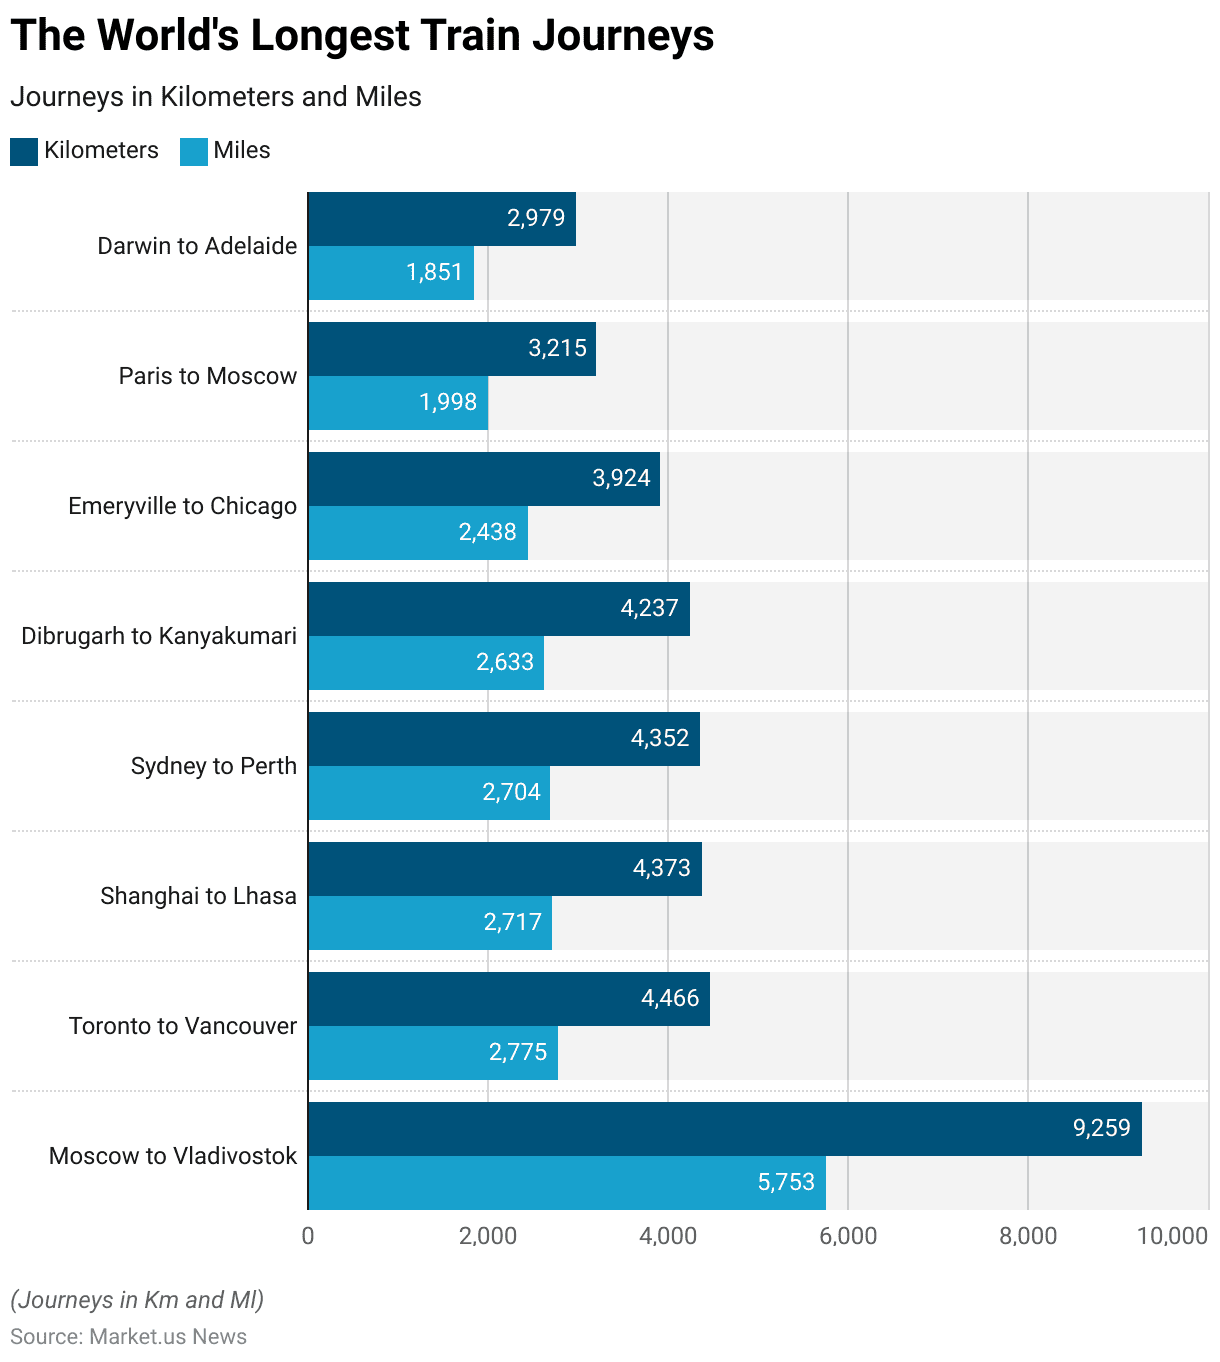
- The world’s longest train journeys offer some of the most extensive and scenic rail experiences across various continents.
- The longest route is from Moscow to Vladivostok, spanning an impressive 9,259 kilometers (5,753 miles).
- Following this, the journey from Toronto to Vancouver covers 4,466 kilometers (2,775 miles), while the Shanghai to Lhasa route extends 4,373 kilometers (2,717 miles).
- The route from Sydney to Perth measures 4,352 kilometers (2,704 miles), and the journey from Dibrugarh to Kanyakumari in India stretches 4,237 kilometers (2,633 miles).
- In North America, the Emeryville to Chicago route covers 3,924 kilometers (2,438 miles).
- In Europe, the Paris to Moscow journey spans 3,215 kilometers (1,998 miles), and in Australia, the Darwin to Adelaide route measures 2,979 kilometers (1,851 miles).
- These routes not only highlight the extensive railway networks but also offer unique travel experiences through diverse landscapes.
(Source: Daily Telegraph)
Train Ticket Price Statistics and Trends, Statistics
Average Passenger Fares in Commuter Train Statistics
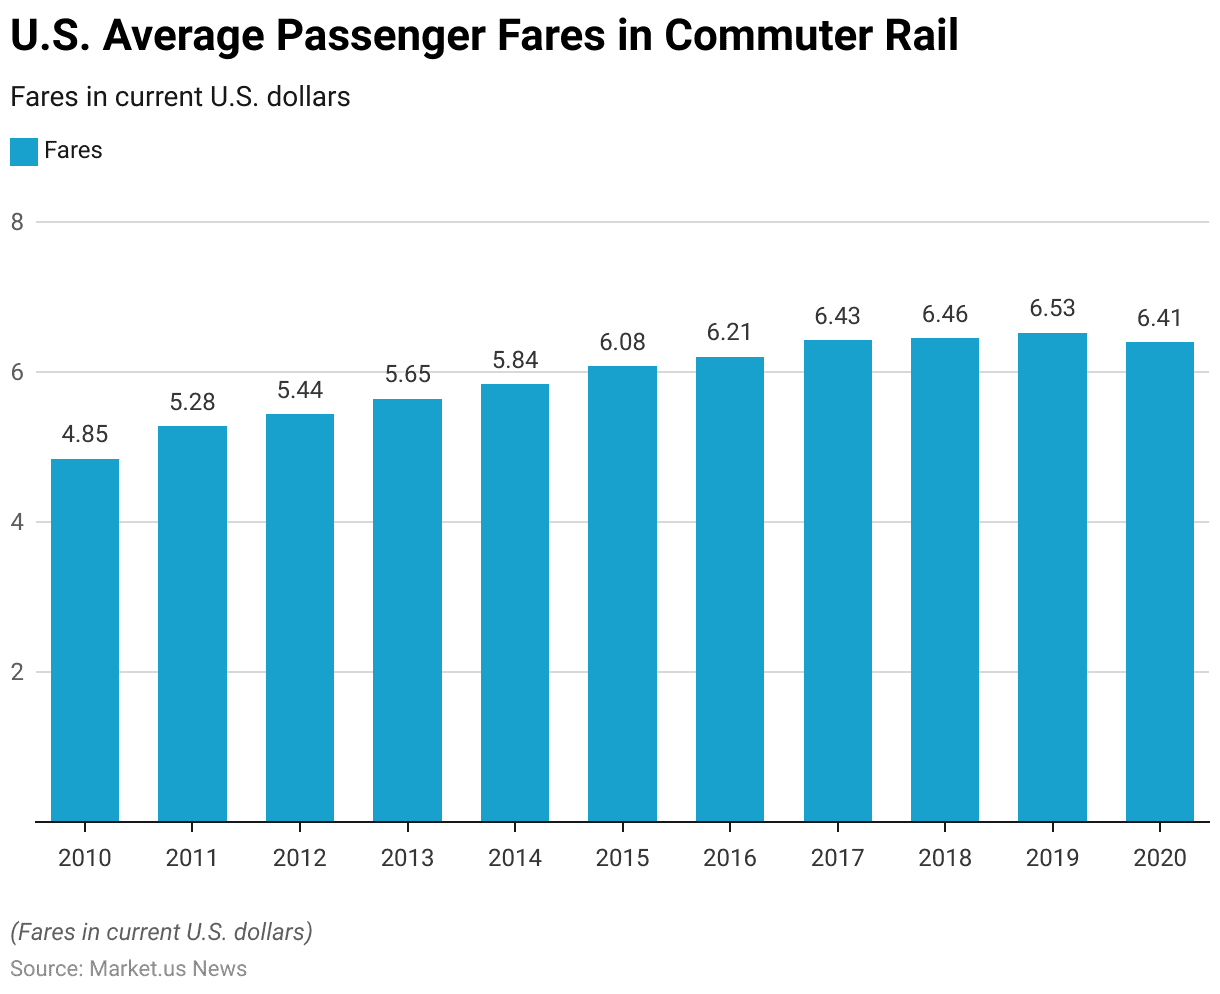
- The average passenger fares for commuter rail in the United States have shown a general upward trend from 2010 to 2020 when measured in current U.S. dollars.
- In 2010, the average fare was $4.85, which increased to $5.28 in 2011 and $5.44 in 2012.
- This upward trajectory continued, with fares reaching $5.65 in 2013 and $5.84 in 2014.
- By 2015, the average fare rose to $6.08, followed by $6.21 in 2016.
- The fare increased further to $6.43 in 2017 and slightly to $6.46 in 2018.
- In 2019, the average fare was $6.53.
- However, in 2020, there was a slight decrease, with the fare averaging $6.41.
- This data highlights the overall increase in commuter rail fares over the decade, with a minor decline in the last recorded year.
(Source: Statista)
Train Revenue Generated from Ordinary and Season Ticket Passenger Fares Statistics
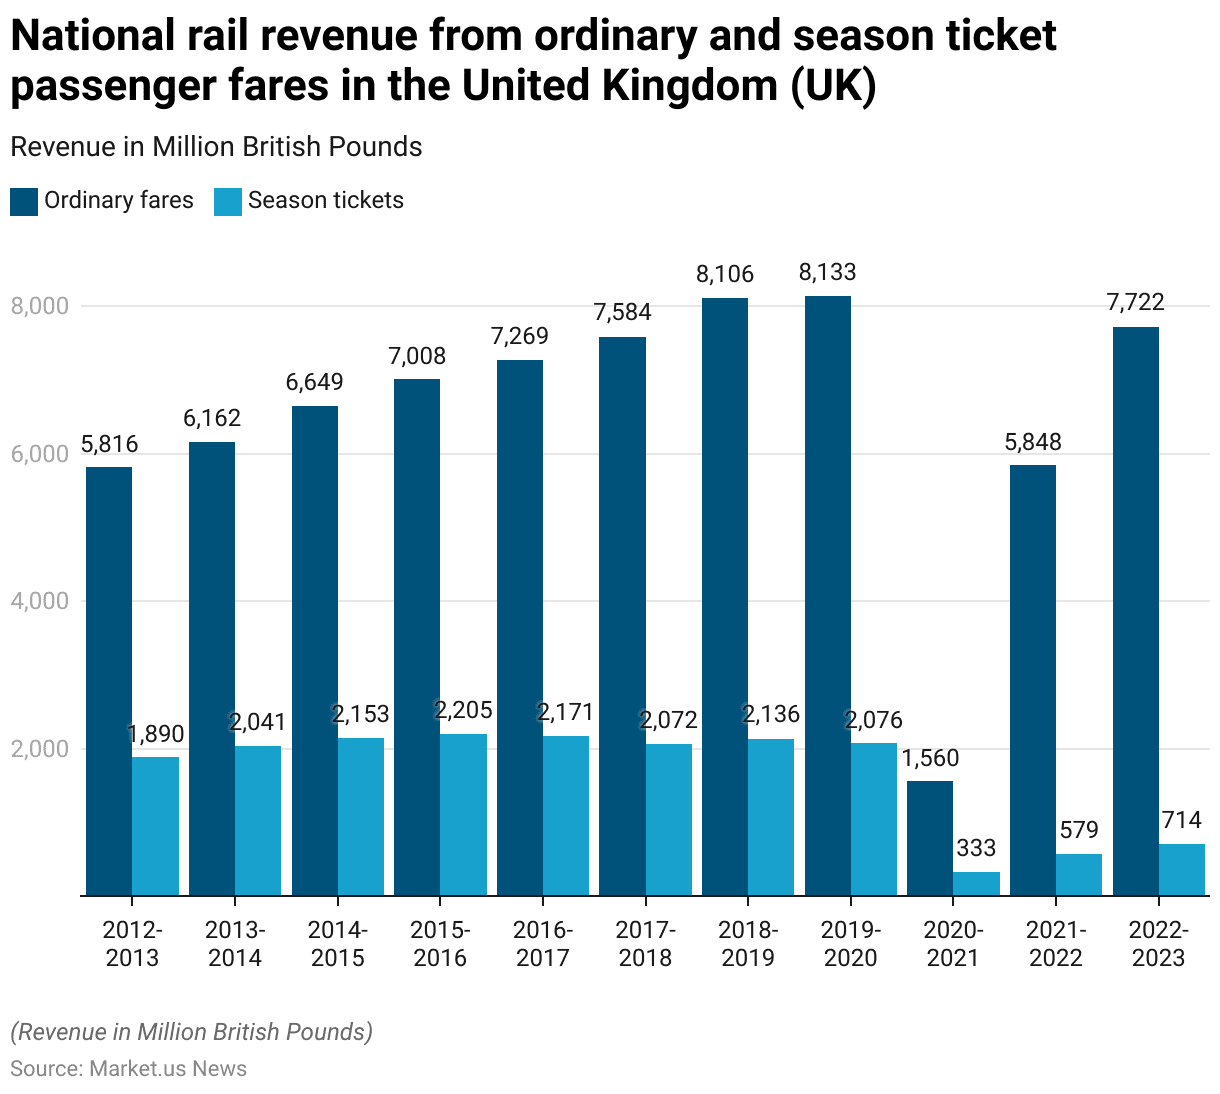
- The national rail revenue from ordinary and season ticket passenger fares in the United Kingdom (UK) has experienced fluctuations over the past decade.
- Between 2012-2013 and 2019-2020, ordinary fare revenue steadily increased from £5,816 million to £8,133 million, while season ticket revenue grew from £1,890 million to £2,076 million.
- The peak for ordinary fares was observed in 2019-2020, and for season tickets in 2015-2016, it was £2,205 million.
- However, the COVID-19 pandemic had a significant impact in 2020-2021, causing ordinary fare revenue to plummet to £1,560 million and season ticket revenue to £333 million.
- The following years saw a recovery, with 2021-2022 recording £5,848 million in ordinary fares and £579 million in season tickets, and 2022-2023 further increasing to £7,722 million and £714 million, respectively.
- This trend highlights both the resilience of the UK rail industry and the significant impact of external factors on passenger fare revenues.
(Source: Statista)
Rise in Train Ticket Prices Statistics
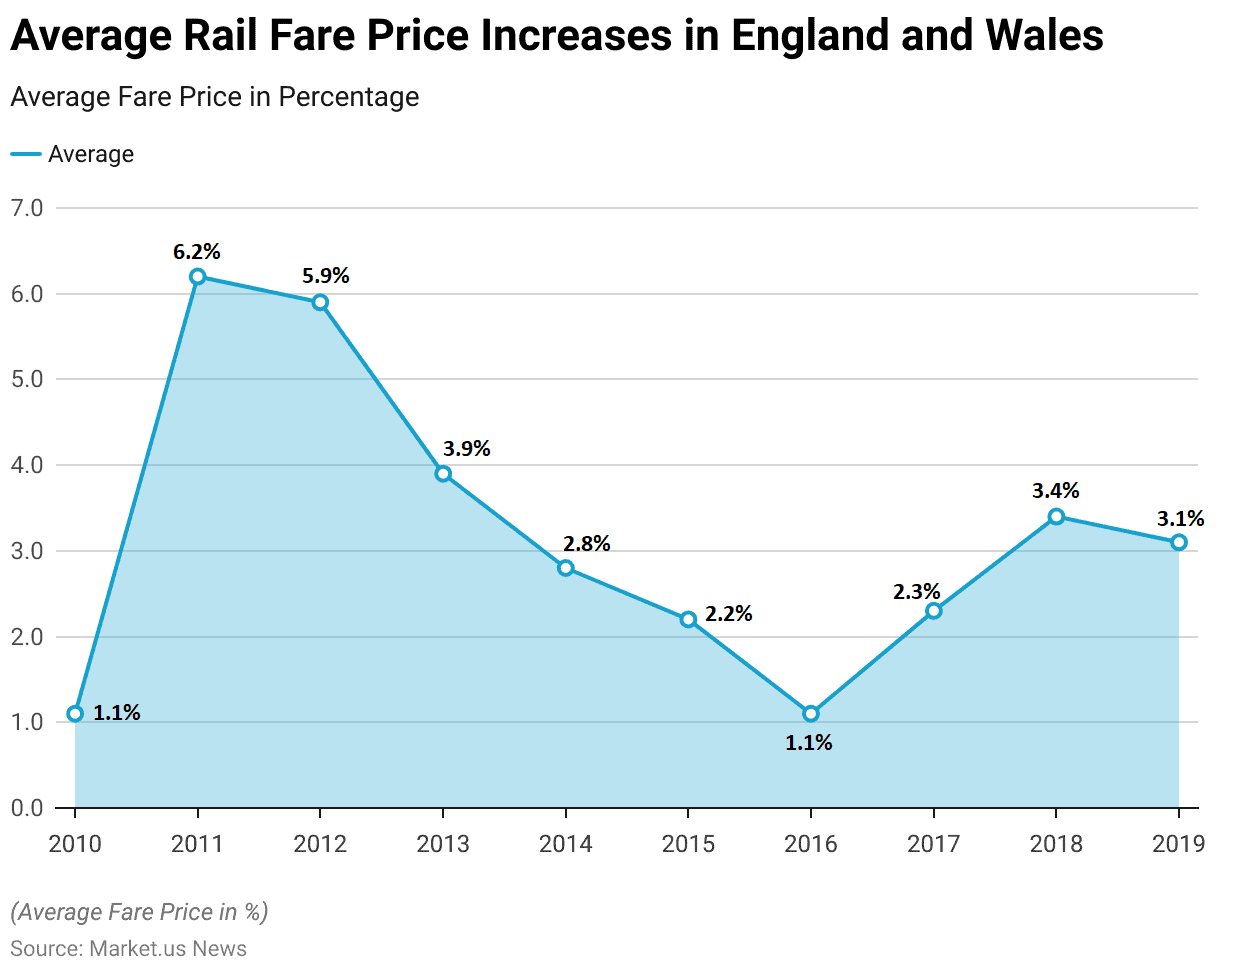
- The average rail fare price increases in England and Wales from 2010 to 2019 show a variable pattern of fare adjustments.
- In 2010, the increase was relatively modest at 1.1%, followed by a significant hike of 6.2% in 2011 and 5.9% in 2012.
- The fare increase moderated to 3.9% in 2013 and further to 2.8% in 2014.
- In 2015, the increase was 2.2%, while 2016 saw the lowest rise of the decade at 1.1%.
- A slight uptick occurred in 2017 with a 2.3% increase, followed by a higher increase of 3.4% in 2018.
- The decade closed with a 3.1% increase in 2019.
- These fluctuations reflect the varying economic and regulatory factors influencing rail fare adjustments over the period.
(Source: Rail Delivery Group)
Surface and Underground Train Construction Revenue Statistics
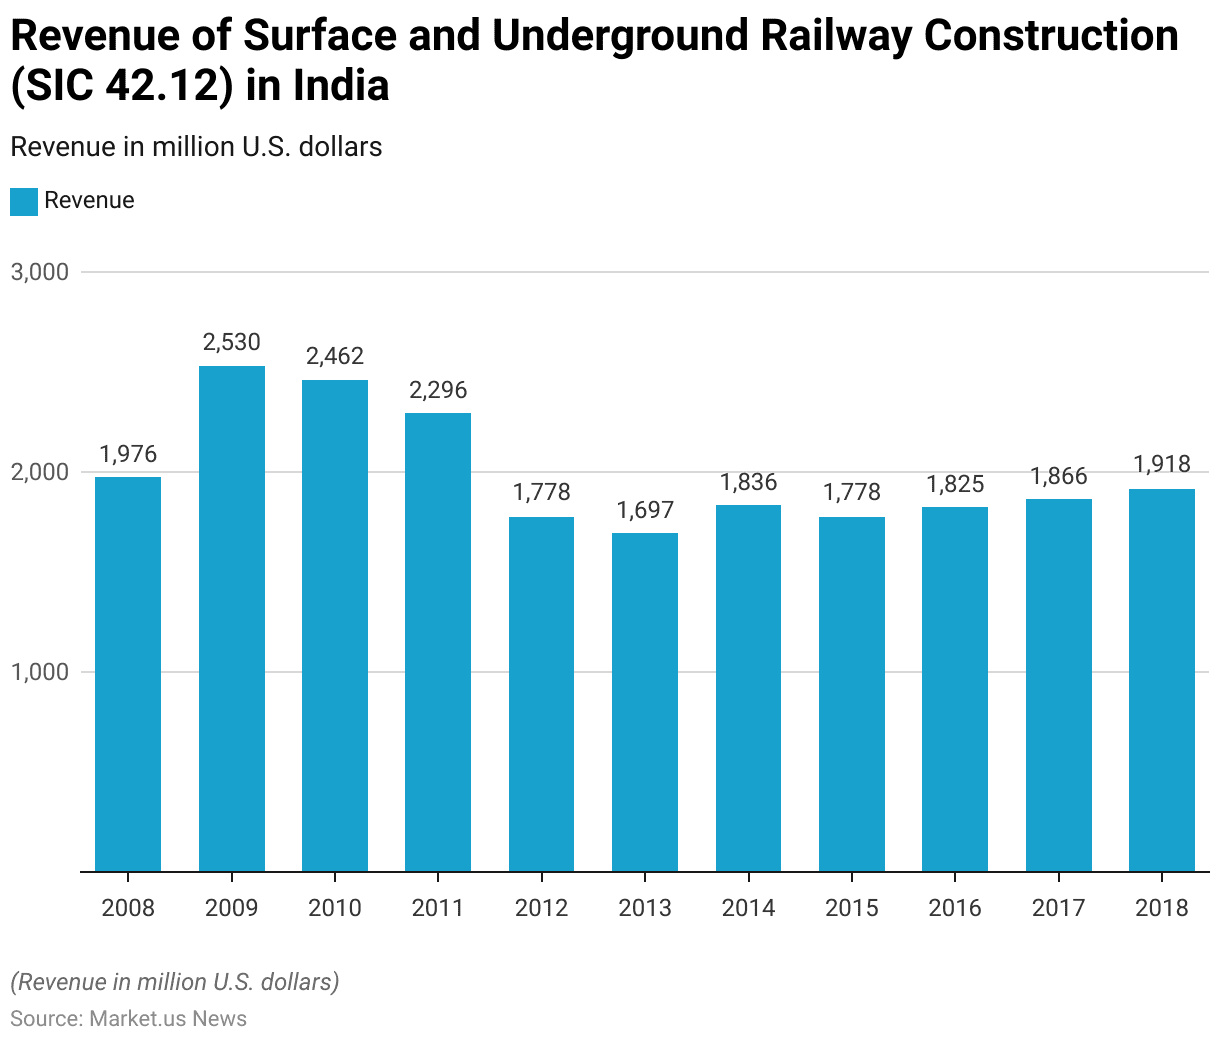
- The revenue of surface and underground railway construction (SIC 42.12) in India has shown notable fluctuations from 2008 to 2018.
- In 2008, the sector generated $1,976 million, which increased to $2,530 million in 2009, marking the highest revenue within the observed period.
- However, this was followed by a slight decline to $2,462 million in 2010 and a further decrease to $2,296 million in 2011.
- The revenue saw a significant drop in 2012 to $1,778 million and continued to decline to $1,697 million in 2013.
- A gradual recovery began in 2014 with $1,836 million and stabilized at $1,778 million in 2015.
- The upward trend continued with revenues of $1,825 million in 2016, $1,866 million in 2017, and $1,918 million in 2018.
- These figures illustrate the sector’s resilience and gradual recovery following the initial volatility.
(Source: Statista)
Demographics of Train, Railway Passengers Statistics
According to Age & Gender
- In England in 2015, the average number of rail trips taken annually was higher among males at 22 trips compared to females who averaged 18 trips.
- Rail usage showed significant variation across age groups, with individuals aged 21-29 making the highest average of 41 trips per year, contrasting sharply with those over 70 years old, who averaged only six trips annually.
- Among females aged 21-29, the average number of rail trips was notably higher at 43 per year, marking the highest average among all age and gender groups.
- Conversely, females aged 70 and older made the fewest rail trips annually, averaging just five trips each.
(Source: Government of U.K – Department of Transport)
According to Income & Occupation
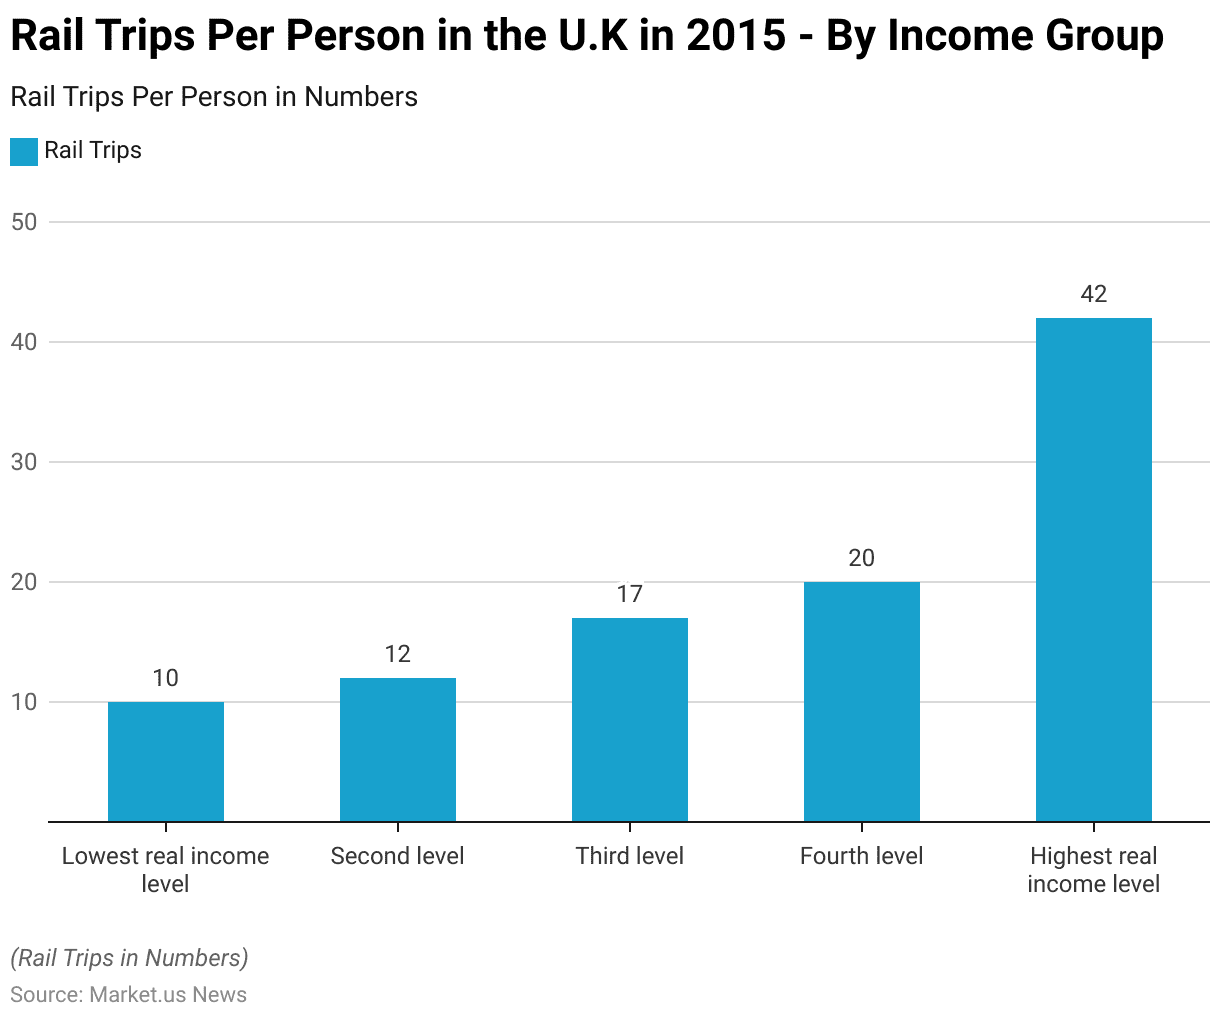
- In 2015, the frequency of rail trips per person in the U.K. varied significantly across different income levels.
- Individuals in the lowest real income level made an average of 10 rail trips per person, while those in the second income level averaged 12 trips.
- The third income level saw an increase to 17 trips per person, and the fourth level further rose to 20 trips.
- Notably, individuals in the highest real income level made significantly more rail trips, averaging 42 per person.
- This data underscores a clear correlation between higher income levels and increased rail travel frequency in the U.K.
(Source: Government of U.K – Department of Transport)
Consumer Preferences & Trends
Key Drivers
Europe
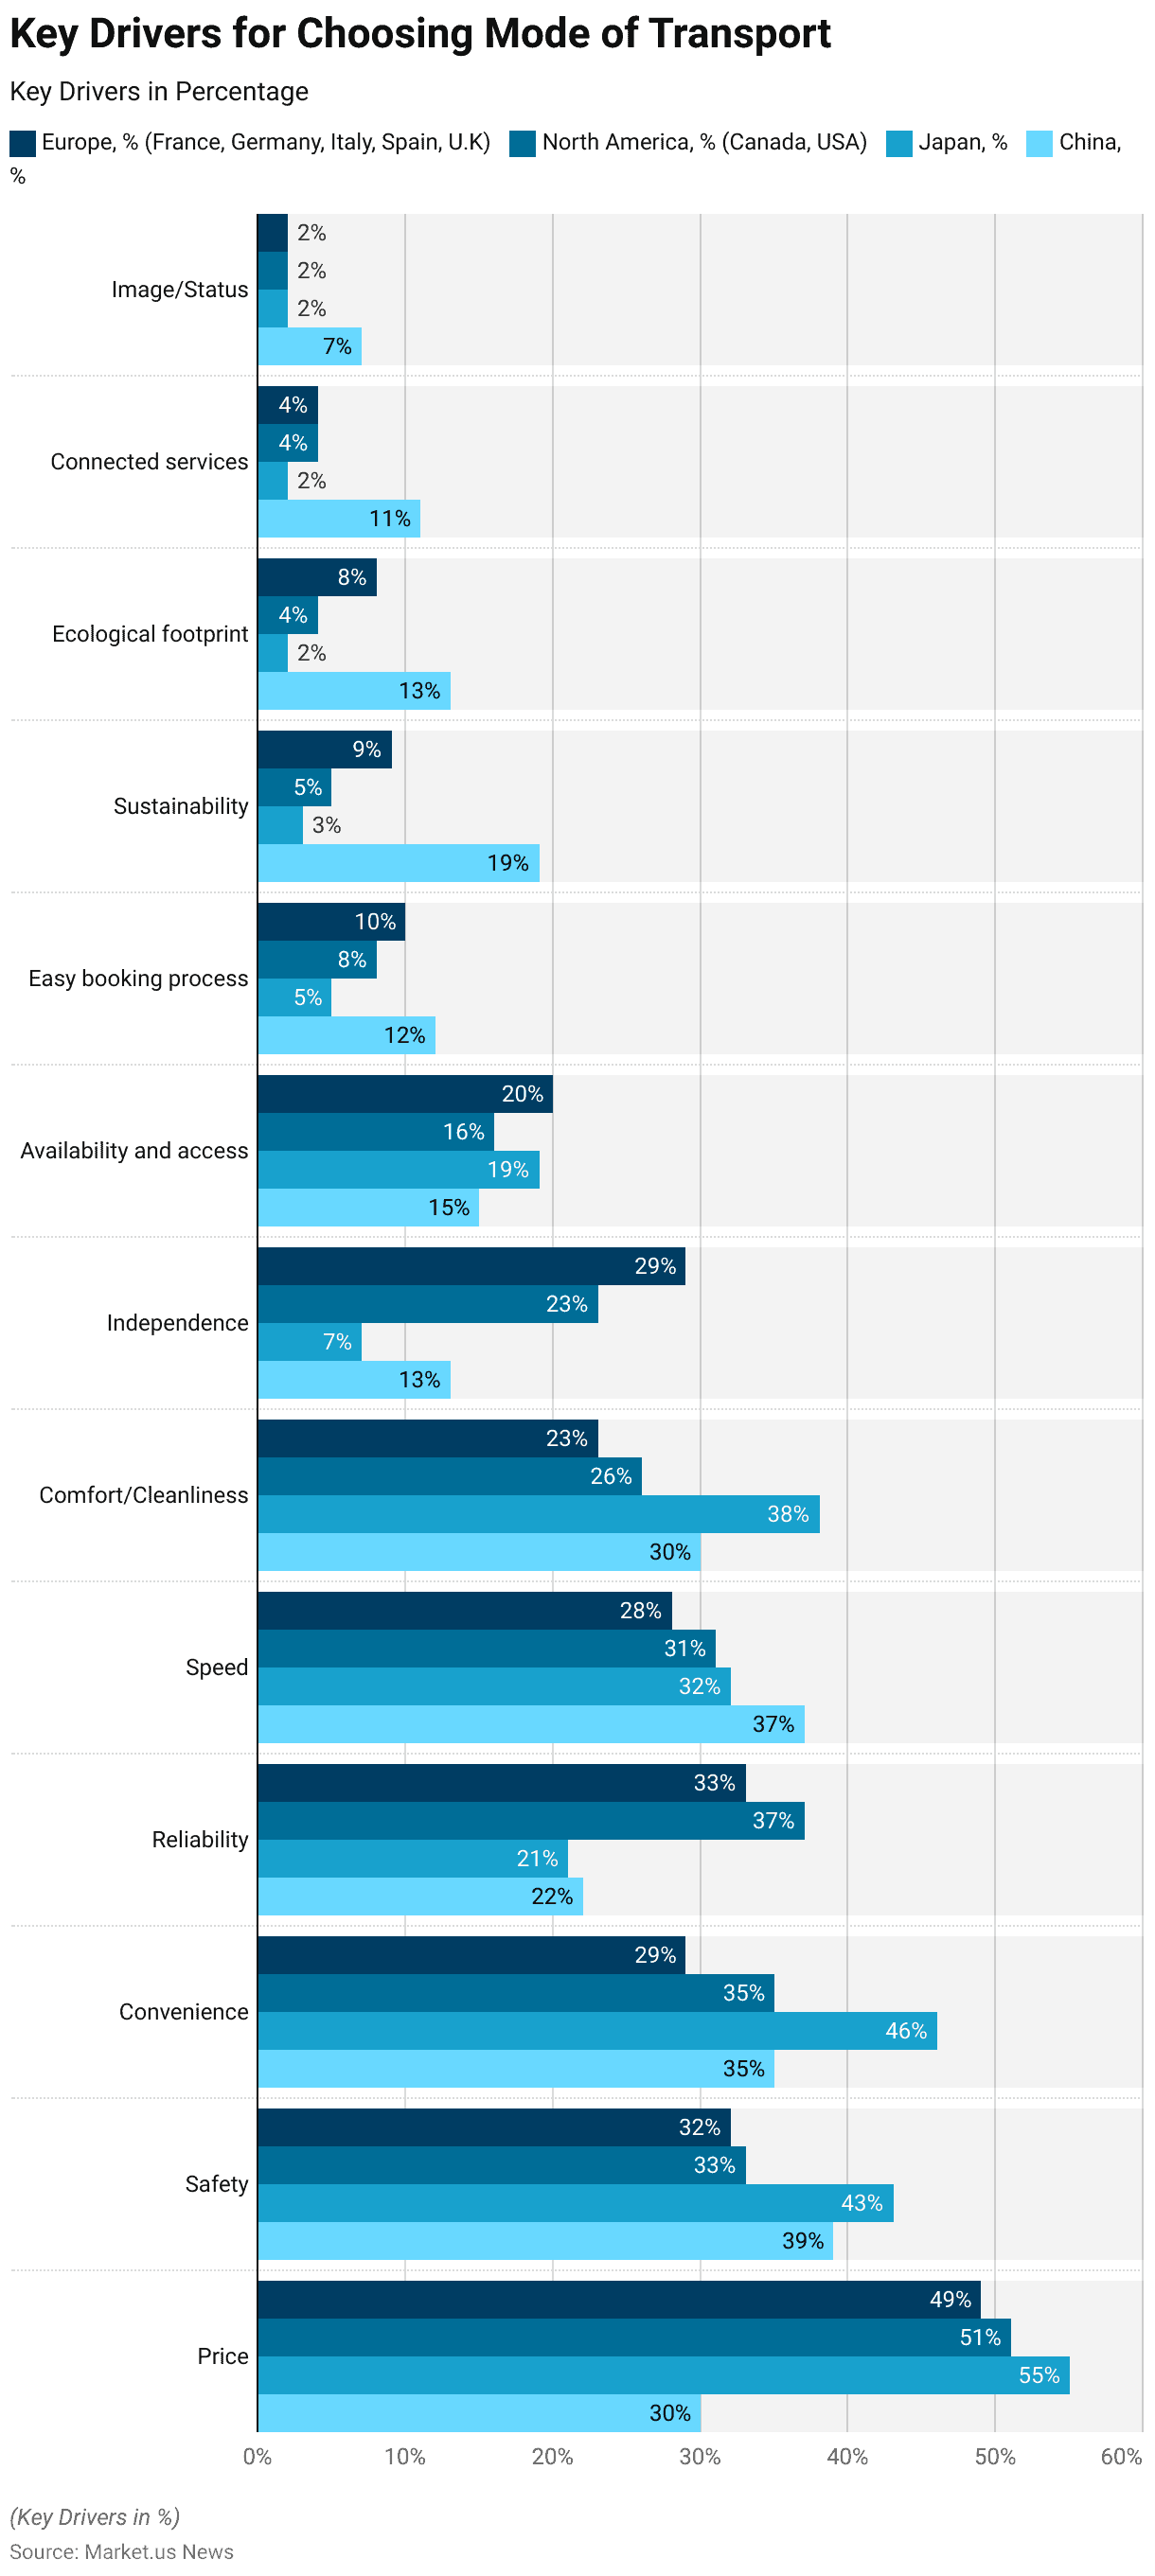
- The decision criteria for choosing a mode of transport vary across different regions, with notable differences in priorities.
- In Europe (France, Germany, Italy, Spain, and the U.K.), the primary driver is price, influencing 49% of decisions, followed by safety (32%), reliability (33%), and convenience (29%).
- Speed and independence are also significant factors, with 28% and 29% respectively, while comfort and cleanliness influence 23% of choices.
- Availability and access, easy booking process, sustainability, ecological footprint, connected services, and image/status play lesser roles, ranging from 20% to 2%.
North America
- In North America (Canada and the USA), price is also the leading factor, affecting 51% of decisions, followed by reliability (37%), safety (33%), and convenience (35%).
- Speed and comfort/cleanliness are important for 31% and 26%, respectively.
- Independence influences 23%, while availability and access affect 16% of decisions.
- Other factors, such as easy booking process, sustainability, ecological footprint, connected services, and image/status, range from 8% to 2%.
Japan
- In Japan, price is the most significant factor, with 55% of decisions influenced by it.
- Safety (43%), convenience (46%), and comfort/cleanliness (38%) are also crucial.
- Speed affects 32% of decisions, while reliability influences 21%.
- Availability and access, independence, easy booking process, sustainability, ecological footprint, connected services, and image/status are less significant, ranging from 19% to 2%.
China
- In China, the primary factors are price (30%), speed (37%), and safety (39%). Convenience and comfort/cleanliness each influence 35% and 30%, respectively.
- Reliability impacts 22% of decisions, while independence, availability and access, easy booking process, sustainability, ecological footprint, connected services, and image/status range from 19% to 7%.
- These variations highlight the diverse priorities of travelers in different regions when choosing their mode of transport.
(Source: Mckinsey)
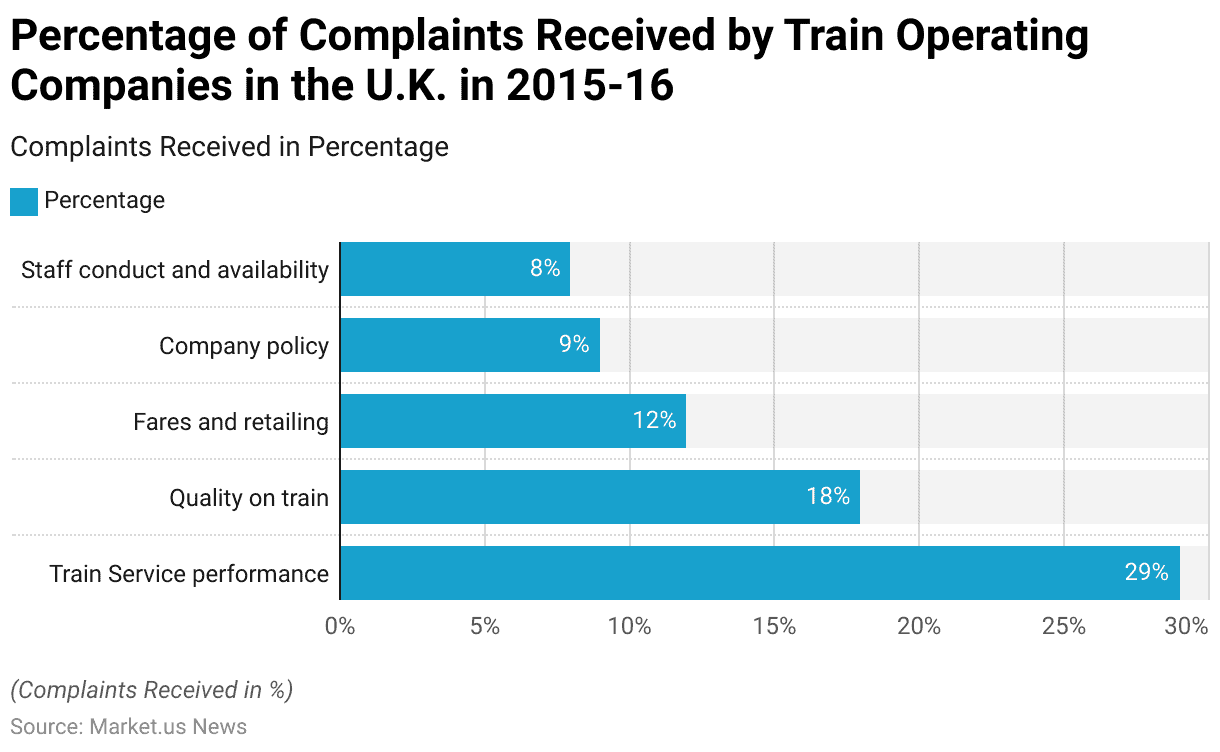
Complaints
- In the U.K., during the 2015-16 period, train operating companies received a variety of complaints categorized into several key areas.
- The most significant category was train service performance, which accounted for 29% of all complaints.
- This was followed by complaints regarding the quality of trains, comprising 18% of the total.
- Issues related to fares and retailing made up 12% of the complaints, while company policy was the focus of 9%.
- Complaints about staff conduct and availability represented 8% of the total.
- These figures indicate the primary areas of concern for passengers using train services in the U.K. during that period.
(Source: Government of U.K – Department of Transport)
Impact of COVID-19
- Indian Railways has experienced a notable increase in the number of daily operational trains compared to the pre-Covid period.
- Currently, 10,748 trains run daily, up from 10,186 before the pandemic.
- The rise is most pronounced in mail and express trains, which have increased to 2,122 from 1,768.
- Suburban trains, crucial for connecting suburbs to cities, have also seen an increase from 5,626 to 5,774.
- Additionally, recognizing the need for more urban transit options, the Railways has expanded the number of trains for daily commuters to 2,852, compared to 2,792 before COVID-19.
- Railway officials have indicated plans to expand services across all train categories further to accommodate the growing number of passengers.
(Source: Financial Express)
Investments in Railway Development by Governments and Private Organizations
- Governments and private organizations globally have been making substantial investments in railway development, aiming to enhance infrastructure and connectivity.
- In the United States, BNSF Railway announced a capital investment plan of nearly $4 billion for 2023, focusing on infrastructure improvements and technological advancements to ensure a reliable and efficient rail network.
- In China, the Belt and Road Initiative continues to drive significant investments, with China expanding its railway network to 150,000 km. With substantial projects across Asia and Africa.
- The Philippines, under its “Build, Build, Build” program, has allocated $158 billion for infrastructure projects, including the North-South Commuter Railway, to bolster its transport system by 2024.
- Indonesia aims to extend its national railway network to 10,524 km by 2030, supported by a mix of state funding and private sector investments totaling IDR 835 trillion.
- In the Indo-Pacific region, the U.S. International Development Finance Corporation (DFC) and the Government of India are collaborating on a $1 billion investment in the India Green Transition Fund, focusing on sustainable and clean-energy projects.
- These efforts reflect a global trend of integrating modern technology and sustainability into railway development to meet increasing demand and improve service quality.
- These initiatives highlight the dynamic and collaborative approach between public and private sectors to enhance railway infrastructure, promoting economic growth and environmental sustainability across different regions.
(Sources: BNSF Railway, 2023 Capital Investment Plan, Southeast Asia Infrastructure, Rail Development in ASEAN, Green Finance & Development Center, Belt and Road Initiative Investment Report 2023 H1)
Regulations for Trains / Railways Statistics
- Railway regulations worldwide are increasingly focused on enhancing safety, efficiency, and sustainability.
- In the United States, the Railway Safety Act of 2023 mandates stricter safety measures for trains carrying hazardous materials. Such as advanced tank car standards and improved defect detectors.
- The Federal Railroad Administration (FRA) also allocated $8.2 billion for passenger rail projects and initiated comprehensive safety inspections, resulting in corrective actions by rail operators to mitigate risks.
- In the UK, the Strikes (Minimum Service Levels: Passenger Railway Services) Regulations 2023 ensure that essential rail services are maintained during strikes. This regulation requires rail companies to provide a minimum level of service to avoid severe disruptions.
- Japan has stringent safety and operational standards, focusing on high-speed rail network efficiency and disaster resilience. New cybersecurity regulations mandate robust protection against cyber threats, reflecting the increasing importance of digital security in rail operations.
- China‘s railway development is guided by the Belt and Road Initiative, promoting extensive network expansion and modernized safety protocols. The focus is on integrating sustainable practices and advanced technology to support its growing rail infrastructure.
- These regulatory frameworks, alongside substantial investments in technology and infrastructure, underscore the global commitment to improving railway systems for enhanced safety, efficiency, and sustainability.
(Source: U.S. Congress, U.S. Department of Transportation, Government of U.K, Railway Age, Green Finance & Development Center)
Recent Developments
Acquisitions and Mergers:
- Alstom acquires Bombardier Transportation: In early 2023, Alstom completed its $6.2 billion acquisition of Bombardier Transportation. This merger aims to enhance Alstom’s position in the global rail market by expanding its product portfolio and increasing its market share in North America and Europe.
- Siemens acquires Sqills: Siemens acquired Sqills, a software provider for rail and bus operators, for $650 million in mid-2023. This acquisition will help Siemens improve its digital offerings and provide better reservation and inventory management systems for train operators.
New Product Launches:
- Hitachi’s Masaccio Train: In late 2023, Hitachi Rail launched the Masaccio train, designed for high-speed rail networks. The train features advanced aerodynamics, enhanced passenger comfort, and energy-efficient technologies.
- Siemens Mireo Plus H: Siemens introduced the Mireo Plus H hydrogen-powered train in early 2024. This environmentally friendly train aims to reduce carbon emissions and is part of Siemens’ efforts to promote sustainable rail transportation.
Funding:
- EU’s Green Rail Initiative: In 2023, the European Union announced a $10 billion investment in its Green Rail Initiative, aimed at modernizing rail infrastructure, promoting electrification, and enhancing the sustainability of the rail sector across member states.
- India’s National Rail Plan Funding: The Indian government allocated $30 billion in early 2024 to implement the National Rail Plan, which focuses on expanding high-speed rail networks, upgrading existing tracks, and enhancing overall rail connectivity.
Technological Advancements:
- Digital Signaling Systems: Advances in digital signaling systems, such as the European Train Control System (ETCS), are being implemented to improve train safety, increase operational efficiency, and reduce headways between trains.
- Autonomous Trains: Research and development in autonomous train technology are progressing, with trials being conducted for fully automated train operations, which aim to increase efficiency, reduce operational costs, and enhance safety.
Market Dynamics:
- Growth in High-Speed Rail Market: The global high-speed rail market is expected to grow at a CAGR of 5.8% from 2023 to 2028, driven by increasing demand for fast, efficient, and sustainable transportation options in urban and intercity travel.
- Rise in Rail Freight: Rail freight transport is seeing significant growth, particularly in regions like Asia and Europe, where rail networks are being expanded to handle increased cargo volumes and reduce reliance on road transport.
Regulatory and Strategic Developments:
- EU’s Rail Strategy for 2030: The European Union’s Rail Strategy for 2030 aims to double high-speed rail traffic and increase rail freight transport by 50%, focusing on reducing carbon emissions and enhancing rail connectivity across Europe.
- China’s Rail Network Expansion: China continues to expand its high-speed rail network, with plans to add 10,000 kilometers of new tracks by 2025, aiming to improve connectivity between major cities and promote regional development.
Research and Development:
- Maglev Technology: Research in magnetic levitation (Maglev) technology is advancing, with projects like the Shanghai Maglev Train and Japan’s Chuo Shinkansen aiming to achieve speeds of over 600 km/h, offering faster and more efficient rail travel.
- Energy-Efficient Trains: R&D efforts are focusing on developing energy-efficient trains, utilizing renewable energy sources such as hydrogen and solar power to reduce the environmental impact of rail transport.
Conclusion
Train Statistics – The global train industry is evolving with substantial investments from governments and private organizations to enhance safety, efficiency, and infrastructure.
In the U.S., the Railway Safety Act of 2023 and significant funding for rail projects underscore a strong commitment to improving rail systems.
India has increased its daily train operations from 10,186 to 10,748, reflecting the sector’s responsiveness to commuter needs.
Technological advancements, like high-speed rail and cybersecurity measures, are being integrated worldwide, with China’s Belt and Road Initiative and Europe’s standardization projects leading the way.
The focus on environmental sustainability further promotes rail transport as a greener alternative, driven by innovations in renewable energy and energy-efficient technologies.
FAQs
High-speed trains are rail vehicles that operate significantly faster than conventional trains. They typically travel at speeds of 250 km/h (155 mph) or more, relying on specialized tracks and infrastructure to support high-speed operations.
Maglev (magnetic levitation) trains use magnetic fields to propel and levitate the train above the track, eliminating the need for wheels. This technology reduces friction, allowing for faster speeds and smoother rides compared to traditional rail systems.
Positive train control is an advanced technology designed to control train movements to prevent collisions and derailments automatically. It integrates GPS, wireless communication, and trackside signaling to enhance safety and operational efficiency.
Railways prioritize safety through rigorous maintenance of tracks, signaling systems, and rolling stock. Additionally, strict operational protocols, employee training, and advanced safety technologies like PTC contribute to passenger safety.
Weather conditions such as heavy rain, snow, or extreme temperatures can affect train operations by causing delays, reducing traction, or posing safety hazards. Rail operators mitigate these impacts through weather monitoring and operational adjustments.


