Table of Contents
- Introduction
- Editor’s Choice
- Vacuum Cleaner Market Overview
- Vacuum Cleaner Volume Overview
- Global Vacuum Cleaner Price Statistics
- Statistics of Robotic Vacuum Cleaner Statistics
- Vacuum Cleaner Owners in Countries Worldwide Statistics
- Vacuum Cleaner Brand Statistics – By Country/Region
- Production Volume of Household Vacuum Cleaner Statistics
- Vacuum Cleaners Import Statistics
- Consumer Preferences and Trends
- Vacuum Cleaner Spending Statistics
- Regulations for Vacuum Cleaners
- Recent Developments
- Conclusion
- FAQs
Introduction
Vacuum Cleaner Statistics: Vacuum cleaners are essential household appliances designed to remove dirt and dust, contributing to cleaner living environments.
Key components include the motor, which creates suction, filters that trap allergens, and a dust container or bag for collecting debris.
Various types, such as upright, canister, stick, robotic, and handheld vacuums, cater to different cleaning needs.
Operating on the principles of suction and airflow, vacuums draw air and debris through filters. Expelling clean air while collecting dirt in the dust container.
Regular maintenance, including cleaning filters and emptying dust collection areas, is vital for optimal performance and longevity. Overall, vacuum technology continues to evolve, enhancing efficiency and convenience for users.
Editor’s Choice
- The global vacuum cleaner market revenue is projected to reach USD 54.12 billion by 2029.
- In 2022, the global vacuum cleaner market was dominated by a few key players. With Eureka leading at 30%, alongside a variety of smaller competitors.
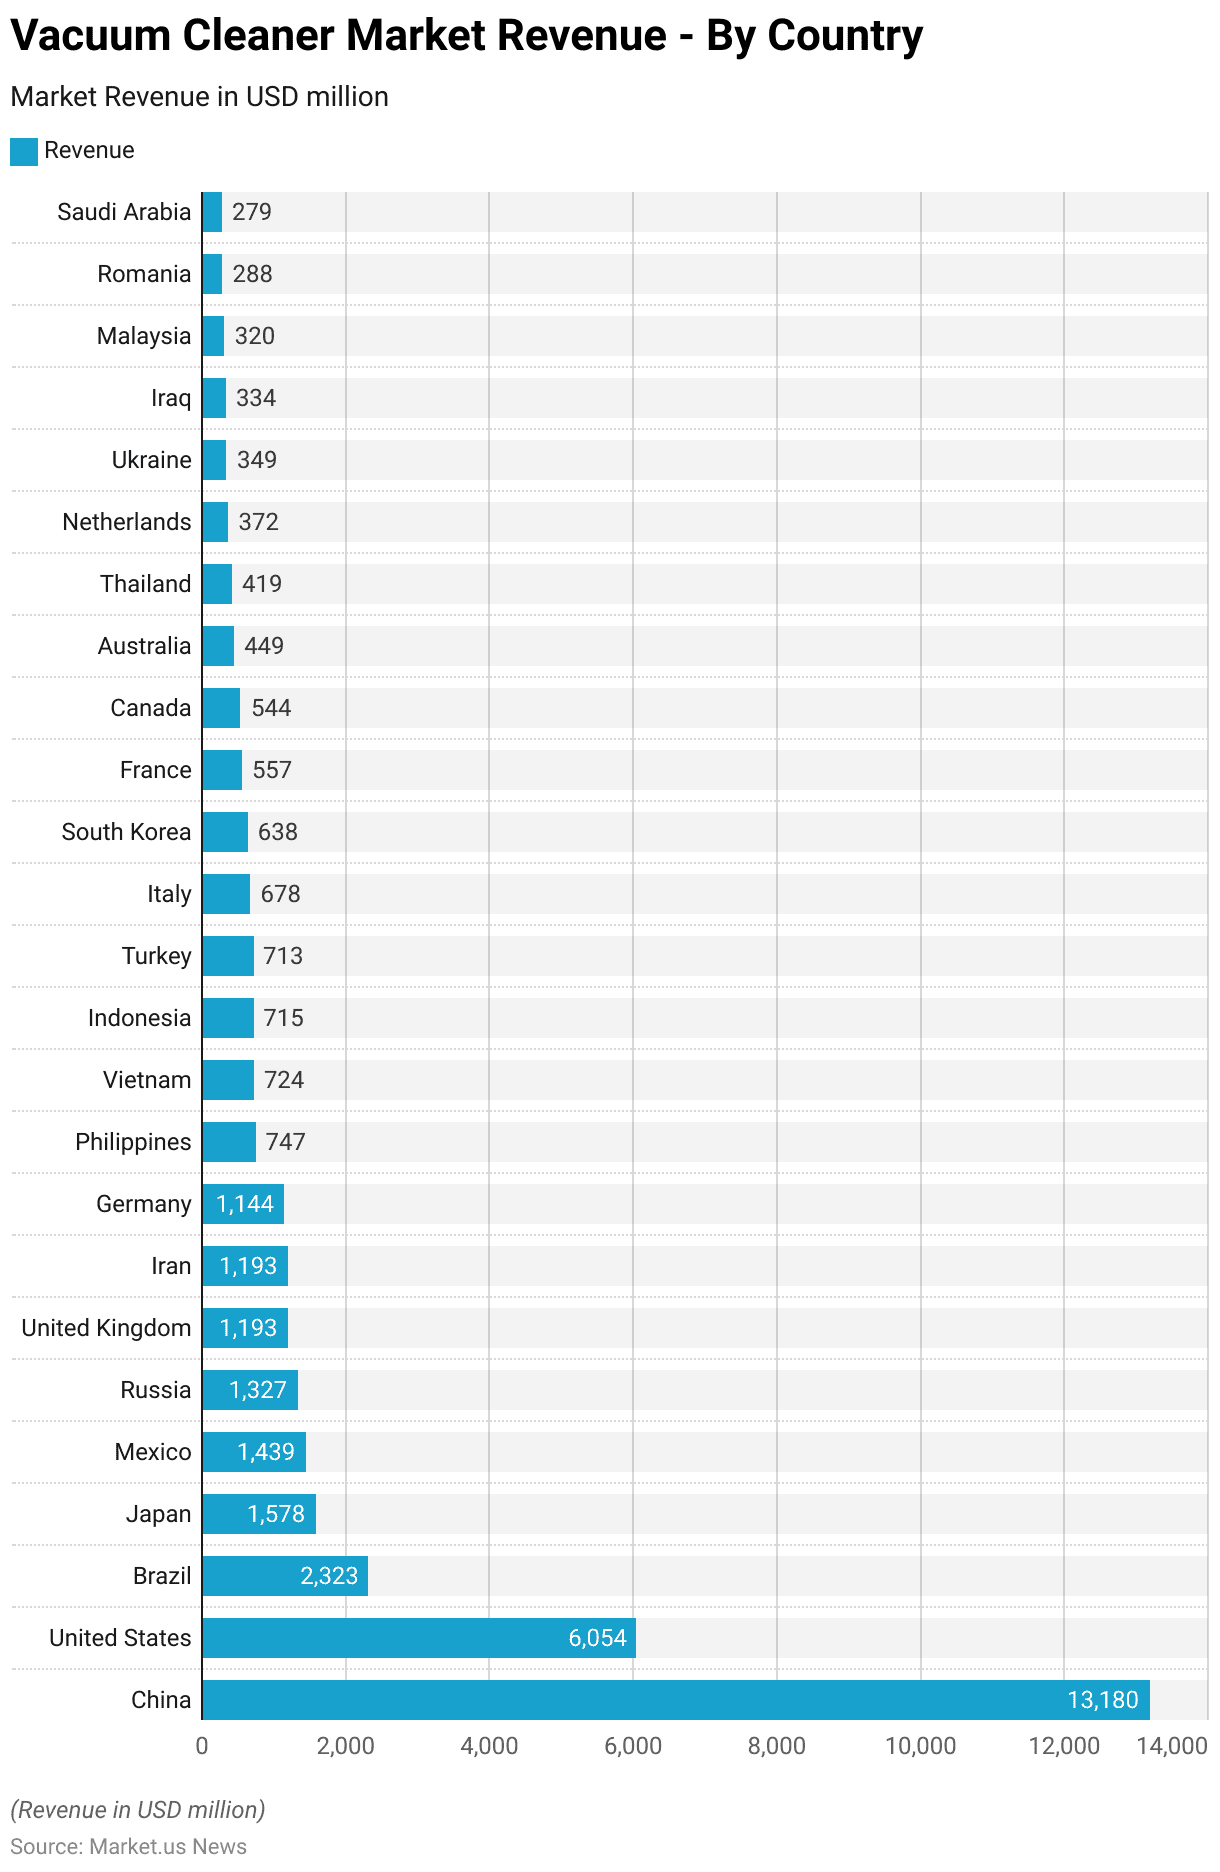
- In 2024, the global vacuum cleaner market revenue by country reveals a highly concentrated distribution. With China leading significantly at USD 13,180 million.
- As of February 2024, vacuum cleaner ownership varied widely across 56 countries, with Serbia leading at 95%.
- In 2022, Mi dominated the Indian smart vacuum cleaner market, preferred by 43% of consumers.
- As of 2018, suction power was the most critical factor for U.S. consumers when purchasing a vacuum cleaner. With 68.3% of respondents identifying it as their top priority.
- In the European Union, significant regulations have been implemented under Commission Regulation (EU) No 666/2013, which stipulates that from September 2014. Vacuum cleaners must not exceed a power consumption of 1600W.
Vacuum Cleaner Market Overview
Global Vacuum Cleaner Market Revenue Statistics
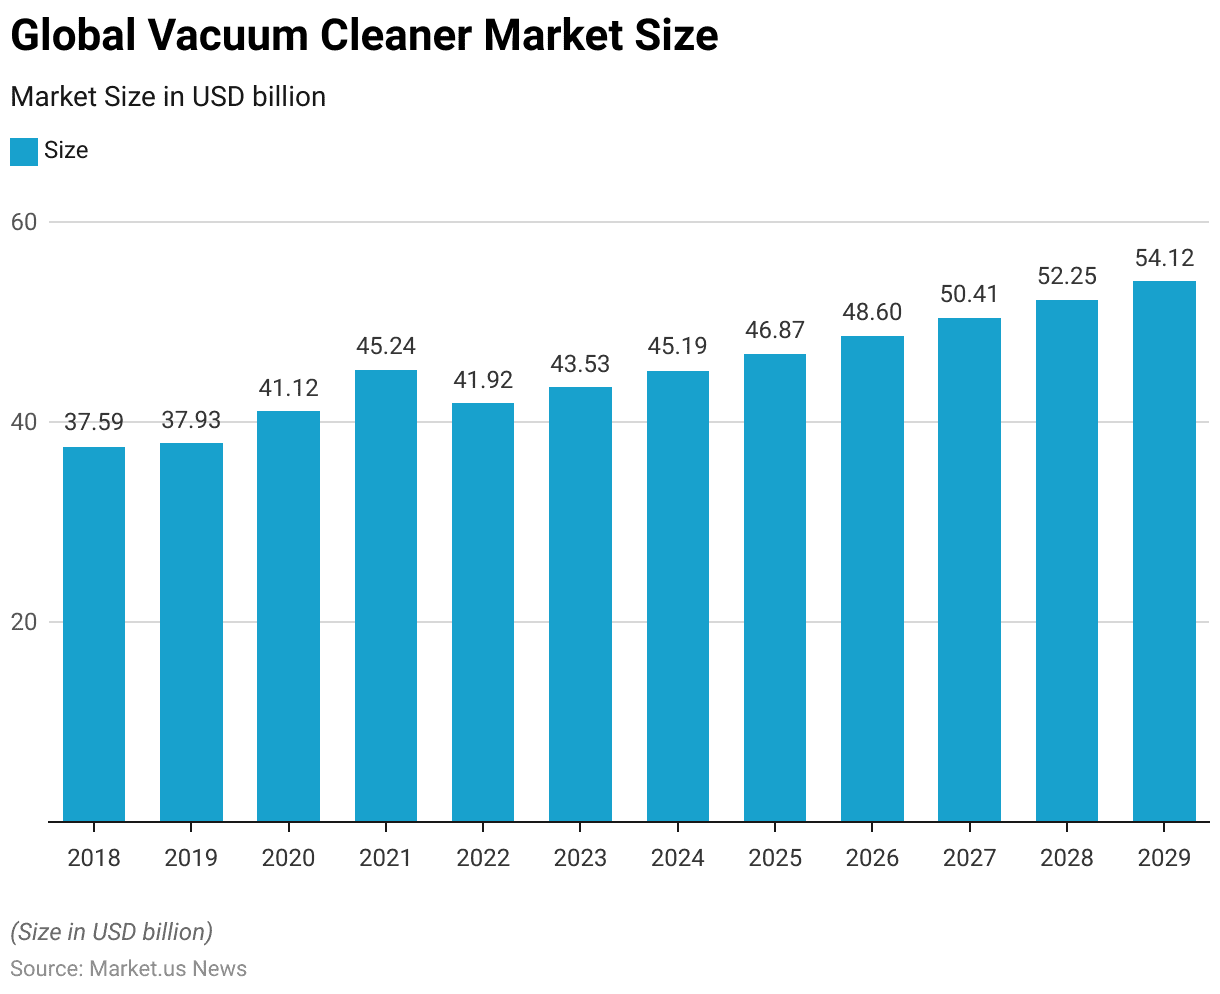
- The global vacuum cleaner market has demonstrated a steady upward trajectory over the past decade. With its market size increasing from USD 37.59 billion in 2018 to USD 54.12 billion projected for 2029.
- Following a modest growth from USD 37.59 billion in 2018 to USD 37.93 billion in 2019. The market experienced significant expansion, reaching USD 41.12 billion in 2020.
- This growth continued robustly through 2021 when the market size peaked at USD 45.24 billion.
- However, a slight decline to USD 41.92 billion was recorded in 2022. Likely influenced by market fluctuations or external economic factors.
- Recovery was swift, with the market rebounding to USD 43.53 billion in 2023.
- Forecasts suggest sustained growth in subsequent years. With market sizes projected at USD 45.19 billion in 2024, USD 46.87 billion in 2025, and USD 48.60 billion in 2026.
- By 2027, the market is expected to reach USD 50.41 billion. Continuing to USD 52.25 billion in 2028 and culminating at USD 54.12 billion by 2029. Reflecting a compound annual growth rate (CAGR) of 3.67% indicative of strong demand and innovation within the sector.
(Source: Statista)
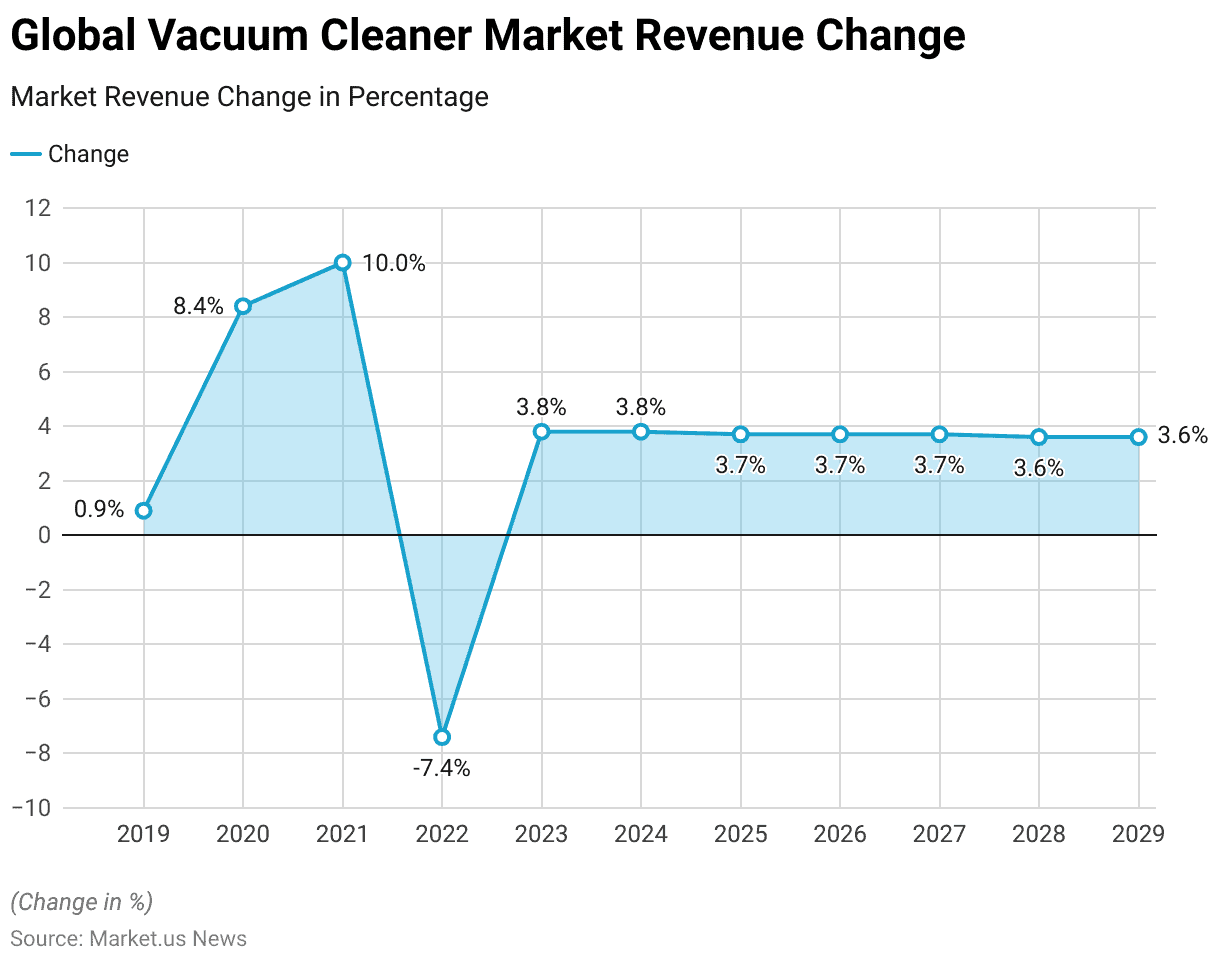
Global Vacuum Cleaner Market Revenue Change Statistics
- The global vacuum cleaner market has experienced varying rates of revenue change over the years, reflecting the sector’s dynamic nature.
- In 2019, market revenue grew modestly by 0.9%, followed by a notable increase of 8.4% in 2020. As demand surged, possibly driven by heightened consumer focus on hygiene.
- This upward trend continued in 2021, with a robust growth rate of 10%, marking the peak of the decade.
- However, 2022 witnessed a significant decline, with revenue contracting by 7.4%. Likely due to market corrections or external economic challenges.
- Growth resumed in 2023, with a revenue increase of 3.8%, and similar growth rates of 3.8% are projected for 2024.
- From 2025 to 2027, the market is expected to maintain stable growth, with annual revenue changes of 3.7%.
- The pace of growth is projected to slightly taper off to 3.6% in both 2028 and 2029, indicating a more mature and stable market phase as it approaches the end of the forecast period.
(Source: Statista)
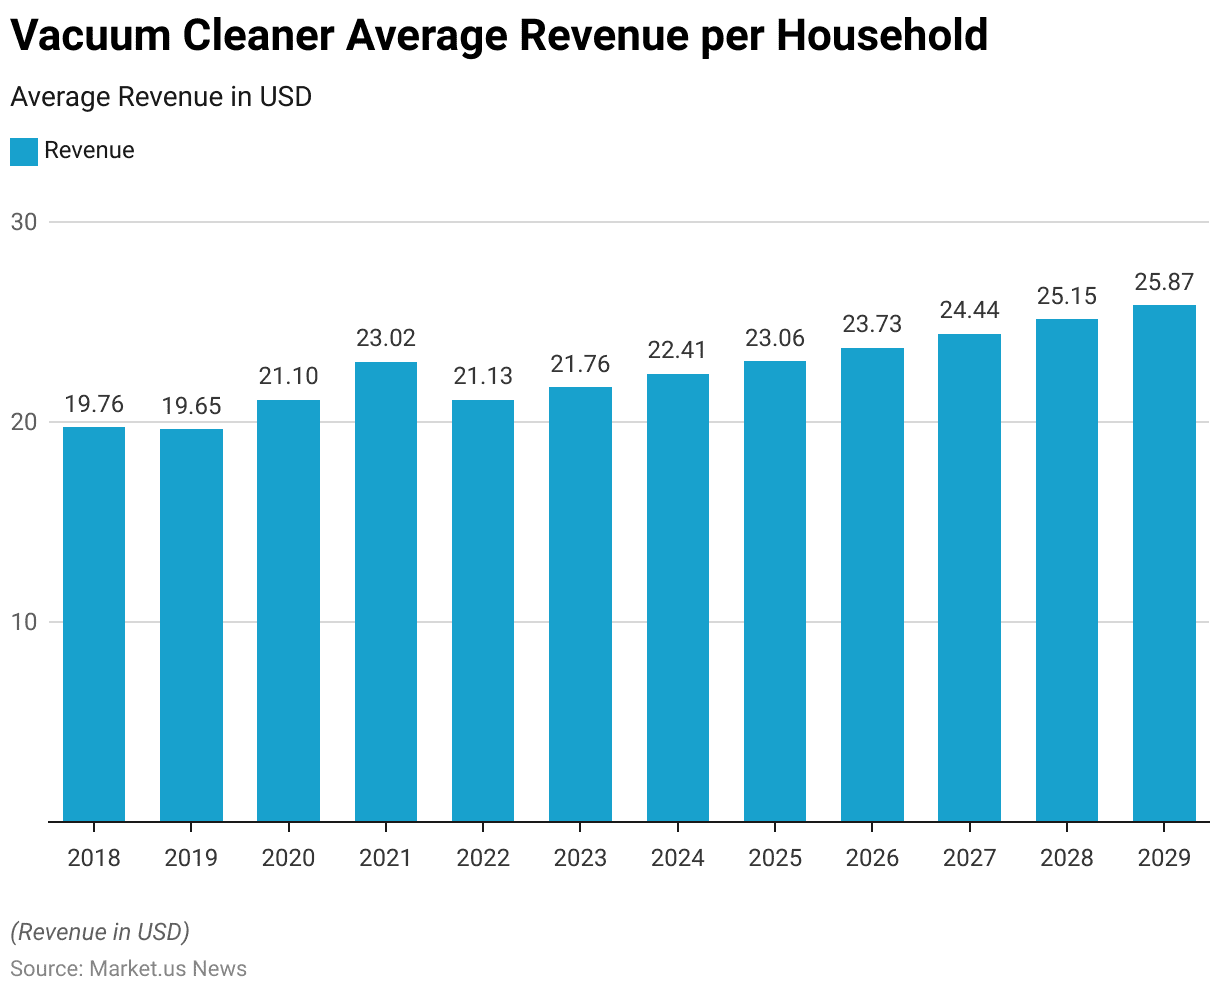
Vacuum Cleaner Average Revenue per Household Statistics
- The average revenue generated per household from vacuum cleaner purchases has shown a fluctuating yet generally upward trend from 2018 to 2029.
- In 2018, the average revenue stood at USD 19.76 per household, slightly decreasing to USD 19.65 in 2019.
- However, 2020 marked the beginning of a significant growth phase, with the average revenue increasing to USD 21.10.
- This upward trajectory continued into 2021, reaching USD 23.02, the highest value observed in this period.
- In 2022, the average revenue per household dipped to USD 21.13, likely reflecting market adjustments.
- A recovery was evident in 2023, with an increase to USD 21.76, followed by steady growth in subsequent years.
- The projections for 2024 to 2029 indicate consistent increments, with values of USD 22.41 in 2024, USD 23.06 in 2025, and USD 23.73 in 2026.
- By 2027, the average revenue is expected to rise to USD 24.44, continuing to USD 25.15 in 2028 and culminating at USD 25.87 in 2029, signaling a sustained increase in consumer spending on vacuum cleaners over the forecast period.
(Source: Statista)
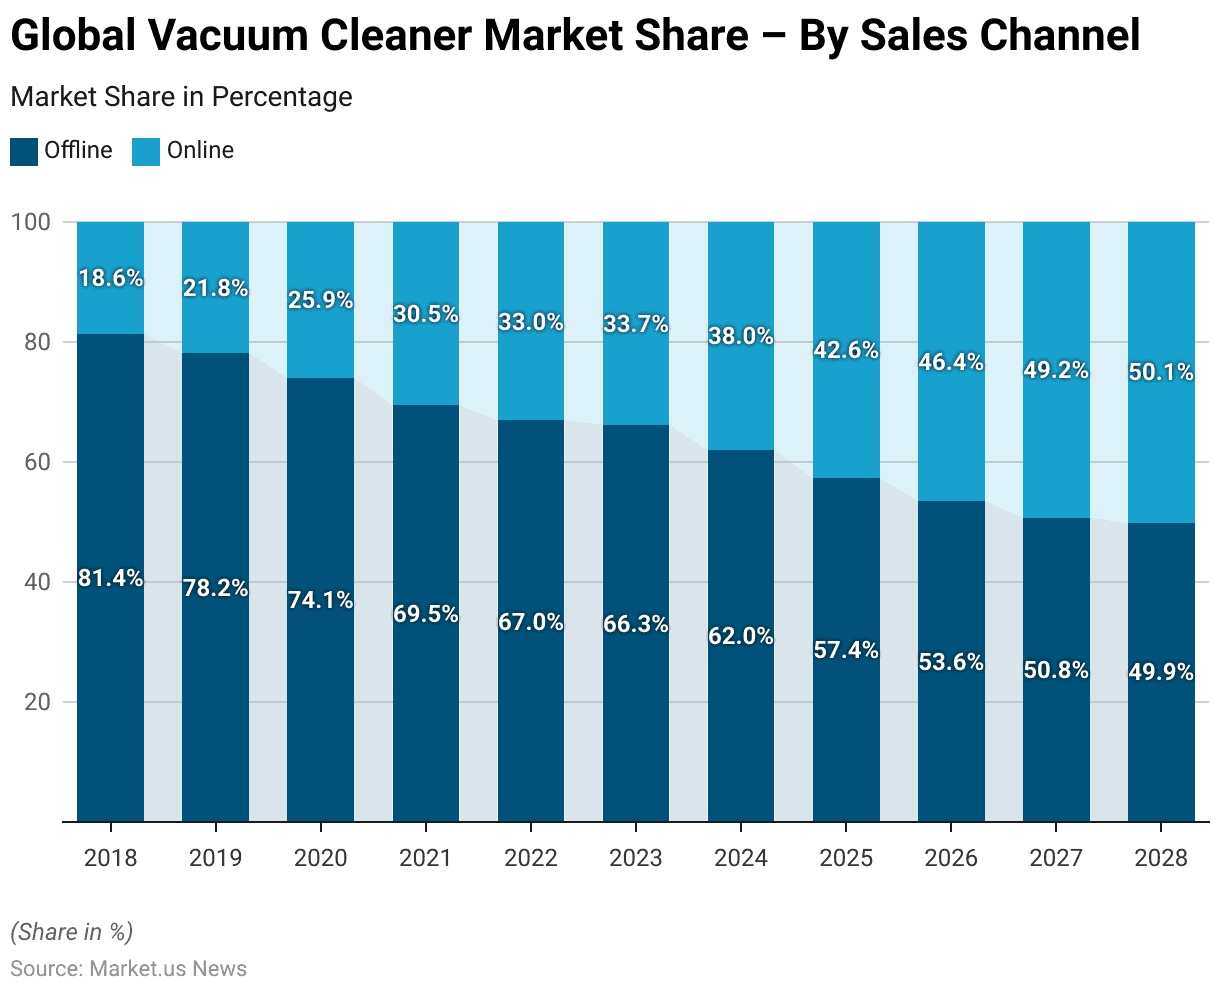
Global Vacuum Cleaner Market Share – By Sales Channel Statistics
- The global vacuum cleaner market has undergone a significant shift in sales channel dynamics, with a gradual transition from offline to online sales over the past decade.
- In 2018, offline channels dominated the market, accounting for 81.4% of total sales, while online channels held a modest 18.6% share.
- By 2019, the online share increased to 21.8%, and this trend continued through 2020 and 2021, with online sales reaching 25.9% and 30.5%, respectively.
- The shift was further accelerated in 2022 when online sales captured 33% of the market, up from 30.5% the previous year.
- In 2023, online sales rose slightly to 33.7%.
- Looking ahead, projections for 2024 indicate that online sales will account for 38% of the market, with a steady increase in subsequent years.
- By 2025, the online channel is expected to represent 42.6% of total sales, growing to 46.4% in 2026.
- In 2027, online sales will nearly reach parity with offline channels, comprising 49.2% of the market.
- The trend culminates in 2028, when online sales are projected to overtake offline sales for the first time, accounting for 50.1% of the market.
- This evolution reflects the growing consumer preference for online shopping, driven by convenience, broader product availability, and competitive pricing.
(Source: Statista)
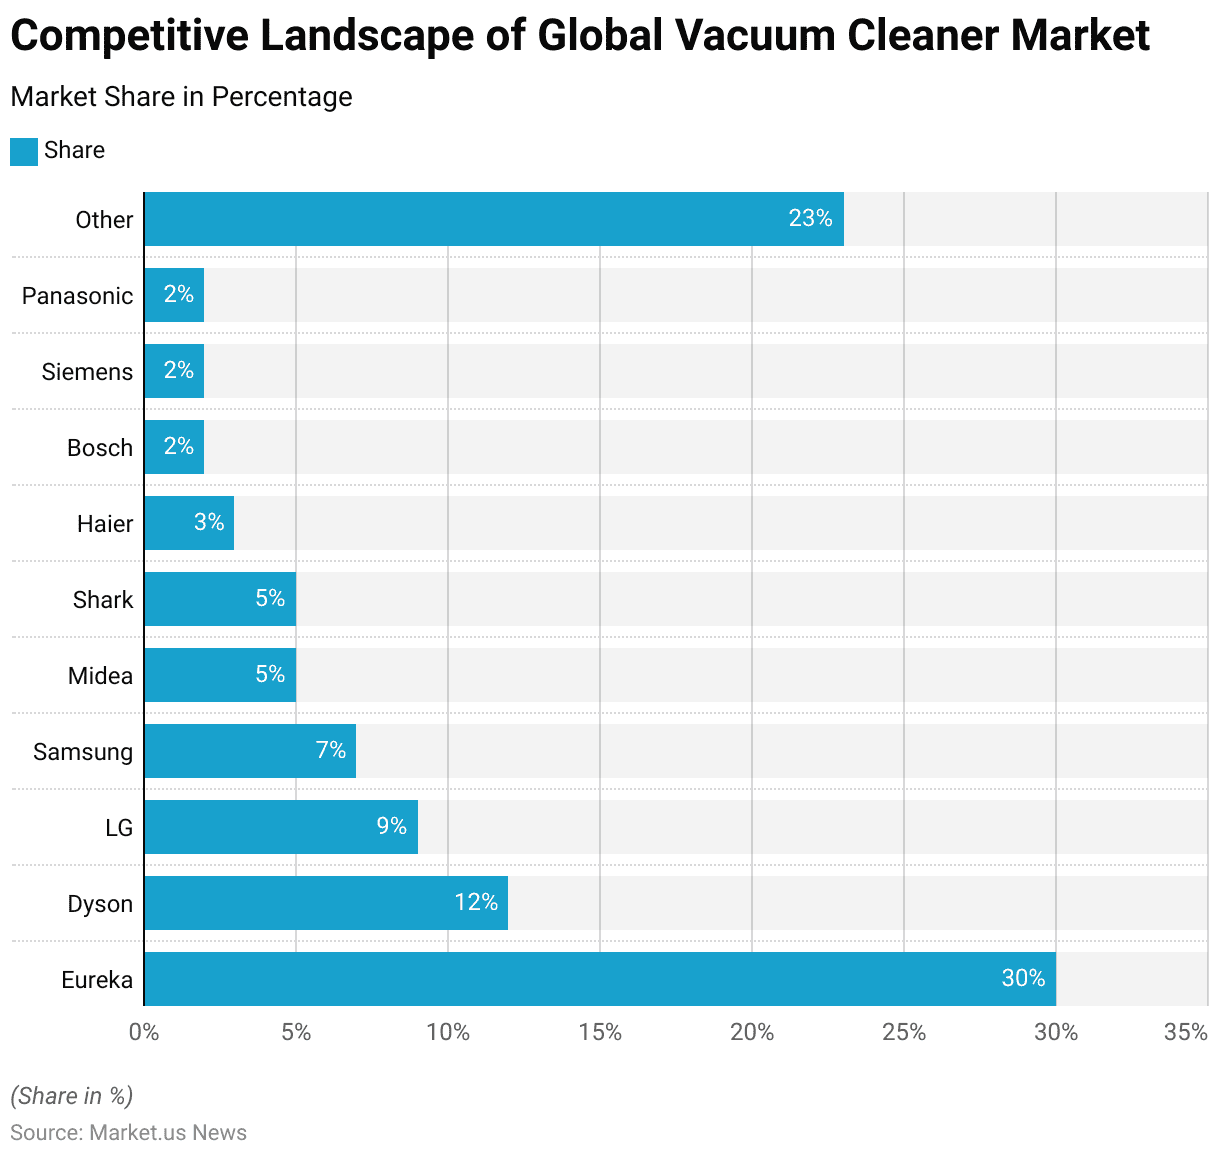
Competitive Landscape of Global Vacuum Cleaner Market Statistics
- The competitive landscape of the global vacuum cleaner market in 2022 is characterized by the dominance of a few key players alongside a diverse range of smaller competitors.
- Eureka leads the market with a significant share of 30%, establishing its stronghold in the industry.
- Dyson holds the second-largest market share at 12%, followed by LG with 9%.
- Samsung captures 7% of the market, while both Midea and Shark each account for 5%.
- Haier holds a 3% share, and Bosch, Siemens, and Panasonic each occupy 2% of the market.
- Collectively, other smaller players account for 23% of the market, highlighting the fragmented nature of the industry and the presence of numerous regional and niche competitors.
- This distribution underscores a competitive market environment, with established brands competing alongside emerging players to capture consumer demand.
(Source: Statista)
Vacuum Cleaner Market Revenue – By Country Statistics
- In 2024, the global vacuum cleaner market revenue by country reveals a highly concentrated distribution, with China leading significantly at USD 13,180 million.
- The United States follows with a substantial revenue of USD 6,054 million.
- Brazil ranks third with USD 2,323 million, reflecting its strong regional demand.
- Japan and Mexico generate revenues of USD 1,578 million and USD 1,439 million, respectively, showcasing their developed consumer bases.
- Russia contributes USD 1,327 million, while the United Kingdom and Iran both report revenues of USD 1,193 million each.
- Germany closely follows with USD 1,144 million.
- In Southeast Asia, the Philippines accounts for USD 747 million, Vietnam for USD 724 million, and Indonesia for USD 715 million.
- Turkey and Italy generate USD 713 million and USD 678 million, respectively.
- South Korea brings in USD 638 million, while France and Canada contribute USD 557 million and USD 544 million, respectively.
- Australia reports USD 449 million, Thailand USD 419 million, and the Netherlands USD 372 million. Ukraine follows with USD 349 million, Iraq with USD 334 million, and Malaysia with USD 320 million.
- Romania and Saudi Arabia close out the list with revenues of USD 288 million and USD 279 million, respectively.
- This data underscores the diverse geographical spread of market demand, with significant contributions from both developed and emerging economies.
(Source: Statista)
Vacuum Cleaner Volume Overview
Global Vacuum Cleaner Volume Statistics
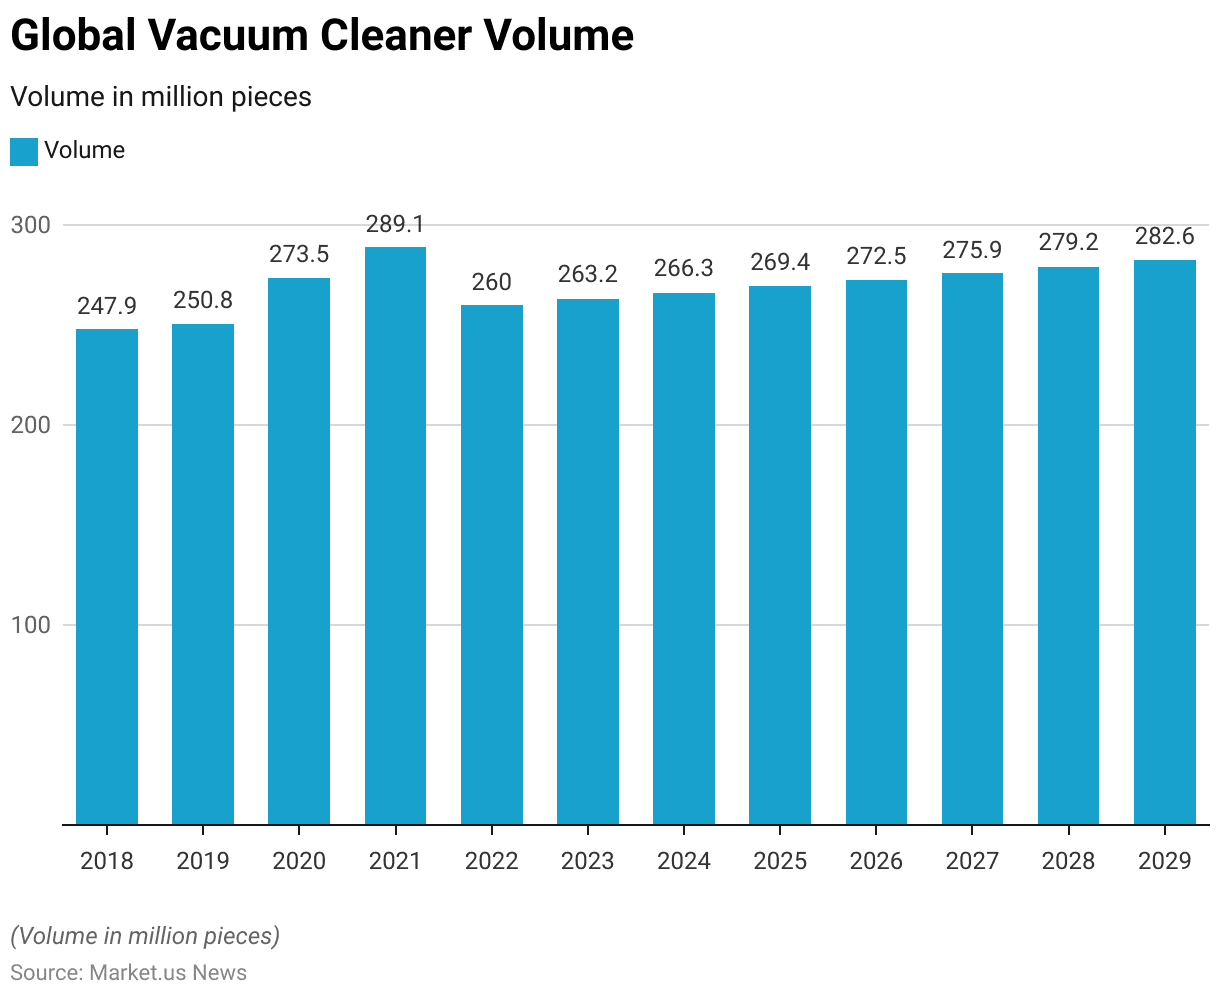
- The global vacuum cleaner market has exhibited a dynamic growth pattern in terms of volume over the past decade.
- In 2018, the total volume stood at 247.9 million units, increasing slightly to 250.8 million in 2019.
- A significant surge was observed in 2020, with the volume rising to 273.5 million units, followed by another substantial increase to 289.1 million units in 2021, marking the peak of the period.
- However, the market volume contracted to 260 million units in 2022, reflecting a potential market correction or external disruptions.
- A recovery trend began in 2023, with volumes climbing to 263.2 million units, and this upward trajectory is expected to continue.
- Projections for 2024 indicate a market volume of 266.3 million units, increasing to 269.4 million in 2025 and 272.5 million in 2026.
- By 2027, the volume is anticipated to reach 275.9 million units, with further growth to 279.2 million units in 2028 and 282.6 million units in 2029.
- This sustained growth underscores the rising global demand for vacuum cleaners, driven by technological advancements, increased urbanization, and greater consumer focus on home hygiene.
(Source: Statista)
Global Vacuum Cleaner Volume Growth Statistics
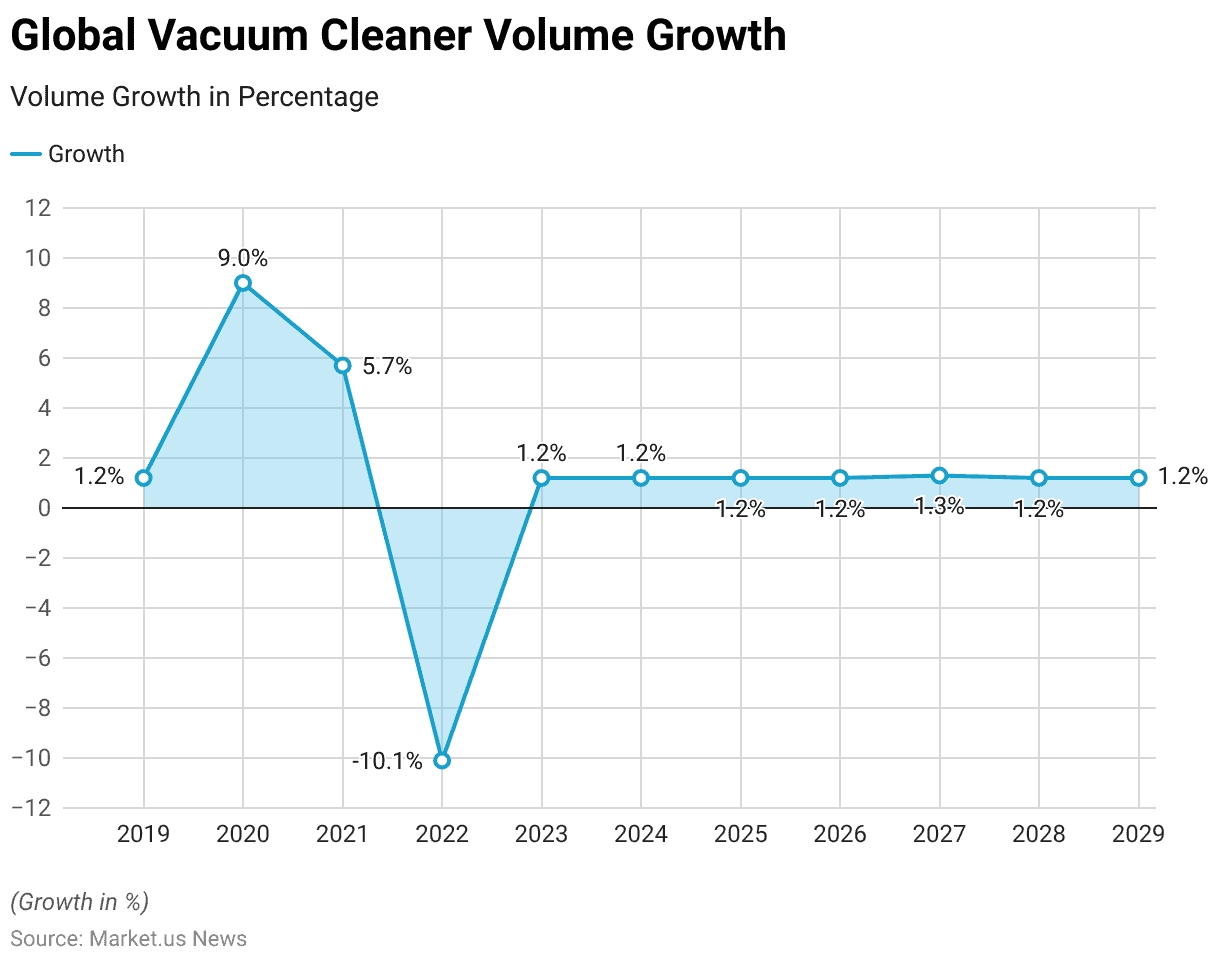
- The global vacuum cleaner market has experienced fluctuating growth rates in volume over recent years.
- In 2019, the market recorded a modest growth of 1.2%, followed by a significant surge of 9.0% in 2020, driven by increased demand for home appliances amid changing consumer lifestyles.
- Growth remained robust in 2021, though at a slower pace, with a 5.7% increase.
- However, 2022 saw a sharp contraction, with the market volume declining by 10.1%, potentially due to supply chain disruptions or macroeconomic challenges.
- From 2023 onward, growth is expected to stabilize at a consistent rate of 1.2% annually, reflecting a mature market phase.
- An exception is noted in 2027, where a slightly higher growth rate of 1.3% is projected.
- The steady growth of 1.2% is forecasted to continue through 2028 and 2029, indicating a stable yet moderate expansion as the market adjusts to equilibrium in supply and demand dynamics.
(Source: Statista)
Vacuum Cleaner Average Volume per Household Statistics
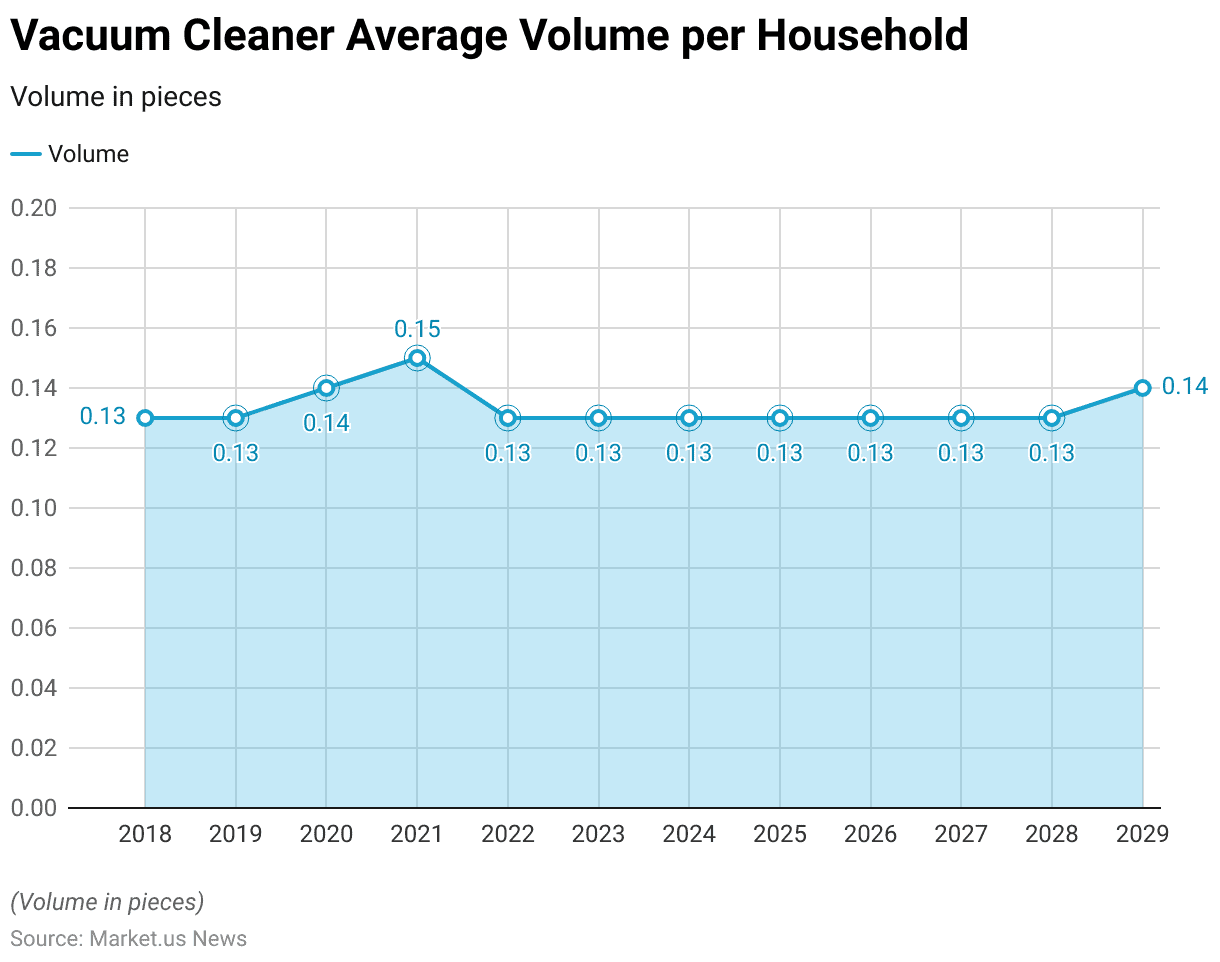
- The average number of vacuum cleaners per household has remained relatively stable over the years, with minor fluctuations.
- In 2018 and 2019, the average stood at 0.13 units per household.
- This figure increased slightly to 0.14 in 2020, followed by a further rise to 0.15 in 2021, reflecting increased demand for home cleaning appliances during this period.
- However, the average volume per household declined back to 0.13 units in 2022, a level that is projected to persist through 2028, indicating market stabilization.
- By 2029, a slight uptick to 0.14 units per household is anticipated, suggesting gradual growth in household adoption rates towards the end of the forecast period.
- This trend highlights a steady consumer preference for vacuum cleaners, with minor shifts in average household ownership over time.
(Source: Statista)
Global Vacuum Cleaner Price Statistics
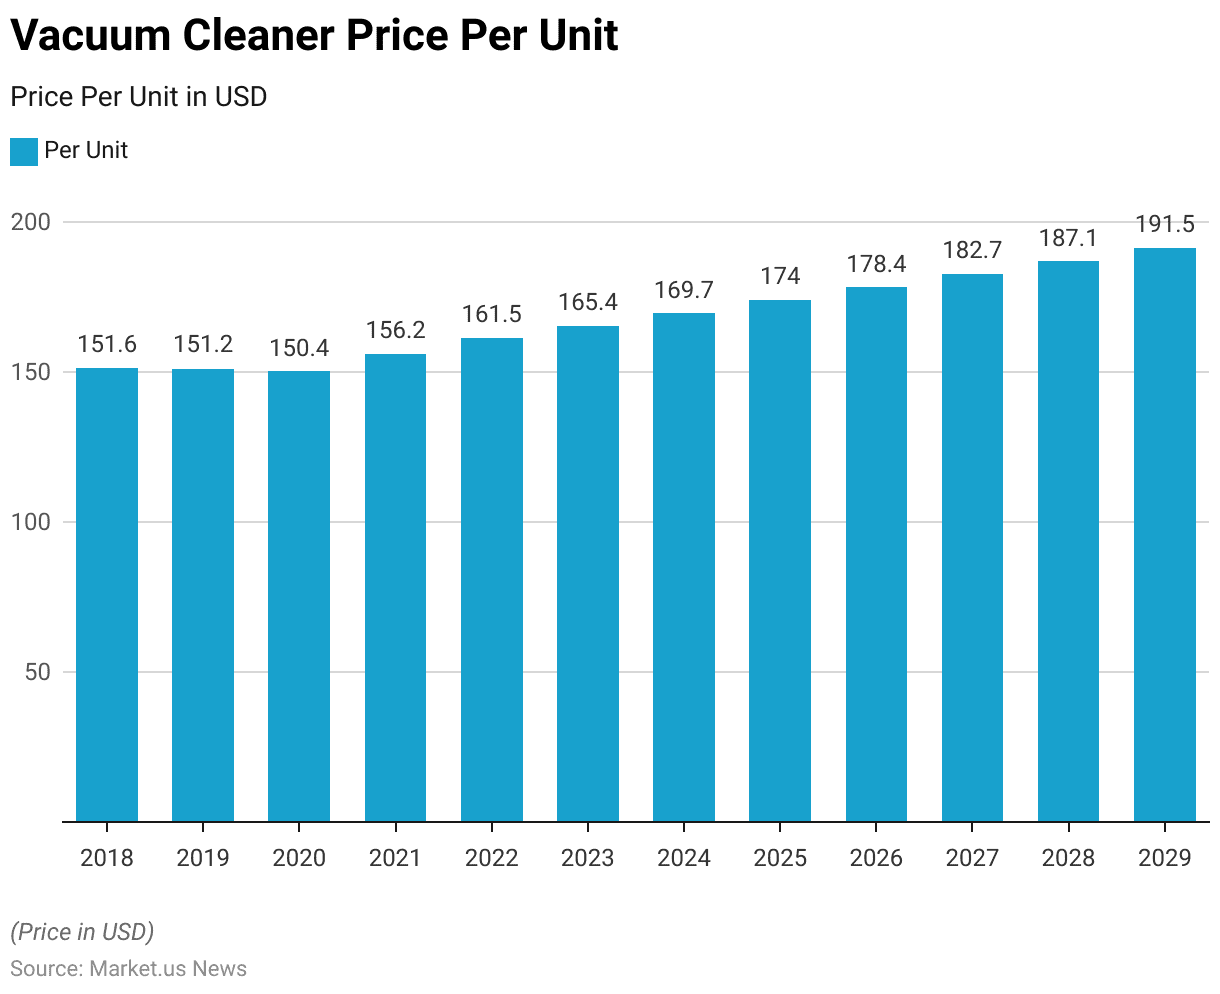
- The average price per unit of vacuum cleaners has shown a gradual increase over the years, reflecting advancements in technology, enhanced product features, and changing consumer preferences.
- In 2018, the average price was USD 151.6, which slightly decreased to USD 151.2 in 2019 and further to USD 150.4 in 2020.
- However, in 2021, a notable increase to USD 156.2 was observed, followed by a significant rise to USD 161.5 in 2022.
- This upward trend is expected to continue, with prices projected at USD 165.4 in 2023 and USD 169.7 in 2024.
- By 2025, the average price is anticipated to reach USD 174.0, further increasing to USD 178.4 in 2026.
- In 2027, the price is expected to rise to USD 182.7, followed by USD 187.1 in 2028, and ultimately reaching USD 191.5 by 2029.
- These price increases indicate a market shift towards premium products driven by innovations and an increasing focus on quality and performance.
(Source: Statista)
Statistics of Robotic Vacuum Cleaner Statistics
Worldwide Robotic Vacuum Cleaner Market Revenue Statistics
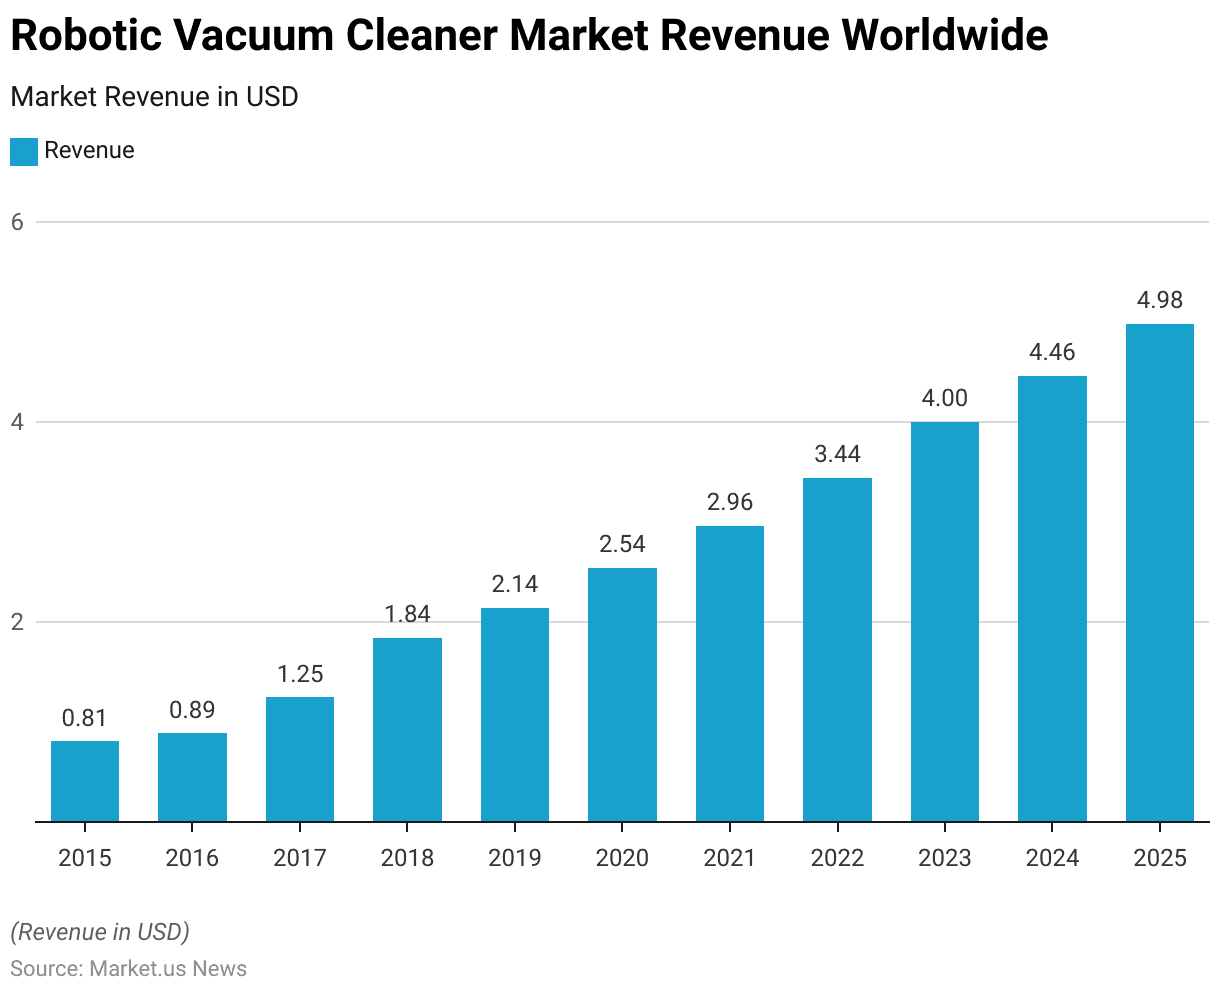
- The global robotic vacuum cleaner market has experienced remarkable growth from 2015 to 2025, reflecting increasing consumer demand for automated home cleaning solutions.
- In 2015, the market revenue stood at USD 0.81 billion, rising modestly to USD 0.89 billion in 2016.
- Growth accelerated in 2017, with revenues reaching USD 1.25 billion, and continued its upward trajectory in 2018, hitting USD 1.84 billion.
- By 2019, the market had expanded to USD 2.14 billion, followed by a further increase to USD 2.54 billion in 2020.
- The momentum persisted through 2021, with revenues climbing to USD 2.96 billion, and in 2022, the market generated USD 3.44 billion.
- Projections for 2023 indicate revenues reaching USD 4 billion, reflecting the market’s robust growth.
- By 2024, the market is expected to generate USD 4.46 billion, culminating at USD 4.98 billion in 2025.
- This growth trajectory underscores the rising adoption of robotic vacuum cleaners, driven by advancements in smart home technology and increasing consumer preference for convenience and automation.
(Source: Statista)
Worldwide Robotic Vacuum Cleaner Unit Shipment Statistics
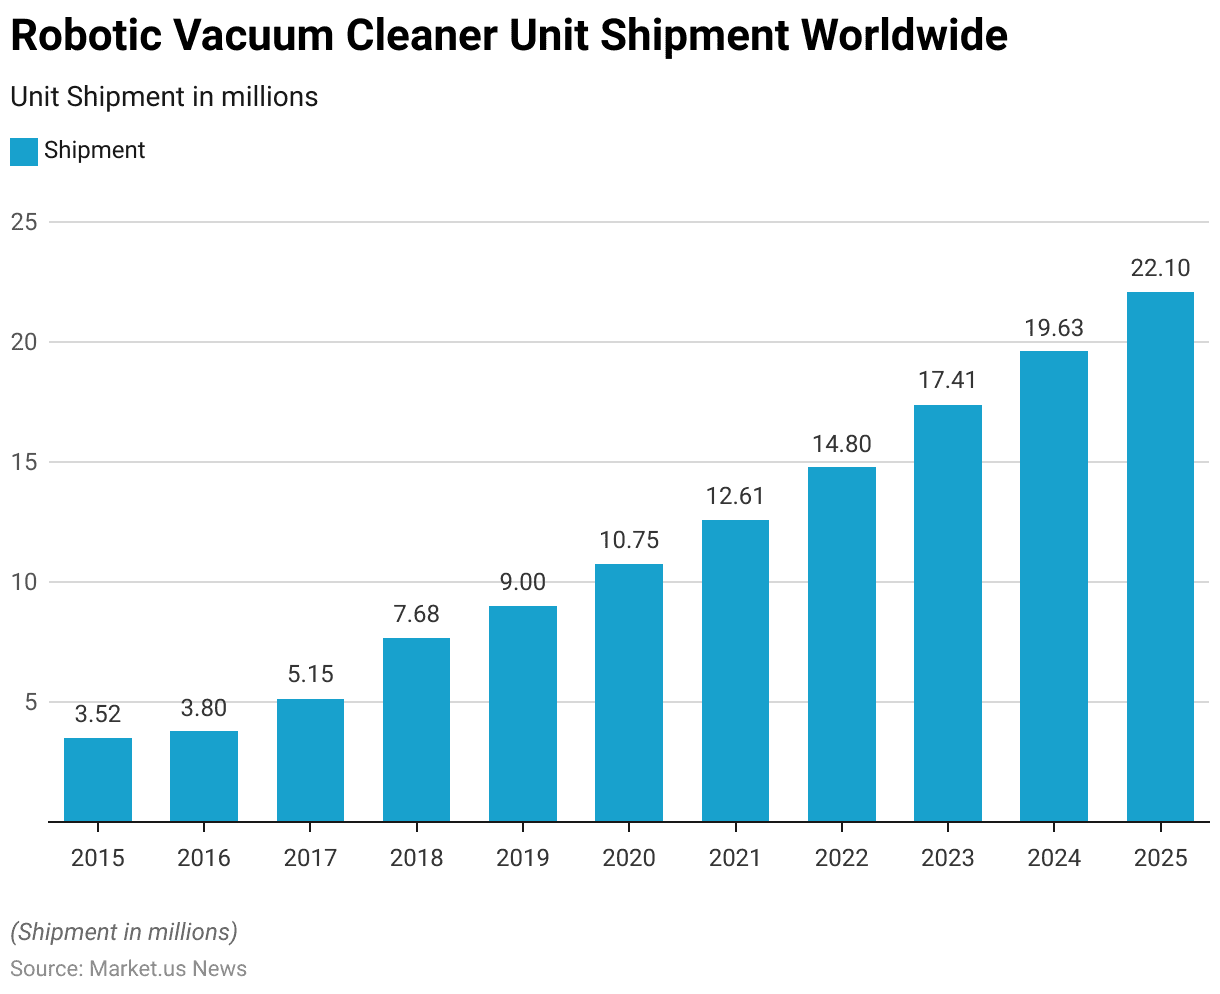
- The global shipment of robotic vacuum cleaners has shown a consistent upward trend from 2015 to 2025, highlighting the growing adoption of smart home appliances.
- In 2015, approximately 3.52 million units were shipped globally, increasing to 3.8 million units in 2016.
- This growth accelerated in 2017, with shipments reaching 5.15 million units, and continued to expand significantly in 2018, totaling 7.68 million units.
- By 2019, global shipments had risen to 9 million units, further increasing to 10.75 million units in 2020 as demand for automated cleaning solutions surged.
- The momentum carried into 2021, with 12.61 million units shipped, and 2022 saw further growth to 14.8 million units.
- Projections for 2023 estimate shipments of 17.41 million units, reflecting strong market demand.
- By 2024, shipments are expected to rise to 19.63 million units, culminating in 2025 with an anticipated 22.1 million units.
- This trajectory underscores the rapid expansion of the robotic vacuum cleaner market, driven by technological advancements and increasing consumer preference for automated and efficient home cleaning solutions.
(Source: Statista)
Robotic Vacuum Cleaner Market Share Worldwide – By Brand Statistics
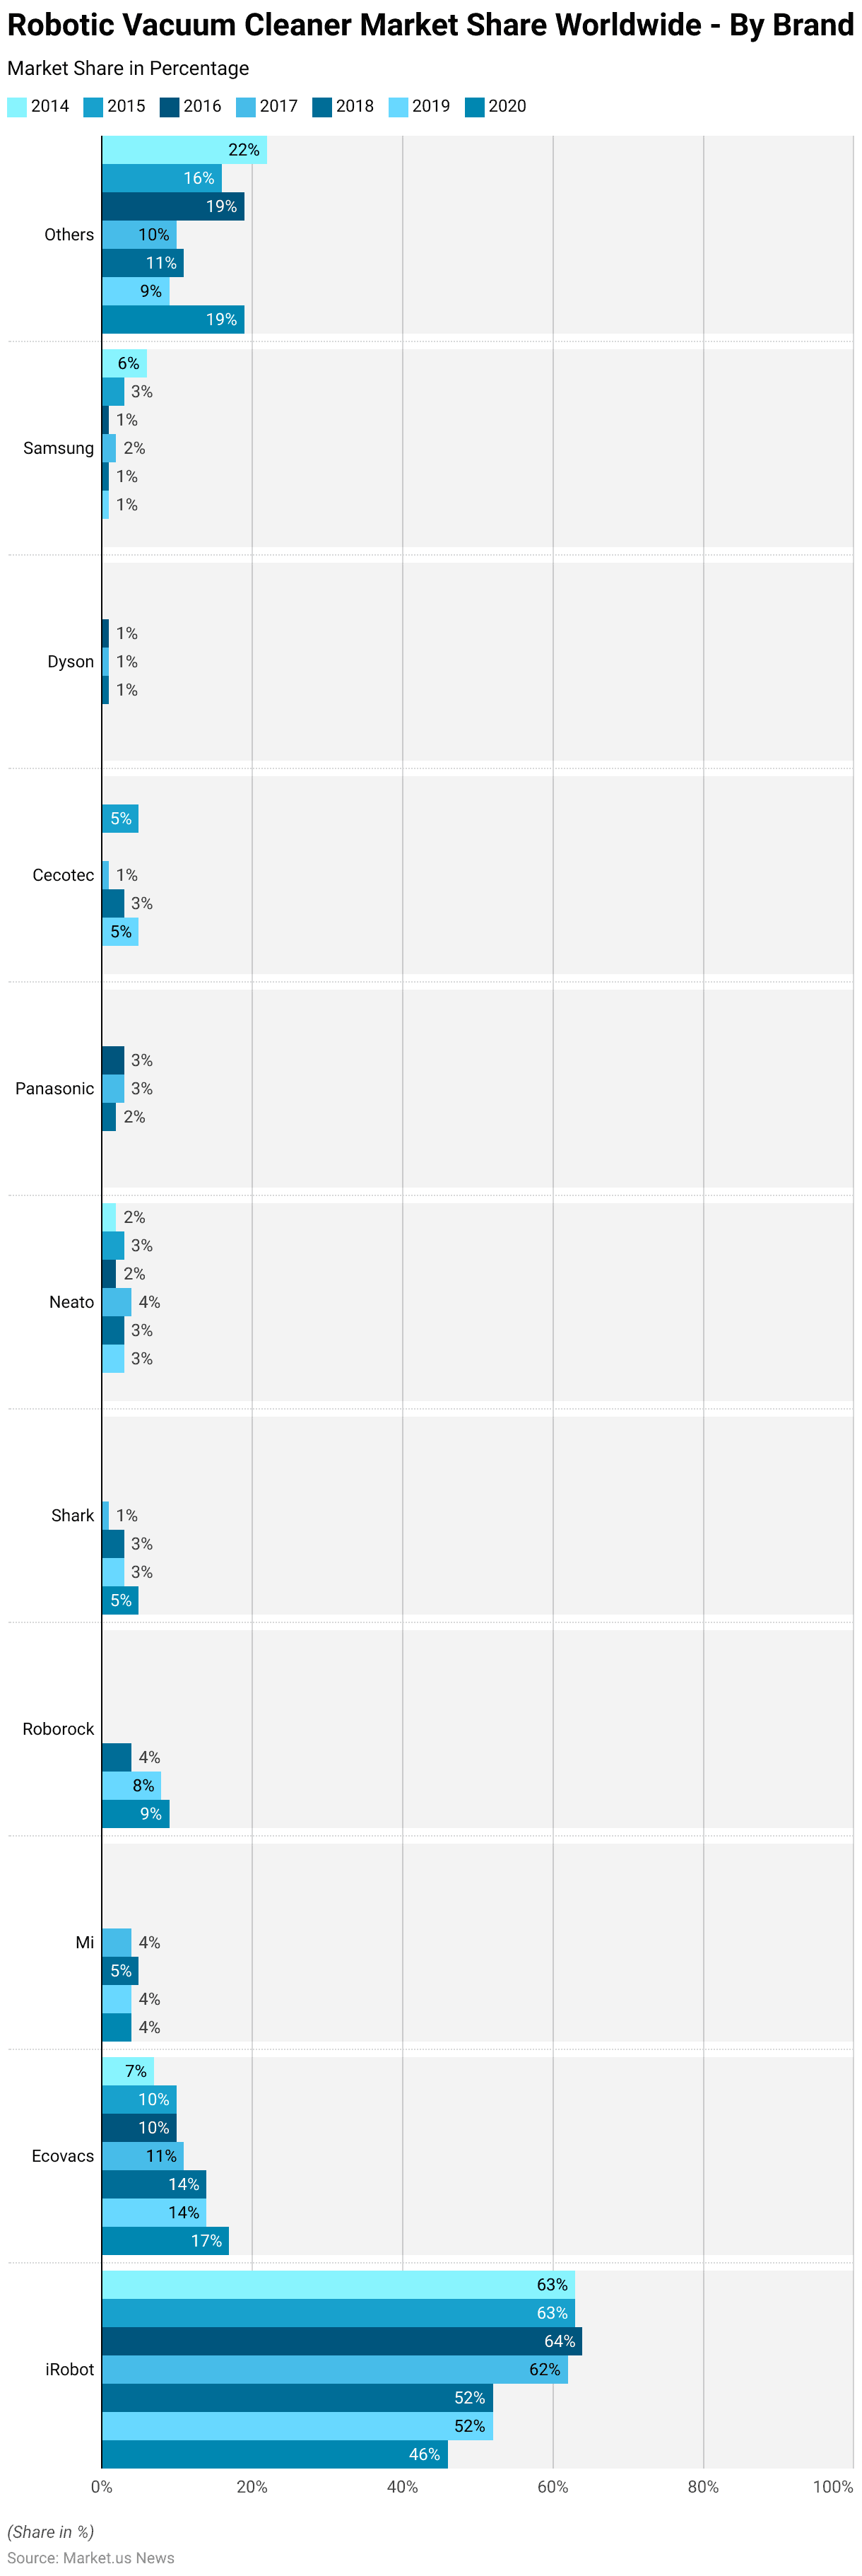
- From 2014 to 2020, the global robotic vacuum cleaner market saw significant shifts in brand market shares.
- iRobot maintained its leadership position throughout the period, with its market share peaking at 64% in 2016 before gradually declining to 46% in 2020.
- Ecovacs consistently gained ground, increasing its market share from 7% in 2014 to 17% in 2020, positioning itself as a strong competitor.
- Mi entered the market in 2017, capturing a steady share of 4-5% over the following years.
- Roborock also emerged as a key player, growing its share from 4% in 2018 to 9% in 2020.
- Shark’s presence grew modestly from 1% in 2017 to 5% in 2020.
- Neato Robotics fluctuated, holding a small yet stable share of 2-4% during this period.
- Panasonic’s presence diminished after holding 3% in 2016 and 2017, while Cecotec gained traction, reaching 5% in 2020.
- Other brands, including Samsung and Dyson, maintained minor shares, with Samsung’s market presence shrinking from 6% in 2014 to 1% in later years.
- Meanwhile, the share of “Others” decreased significantly from 22% in 2014 to a low of 9% in 2019 before rebounding to 19% in 2020, indicating increased fragmentation and competition in the market.
(Source: Statista)
Vacuum Cleaner Owners in Countries Worldwide Statistics
- As of February 2024, the share of vacuum cleaner ownership across 56 countries and territories worldwide highlights notable regional disparities.
- Serbia leads with a remarkable 95% ownership rate, followed closely by Finland at 94% and Czechia at 93%.
- Romania, Austria, and Turkey each report a 92% ownership rate, while Hungary, Portugal, and Greece follow closely at 91%.
- New Zealand, Poland, and Sweden maintain high adoption rates at 90%, while Lithuania, Germany, Norway, Netherlands, and Russia each report 88%.
- Japan, Belgium, and Denmark show similar figures at 87%, and France reports 85%.
- Ireland, the United Kingdom, and Italy each record ownership rates of 84%, while Australia stands at 82%.
More Insights
- Switzerland follows with 80%, Canada at 79%, and both Saudi Arabia and South Korea at 76%.
- Egypt reports a 75% ownership rate, while Spain, Chile, and Malaysia each stand at 74%.
- Taiwan follows at 73%, with the United States reporting a 70% ownership rate.
- Singapore and the United Arab Emirates each show 69% and 67%, respectively, alongside Israel.
- Ownership rates decline more significantly in regions such as Hong Kong (64%), Thailand (62%), Vietnam (58%), and Brazil (50%).
- Indonesia and Argentina report lower rates at 46% and 45%, respectively, while South Africa (42%), Mexico (41%), and India (37%) highlight emerging markets. Morocco (37%), Peru (36%), and China (32%) display similarly modest figures.
- Lower adoption rates are observed in the Philippines (29%), Colombia (26%), and Pakistan (23%), with the Dominican Republic (15%), Kenya (14%), and Nigeria (12%) reflecting minimal market penetration in these regions. This data underscores varying levels of market maturity and consumer accessibility globally.
(Source: Statista)

Vacuum Cleaner Brand Statistics – By Country/Region
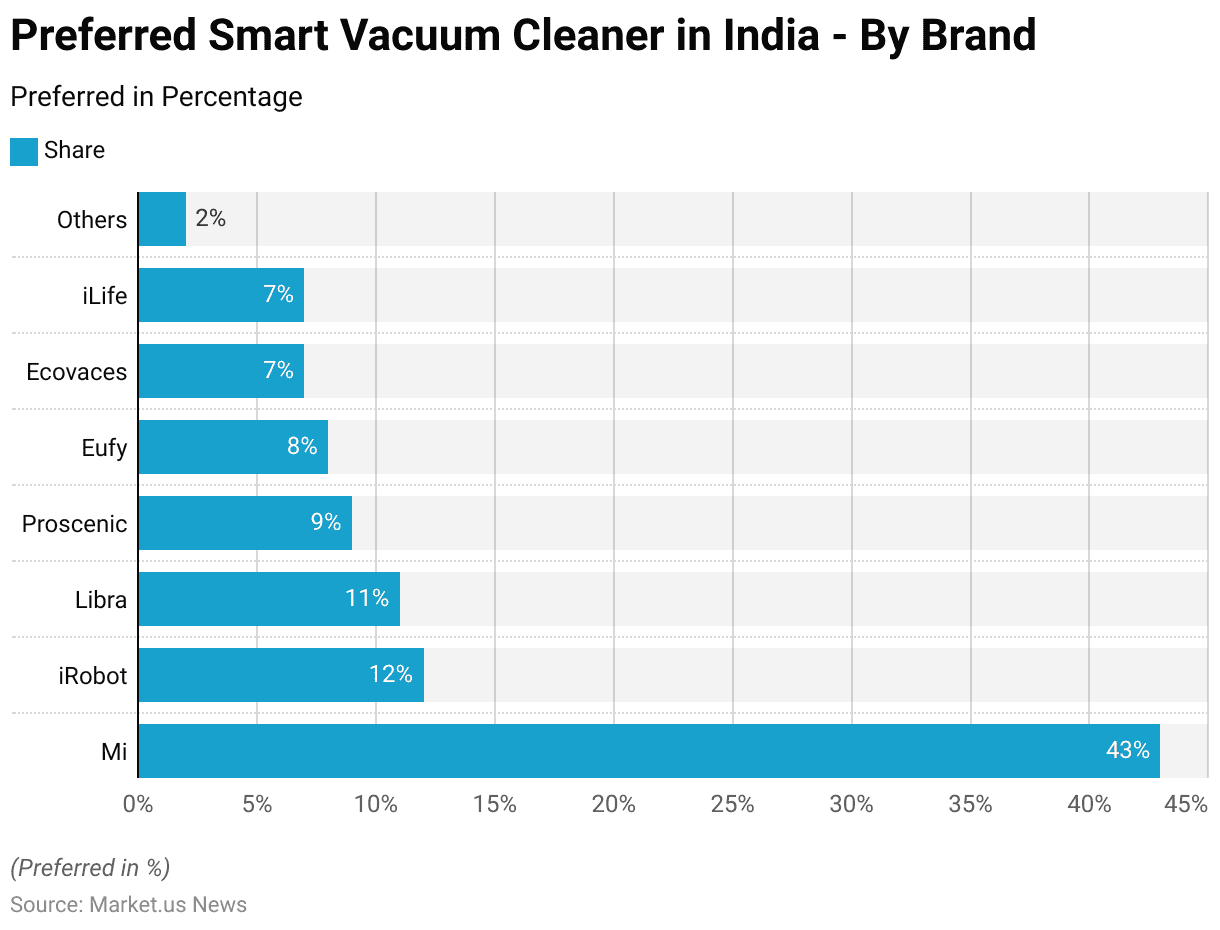
Preferred Smart Vacuum Cleaner in India – By Brand Statistics
- In 2022, the Indian smart vacuum cleaner market exhibited clear brand preferences among consumers.
- Mi emerged as the dominant brand, preferred by 43% of respondents, showcasing its strong foothold in the market.
- iRobot secured the second position with 12% of the consumer preference, followed closely by Libra at 11%.
- Proscenic accounted for 9% of preferences, while Eufy captured 8% of the market share.
- Ecovacs and iLife each held a 7% share, indicating competitive positioning among mid-tier brands.
- The remaining 2% of respondents favored other brands, reflecting a relatively small market presence for less popular or niche brands.
- This distribution underscores the concentration of consumer preference around a few key players in India’s growing smart vacuum cleaner segment.
(Source: Statista)
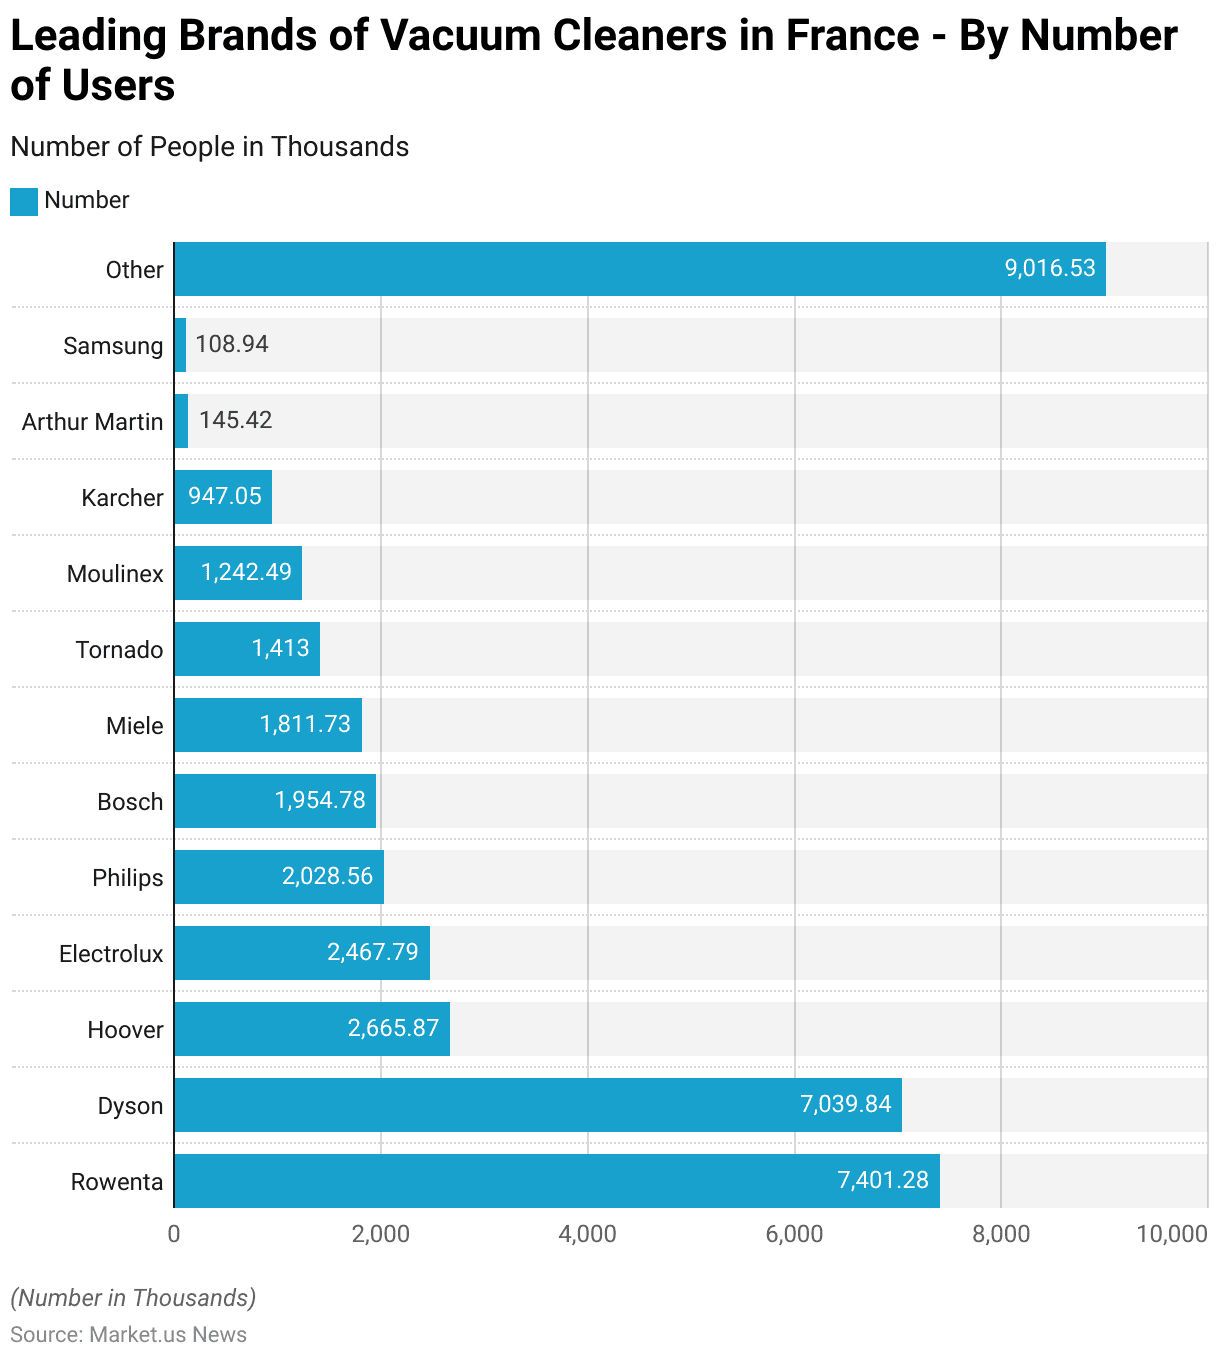
Leading Brands of Vacuum Cleaners in France – By Number of Users Statistics
- In 2021, the vacuum cleaner market in France was led by Rowenta, which had the highest number of users, with approximately 7.4 million people.
- Dyson is closely followed by 7.04 million users, establishing itself as a strong competitor.
- Hoover ranked third with 2.67 million users, while Electrolux and Philips secured 2.47 million and 2.03 million users, respectively.
- Bosch (1.95 million) and Miele (1.81 million) also maintained a significant user base.
- Tornado and Moulinex garnered 1.41 million and 1.24 million users, respectively, highlighting their steady presence in the market.
- Karcher attracted 947,000 users, while Arthur Martin and Samsung had smaller user bases, with 145,000 and 109,000 users, respectively.
- Additionally, other brands collectively accounted for a substantial share of the market, with approximately 9.02 million users.
- This data underscores the diverse brand preferences in France, with a mix of established leaders and niche players contributing to the market landscape.
(Source: Statista)
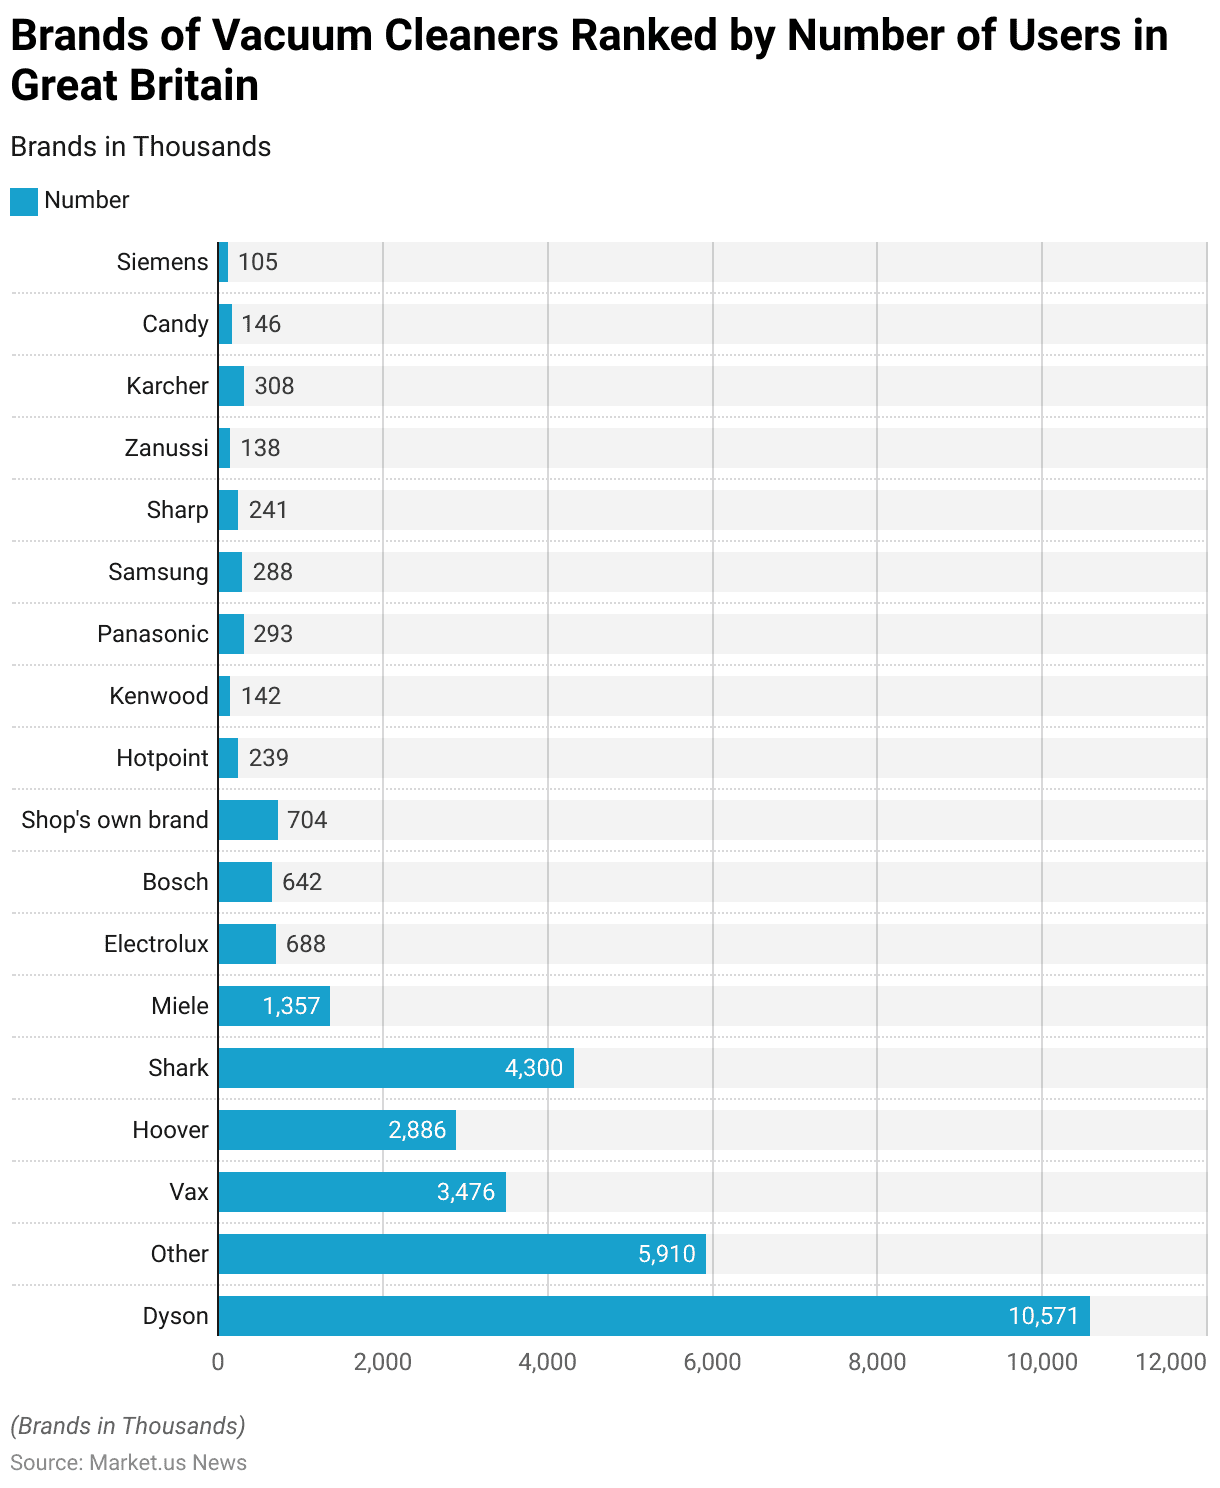
Brands of Vacuum Cleaners Ranked by Number of Users in Great Britain Statistics
- In 2021, Dyson emerged as the leading vacuum cleaner brand in Great Britain, with a user base of approximately 10.57 million people.
- Other brands collectively accounted for 5.91 million users, highlighting a diverse and competitive market.
- Shark ranked second among individual brands with 4.3 million users, followed by Vax with 3.48 million and Hoover with 2.89 million users.
- Miele maintained a solid presence with 1.36 million users, while Shop’s brands collectively gathered 704,000 users, showing strong consumer trust in private-label products.
- Electrolux (688,000 users) and Bosch (642,000 users) also demonstrated notable market shares.
- Among other established brands, Karcher attracted 308,000 users, while Panasonic and Samsung closely followed with 293,000 and 288,000 users, respectively.
- Sharp and Hotpoint recorded 241,000 and 239,000 users, respectively.
- Brands like Candy, Zanussi, and Kenwood showed smaller but steady user bases, with 146,000, 138,000, and 142,000 users, respectively.
- Siemens had the smallest user base among the listed brands, with 105,000 users.
- This data reflects a competitive market with Dyson’s clear dominance and a variety of brands catering to diverse consumer preferences.
(Source: Statista)
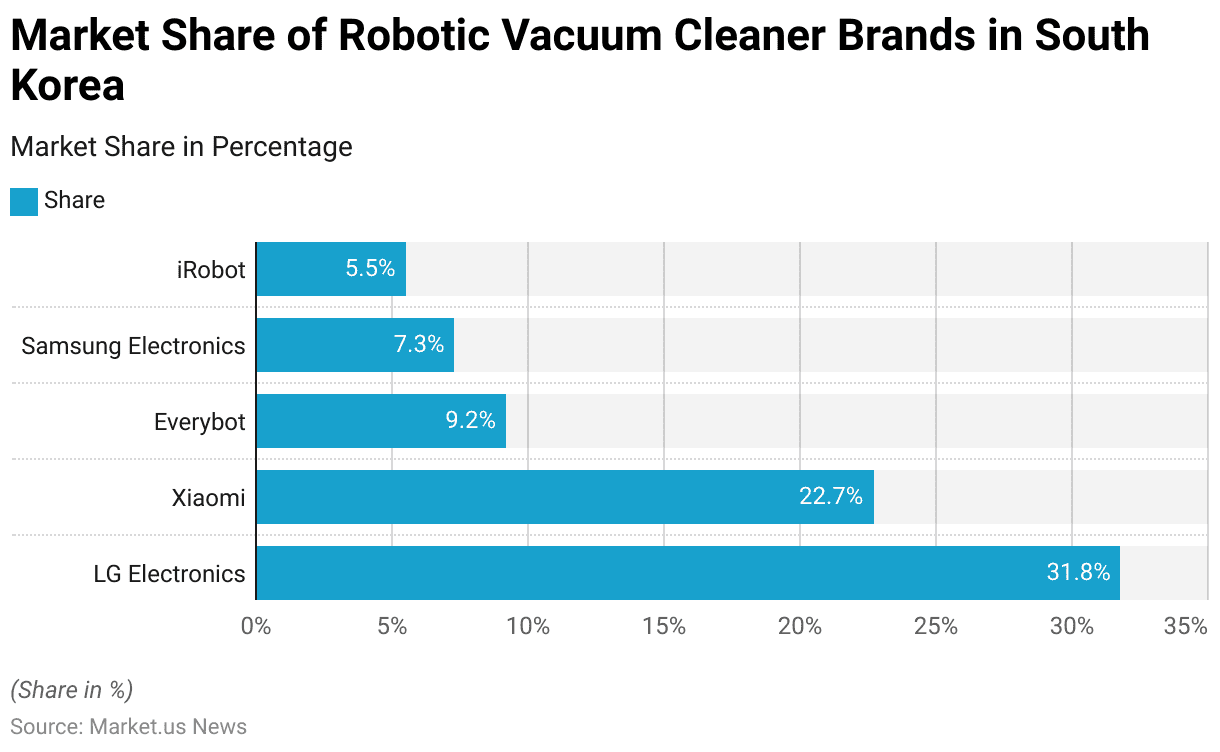
South Korea Market Share of Robotic Vacuum Cleaner Brands Statistics
- Between February 2017 and January 2018, LG Electronics dominated the robotic vacuum cleaner market in South Korea, capturing 31.8% of total sales.
- Xiaomi followed as a strong competitor with a market share of 22.7%, indicating significant consumer demand for its products.
- Everybot secured 9.2% of the market, showcasing its presence in the growing segment of robotic vacuum cleaners.
- Samsung Electronics accounted for 7.3% of sales, leveraging its established brand in home appliances.
- Meanwhile, iRobot held a 5.5% share, rounding out the top five brands.
- This distribution highlights a competitive market landscape, with local brands like LG and Samsung leading alongside global players.
(Source: Statista)
China Market Share of Top Robot Vacuum Cleaner Brands Statistics
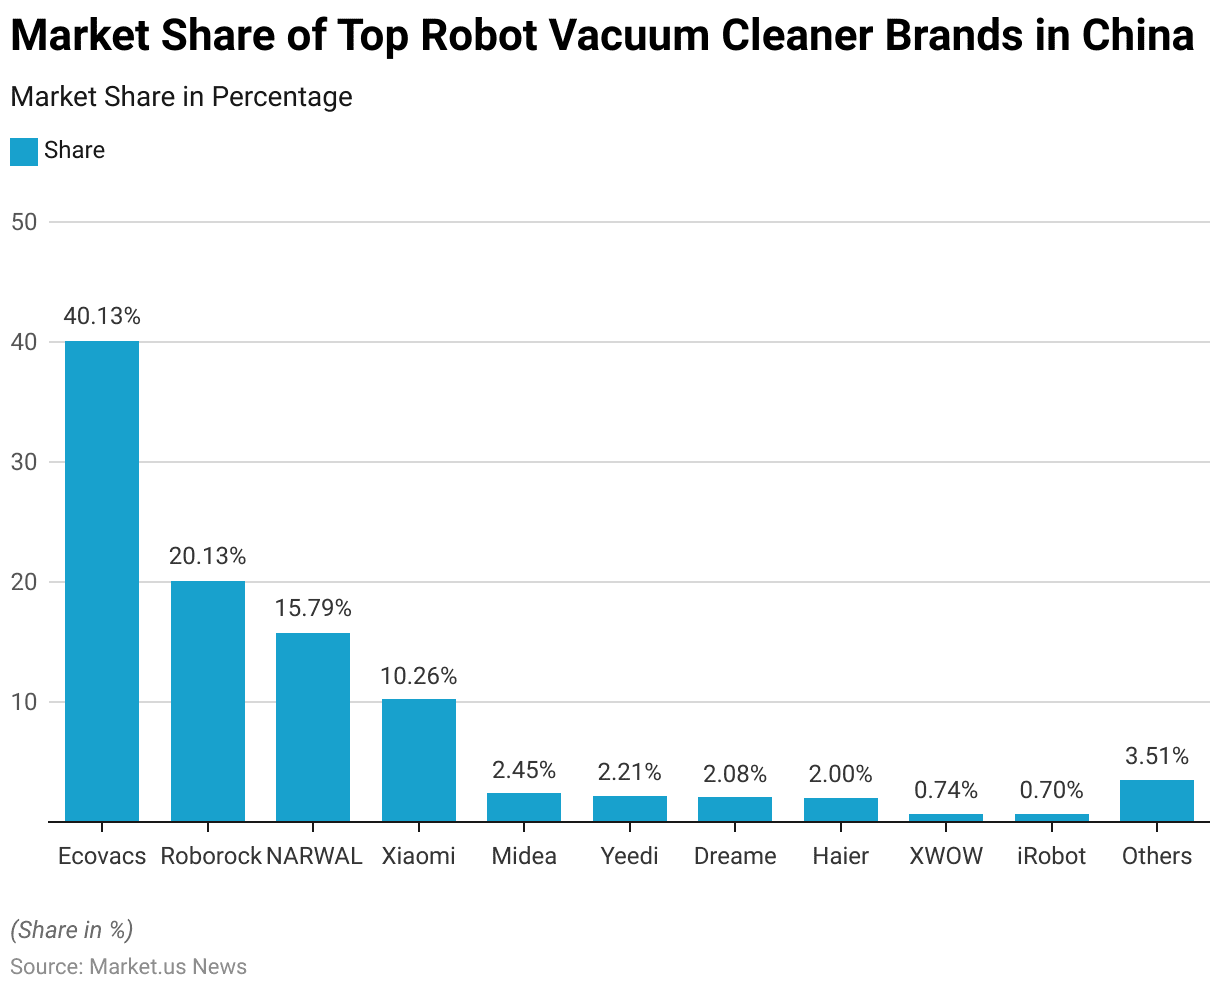
- Between January 1 and March 13, 2022, the robot vacuum cleaner market in China was led by Ecovacs, which commanded a significant 40.13% market share.
- Roborock followed as the second-largest player with a 20.13% share, while NARWAL held the third position with 15.79%.
- Xiaomi captured 10.26% of the market, reflecting its strong presence in the consumer electronics sector.
- Midea accounted for 2.45% of sales, closely followed by Yeedi with 2.21% and Dreame with 2.08%.
- Haier maintained a 2% market share, while XWOW and iRobot held smaller shares at 0.74% and 0.7%, respectively.
- Other brands collectively accounted for 3.51% of the market, underscoring the dominance of a few key players in this highly competitive industry.
(Source: Statista)
Southeast Asia Market Share of Leading Vacuum Cleaner Brands Statistics
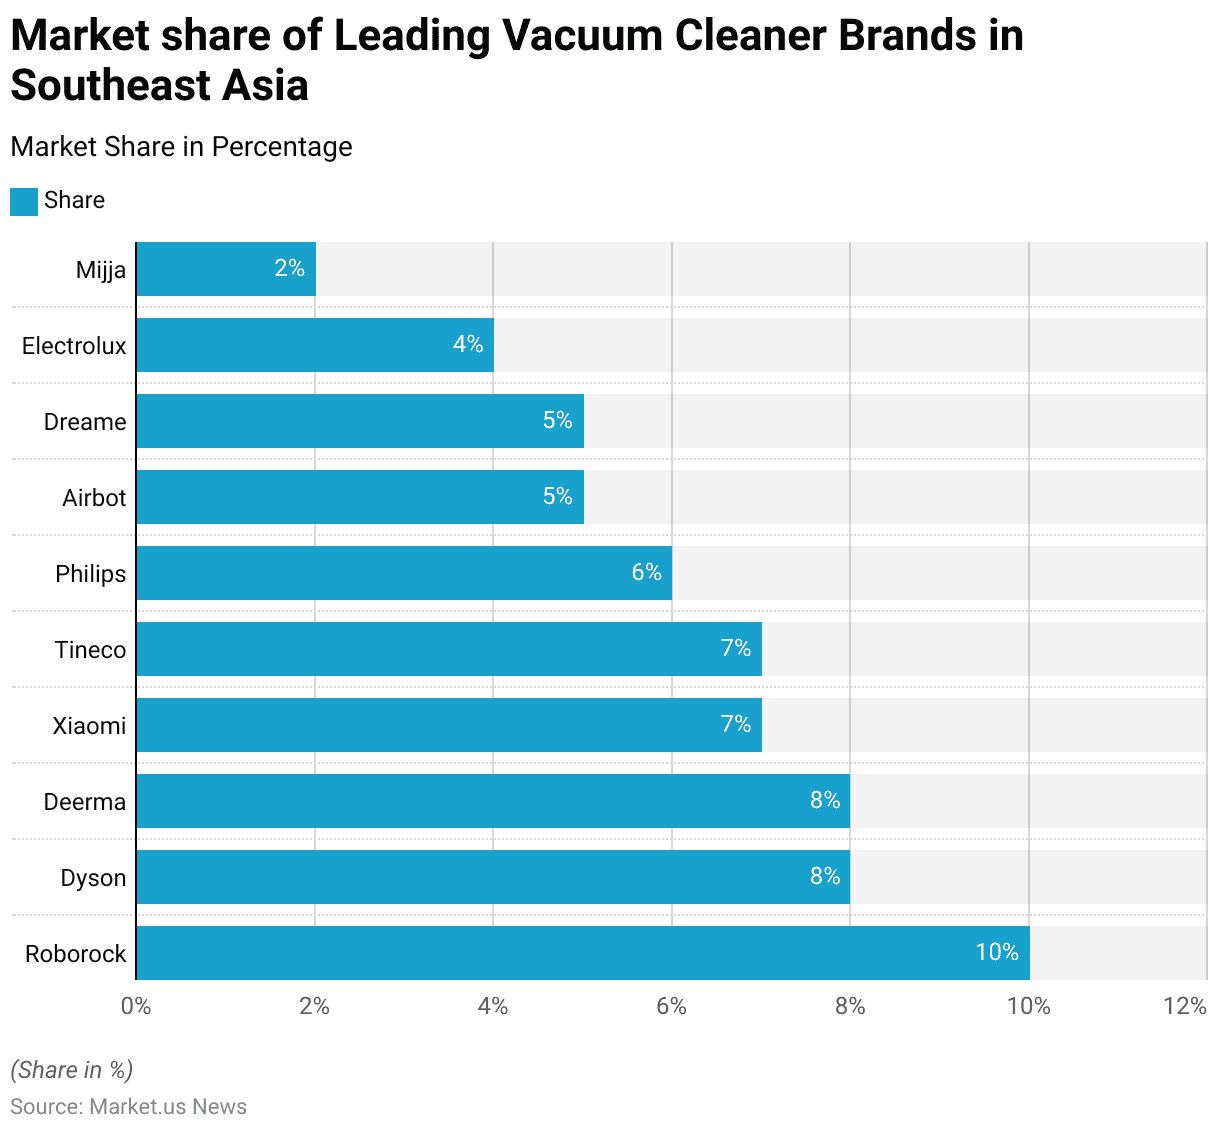
- As of February 2023, the vacuum cleaner market in Southeast Asia was led by Roborock, which held a 10% market share.
- Dyson and Deerma followed closely, each capturing 8% of the market.
- Xiaomi and Tineco both accounted for 7% of market shares, reflecting their strong presence in the region.
- Philips secured a 6% share, while Airbot and Dreame each held 5% of the market.
- Electrolux maintained a 4% share, and Mijja rounded out the list with a 2% share.
- This distribution highlights a competitive market landscape with a mix of established global players and regional brands vying for market dominance.
(Source: Statista)
Robotic Vacuum Cleaner Market Revenue Share in the North American Market – By Brand Statistics
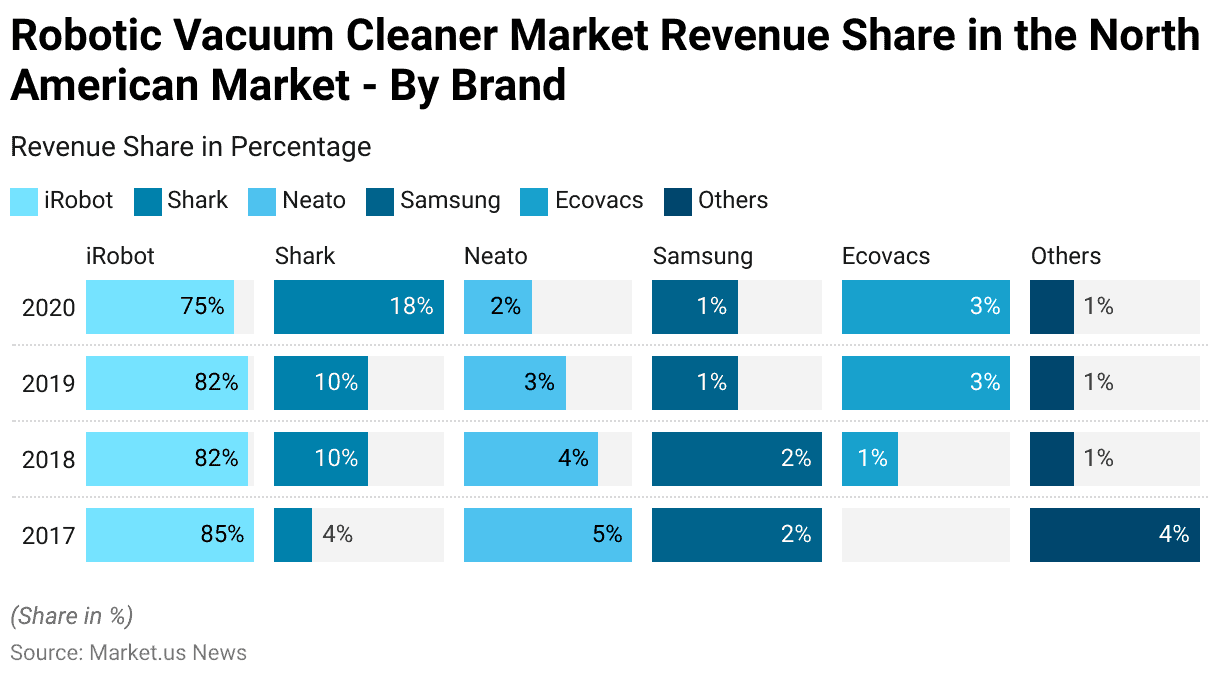
- From 2017 to 2020, the North American robotic vacuum cleaner market experienced notable shifts in brand revenue shares.
- iRobot consistently dominated the market, though its share declined from 85% in 2017 to 75% in 2020.
- Shark emerged as a strong competitor, increasing its market share from 4% in 2017 to 18% in 2020, reflecting rapid growth in consumer preference for its products.
- Neato’s market share steadily decreased from 5% in 2017 to 2% in 2020, while Samsung maintained a minor share, declining from 2% in 2017 and 2018 to 1% in 2019 and 2020.
- Ecovacs entered the market in 2018 with a 1% share, growing to 3% by 2019 and maintaining that position through 2020.
- The “Others” category, representing smaller brands, saw a significant drop in market share from 4% in 2017 to just 1% from 2018 onward, highlighting the concentration of market power among the leading players.
(Source: Statista)
Production Volume of Household Vacuum Cleaner Statistics
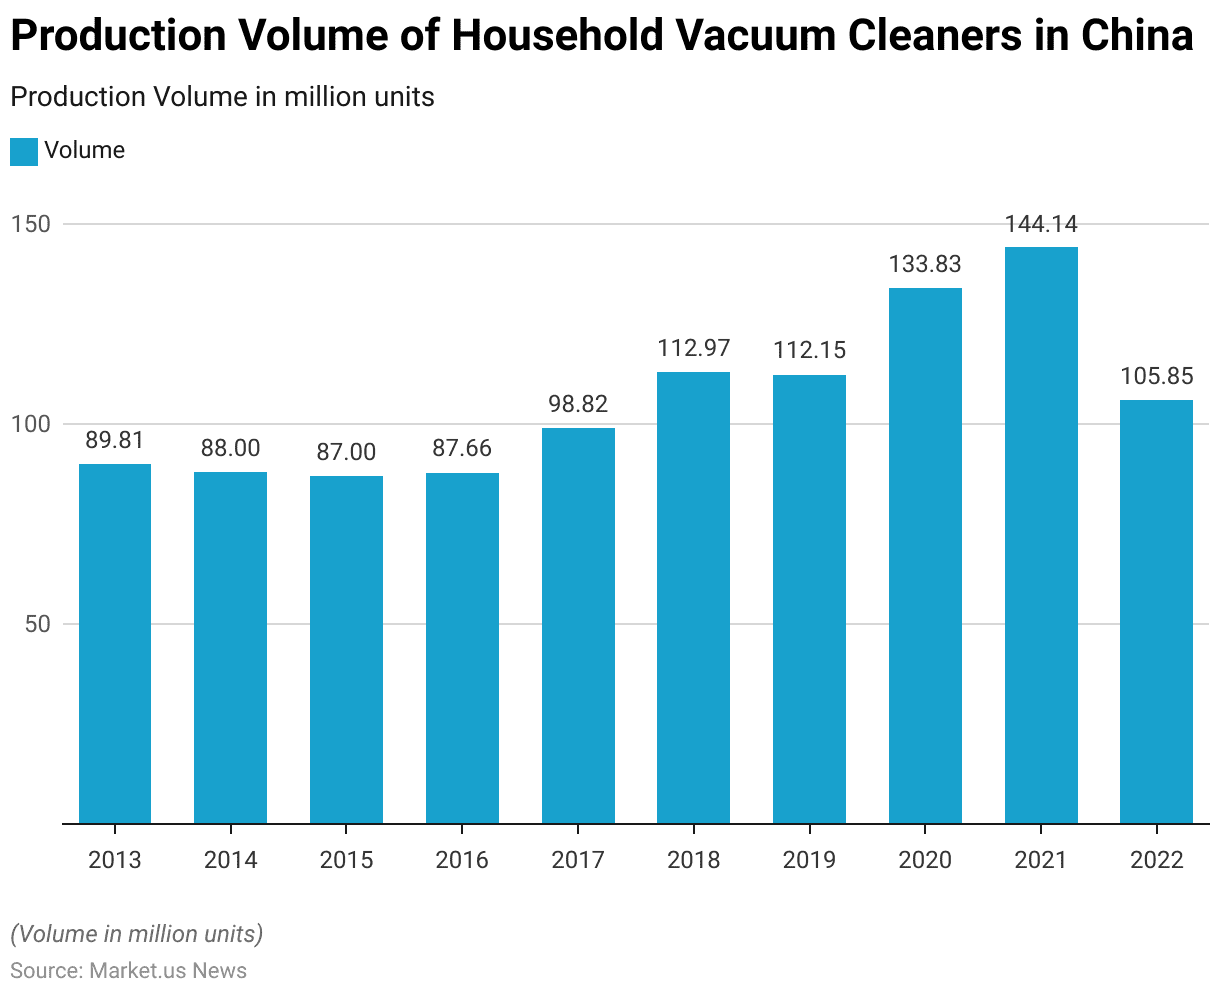
- Between 2013 and 2022, the production volume of household vacuum cleaners in China exhibited significant fluctuations.
- In 2013, production stood at 89.81 million units, followed by slight declines in 2014 and 2015, with 88 million and 87 million units produced, respectively.
- This trend continued into 2016, with a marginal increase to 87.66 million units.
- In 2017, production volume rebounded significantly to 98.82 million units, marking the beginning of a growth phase.
- The upward trend continued in 2018 and 2019, with production volumes reaching 112.97 million and 112.15 million units, respectively.
- The industry experienced a substantial surge in 2020, with production soaring to 133.83 million units, and peaked in 2021 at 144.14 million units, reflecting heightened demand, possibly due to the pandemic-driven focus on home hygiene.
- However, in 2022, production declined to 105.85 million units, signaling a potential market adjustment or reduced demand.
- This data highlights the dynamic nature of China’s household vacuum cleaner production over the decade.
(Source: Statista)
Vacuum Cleaners Import Statistics
Import of Parts of Vacuum Cleaner Statistics
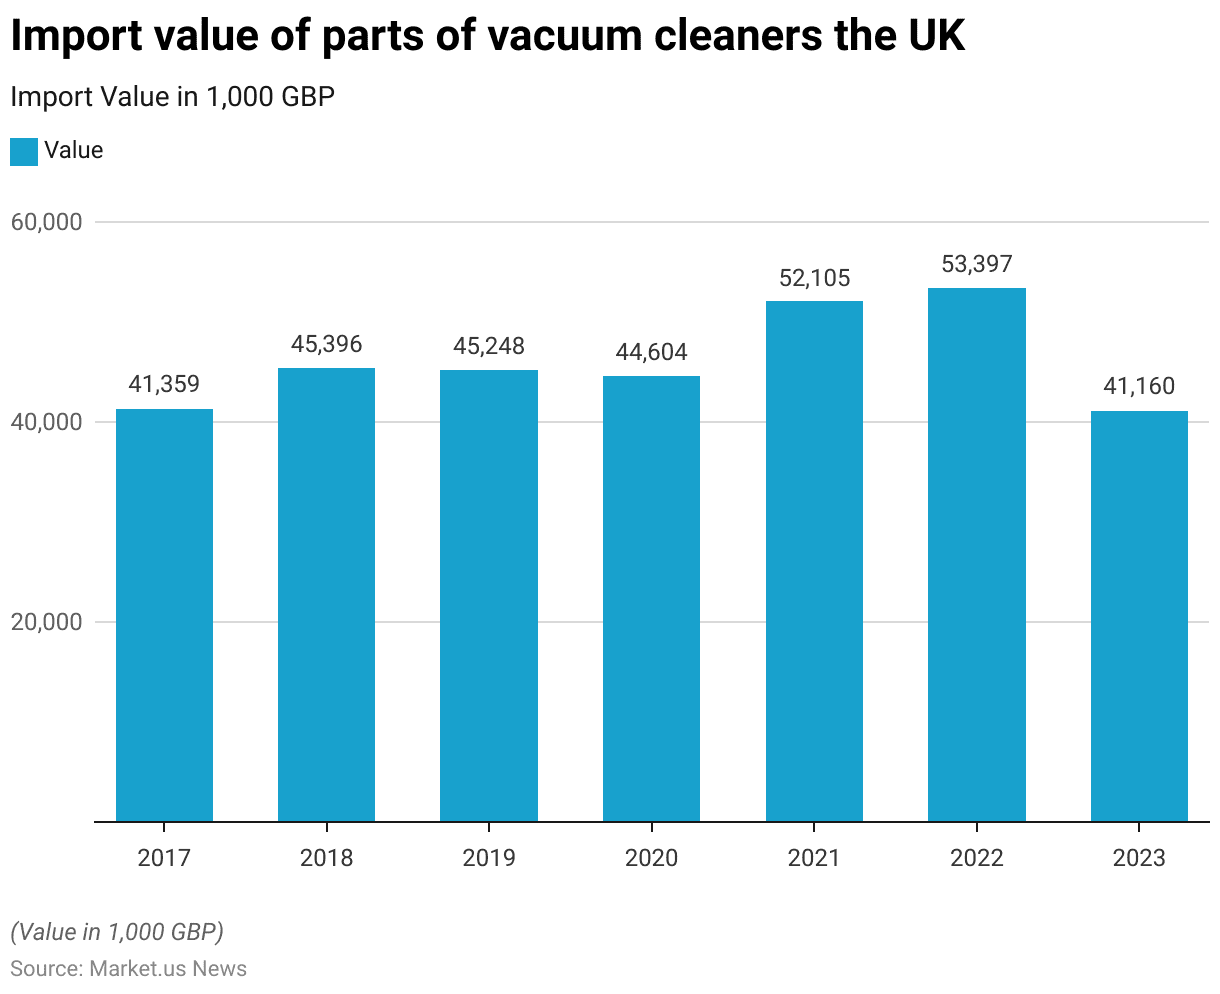
- From 2017 to 2023, the import value of vacuum cleaner parts in the United Kingdom exhibited a fluctuating trend.
- In 2017, imports totaled £41,359,000, which rose steadily to £45,396,000 in 2018.
- The figure remained relatively stable in 2019, at £45,248,000, before slightly decreasing to £44,604,000 in 2020.
- A significant increase was observed in 2021, with the import value reaching £52,105,000, followed by a further rise to £53,397,000 in 2022, marking the highest value during the period.
- However, in 2023, imports dropped sharply to £41,160,000, reflecting a return to levels similar to 2017.
- These fluctuations suggest varying demand and potential supply chain adjustments over the years.
(Source: Statista)
Import of Vacuum Cleaners with a Capacity of <20 liters Statistics
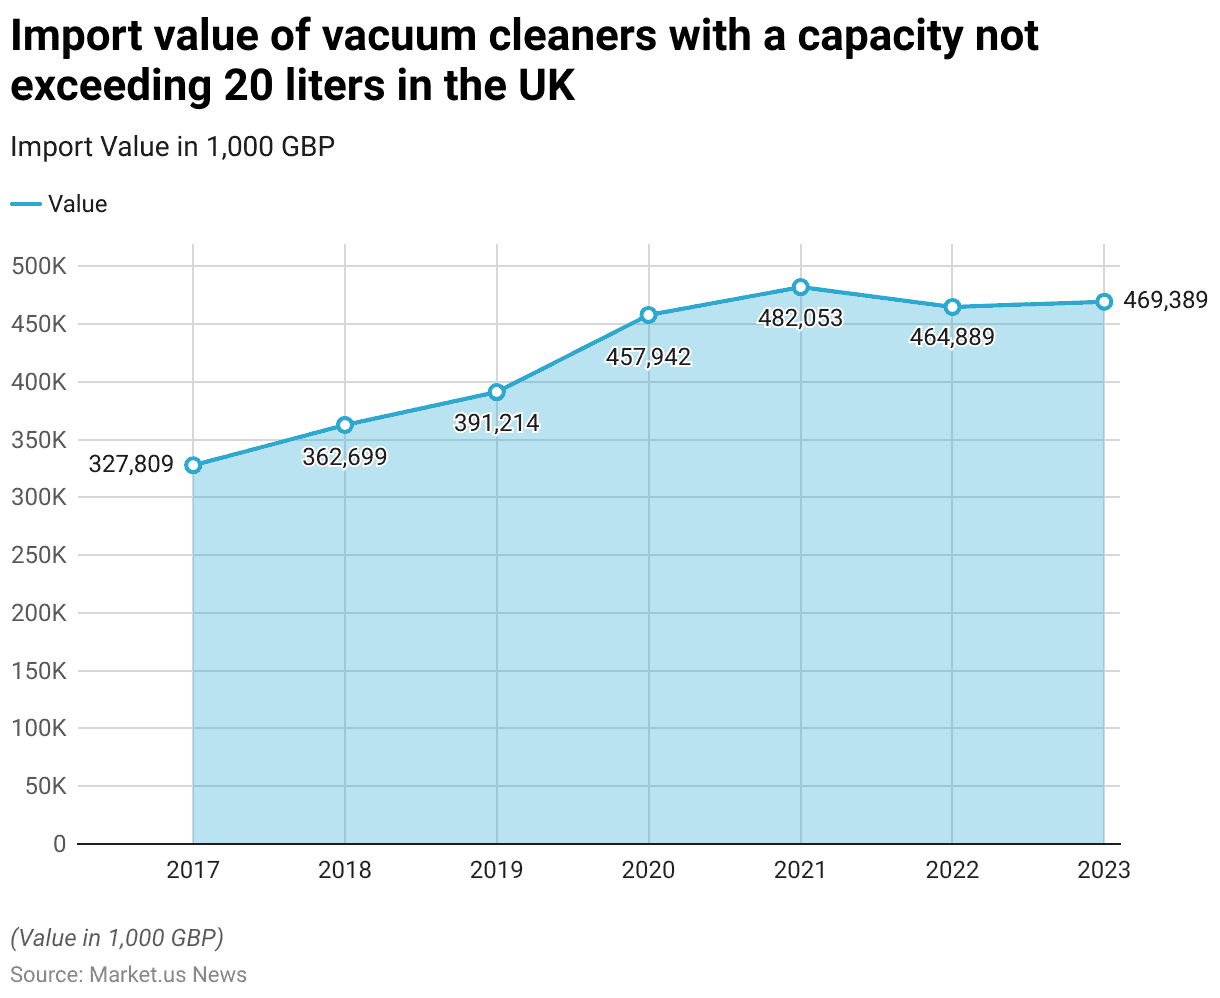
- Between 2017 and 2023, the import value of vacuum cleaners with a capacity not exceeding 20 liters in the United Kingdom showed a consistent upward trend, with minor fluctuations.
- In 2017, the import value was £327,809,000, increasing to £362,699,000 in 2018 and further to £391,214,000 in 2019.
- A significant rise occurred in 2020, with imports reaching £457,942,000.
- This upward momentum continued into 2021, where the import value peaked at £482,053,000, marking the highest value during this period.
- In 2022, imports slightly decreased to £464,889,000 but rebounded in 2023 to £469,389,000.
- These figures highlight a growing demand for compact vacuum cleaners in the UK, with steady growth over the six years.
(Source: Statista)
Consumer Preferences and Trends
Key Factors When Purchasing a Vacuum Among Consumers
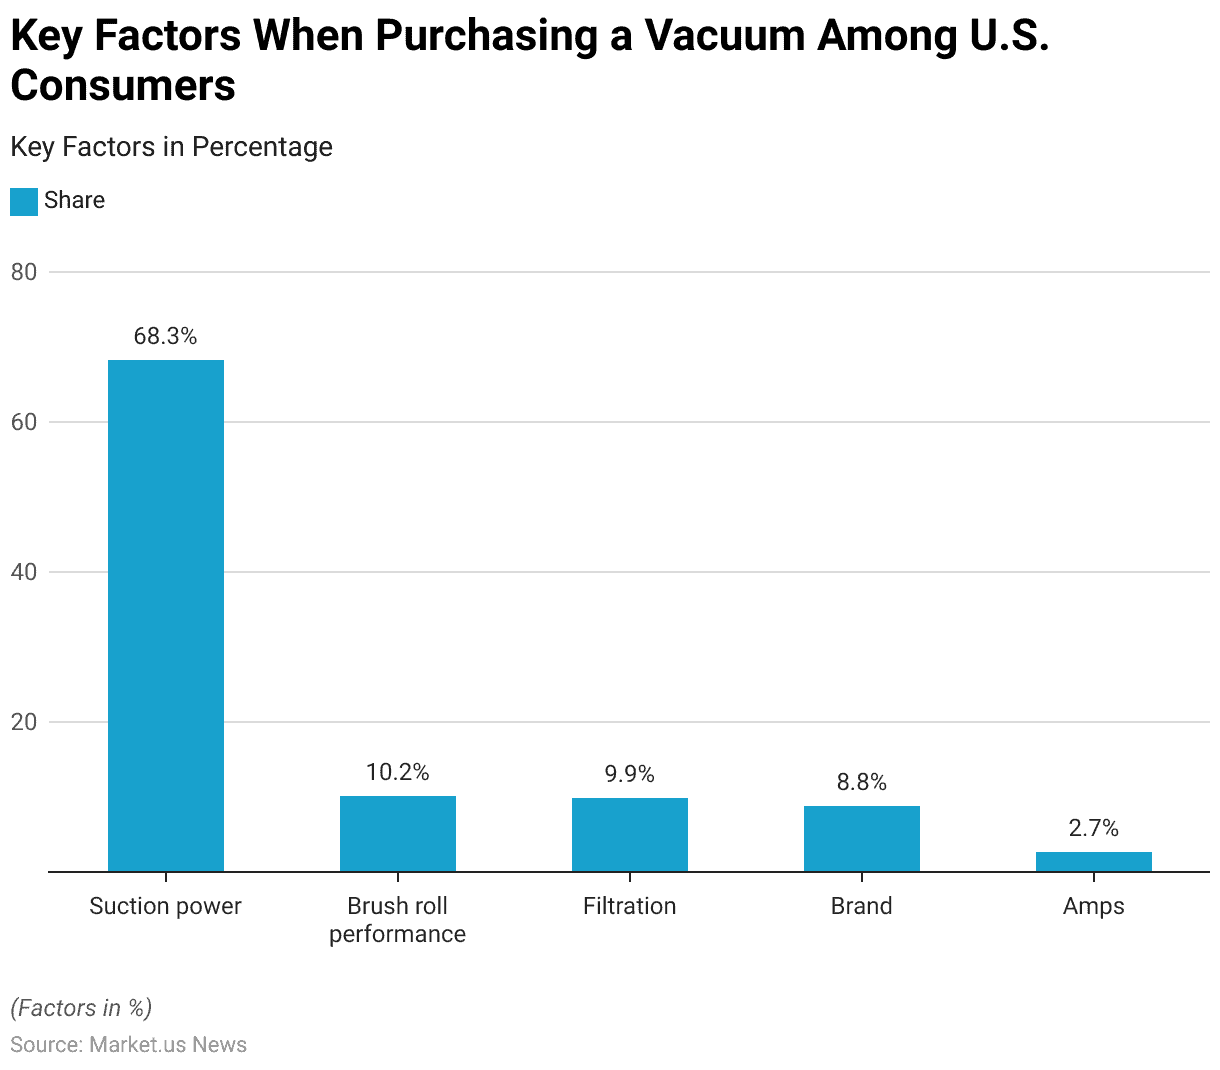
- As of 2018, suction power was the most critical factor for U.S. consumers when purchasing a vacuum cleaner, with 68.3% of respondents identifying it as their top priority.
- Brush roll performance ranked a distant second, influencing 10.2% of consumers.
- Filtration systems were the primary consideration for 9.9% of respondents, while brand loyalty played a role for 8.8% of buyers.
- Amps, representing the electrical power of the vacuum, were the least important factor, cited by only 2.7% of respondents.
- These preferences highlight the emphasis consumers place on effective cleaning performance over other features.
(Source: Statista)
Criteria for Selecting a Vacuum Cleaner Statistics
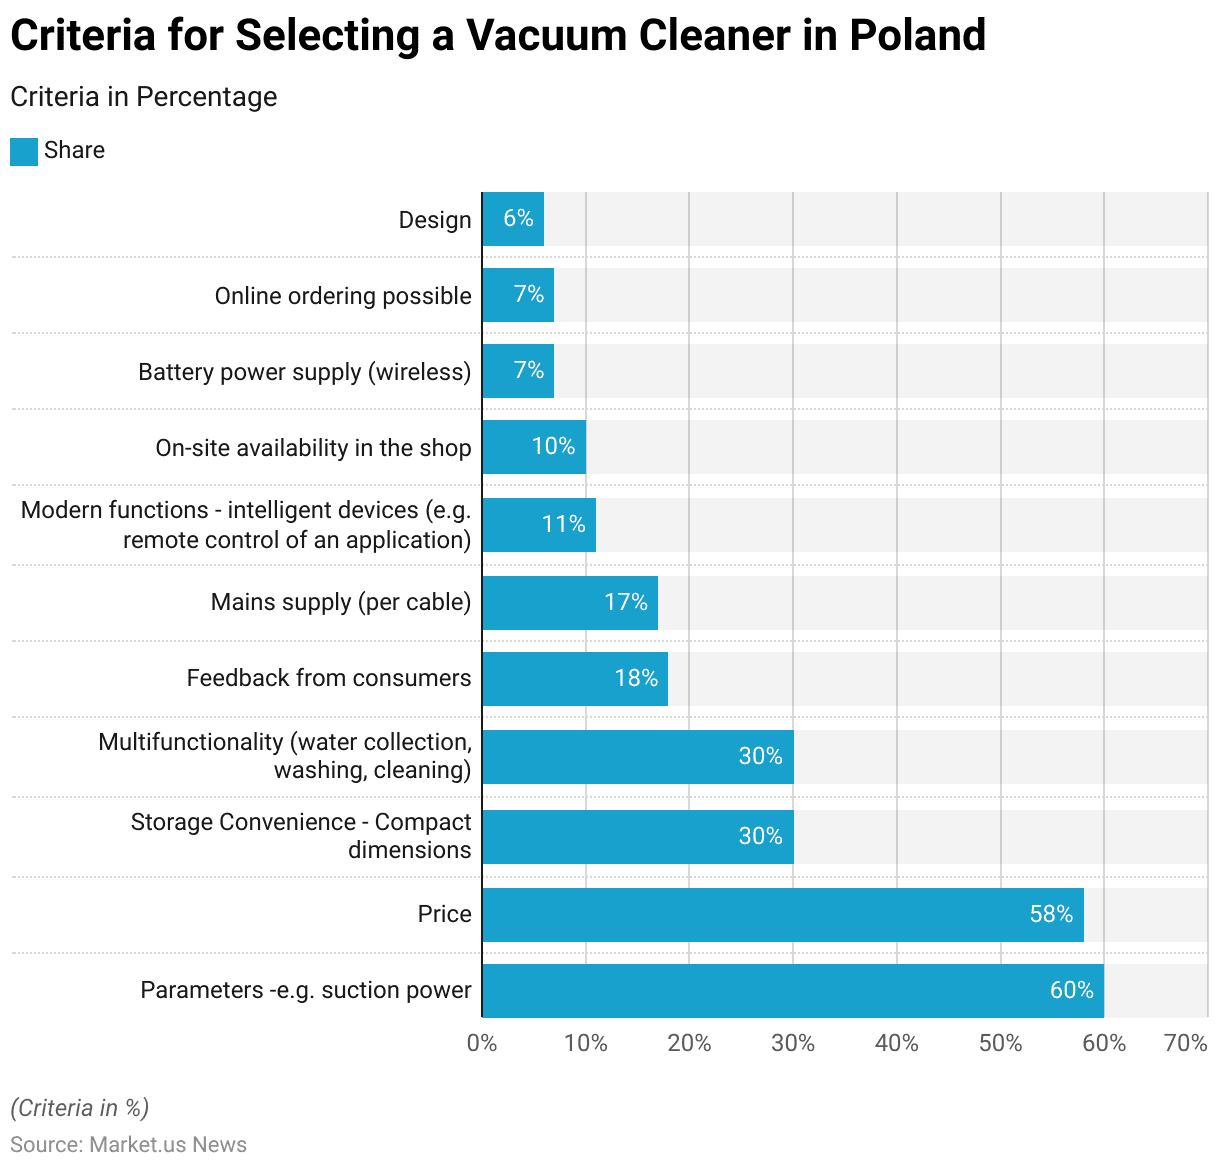
- In 2018, Polish consumers prioritized several criteria when selecting a vacuum cleaner.
- The most important factor was performance-related parameters, such as suction power, with 60% of respondents considering it crucial.
- Price was another significant consideration, influencing 58% of buyers.
- Storage conveniences, such as compact dimensions and multifunctionality (e.g., water collection, washing, and cleaning), were each important to 30% of respondents.
- Feedback from other consumers played a role for 18%, while 17% valued a mains power supply via cable.
- Modern features, such as intelligent functions and remote control via an app, appealed to 11% of respondents.
- On-site availability in physical stores was a factor for 10%, while battery power supply (wireless) and the ability to order online were each noted by 7%.
- Design was the least important factor, influencing just 6% of respondents.
- This data highlights a strong emphasis on performance and cost, with growing interest in convenience and advanced functionality.
(Source: Statista)
Vacuum Products Most Likely to be Purchased Among Consumers
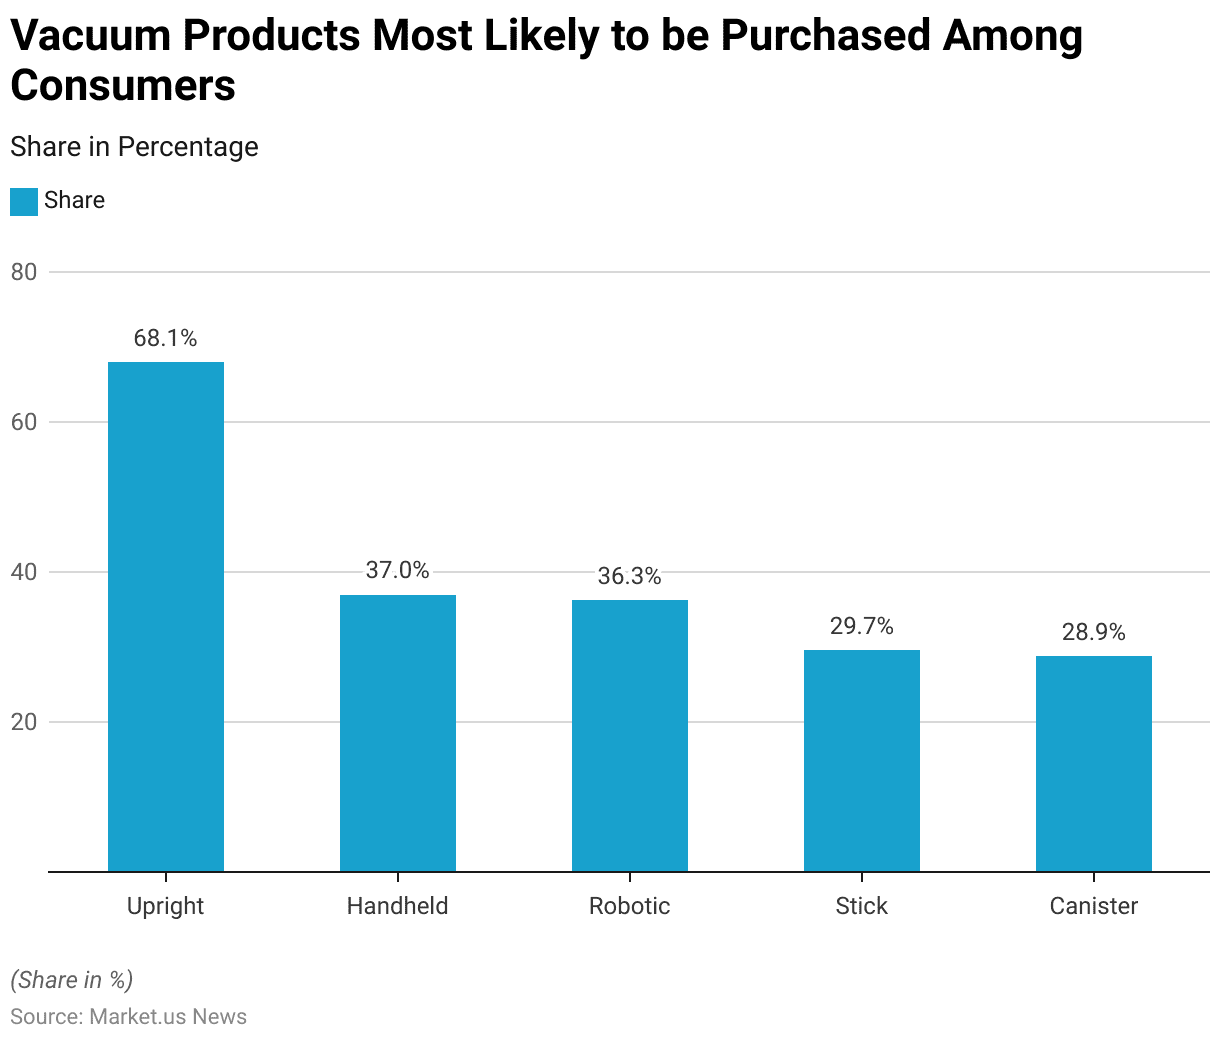
- In 2018, U.S. consumers showed a strong preference for upright vacuum cleaners, with 68.1% of respondents indicating they were the most likely product to be purchased within the next 12 months.
- Handheld vacuums were the second most popular choice, favored by 37% of respondents.
- Robotic vacuums closely followed, with 36.3% expressing interest in purchasing one, reflecting the growing demand for automated cleaning solutions.
- Stick vacuums were preferred by 29.7% of consumers, while canister vacuums garnered interest from 28.9%.
- This data highlights a diverse range of preferences, with traditional upright models leading the market, but significant interest is also present in more compact and automated options.
(Source: Statista)
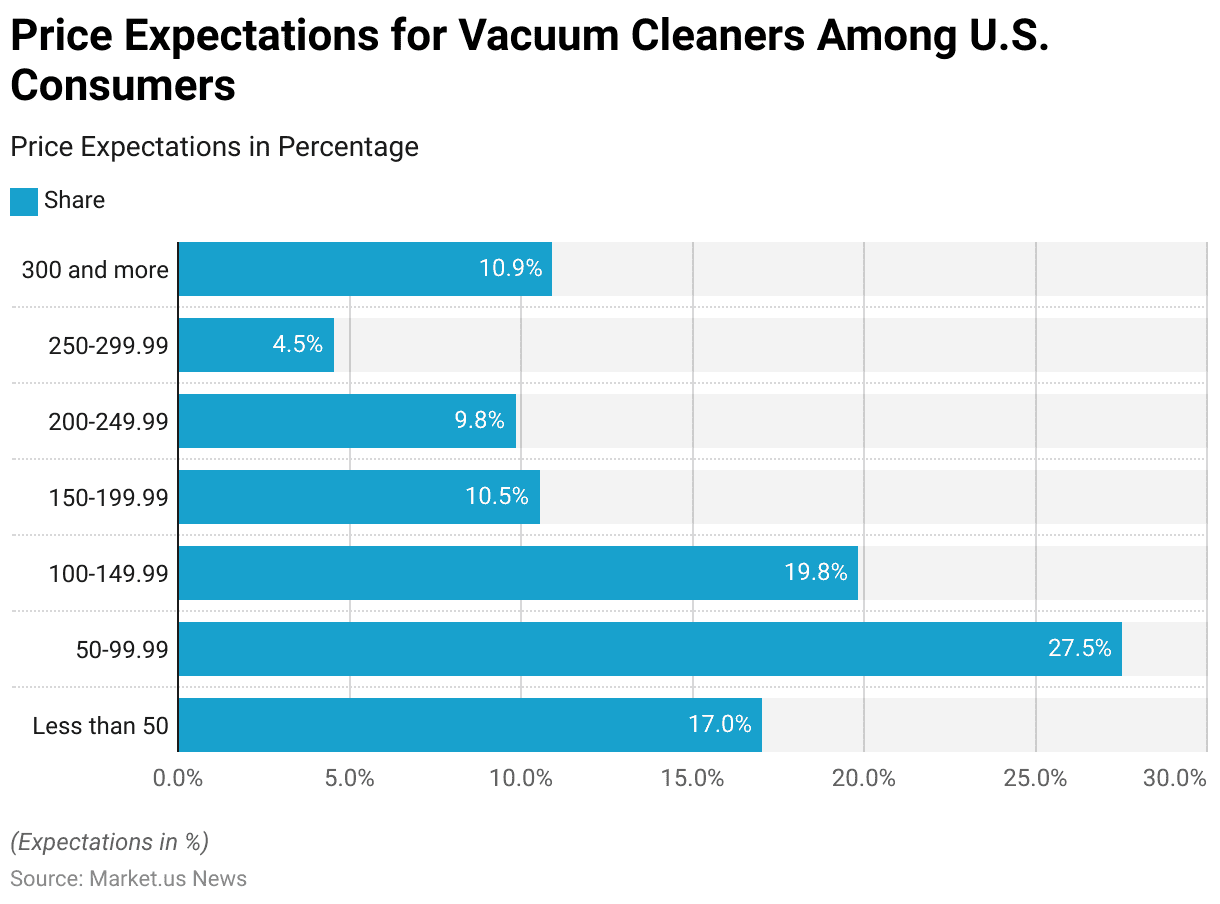
Price Expectations for Vacuum Cleaner Among Consumers Statistics
- In 2018, U.S. consumers exhibited diverse price expectations for vacuum cleaners.
- The most popular price range was between $50 and $99.99, with 27.5% of respondents expecting to pay within this bracket.
- This was followed by 19.8% of consumers who anticipated spending between $100 and $149.99.
- Additionally, 17% of respondents expected to pay less than $50, highlighting a significant demand for budget-friendly options.
- For higher price ranges, 10.5% of consumers were willing to spend between $150 and $199.99, while 9.8% anticipated paying between $200 and $249.99.
- Only 4.5% expected to pay between $250 and $299.99, but a notable 10.9% were prepared to invest $300 or more, reflecting a segment of the market inclined towards premium models.
- This distribution underscores a wide spectrum of consumer spending preferences, with a significant leaning toward mid-range and budget-friendly products.
(Source: Statista)
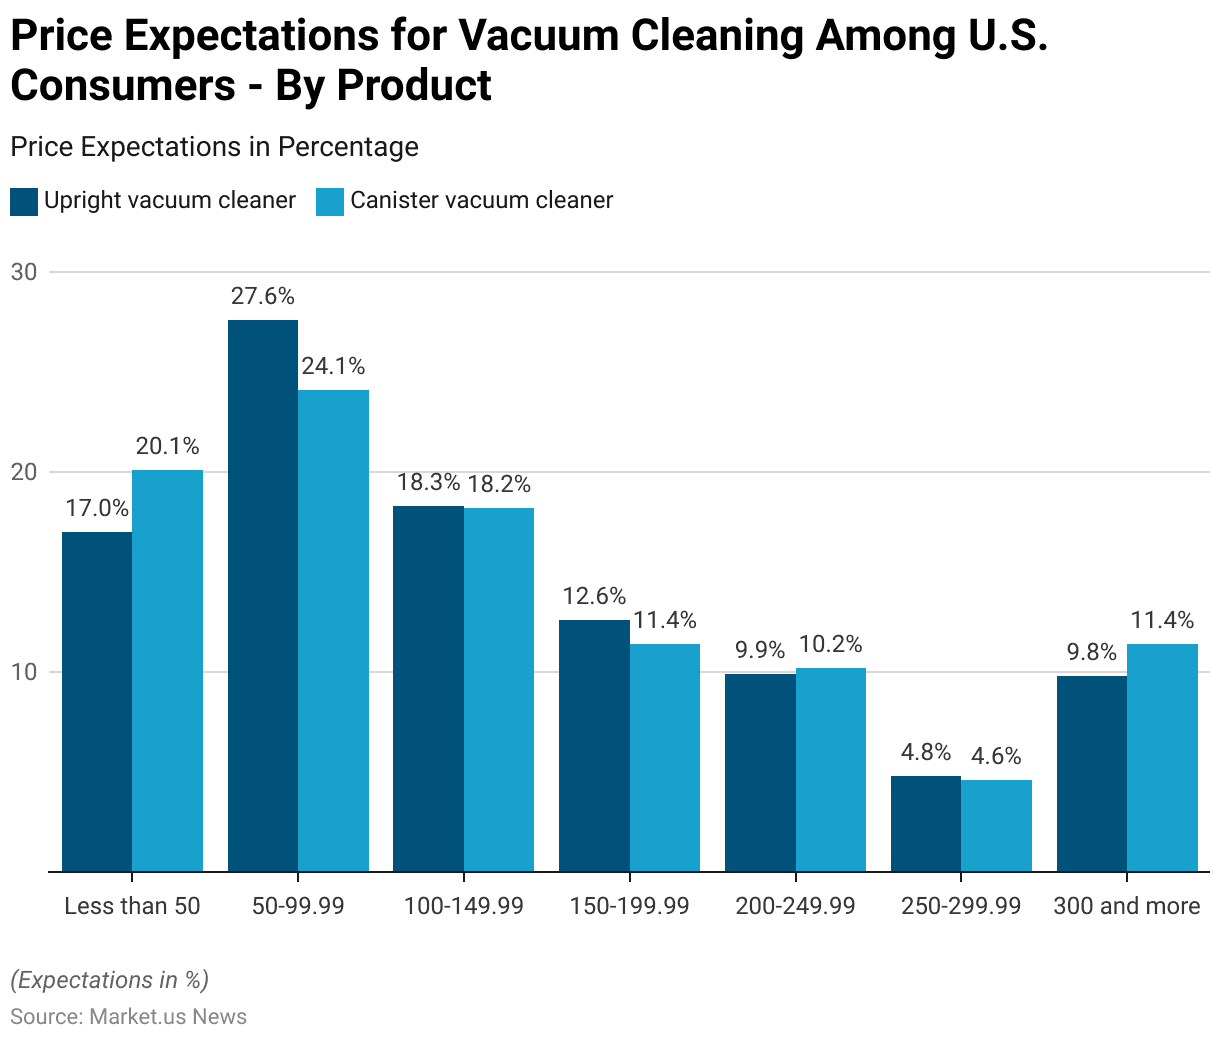
Price Expectations for Vacuum Cleaning Among Consumers – By Product
- In 2017, U.S. consumers exhibited varying price expectations for upright and canister vacuum cleaners.
- Among upright vacuum buyers, 27.6% anticipated spending between $50 and $99.99, making it the most preferred price range.
- This was followed by 18.3% expecting to pay between $100 and $149.99 and 17% aiming for budget models priced below $50.
- Higher price ranges for upright vacuums saw 12.6% willing to spend $150 to $199.99, while 9.9% were prepared to pay between $200 and $249.99.
- Only 4.8% expected to spend between $250 and $299.99, and 9.8% anticipated paying $300 or more.
- In contrast, 24.1% of canister vacuum buyers expected to spend $50 to $99.99, and 20.1% looked for models under $50.
- The $100 to $149.99 range attracted 18.2% of respondents.
- Meanwhile, 11.4% anticipated spending $150 to $199.99 or $300 and above, while 10.2% expected to pay between $200 and $249.99, and 4.6% targeted the $250 to $299.99 range.
- These findings highlight consumer preferences for mid-range and budget options across both vacuum types, with a slightly higher willingness to pay premium prices for canister models.
(Source: Statista)
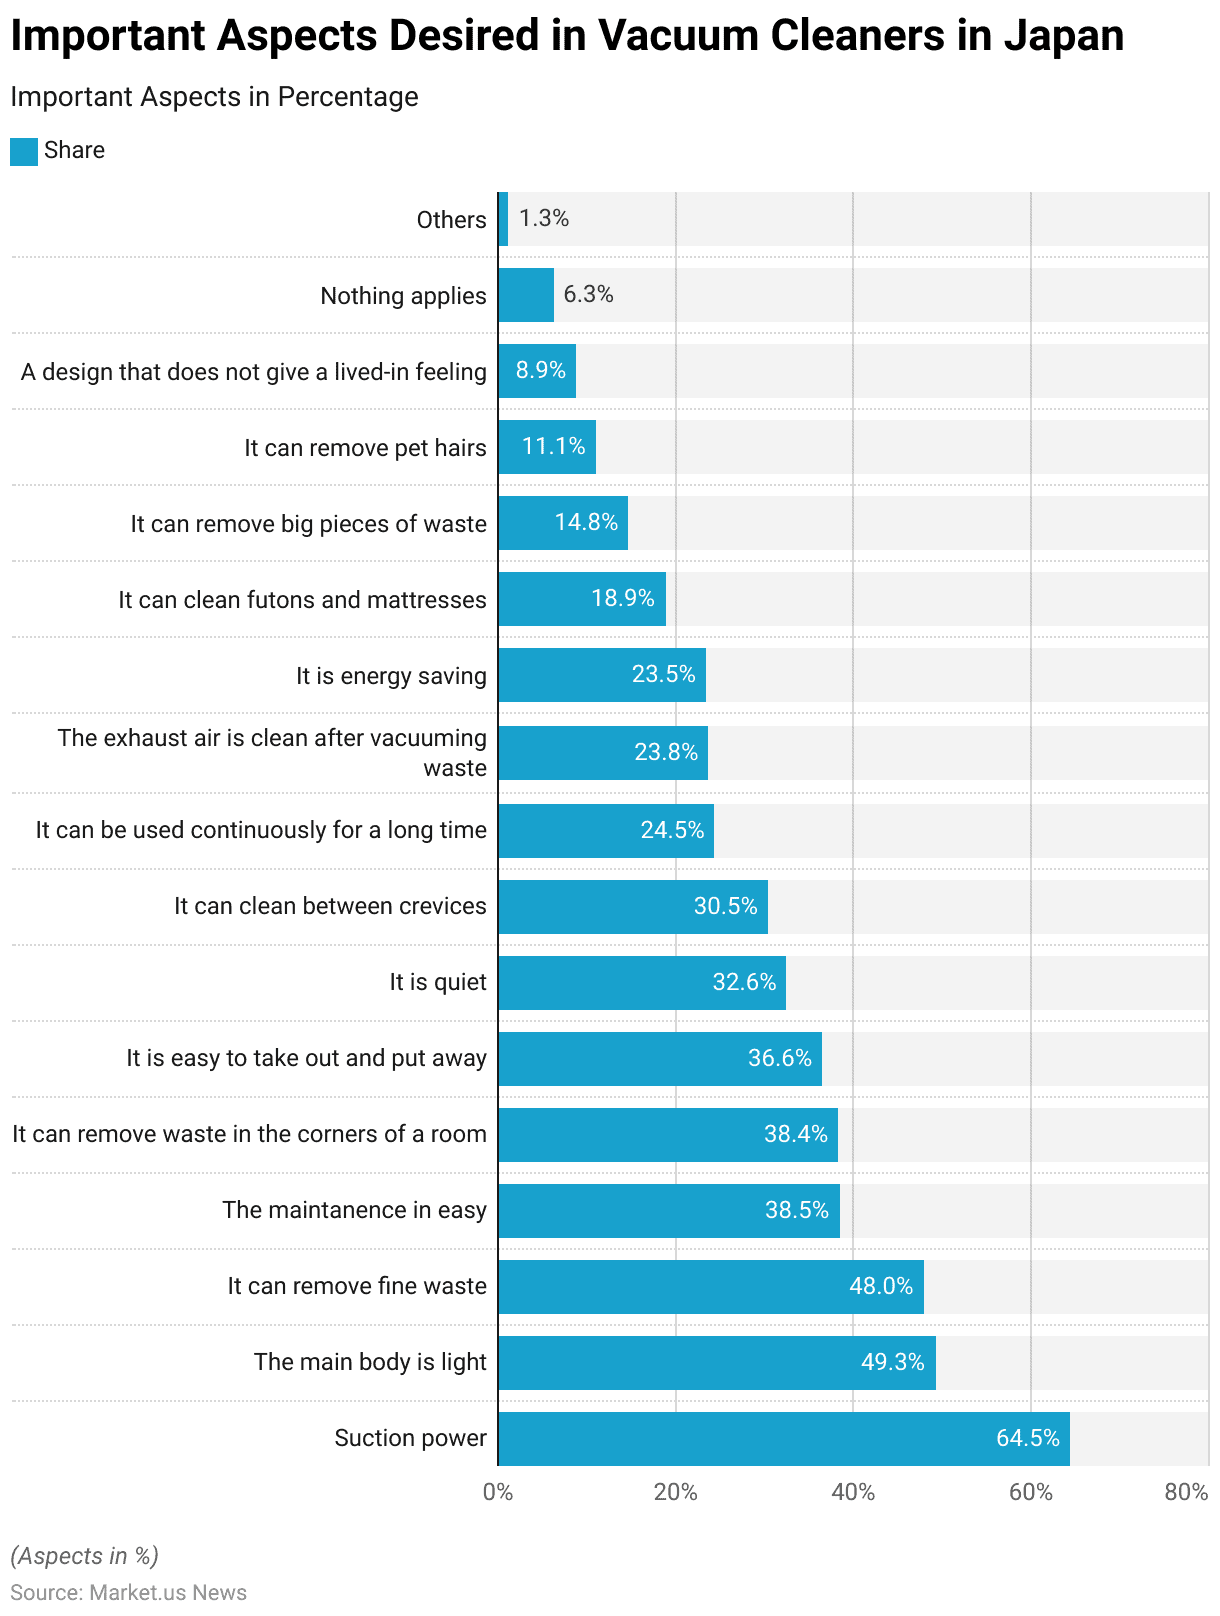
Important Aspects Desired in Vacuum Cleaner Statistics
- As of March 2022, Japanese consumers valued several key aspects when selecting vacuum cleaners.
- Suction power was the top priority, with 64.5% of respondents citing it as the most important feature.
- The weight of the vacuum’s main body was significant for 49.3%, while 48% emphasized the ability to remove fine waste.
- Ease of maintenance ranked high at 38.5%, closely followed by the capability to clean waste from room corners at 38.4%.
- The convenience of easy storage and retrieval was crucial for 36.6% and 32.6% valued quiet operation.
- Additionally, 30.5% of respondents prioritized the ability to clean between crevices, and 24.5% appreciated vacuums that could operate continuously for extended periods.
- Clean exhaust air post-vacuuming and energy efficiency were important to 23.8% and 23.5% of respondents, respectively.
- Cleaning capabilities for futons and mattresses appealed to 18.9%, while 14.8% valued the removal of large waste pieces.
- The ability to tackle pet hair was noted by 11.1% and 8.9% preferred designs that minimized a “lived-in” appearance.
- Only 6.3% of respondents felt none of these aspects were relevant, with 1.3% mentioning other considerations.
- This data underscores the diverse consumer expectations for vacuum cleaners in Japan, balancing functionality, convenience, and design.
(Source: Statista)
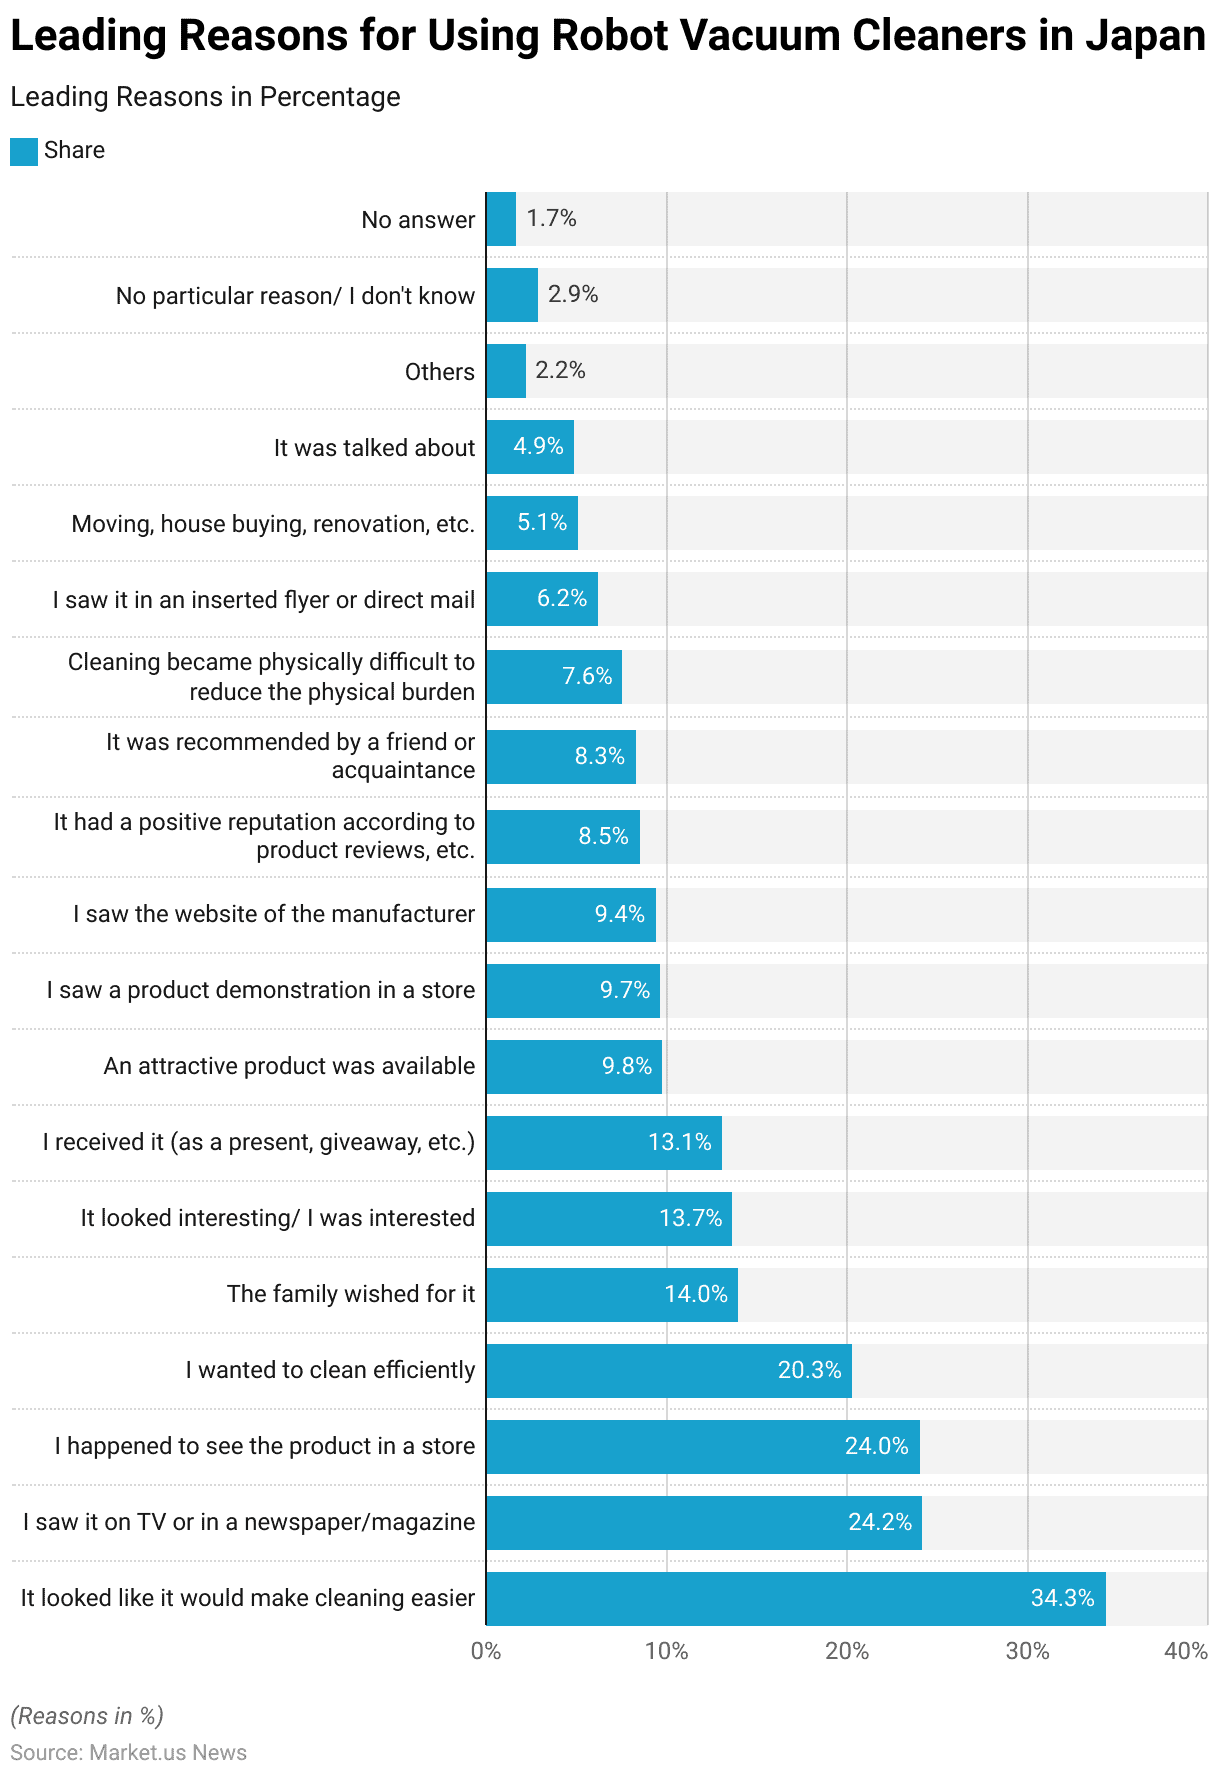
Leading Reasons for Using Robot Vacuum Cleaner Statistics
- As of February 2020, the leading reason for using robot vacuum cleaners in Japan was the perception that they would make cleaning easier, cited by 34.3% of respondents.
- Media exposure also played a significant role, with 24.2% of consumers influenced by seeing the product on TV or in newspapers and magazines. In comparison, 24% were motivated by encountering the product in stores.
- Efficiency in cleaning was another key factor, driving 20.3% of respondents to adopt robot vacuums.
- Family influence was noted by 14% of users, while 13.7% found the product interesting or appealing. Another 13.1% received robot vacuums as gifts or giveaways.
- Attractive product availability motivated 9.8%, and in-store demonstrations influenced 9.7%.
- Manufacturer websites and product reviews also impacted decisions, with 9.4% and 8.5% of respondents, respectively, mentioning these sources.
- Recommendations from friends or acquaintances played a role for 8.3%, and 7.6% turned to robot vacuums due to physical difficulty with traditional cleaning methods.
- Other factors included exposure through flyers or direct mail (6.2%), lifestyle changes such as moving or renovation (5.1%), and general buzz around the product (4.9%).
- A small portion cited other reasons (2.2%), had no specific reason (2.9%), or did not provide an answer (1.7%).
- This data reflects a mix of practical, social, and promotional factors driving the adoption of robot vacuum cleaners in Japan.
(Source: Statista)
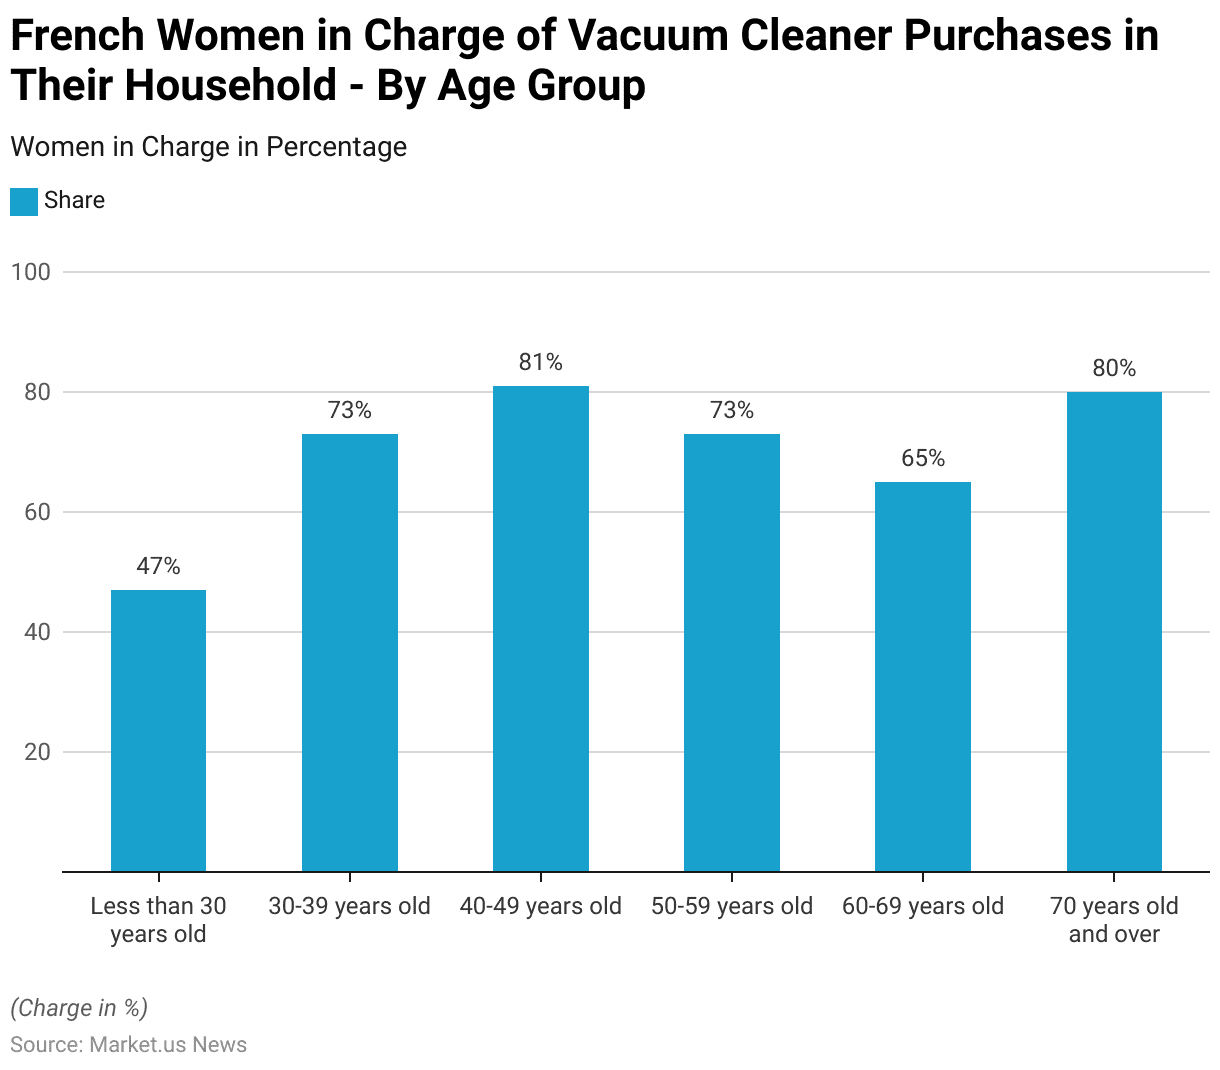
Women in Charge of Vacuum Cleaner Purchases in Their Household Statistics
- In 2019, the responsibility for purchasing vacuum cleaners in French households varied significantly across age groups among women.
- Among those under 30 years old, 47% were in charge of this purchase, the lowest proportion across all age groups.
- The share rose significantly to 73% for women aged 30-39 years and further peaked at 81% among those aged 40-49 years, the highest level recorded.
- Similarly, 73% of women aged 50-59 years were responsible for vacuum cleaner purchases.
- The proportion slightly declined to 65% for women aged 60-69 years but rose again to 80% for those aged 70 years and older.
- These figures highlight that middle-aged and older women in France were more likely to handle the purchase of vacuum cleaners in their households compared to younger age groups.
(Source: Statista)
Vacuum Cleaner Spending Statistics
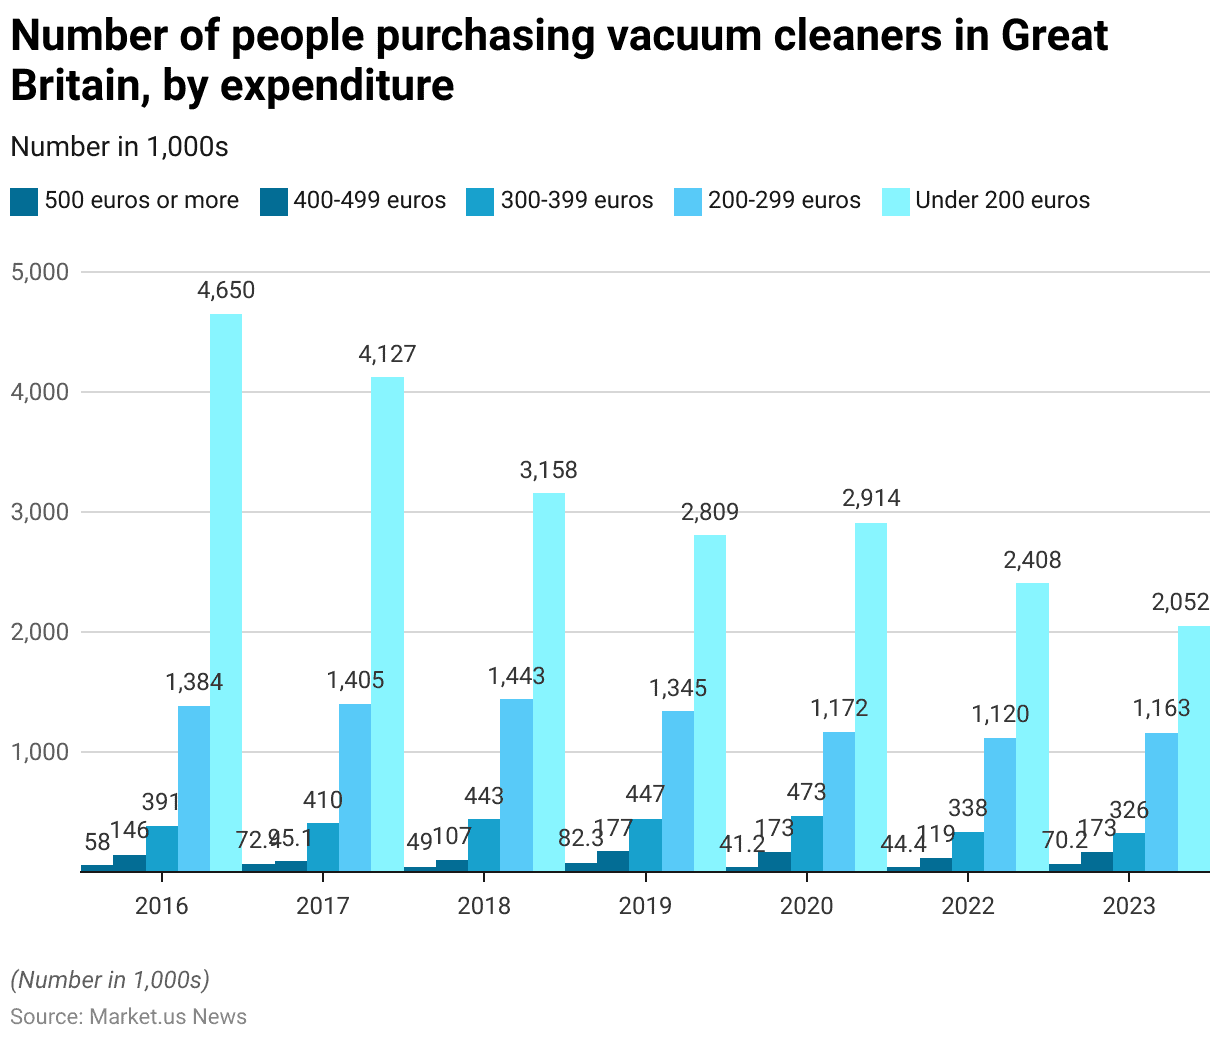
Expenditure on Vacuum Cleaners in Great Britain
- Between 2016 and 2023, the number of vacuum cleaner purchasers in Great Britain showed notable shifts across different expenditure categories.
- In 2016, the majority of consumers (4.65 million) spent under 200 euros, while only 58,000 people spent 500 euros or more.
- The mid-range categories of 200-299 euros and 300-399 euros accounted for 1.38 million and 391,000 buyers, respectively, while 146,000 spent between 400-499 euros.
- By 2017, the number of high-end buyers (500 euros or more) increased to 72,400, while those spending under 200 euros decreased to 4.13 million. Purchases in the 300-399 euros and 200-299 euros ranges rose slightly to 410,000 and 1.41 million, respectively.
- In 2018, spending patterns shifted further, with 3.16 million consumers purchasing vacuums under 200 euros, while 49,000 spent 500 euros or more.
- The trend towards higher spending continued in 2019, with 82,300 buyers in the 500 euros or more category and 177,000 in the 400-499 euros range. Meanwhile, those spending under 200 euros declined to 2.81 million.
- In 2020, the number of high-end buyers dropped to 41,200, while mid-range purchases (200-299 euros) decreased to 1.17 million, and 2.91 million spent under 200 euros.
- In 2022, 44,400 people spent 500 euros or more, with a further decline in the under-200 euros category to 2.41 million.
- By 2023, high-end buyers rose to 70,200, while the under-200 euros category saw a significant drop to 2.05 million.
- These shifts indicate a gradual move towards higher-priced vacuum cleaners, suggesting an increased demand for premium models over time.
(Source: Statista)
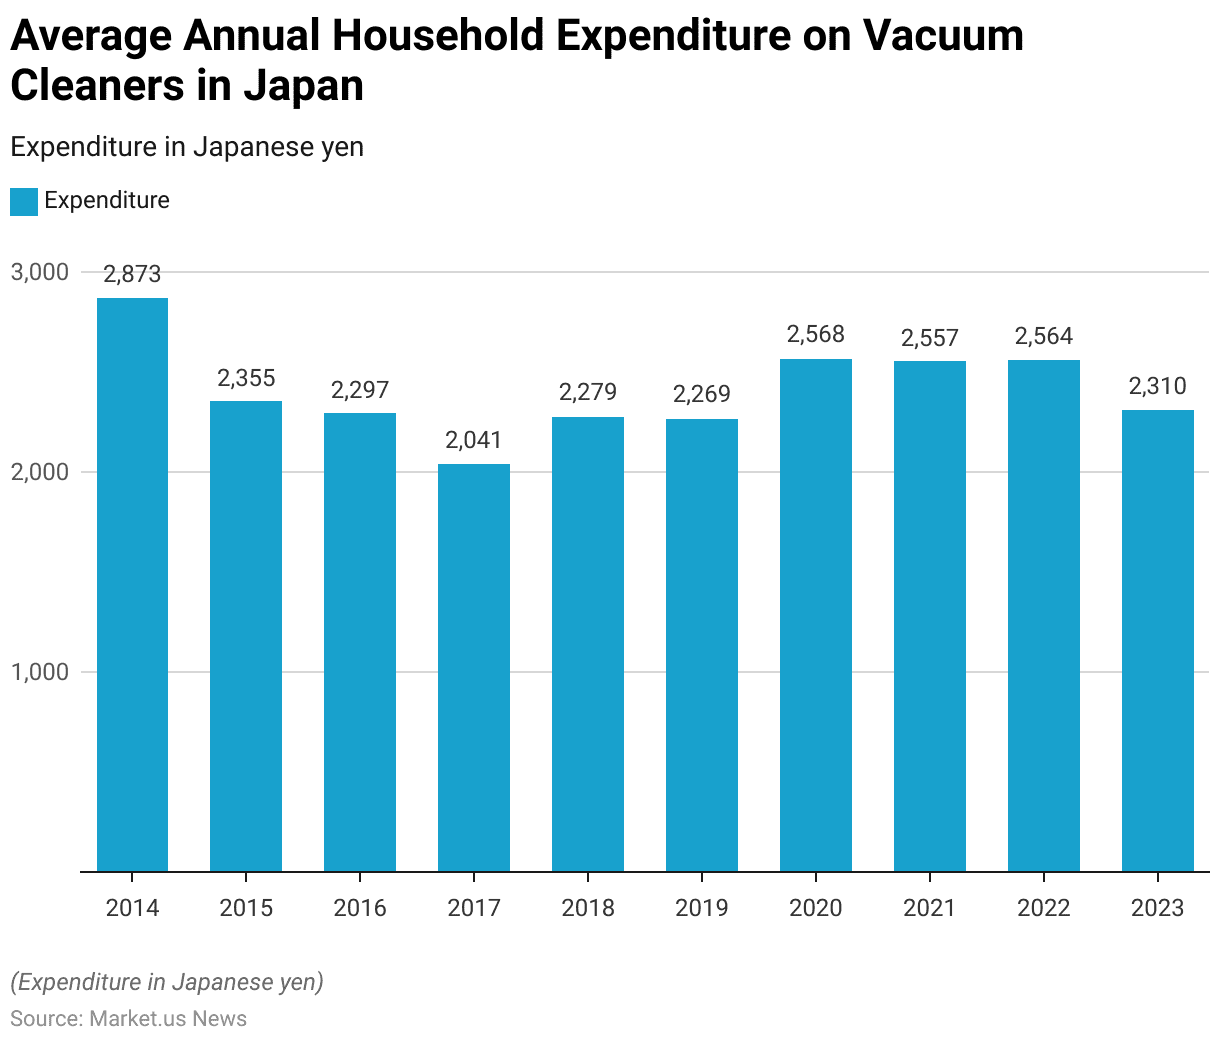
Vacuum Cleaner Household Expenditure in Japan
- Between 2014 and 2023, the average annual household expenditure on vacuum cleaners in Japan exhibited a fluctuating trend.
- In 2014, households spent an average of 2,873 yen, marking the highest expenditure during the period.
- This figure declined sharply to 2,355 yen in 2015 and continued to decrease, reaching 2,297 yen in 2016 and 2,041 yen in 2017, the lowest point in the decade.
- However, spending began to recover in 2018, increasing to 2,279 yen and remaining relatively stable in 2019 at 2,269 yen.
- In 2020, expenditures rose significantly to 2,568 yen, a level sustained through 2021 and 2022, with households spending 2,557 yen and 2,564 yen, respectively.
- By 2023, the average annual expenditure decreased slightly to 2,310 yen.
- These variations suggest changing consumer preferences, possibly influenced by new product introductions, technological advancements, and shifts in household purchasing power.
(Source: Statista)
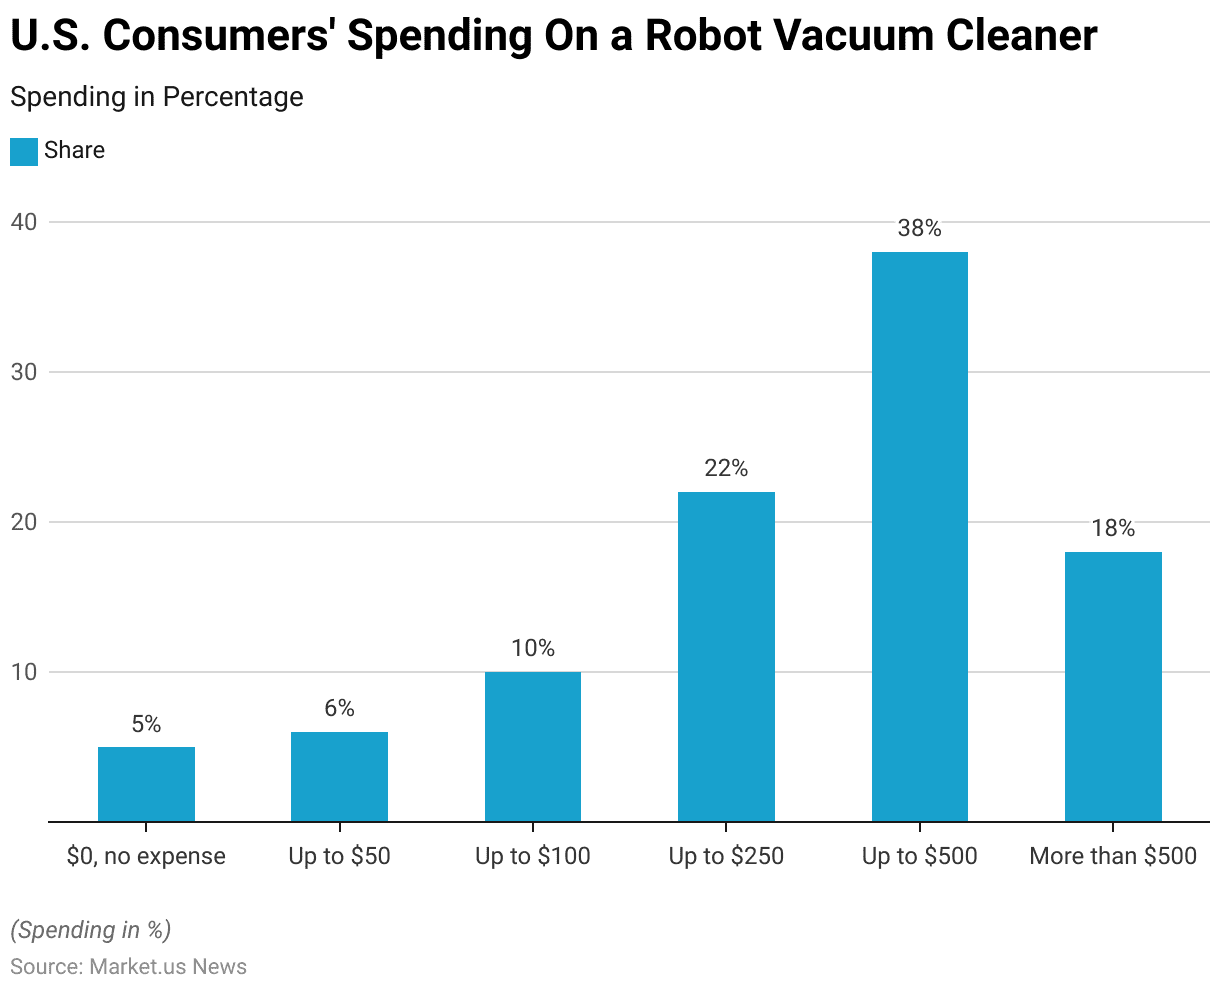
U.S. Consumers’ Spending On Robot Vacuum Cleaners
- In 2017, U.S. consumers reported varied spending habits on intelligent robot vacuum cleaners.
- The majority, 38%, spent up to $500 on their purchase, indicating a strong preference for mid-range models.
- Meanwhile, 22% of respondents spent up to $250, and 18% invested more than $500, highlighting a significant market segment willing to pay a premium for advanced features.
- A smaller portion, 10%, limited their spending to $100, and 6% spent up to $50.
- Notably, 5% of respondents reported no expense, possibly due to receiving the product as a gift or through promotions.
- This data illustrates a broad spectrum of consumer spending, with a substantial inclination towards mid-to-high-range robot vacuum models.
(Source: Statista)
Regulations for Vacuum Cleaners
- Regulatory frameworks for vacuum cleaners vary significantly by region, focusing predominantly on energy efficiency, noise levels, and overall environmental impact.
- In the European Union, significant regulations have been implemented under Commission Regulation (EU) No 666/2013, which stipulates that from September 2014, vacuum cleaners must not exceed a power consumption of 1600W. From September 2017, this limit was further reduced to 900W.
- Additionally, these appliances are required to have an energy label ranging from A+++ to G to help consumers identify the most energy-efficient models. The regulation also establishes noise limits and durability tests, ensuring that the vacuum cleaners not only consume less energy but also maintain their performance over time without excessive noise
- This legislation aligns with broader EU goals of reducing electricity consumption and extending product life, thus minimizing environmental impact. Each vacuum cleaner model must undergo conformity assessments to verify compliance with these requirements, using standardized measurement and calculation methods as outlined in the regulation.
- These measures are intended to ensure that reductions in energy consumption during the product’s use phase will offset any potential increases in environmental impact during the production and disposal phases.
- Overall, these stringent requirements help guide manufacturers in producing more sustainable and efficient appliances while providing consumers with better product performance and environmental benchmarks.
(Sources: CURRYS, EUR-LEX)
Recent Developments
Acquisitions and Mergers:
- Ingersoll Rand’s Acquisition of Fruitland Manufacturing: In June 2024, Ingersoll Rand acquired Fruitland Manufacturing, a Canadian company specializing in mobile and truck-mounted vacuum pumps, for an undisclosed amount. This acquisition aims to expand Ingersoll Rand’s capabilities in low-flow applications within the mobile vacuum market.
New Product Launches:
- Dyson’s Launch of the WashG1 Electric Mop: In May 2024, Dyson introduced the WashG1, a £600 electric mop designed for homes with wooden or tiled floors. The device features a 1-litre water tank and two counter-rotating filament rollers, capable of cleaning up to 290 square meters in one go.
- SharkNinja’s New Product Releases: In 2023, SharkNinja launched 25 new products, including a highly successful slushy maker and a new espresso machine. The company plans to release 25 more products in 2024, focusing on innovation and diversification across major product categories.
Conclusion
Vacuum Cleaner Statistics – The vacuum cleaner market has grown significantly, driven by technological advancements and evolving consumer preferences.
Demand has shifted from traditional models to innovative options like robotic and cordless vacuum cleaners, with key purchase factors including suction power, price, and modern features.
While developed markets lean toward premium models, emerging markets focus on budget-friendly options.
The increasing emphasis on hygiene and convenience has boosted demand for robotic models, with brands like iRobot and Ecovacs leading the way.
Despite market fluctuations, the industry’s outlook remains positive, supported by innovations in sustainability and smart technology.
FAQs
There are several types, including upright, canister, stick, handheld, robotic, and wet/dry vacuum cleaners. Each serves different cleaning needs, from deep carpet cleaning to lightweight portability for quick tasks.
Bagged vacuums collect dirt in disposable bags, which are hygienic and reduce dust exposure. Bagless models use bins or cups, which can save money on replacements but may release dust when emptied.
Robotic vacuums are great for maintaining cleanliness between deeper cleanings. They are particularly useful in homes with hard floors or low-pile carpets and can be programmed for automatic operation.
With proper maintenance, vacuum cleaners can last anywhere from 5 to 10 years, depending on the brand and model.
Cordless vacuums offer greater flexibility and are improving in power, but corded models still generally provide stronger, more consistent suction for deep cleaning.


