Table of Contents
- Introduction
- Editor’s Choice
- Global Vending Machine Market Overview
- Types of Vending Machines
- Vending Machines in Operation – By Location
- Vending Machines Operators – By Company Size
- Type of Goods Sold Through Vending Machines
- Price Range of Various Goods Sold Through Vending Machines
- Number of Vending Machine Operators – By Employment Size
- Vending Machines Sales Statistics
- Unit Economics of Vending Machine Items
- Consumer Preferences for Vending Machines
- Cost and Investments in Vending Machines
Introduction
According to Vending Machine Statistics, Vending machines, ubiquitous in modern retail, come in various types, from food and beverage dispensers to ticket and service providers.
Users select items via buttons or touchscreens and pay with coins, bills, cards, or mobile options. The machines then dispense the chosen product, aided by inventory management systems that track stock levels for timely restocking.
Offering convenience, cost-efficiency, and accessibility, vending machines represent a passive revenue stream for businesses, with data insights informing consumer preferences.
Trends include healthier options, cashless transactions, smart technology integration, customization features, and a focus on sustainability.
As they continue to evolve, vending machines remain vital in meeting consumer needs while adapting to technological advancements and sustainability initiatives.
Editor’s Choice
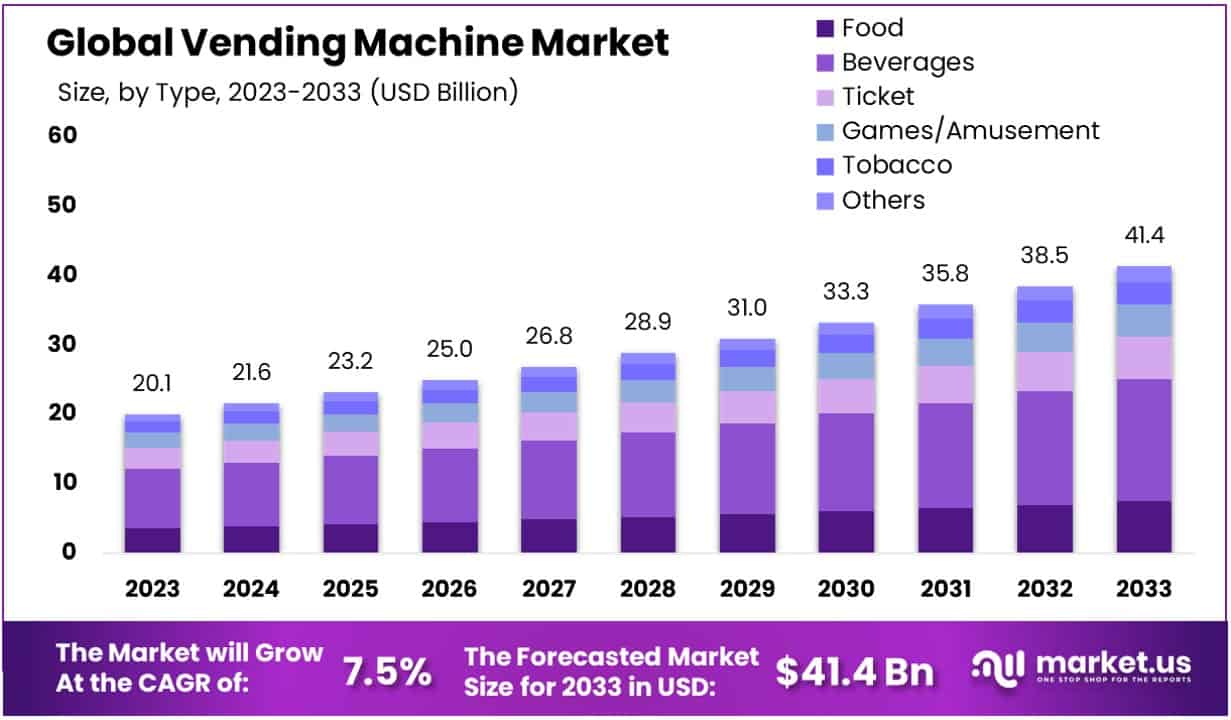
- The global vending machine market revenue is anticipated to reach USD 41.4 billion by 2033.
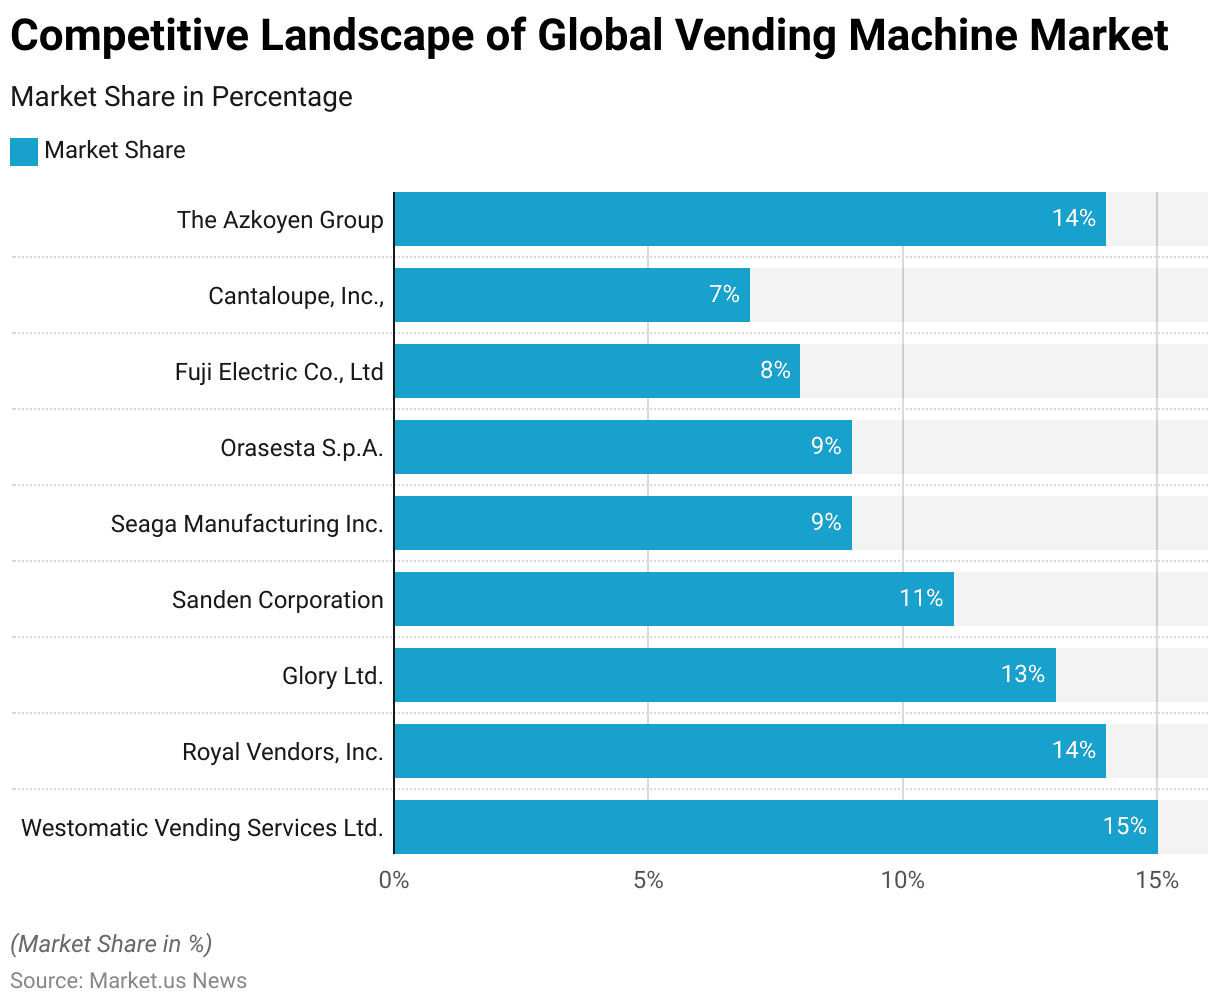
- Westomatic Vending Services Ltd. leads the market with a 15% share.
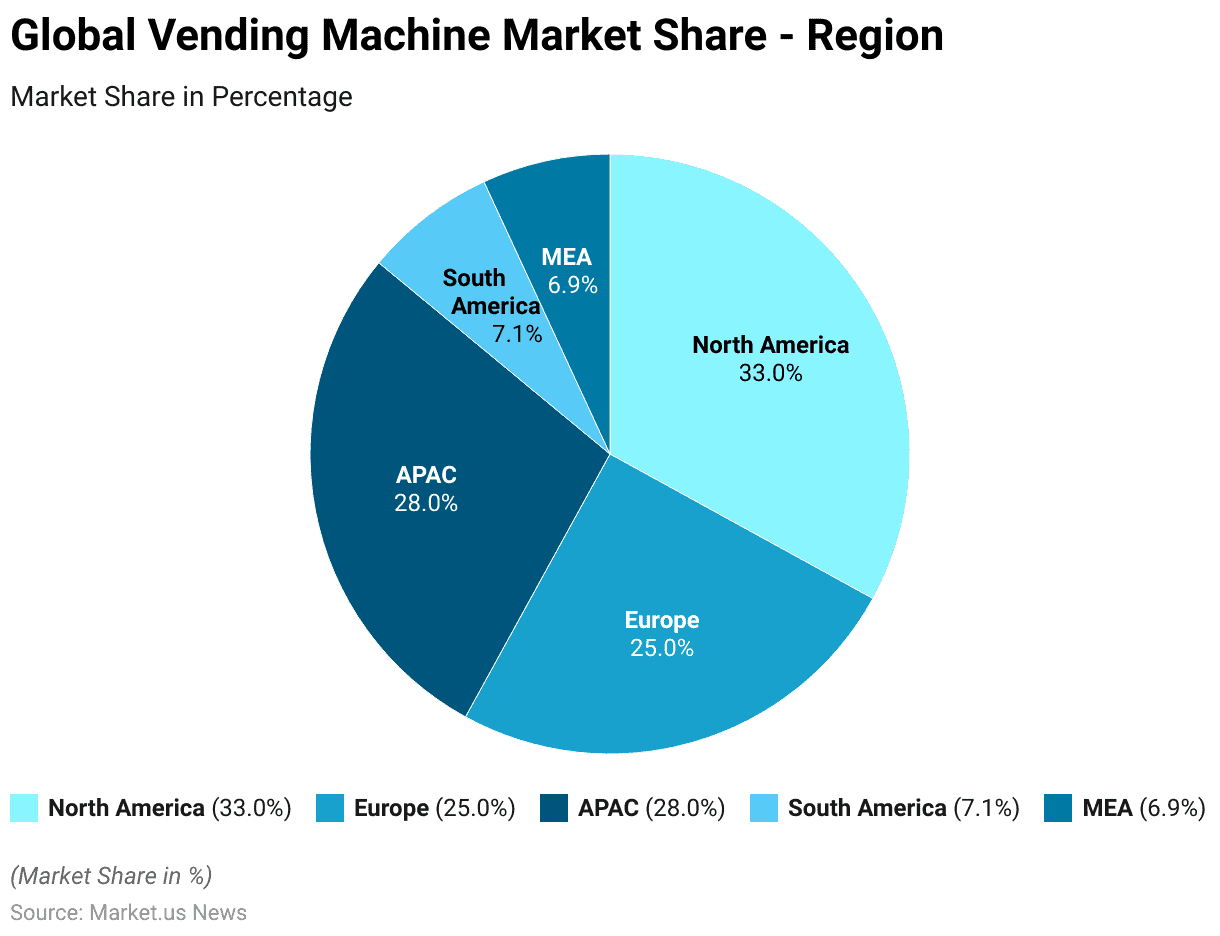
- The global vending machine market is segmented by region. With North America holding the largest market share at 33.0%.
- In 2019, the distribution of vending machines across various locations within the industry showed a diverse allocation. Manufacturing sites had the highest concentration of vending machines, accounting for 30.20% of the total.
- In 2019, the vending machine industry was predominantly composed of small operators. With 67.10% of all operators generating annual revenues of less than USD 1 million.
- In 2019, the distribution of vending machines across various locations within the industry showed a diverse allocation. Manufacturing sites had the highest concentration of vending machines, accounting for 30.20% of the total.
- The retail sales revenue of vending machines in China is expected to reach 73.93 billion yuan by 2027.
Global Vending Machine Market Overview
Global Vending Machine Market Size
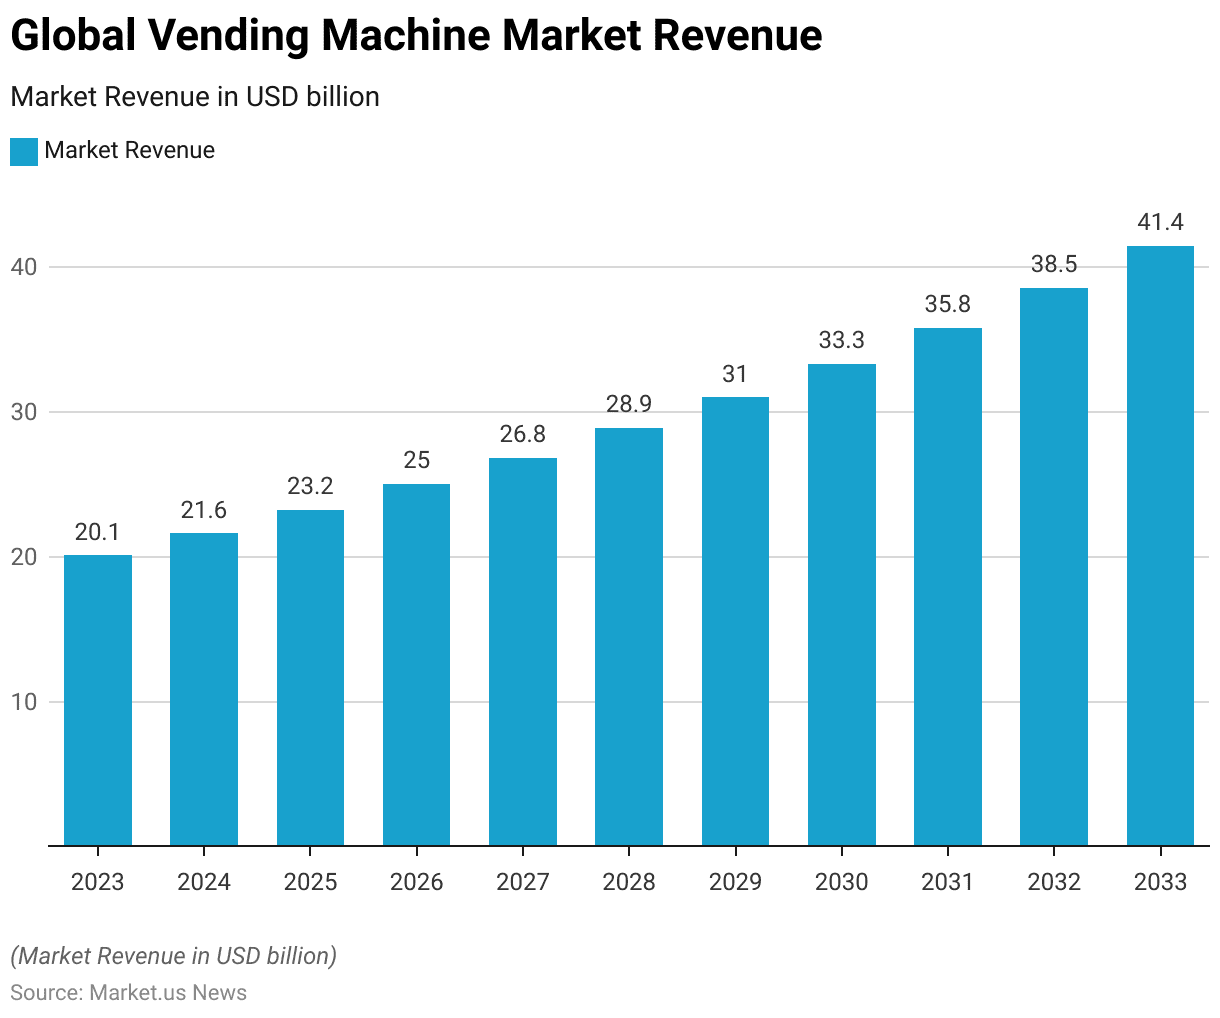
- The global vending machine market has demonstrated consistent growth over the past decade at a CAGR of 7.5%.
- In 2023, the market revenue was recorded at USD 20.1 billion.
- The market is expected to reach USD 35.8 billion in 2031 and USD 38.5 billion in 2032. Culminating in an estimated revenue of USD 41.4 billion by 2033.
Competitive Landscape of the Global Vending Machine Market
- The global vending machine market is dominated by several key players. Each holds a significant market share.
- Westomatic Vending Services Ltd. leads the market with a 15% share, followed closely by The Azkoyen Group and Royal Vendors, Inc., each capturing 14% of the market.
- Glory Ltd. holds a 13% share, while Sanden Corporation accounts for 11%.
- Seaga Manufacturing Inc. and Orasesta S.p.A. both hold 9% of the market.
- Fuji Electric Co., Ltd. commands an 8% share, and Cantaloupe, Inc. holds a 7% share.
Regional Analysis of the Global Vending Machine Market
- The global vending machine market is segmented by region. With North America holding the largest market share at 33.0%.
- The Asia-Pacific (APAC) region follows closely, accounting for 28.0% of the market.
- Europe also has a significant presence, with a 25.0% share.
- South America and the Middle East & Africa (MEA) regions represent smaller portions of the market, with shares of 7.1% and 6.9%, respectively.
Types of Vending Machines
- Vending machines come in various types, each designed to cater to specific consumer needs and environments.
- Advanced smart vending machines integrate features like touchscreens, digital payments, and mobile app connectivity, enhancing user convenience and operational efficiency.
- These machines typically measure between 68 to 72 inches in height, 29 to 41 inches in width, and 30 to 36 inches in depth.
- Additionally, specialized machines, such as hot food vending machines, provide fresh meals like hot dogs and pizzas, with dimensions around 75 inches in height, 55 inches in width, and 38 inches in depth.
Vending Machines in Operation – By Location
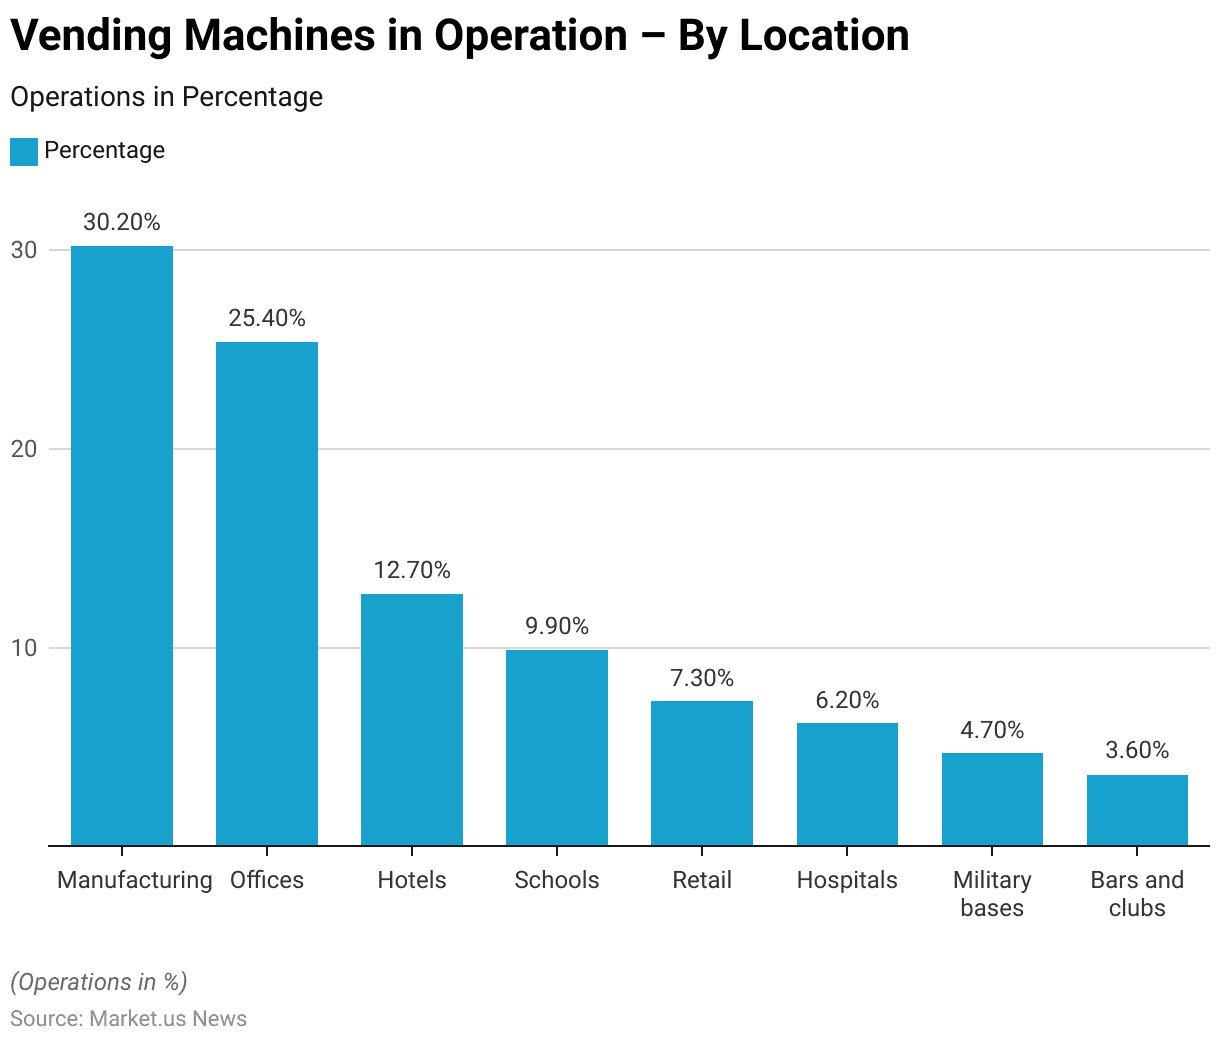
- In 2019, the distribution of vending machines across various locations within the industry showed a diverse allocation.
- Manufacturing sites had the highest concentration of vending machines, accounting for 30.20% of the total.
- Offices followed with 25.40%, reflecting a significant presence in workplace environments.
- Hotels accounted for 12.70% of vending machine placements, while schools held 9.90%.
- Retail locations had a 7.30% share, and hospitals accounted for 6.20%.
- Military bases, bars, and clubs had smaller shares, with 4.70% and 3.60%, respectively.
Vending Machines Operators – By Company Size
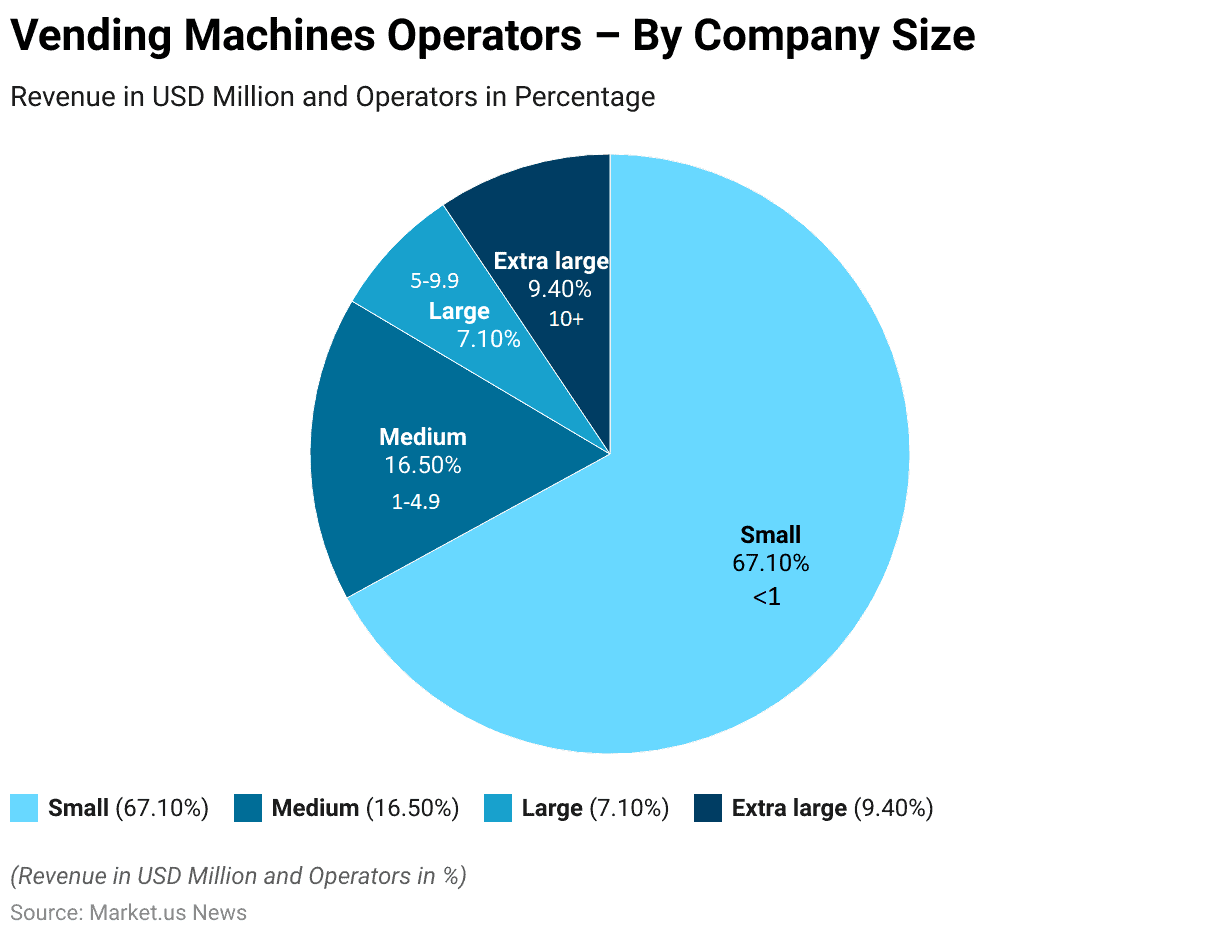
- In 2019, the vending machine industry was predominantly composed of small operators. With 67.10% of all operators generating annual revenues of less than USD 1 million.
- Medium-sized companies, with annual revenues ranging from USD 1 million to USD 4.9 million, accounted for 16.50% of the market.
- Large operators, earning between USD 5 million and USD 9.9 million annually, represented 7.10% of the industry.
- Extra-large companies, with annual revenues exceeding USD 10 million, made up 9.40% of all vending machine operators.
Type of Goods Sold Through Vending Machines
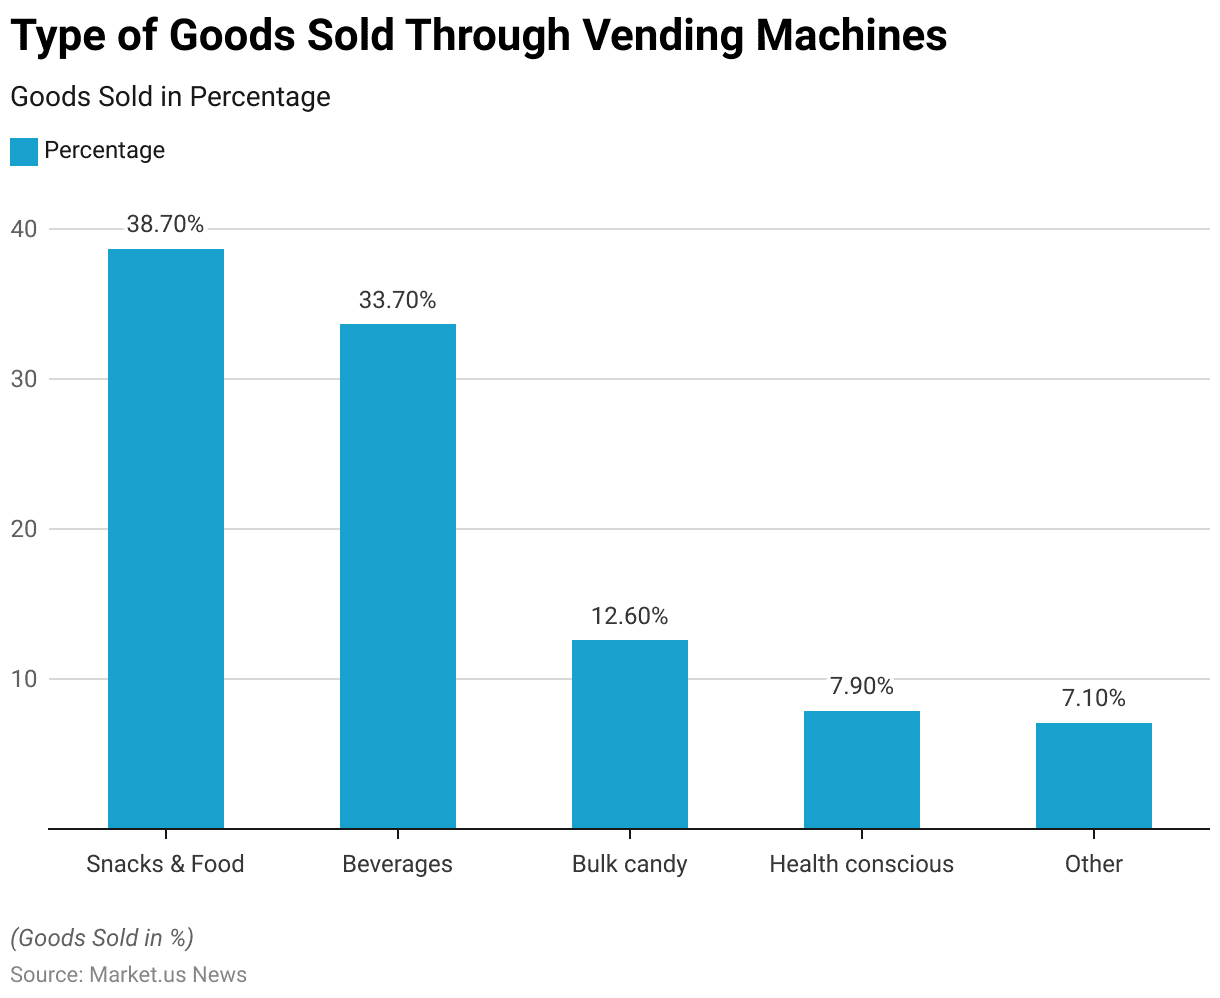
- In 2019, the vending machine industry showcased a diverse range of goods sold through these automated units.
- Snacks and food items dominated the market, accounting for 38.70% of the goods sold. Beverages followed closely, making up 33.70% of the market.
- Bulk candy represented 12.60%, catering to consumers seeking quick and sweet treats.
- Health-conscious products, such as nutritious snacks and beverages, constituted 7.90% of the goods sold, reflecting a growing trend towards healthier eating habits.
- The remaining 7.10% included a variety of other items, encompassing miscellaneous products tailored to specific consumer needs and preferences.
Price Range of Various Goods Sold Through Vending Machines
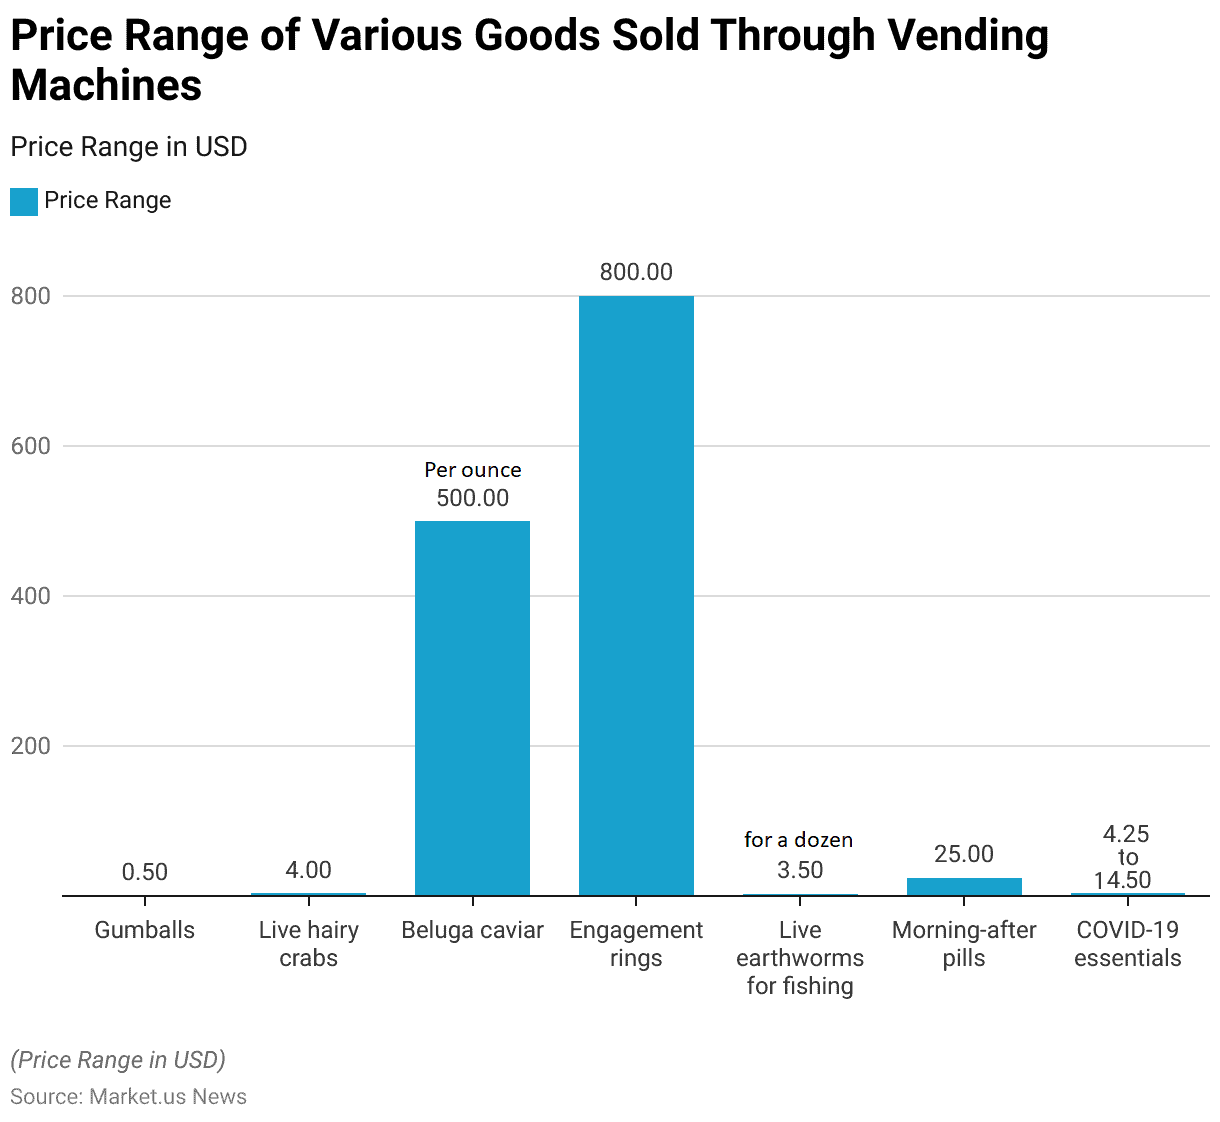
- The vending machine industry is remarkably diverse, offering a wide range of products that cater to various consumer needs and preferences. Items sold through vending machines range from inexpensive gumballs priced at $0.50 to luxury goods such as Beluga caviar, which costs $500 per ounce.
- Other unique items include live hairy crabs available for approximately $4 each and engagement rings priced at $800.
- Practical items like live earthworms for fishing can be found for $3.50 per dozen. While morning-after pills are available for $25.
- Additionally, vending machines have adapted to current health needs by selling COVID-19 essentials like hand sanitizers and masks, with prices ranging from $4.25 to $14.50.
Number of Vending Machine Operators – By Employment Size
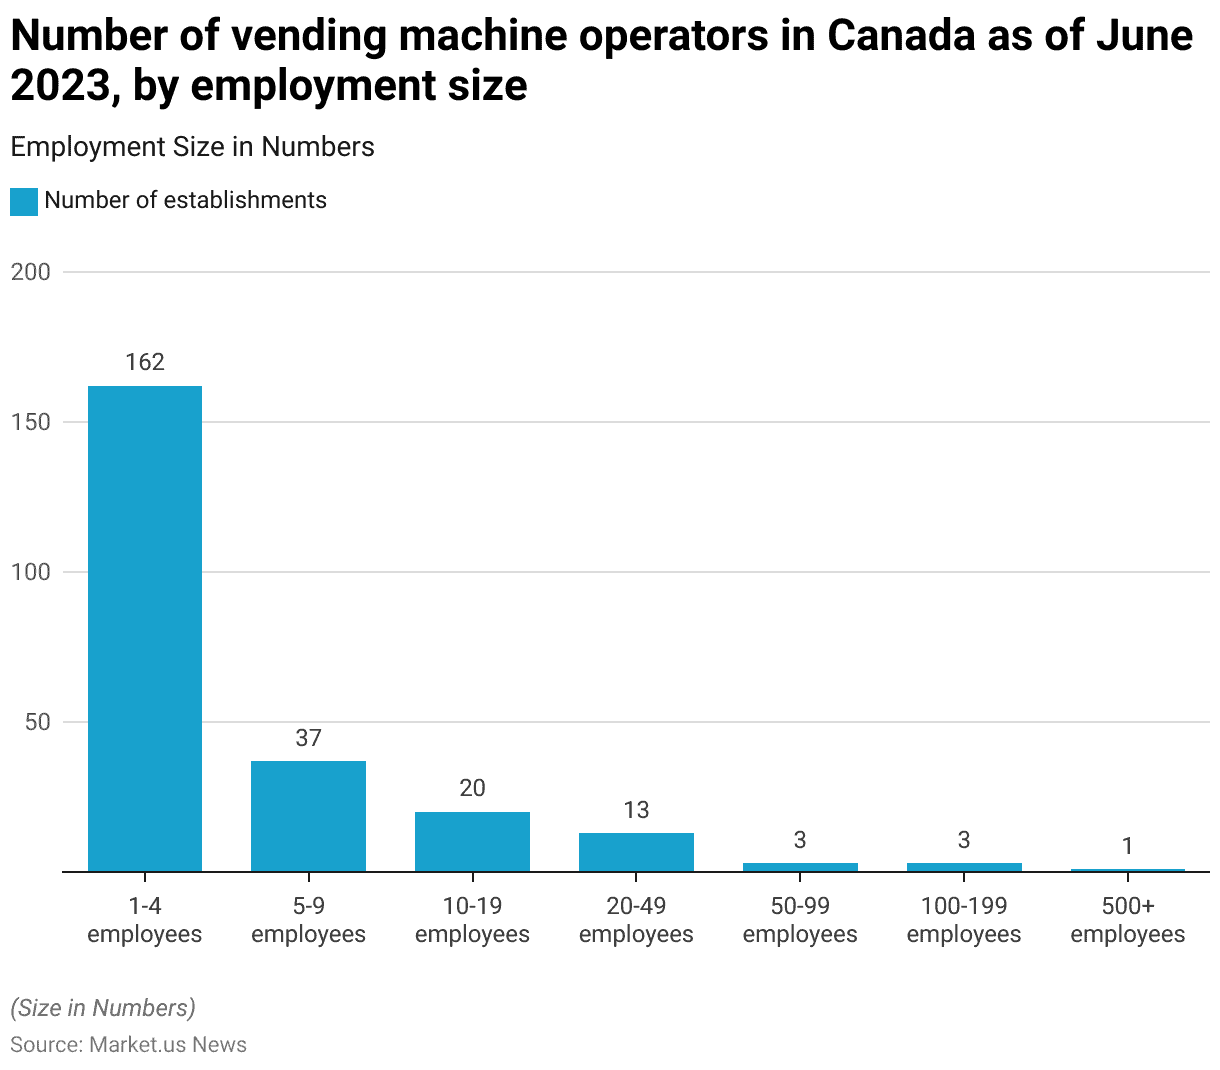
- As of June 2023, the vending machine industry in Canada was characterized by a diverse range of operators based on employment size.
- There were 162 establishments with 1-4 employees, making up the majority of the industry.
- Medium-sized operations with 5-9 employees accounted for 37 establishments, while those with 10-19 employees numbered 20.
- Slightly larger companies with 20-49 employees comprised 13 establishments.
- There were three establishments, each in the categories of 50-99 employees and 100-199 employees.
- Additionally, there was one large-scale operation with over 500 employees.
Vending Machines Sales Statistics
Vending Machines: Sales Volume of Vended Products
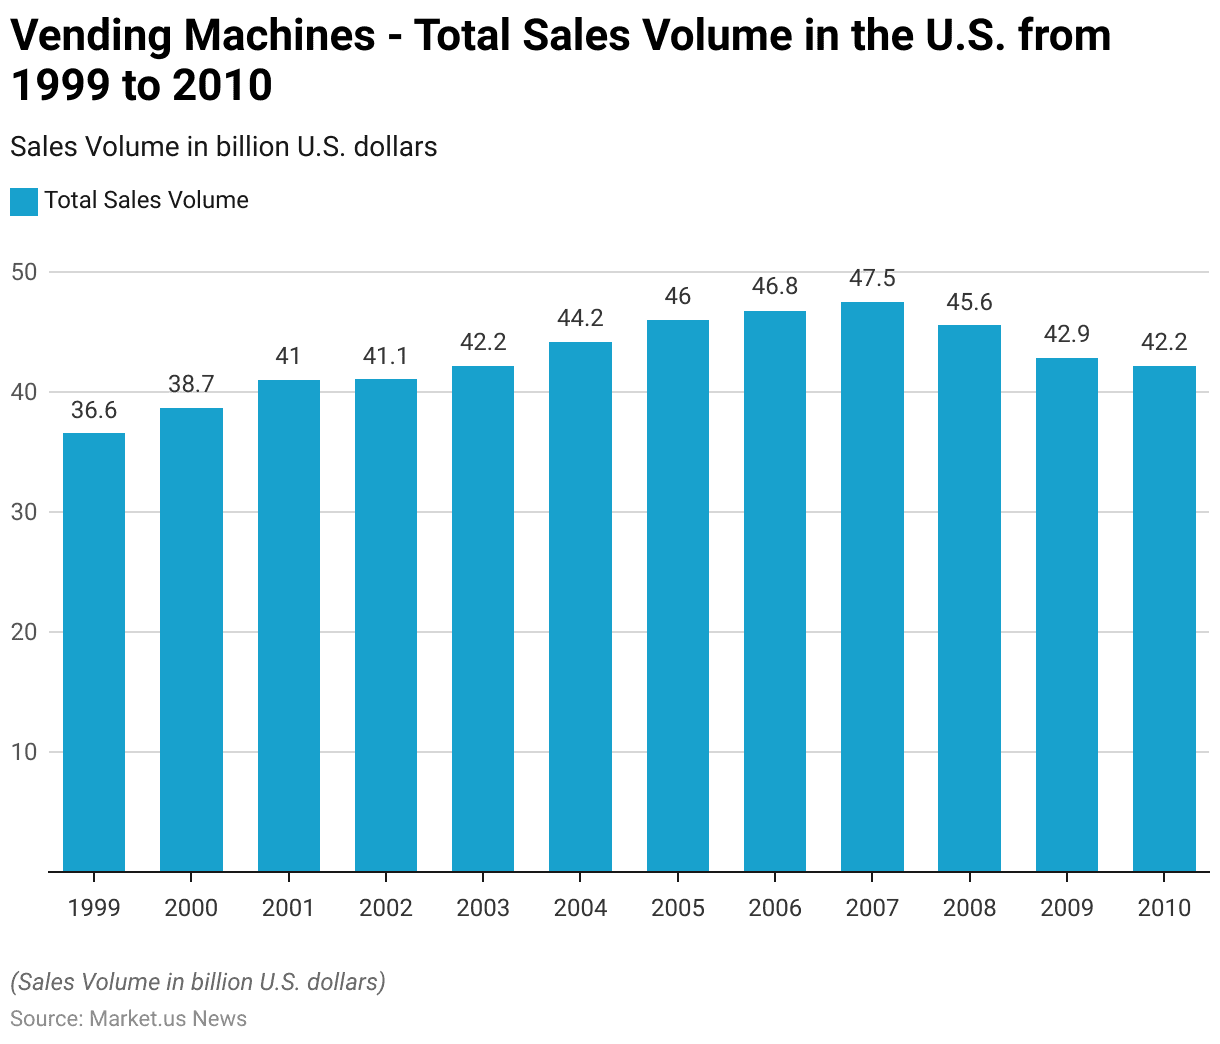
- The total sales volume of vending machines in the U.S. exhibited a general upward trend from 1999 to 2007, followed by a decline through 2010.
- In 1999, the sales volume was USD 36.6 billion, which increased to USD 38.7 billion in 2000 and reached USD 41 billion in 2001.
- The upward trajectory continued, with sales hitting USD 41.1 billion in 2002, USD 42.2 billion in 2003, and USD 44.2 billion in 2004.
- The growth peaked in 2007 with a total sales volume of USD 47.5 billion.
- However, this was followed by a decline. With sales dropping to USD 45.6 billion in 2008. USD 42.9 billion in 2009, and USD 42.2 billion in 2010.
Retail Sales Revenue of Vending Machines
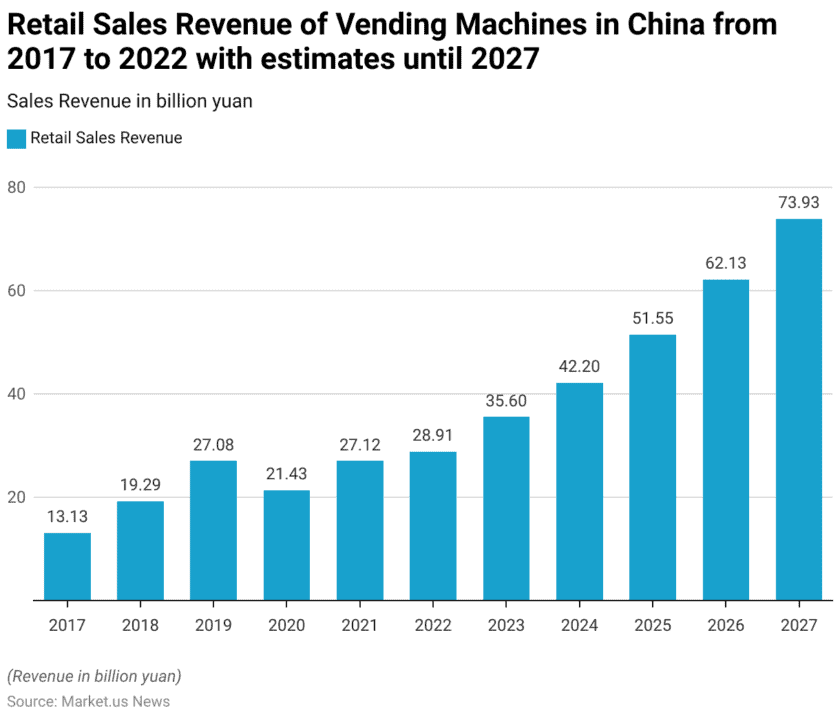
- The retail sales revenue of vending machines in China has shown significant growth from 2017 to 2022, with further projections indicating continued expansion until 2027.
- In 2017, the market generated 13.13 billion yuan in sales, which increased to 19.29 billion yuan in 2018.
- The upward trends are expected to continue. With estimates of 62.13 billion yuan in 2026 and 73.93 billion yuan by 2027.
Unit Economics of Vending Machine Items
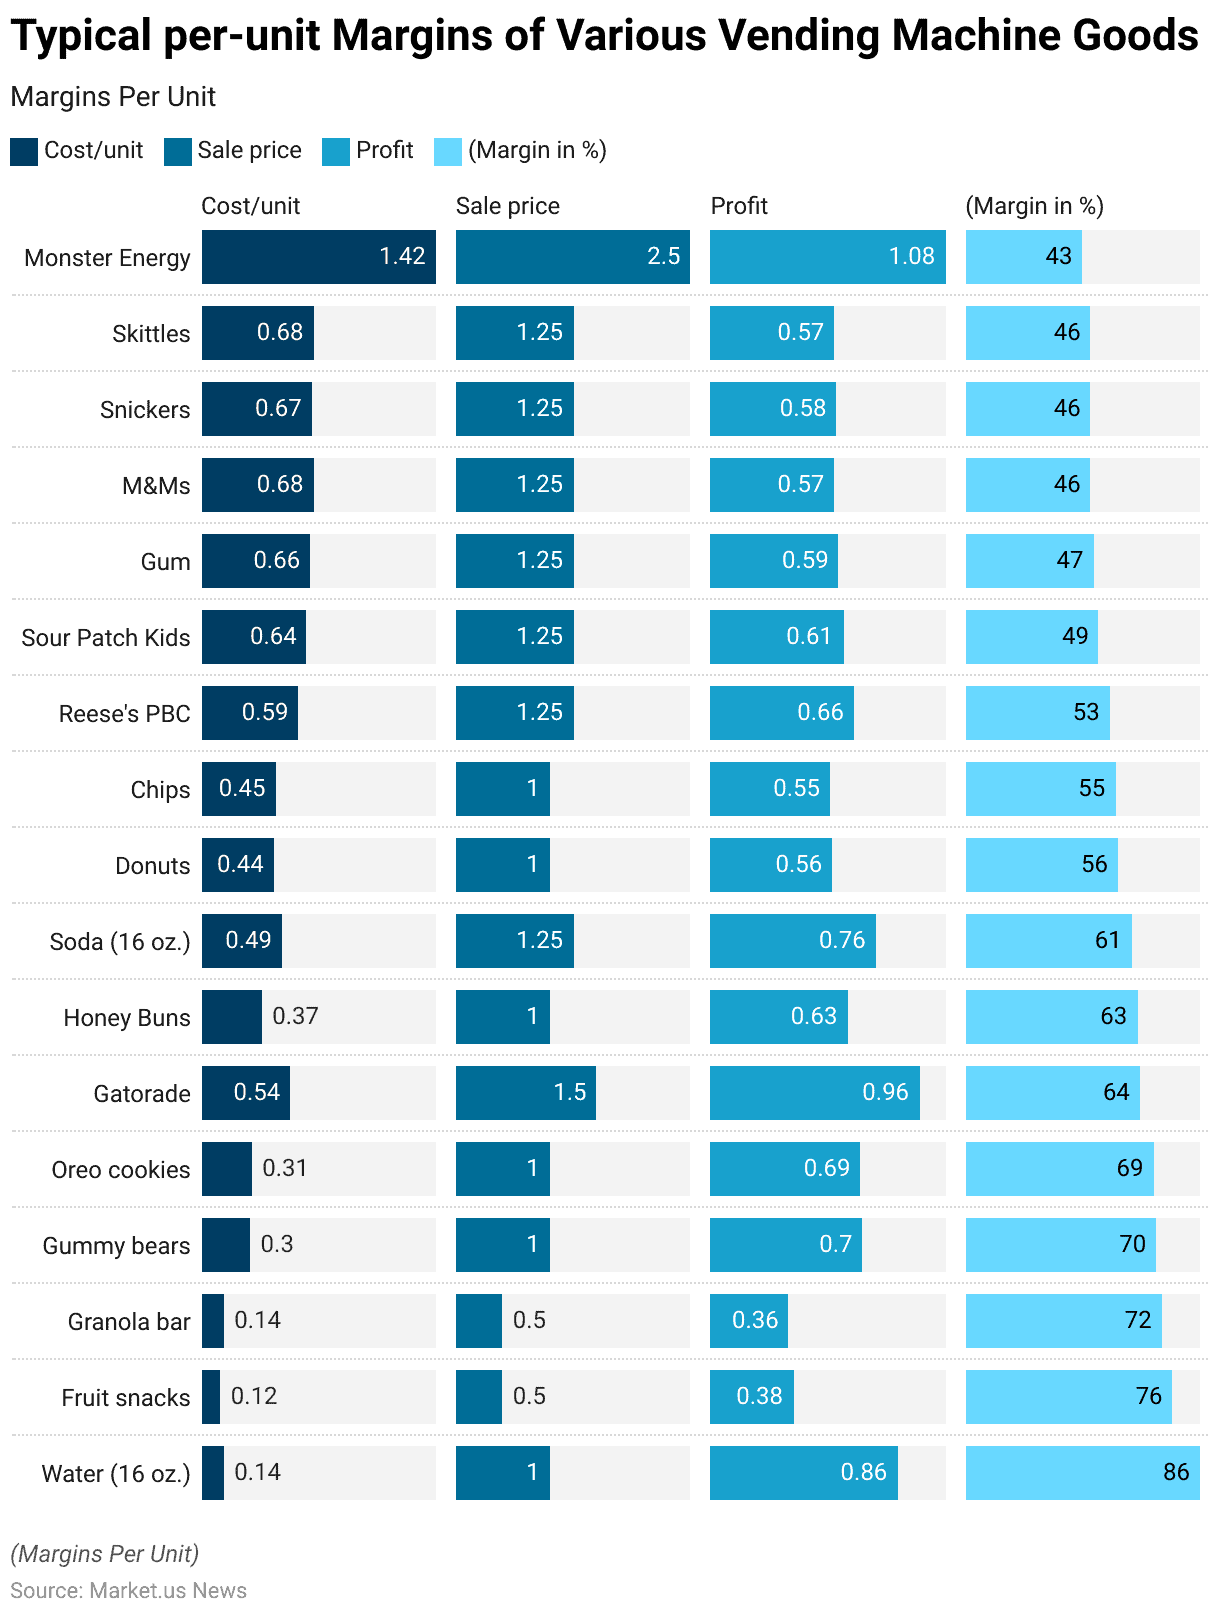
- The typical per-unit margins for various vending machine goods show significant profitability across different categories.
- For beverages, a 16 oz. bottle of water costs $0.14 and sells for $1.00, resulting in a profit of $0.86 and an 86% margin.
- Fruit snacks, costing $0.12 and selling for $0.50, yield a $0.38 profit with a 76% margin.
- Granola bars cost $0.14 and sell for $0.50, providing a $0.36 profit and a 72% margin.
- Gummy bears, with a cost of $0.30 and a sale price of $1.00, offer a $0.70 profit and a 70% margin.
- Similarly, Oreo cookies cost $0.31, sell for $1.00, and have a profit margin of 69%.
- Gatorade, priced at $0.54 per unit and sold for $1.50, has a profit of $0.96 and a 64% margin.
- Honey Buns, costing $0.37 and selling for $1.00, yield a 63% margin with a $0.63 profit.
- Soda, costing $0.49 and selling for $1.25, results in a $0.76 profit and a 61% margin.
Consumer Preferences for Vending Machines
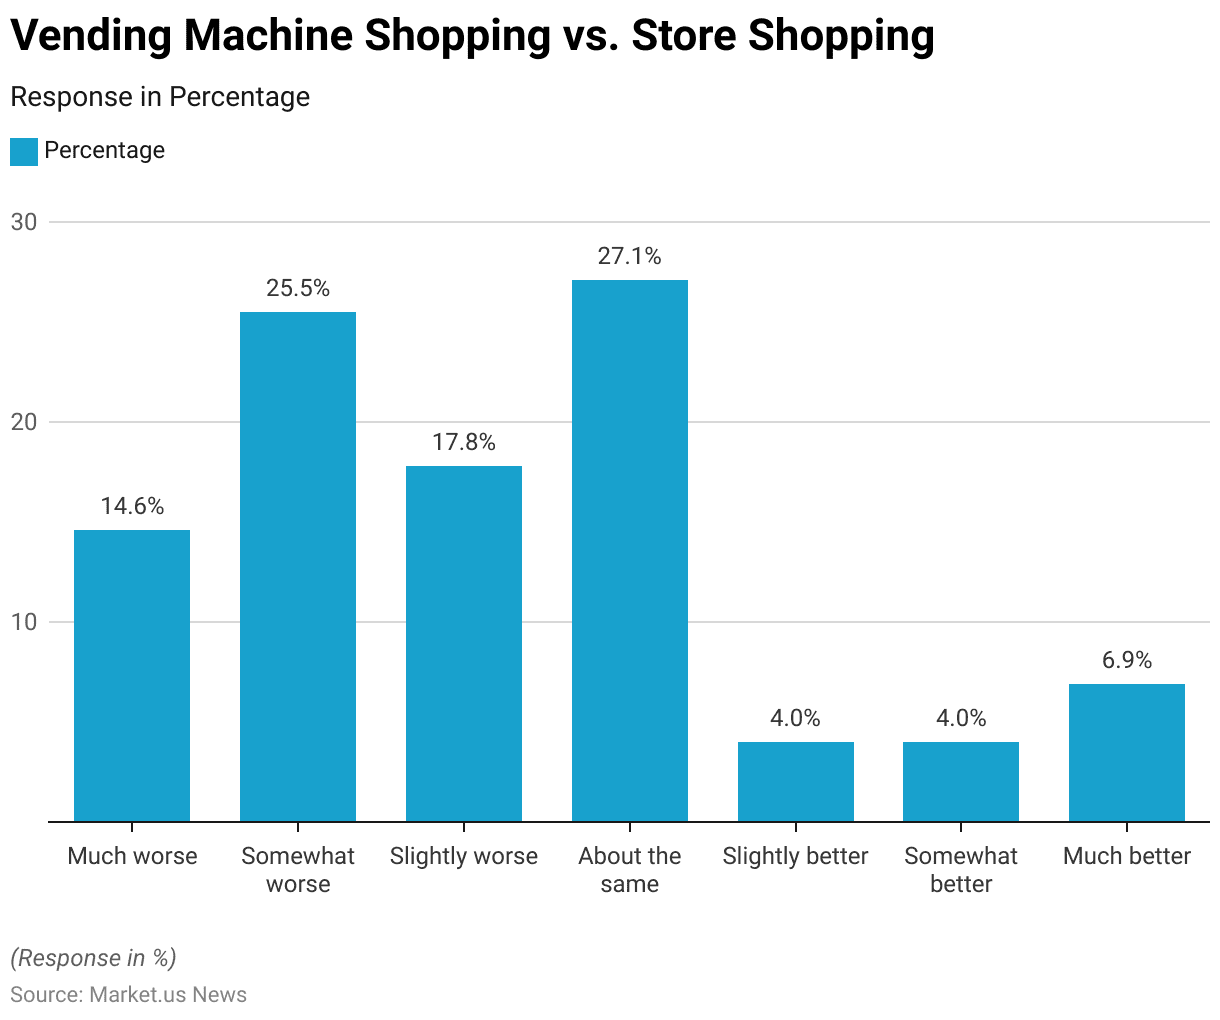
Vending Machine Shopping vs. Store Shopping
- When comparing the shopping experience of using vending machines to shopping at regular retail stores, respondents shared varied sentiments.
- A significant portion, 14.6%, felt that vending machine shopping was much worse than traditional store shopping, while 25.5% considered it somewhat worse.
- Additionally, 17.8% of respondents found vending machine shopping slightly worse. Conversely, 27.1% of respondents perceived no difference, stating that the experience was about the same.
- Positive perceptions were less common, with 4.0% finding vending machine shopping slightly better and another 4.0% considering it somewhat better.
- A smaller segment, 6.9%, felt that shopping through vending machines was much better compared to retail stores.
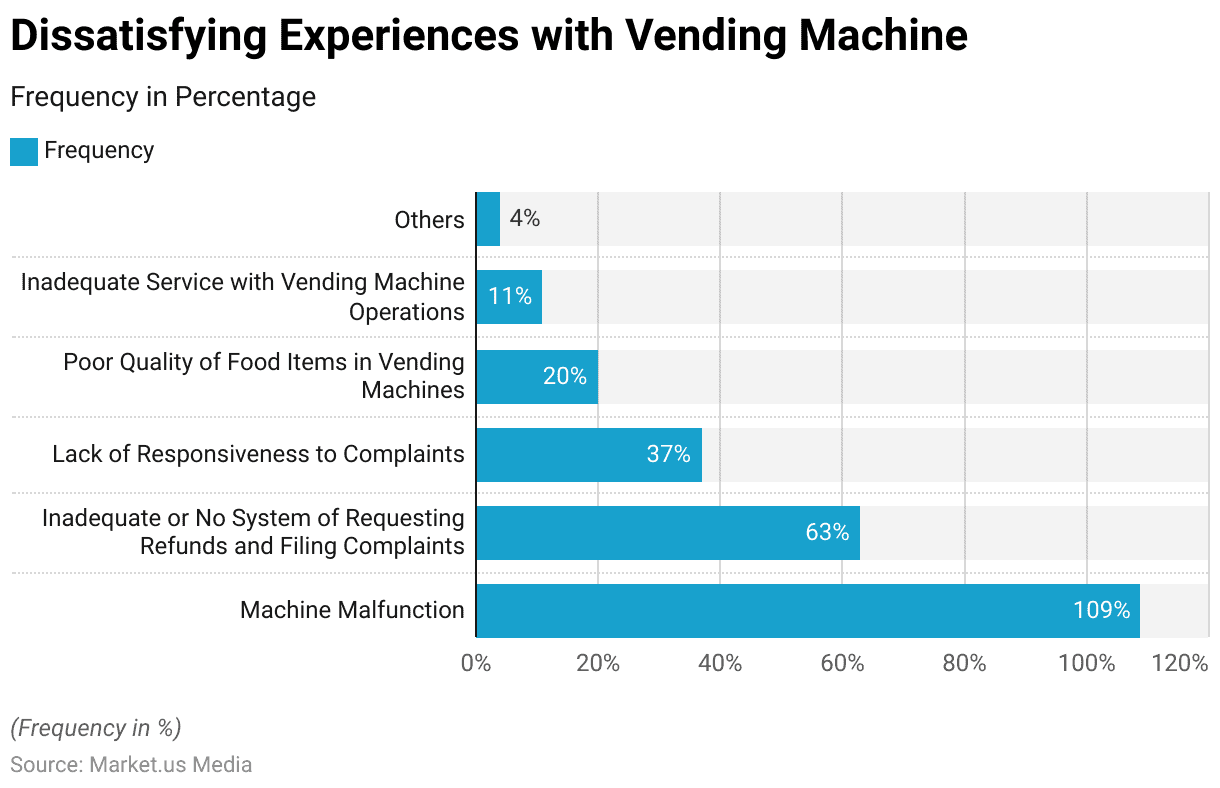
Dissatisfying Experiences with Vending Machine
- Dissatisfying experiences with vending machines have been reported across several categories. With Machines malfunctions are the most frequent issue, occurring 109 times.
- Another significant problem is the inadequate or non-existent system for requesting refunds and filing complaints, which was cited 63 times.
- Lack of responsiveness to complaints was noted 37 times. Indicating a gap in customer service.
- The poor quality of food items in vending machines was mentioned 20 times. Reflecting concerns about product standards.
- Additionally, inadequate service related to vending machine operations was reported 11 times. And other miscellaneous issues were mentioned four times.
Cost and Investments in Vending Machines
- Investing in vending machines has become increasingly popular, offering a range of opportunities and varying levels of initial investment.
- The cost to purchase a new vending machine typically ranges from $3,000 to $5,000. Used machines can be acquired for about half that price.
- For instance, a basic snack machine might cost between $3,000 and $4,000 new or $1,500 to $2,500 used. Combo machines, which offer both snacks and beverages. Priced around $5,000 to $6,000 new and $2,500 to $3,500 used.
- Investments in vending machines have been significant. Companies like Crane Merchandising Systems and eVending have been at the forefront, incorporating advanced technology and diverse product offerings to enhance customer experience and operational efficiency.
Discuss your needs with our analyst
Please share your requirements with more details so our analyst can check if they can solve your problem(s)


